dental anthropology anthropology volume 23, number 1, 2010 dental anthropology is the official...
TRANSCRIPT

DentalAnthropology
A Publication of the Dental Anthropology Association
Volume 23, Number 1, 2010 ISSN 1096-9411

Dental AnthropologyVolume 23, Number 1, 2010
Dental Anthropology is the Official Publication of the Dental Anthropology Association.
Editor: Edward F. Harris
Address for Manuscripts
Dr. Edward F. HarrisCollege of Dentistry, University of Tennessee
870 Union Avenue, Memphis, TN 38163 U.S.A.E-mail address: [email protected]
Address for Book Reviews
Dr. Greg C. NelsonDepartment of Anthropology, University of Oregon
Condon Hall, Eugene, Oregon 97403 U.S.A.E-mail address: [email protected]
Published at
Craniofacial Biology Laboratory, Department of OrthodonticsCollege of Dentistry, The Health Science Center
University of Tennessee, Memphis, TN 38163 U.S.A.The University of Tennessee is an EEO/AA/Title IX/Section 504/ADA employer
Editorial Board
Officers of the Dental Anthropology Association
G. Richard Scott (University of Nevada, Reno) President (2010-2012)Loren R. Lease (Youngstown State University, Ohio) Secretary-Treasurer (2010-2012)
Brian E. Hemphill (California State University, Bakersfield) Past-President (2008-2010)
Kurt W. Alt (2010-2014) Scott E. Burnett (2010-2014) Andrea Cucina (2010-2014) Brian E. Hemphill (2010-2014)
Jules A. Kieser (2010-2014) Helen M. Liversidge (2010-2014) Yuji Mizoguchi (2010-2014) Cathy M. Willermet (2010-2014)

1
Teeth exhibit the least cellular turnover of the body’s structure, and they are readily accessible for examination. Tooth size standards based on odontometric investigations can be used in age and sex determination (Black, 1902). The variations in tooth size are influenced by genetic and environmental factors. Whenever it is possible to predict the sex, identification is simplified because then only missing persons of one sex need to be considered. In this sense identification of sex takes precedence over age (Camps, 1976). Various features like tooth morphology and crown size are characteristic for males and females (Dayal et al., 1998).
Among Sikhs, sub-castes have been grouped into several categories like Jats, Aroras, Khatris, Ramgarhias, Majhabis, Rajputs and Namdharis. Historically, Jat Sikhs are landowners, farmers, and warriors. Traditionally, the Jat Sikhs have been endogamous at caste level and exogamous at the (gotra) sub-caste level (Sidhu, 2003). These are divided into numerous clans like Aulak, Bains, Bajwa, Bal, Bath, Bhullar, Chahal, Dhaliwal, Dhillon, Dosanjh, Gill, Grewal, Hundal, Kang, Randhawa, Sahota, Sidhu and Virk. There are 31 million Jats in South Asia. The majority of the 11 million Jat Sikhs in India live in Punjab, a state in northern India. The Jat Sikhs are believed to be the merged descendants of the original Indo-Aryans and a later addition of Indo-Scythian tribes (Dhillon, 1994).
The present study establishes the morphometric characterizations of the first maxillary molar in Indian Jat Sikhs. The study has been conducted with a special emphasis on the impact of sex factor on the morphometry of the first maxillary molar.
Crowns of maxillary molars have four main cusps,
namely the paracone, protocone, metacone and hypocone. Each cusp has an independent growth pattern (Kraus and Jordan, 1965) and a different evolutionary background (Osborn, 1907). The paracone is the first to appear both ontogenetically and phylogenetically and is regarded as the successor of the single cone of the reptilian haplodont dentition (Patterson, 1956). The hypocone tends to develop latest in terms of ontogeny and phylogeny, and it differentiates from the lingual cingulum (Kraus and Jordan, 1965). Odontometric characteristics of each molar crown are thought to represent a cumulative effect of individual cusp dimensions (Kanazawa et al., 1985), so analysis based on measurement of cusp dimensions promises to be more meaningful biologically than conventional measurements of whole crowns.
Teeth that develop later in ontogeny are expected to display greater sexual dimorphism due to the increasing differences in sex hormone production between males and females (Gingerich, 1974). In mandibular molars, sexual dimorphism values were shown to be greater in talonid dimensions than in the trigonid, suggesting that sexual dimorphism is larger in the later developed crown units (Yamada, 1981). The present study focuses on the sexual dimorphism of cusp diameters in the first maxillary molar and tests the hypothesis that the later developed distal cusps should display greater dimorphism than earlier developing mesial cusps.
Crown and Cusp Dimensions of the Maxillary First Molar: A Study of Sexual Dimorphism in Indian Jat SikhsGaurav Agnihotri1 and Vimal Sikri2
1Department of Anatomy, Government Medical College, Amritsar, Punjab, India, and 2Government Dental College, Amritsar, Punjab, India
ABSTRACT The human first maxillary molar provides clues about evolution and is functionally important. Crowns of maxillary molars have four main cusps, each having an independent growth pattern and different evolutionary background. The study aims to quantify the morphometric criterion for the maxillary first molar giving a special emphasis to sexual dimorphism. Measurements of the first maxillary molar were taken on 100 casts of Jat Sikh students (50 males, 50 females) studying in the local medical college in the age group of 17-21 years. The Jat
Sikh community of Punjab is endogamous at the caste level. Unpaired t-tests were used to compare the samples for males and females. There is statistically significant sexual dimorphism (P < 0.01) for the maxillary first molar’s crown and cusp components in the Jat Sikhs. The sequence of dimorphism in cusp dimensions corresponds to the order of formation of the cusps. The percentage sexual dimorphism for the hypocone is high (right 7.2%, left 7.4%). Dental Anthropology 2010;21(1):1-6.
Correspondence to: Gaurav Agnihotri, Lecturer, Government Medical College, Amritsar, Punjab, India.E-mail: [email protected].

2
MATERIALS AND METHODS
Selection Criteria
One hundred subjects (50 males, 50 females) in the age interval of 17-21 years were selected for the study because attrition is considered to be minimal in this age group. The study was conducted on the students enrolled in the Government Medical College, Patiala, India, and the Government Medical College, Amritsar, India. Consent of the subjects was obtained, and the study casts were made with the help of resident doctors, senior residents, and senior technicians at the local Government Dental College.
Only those Jat Sikh students were selected whose upper and lower arches fulfilled the following inclusion criteria.• Healthy state of gingiva and peridontium,
• caries free teeth,
• normal overjet and overbite,
• absence of spacing in the anterior teeth,
• normal molar and canine relationship, and
• clearly distinguishable central pit of first maxillary molar.
Odontometry
Measurements were taken with a vernier caliper with a precision of 0.02 mm. The following parameters were measured and computed: (A) the mesiodistal and buccolingual crown diameters and cusp diameters (Fig. 1); (B) the mesiodistal (Fig. 2) and buccolingual (Fig. 3) crown diameters and cusp diameters (Fig. 4). Each cusp diameter is defined as the diagonal distance from
the central pit to the most prominent convexity on the crown outline corresponding to the relevant cusp, taken perpendicular to the axis of the tooth (Kondo, 1985).
Three additional variables were calculated for each of these dimensions:
The crown area provides a measure of overall crown size:
Crown area = MD x BLwhere MD is the mesiodistal width and BL is the buccolingual length.
The cusp index quantifies cusp size relative to overall crown size:
Cusp index =
Cusp diameter
MD x BL100
And, sexual dimorphism:
Sexual dimorphism =
M - FM
100
where M and F are the mean values in males and females. This formula is applicable for computing sexual dimorphism in mesiodistal width, buccolingual length, and crown area.
Statistical Analysis
Descriptive statistics, including distribution parameters, were calculated using Origin 6.1 software (Origin Lab Corporation, USA, version 6.1052 for Windows). Unpaired t-tests were used to compare the dimensions measured for males and females, and a table of the t distribution was consulted. Attainment of statistical significance was set at alpha = 0.01.
RESULTS
The results have been depicted in Tables 1, 2, 3 and 4. The study quantifies the morphometric criterion for the maxillary first molars in Jat Sikhs. In general the morphometric parameters were found to be quantitatively higher for the left side.
The study establishes the existence of statistically
G. AGNIHOTRI AND V. SIKRI
Parac
one
Protocone
Hyp
ocon
e
Metacone
Mesiodistal
Buccolingual
distal
lingual
Fig. 1. Illustration of the measurement of crown dimensions.
Fig. 2. Illustration showing the measurement of maximum mesiodistal crown dimension.

3
Parameter Side Sex Mean sd t-test P-value1
Mesiodistal Width Right Males 11.33 0.078 -19.88 <0.01 Females 10.88 0.142 Left Males 11.39 0.195 -13.53 <0.01 Females 10.87 0.187 Buccolingual Length Right Males 12.53 0.078 -19.51 <0.01 Females 11.98 0.192 Left Males 12.60 0.192 -18.26 <0.01 Females 11.98 0.142 Crown Area Right Males 142.07 1.859 -24.83 <0.01 Females 130.29 2.789 Left Males 143.54 4.617 -17.33 <0.01 Females 130.25 2.849 Paracone Diameter Right Males 5.82 0.118 -8.73 <0.01 Females 5.63 0.124 Left Males 5.84 0.138 -11.19 <0. 01 Females 5.64 0.089 Protocone Diameter Right Males 5.88 0.119 -13.39 <0.01 Females 5.59 0.108 Left Males 5.90 0.089 -16.83 <0.01 Females 5.60 0.078 Metacone Diameter Right Males 5.68 0.117 -13.48 <0.01 Females 5.39 0.088 Left Males 5.70 0.102 -16.39 <0.01 Females 5.40 0.079 Hypocone Diameter Right Males 6.98 0.122 -21.19 <0.01 Females 6.51 0.104 Left Males 7.00 0.102 -25.80 <0.01 Females 6.52 0.092 Paracone Index Right Males 48.82 1.114 2.46 n.s. Females 49.31 0.902 Left Males 48.74 0.982 3.72 n.s. Females 49.43 0.862 Protocone Index Right Males 49.32 1.102 -1.77 n.s. Females 48.96 0.901 Left Males 49.24 0.983 -0.91 n.s. Females 49.08 0.853 Metacone Index Right Males 47.65 1.089 -2.17 n.s. Females 47.23 0.882 Left Males 47.59 0.982 -1.46 n.s. Females 47.32 0.845 Hypocone Index Right Males 58.45 1.104 -7.12 <0.01 Females 57.14 0.908 Left Males 58.55 1.137 -6.46 <0.01
TABLE 1. Descriptive statistics and tests for sexual dimorphism between males and females
FIRST MOLAR CUSP DIMENSIONS
1Statistical significance was set at P < 0.01; ns = not significant (P > 0.01).
significant sexual dimorphism (P < 0.01) for the maxillary first molars in Jat Sikhs. From Table 1, it is evident that the parameters as measured for males and females when compared are found to be statistically significant. Further in males or females individually, i.e. within the same sex (Tables 2 and 3) when these parameters as measured, are
compared, they are found to be statistically insignificant. From these findings, it can be inferred that there exists a definite statistically significant sexual dimorphism for the maxillary first molar in Indian Jat Sikhs (P < 0.01). The percentage sexual dimorphism calculated came out to be higher for the buccolingual dimension (4.6% for

4
DISCUSSION
Dental morphological characteristics are useful for providing information for phylogenic and genetic studies and understanding variation within and among species. The crown characteristics are known to differ among racial groups; for example, Australian aborigines have larger teeth, Indians have smaller teeth, while whites have teeth intermediate in size (Tedeschi, 1977).
The Jat Sikhs are an endogamous group at caste level. They have distinct customs, traditions and food habits. As such the present study defines the criteria of the first molar tooth size for the Jat Sikhs. In general the morphometric parameters were found to be quantitatively higher for the left side. This observation holds true also for all the maxillary anterior teeth in North Indians (Agnihotri and Jain, 2008) but not in South Indians (Nair et al., 1999). The crown dimensions for the first molar are comparable to those of the Jats (Kaul and Prakash, 1984) in Haryana. The Jats of Haryana constitute an agriculture-based community in North India.
It is a combination of environmental factors and inheritance that controls the mesiodistal and buccolingual dimensions. The dimensions obtained for the male teeth are definitely on the higher side as compared to those for females. This can be explained on the basis of the shape of the first molar tooth, which is controlled by the genetic constitution of the individual. Thus, the male teeth are usually larger in size as compared to the female teeth. It is the Y chromosome that seems to contribute most in the size of teeth by controlling the thickness of dentine, whereas the X chromosome seems to be responsible for modulating thickness of the enamel. The sexual dimorphism in tooth morphology is attributable to the presence of relatively more dentine in the crowns of male teeth (Iscan and Kedici, 2003).
The present study indicates that there exists a definite statistically significant sexual dimorphism for the maxillary first molar in Indian Jat Sikhs (P < 0.01). This is in concordance with the work done on Taiwan Chinese (Kondo, 1998) and on Jordanian subjects (Hattab et al., 1996). While dental difference between the sexes in several human groups has been found highly dimorphic, it was not found so in Turks (Iscan and Kedici, 2003), where the lack of dimorphism comes from male subjects. This validates the perception that sexual dimorphism is population specific.
The percentage sexual dimorphism calculated came out to be higher for the buccolingual dimension (4.6% for the right side and 5.18% for the left side) as compared to the mesiodistal dimension. This is consonant with the findings for American white (Garn et al., 1966) and South Indian (Nair et al., 1999) subjects. Since size dimorphism was consistently greater for the buccolingual tooth diameter, its more extensive use is indicated in like-sex and unlike-sex sibling and parent-child comparisons for tooth size. Among the various crown dimensions, crown
G. AGNIHOTRI AND V. SIKRI
Fig. 3. Illustration showing the measurement of maximum buccolingual crown dimension.
Fig. 4. Depiction of the method of measuring cusp diameters. Clockwise from the upper left are the paracone, protocone, metacone, and hypocone.
the right side and 5.2% for the left side) as compared to the mesiodistal dimension. Among the various crown dimensions, crown area displays the maximum dimorphism (9.0% for right side and 10.2% for left side).
The maximum cusp size in decreasing order came out to be hypocone > protocone > paracone > metacone for these Indian Jat Sikhs. The sex dimorphism in the cusp dimensions corresponds to the order of cusp formation, namely, hypocone > metacone > protocone > paracone. The percentage sexual dimorphism for the hypocone (right 7.2%; left 7.4%) is quite high in present study as compared to the other cusps. The cusp index exhibited the sequence: hypocone index > protocone index > paracone index > metacone index. The cusp indices (except for the hypocone index) did not exhibit statistically significant sexual dimorphism.

5
Parameter Side Mean sd Side Mean sd t-test P-value
Mesiodistal Width Left 11.39 0.195 Right 11.33 0.078 1.96 >0.01Buccolingual Length Left 12.60 0.192 Right 12.53 0.078 2.13 >0.01Crown Area Left 143.54 4.617 Right 142.07 1.859 2.01 >0.01Paracone Diameter Left 5.84 0.138 Right 5.82 0.118 0.91 >0.01Protocone Diameter Left 5.90 0.089 Right 5.88 0.119 0.92 >0.01Metacone Diameter Left 5.70 0.102 Right 5.68 0.117 -0.90 >0.01Hypocone Diameter Left 7.00 0.102 Right 6.98 0.122 0.96 >0.01Paracone Index Left 48.74 0.982 Right 48.82 1.114 -0.35 >0.01Protocone Index Left 49.24 0.983 Right 49.32 1.102 -0.36 >0.01Metacone Index Left 47.59 0.982 Right 47.65 1.089 -0.32 >0.01Hypocone Index Left 58.55 1.137 Right 58.45 1.104 -0.48 >0.01
Parameter Side Mean sd Side Mean sd t-test P-value
Mesiodistal Width Left 10.87 0.187 Right 10.88 0.142 -0.13 >0.01Buccolingual Length Left 11.98 0.142 Right 11.97 0.192 0.13 >0.01Crown Area Left 130.25 2.849 Right 130.29 2.789 -0.08 >0.01Paracone Diameter Left 5.64 0.089 Right 5.63 0.124 0.69 >0.01Protocone Diameter Left 5.60 0.078 Right 5.59 0.108 0.68 >0.01Metacone Diameter Left 5.40 0.079 Right 5.39 0.088 0.57 >0.01Hypocone Diameter Left 6.52 0.092 Right 6.51 0.104 0.59 >0.01Paracone Index Left 49.43 0.862 Right 49.31 0.902 0.64 >0.01 Protocone Index Left 49.08 0.853 Right 48.96 0.901 0.65 >0.01Metacone Index Left 47.32 0.845 Right 47.23 0.882 0.55 >0.01Hypocone Index Left 57.03 0.989 Right 57.14 0.908 0.55 >0.01
TABLE 2. Descriptive statistics and tests for left-right side differences in males
TABLE 3. Descriptive statistics and tests for left-right side differences in females
area displayed the maximum dimorphism (9.0% for right side; 10.2% for left side).
The present pioneer study on the maxillary molar tooth in Indian Jat Sikhs provides data useful for anthropological, genetic, odontologic, and forensic investigations. This is particularly so since tooth morphology is known to be influenced by cultural, environmental, and racial factors (Agnihotri and Gulati, 2008).
The maximum cusp size in decreasing order came out to be hypocone > protocone > paracone > metacone. This order has been found to differ among populations. For the Japanese, Kondo et al. (2005) found the sequence to be: protocone > hypocone > paracone. For American whites, Biggerstaff (1976) reported the order to be protocone> metacone > paracone > hypocone. The sexual dimorphism in the cusp dimensions corresponds to the order of cusp formation, namely hypocone > metacone > protocone > paracone. Thus, the ontogenetic hypothesis, that later forming structures show greater sexual dimorphism than earlier forming structures, can apparently be extended to dental crown components.
The hypocone is considered to be the key innovation in mammalian evolution (Hunter and Jernvall, 1995).
Mammals that developed the hypocone became preadapted for masticating fibrous plants and subsequently demonstrated a markedly increased species diversity. The percentage sexual dimorphism for the hypocone (right 7.2%; left 7.4%) is high in present study as compared to the other cusps. This value is in fact comparable to the values for canine in North Indian population (right 7.3%; left 8.1%). The canine is known to exhibit the largest sexual dimorphism in the human dentition.
The cusp index exhibited the sequence: hypocone index > protocone index > paracone index > metacone index. However in the present study the cusp indices except the hypocone index did not demonstrate a statistically significant sexual dimorphism. Though the cusp index sequence follows the same pattern in the Japanese (Kondo et al., 2005), the hypocone index in them is statistically significant. This can be attributed to differences in ethnicity. The hypocone index and hypocone diameter are the most dimorphic parameters for the Jat Sikh population.
CONCLUSION
The study quantifies the morphometric criterion and
FIRST MOLAR CUSP DIMENSIONS

6
establishes the existence of a statistically significant sexual dimorphism (P < 0.01) for the maxillary first molars in Jat Sikhs. This study suggests that the hypocone index and hypocone diameter are the most dimorphic parameters for the Jat Sikh population.
ACKNOWLEDGEMENTS
The authors would like to thank Dr. Satish Agnihotri, Colonel (Retd) and Dr. Vikram Agnihotri (Capt) for their invaluable suggestions and encouragement. We also appreciate our statistician Mrs. Shaweta Agnihotri, Lecturer, BBK DAV College, Amritsar for her efforts and hard work. We are indebted to the resident doctors, senior residents, and senior technicians working in the local Government Dental College for their wholehearted support for the timely completion of the study.
LITERATURE CITED
Agnihotri G, Gulati MS. 2008. Maxillary molar and premolar indices in North Indians: a dimorphic study. The Internet Journal of Biological Anthropology [vol 2, no 1] Available from: http://www.ispub.com/ostia/index.php.
Agnihotri G, Jain RL. 2008. Maxillary anterior teeth morphometry in North Indians: a dimorphic study. Nepal Dent J 9:23-28.
Biggerstaff RH. 1976. Cusp size, sexual dimorphism, and the heritability of maxillary molar cusp size in twins. J Dent Res 55:189-195.
Black GV. 1902. Description of human teeth, 4th ed. Philadelphia: S.S. White Manufacturing Company.
Camps. 1976. Identification by skeletal structures. In: Gradwohls legal medicine, 3rd ed. London: John Wright and Sons.
Dayal PK, Srinivasan SV, Paravatty RP. 1998. Determination of sex using tooth. In: Masthan Kmk, editor. Textbook of forensic odontology. Hyderabad: Paras Medical Publisher.
Dhillon BS. 1994. History and study of the Jats. India: Beta Publishers.
Kraus BS, Jordan RE. 1965. The human dentition before
birth. Philadelphia: Lea and Febiger.Garn SM, Lewis AB, Kerewsky RS. 1966. Sexual
dimorphism in the buccolingual tooth diameter. J Dent Res 45:1819.
Gingerich PD. 1974. Size variability of the teeth in living mammals and the diagnosis of closely related sympatric fossil species. J Paleontol 48:895-903.
Hattab FN, al-Khateeb S, Sultan I. 1996. Mesiodistal crown diameters of permanent teeth in Jordanians. Arch Oral Biol 41:641-645.
Hunter JP, Jernvall J. 1995. The hypocone as a key innovation in mammalian evolution. Proc Natl Acad Sci 92:10718-10722.
Iscan MY, Kedici PS. 2003 Sexual variation in bucco-lingual dimensions in Turkish dentition. Forensic Sci Int 2:160-164.
Kanazawa E, Sekikawa M, Akai J, Ozaki T. 1985. Allometric variation on cuspal areas of the lower first molar in three racial populations. J Anthropol Soc Nippon 9:425-438.
Kaul V, Prakash S. 1984. Crown dimensions of deciduous and permanent teeth of Jats from Haryana (India). Ann Hum Biol 11:351-354.
Kondo S, Yamada H. 1985. Cusp size variability of the maxillary molariform teeth. Anthropol Sci 111:255-263.
Kondo S.1998. Sexual dimorphism in the tooth crown dimensions of the second deciduous and first permanent molars of Taiwan Chinese. Okajimas Folia Anat Jpn 75:239-246.
Kondo S, Townsend GC, Yamada H. 2005. Sexual dimorphism of cusp dimensions in human maxillary molars. Am J Phys Anthropol 128:870-877.
Nair P, Rao BB, Annigeri RG. 1999. A study of tooth size, symmetry and sexual dimorphism. J Forensic Med Toxicol 16:10-13.
Osborn HF. 1907. Trituberculy in relation to the human molar teeth and primates. In: Gregory WK, editor. Evolution of mammalian molar teeth to and from the triangular type. New York: Macmillan, p 48-65.
Patterson B. 1956. Early Cretaceous mammals and the evolution of mammalian molar teeth. Fieldiana Geol 1956;23:1-105.
Sidhu IS, Kaur K, Sarhadi VK, Joshi DS, Mukhopadhaya R, Mahajan SK, Bhanwer AJS. 2003. Study of genetic polymorphism at D21S11 and D21S215 loci in the Jat Sikh population of Punjab. Int J Hum Genet 3:45–50.
Tedeschi CG. 1977. Examination of human remains. In: Tedeschi CG, Eckert WG, Tedeschi LG, editors. Forensic medicine. Philadelphia: WB Saunders Company.
Yamada H. 1981. Sexual dimorphism of molar crown size in a Japanese population. Jpn J Oral Biol 34:531-540.
G. AGNIHOTRI AND V. SIKRI
TABLE 4. Sexual dimorphism for the crown and cusp dimensions
Parameter Right side Left side
Mesiodistal width 4.14% 4.78%Buccolingual length 4.68% 5.18%Crown area 9.04% 10.20%Paracone 3.37% 3.55%Protocone 5.19% 5.36%Metacone 5.38% 5.56%Hypocone 7.22% 7.36%

7
Carabelli trait is expressed on the mesio-palatal surface of human maxillary molar crowns, particularly primary second and permanent first molars, and the feature shows a quasi-continuous pattern of expression (Harris, 1977). Investigations of Carabelli trait, one of many so-called non-metric dental crown traits, are usually based on classifying or scoring the feature with reference to standard plaques, leading to calculations of its frequency of occurrence and degree of expression. Although most investigations of Carabelli trait have used standard plaques, there are distinct differences in reported frequencies of the trait in similar population groups, probably resulting more from observational inconsistencies than true variation (Scott, 1980). Misclassification of the trait is further compounded by the relatively large number of different classification methods available to the researcher (Kieser and Merwe, 1984). Recently, the effect of inter-observer errors was reported when using dental morphological features to calculate genetic distances in ancient Mayans, with different ‘cut points’ for determining presence and absence of traits, such as Carabelli trait, influencing the outcomes of the analyses (Cucina and Wrobel, 2008). Although Carabelli trait has been studied extensively within and among human populations, there is still uncertainty about the validity of the different methods of classification, including which is the most suitable to use in primary and permanent dentitions.
Twin studies provide a valuable approach for clarifying the relative contributions of genetic and environmental effects to phenotypic variability (Eaves, 1982; Townsend et al., 2009). Indeed, a study of Carabelli
trait in the permanent dentition of South Australian twins indicated a very strong genetic contribution to observed variation, with an estimate of heritability around 90% (Townsend and Martin, 1992). Pinkerton et al. (1999) extended this earlier investigation by analysing the expression of Carabelli trait in both the primary and permanent dentitions of a large sample of Australian twins, highlighting the importance of genetic influences on Carabelli trait variation and disclosing patterns of variation in trait expression between dentitions.
The aim of our present study was to explore the reliability and validity of two methods for classifying Carabelli trait (Hanihara, 1961; Dahlberg, 1963), by scoring the feature in both primary and permanent dentitions of a sample of Australian twins. By examining trait expression within and between the dentitions of monozygotic (MZ) twin pairs we also aimed to gain some insight into the underlying causes of observed variation, and to clarify which phenotypic forms of Carabelli trait might be more closely related in terms of their ontogeny. Given the strong genetic influence on variation in Carabelli trait,
Carabelli Trait in Australian Twins: Reliability and Validity of Different Scoring SystemsYuh Hasegawa,*,1, 2 James Rogers,2 Graham Scriven2 and Grant Townsend2
1School of Life Dentistry, The Nippon Dental University, Niigata, Japan;2School of Dentistry, The University of Adelaide, Adelaide, South Australia
ABSTRACT We assessed the intra- and inter-observer reliability of two methods of scoring or categorizing Carabelli trait in both primary and permanent dentitions (Hanihara, 1961; Dahlberg, 1963). By using dental casts obtained from twins, we also compared the expression of Carabelli trait within and between monozygotic (MZ) co-twins to clarify the ontogenetic processes leading to different forms of trait expression. While intra-observer concordance rates were generally good (70 - 90%), inter-observer concordance rates were poor (35 - 60%). This indicates that considerable caution is needed when comparing data for Carabelli trait derived from different samples by different researchers. By comparing
categories or scores for Carabelli trait in both dentitions of MZ co-twins, we found inter-relationships between groove and cuspal forms of the feature. Although the Arizona State University system developed by Turner is commonly used nowadays to score the Carabelli trait, we would encourage researchers interested in clarifying genetic influences and ontogenetic processes in both dentitions to refer to the often over-looked plaque of Hanihara and also Dahlberg’s plaque P12B. This should improve the reliability and validity of data obtained by helping to clarify the inter-relationships between the different phenotypic expressions of Carabelli trait. Dental Anthropology 2010;23(1):7-15.
*Dr. Hasegawa performed this research while on sabbatical leave as a Visiting Lecturer in the School of Dentistry, The University of Adelaide.Correspondence to: Yuh Hasegawa, School of Life Dentistry at Niigata, The Nippon Dental University, 1-8, Hamaura-chou, Chuuou-ku, Niigata-city, Niigata, Japan 951-8580E-mail: [email protected]
8
it was hypothesized that any differences in phenotypic expression of the trait within and between MZ co-twins would tend to be small, reflecting environmental and/or epigenetic influences operating during odontogenesis. By comparing classifications or scores for Carabelli trait using the different methods, we aimed to shed light on the validity of the systems, including their ability to reflect ontogenetic processes.
MATERIALS AND METHODS
A total of 200 sets of dental casts, representing 50 pairs of monozygotic (MZ) and 50 pairs of dizygotic (DZ) twins, were examined and scored for Carabelli trait, using the systems of Hanihara (1961) and Dahlberg (1963). The dental casts were selected from a collection of over 600 pairs housed in the School of Dentistry at the University of Adelaide. The twins were all of European ancestry and their ages ranged from 8.3 years to 11.5
years, with a mean age of 9.5 years. Zygosities were confirmed either by comparison of genetic markers in the blood or by DNA analysis of buccal cells (Townsend and Martin, 1992). The probability of monozygosity, given concordance for all the systems that were analysed, was greater than 99.0%. The ongoing study of teeth and faces of Australian twins was approved by the Committee on the Ethics of Human Experimentation, The University of Adelaide (Approval No. H/07/84A), and all participants have provided informed consent.
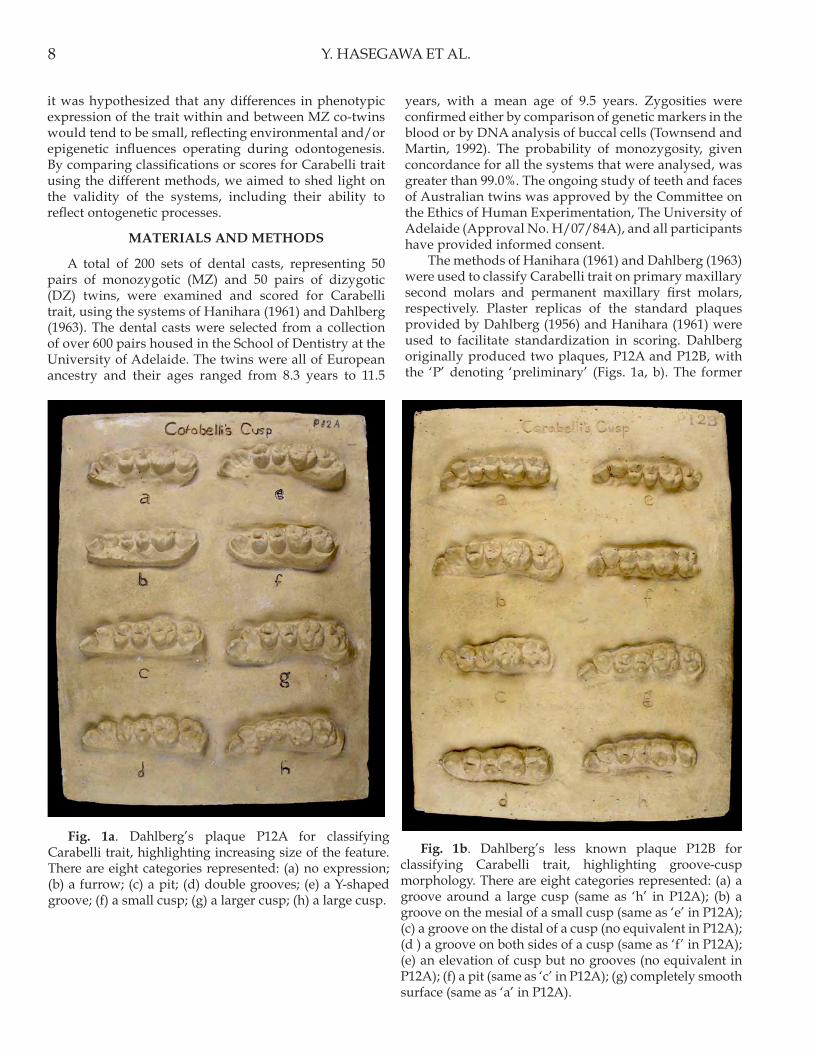
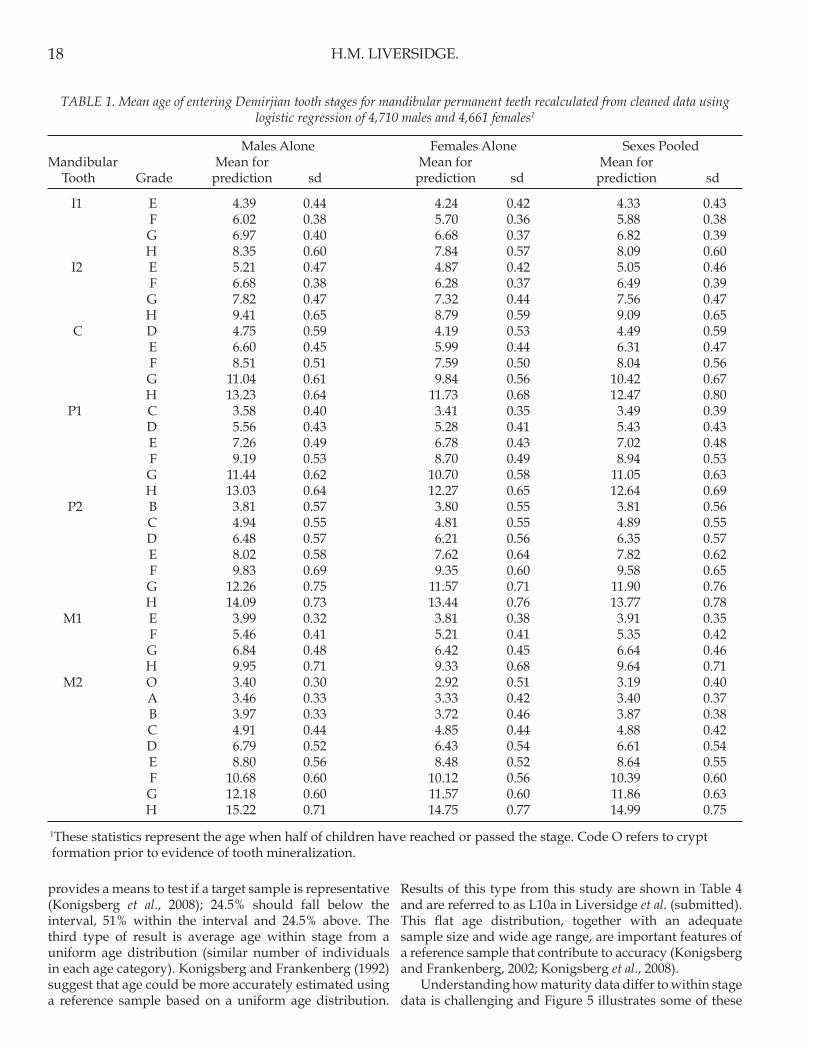
The methods of Hanihara (1961) and Dahlberg (1963) were used to classify Carabelli trait on primary maxillary second molars and permanent maxillary first molars, respectively. Plaster replicas of the standard plaques provided by Dahlberg (1956) and Hanihara (1961) were used to facilitate standardization in scoring. Dahlberg originally produced two plaques, P12A and P12B, with the ‘P’ denoting ‘preliminary’ (Figs. 1a, b). The former
Fig. 1b. Dahlberg’s less known plaque P12B for classifying Carabelli trait, highlighting groove-cusp morphology. There are eight categories represented: (a) a groove around a large cusp (same as ‘h’ in P12A); (b) a groove on the mesial of a small cusp (same as ‘e’ in P12A); (c) a groove on the distal of a cusp (no equivalent in P12A); (d ) a groove on both sides of a cusp (same as ‘f’ in P12A); (e) an elevation of cusp but no grooves (no equivalent in P12A); (f) a pit (same as ‘c’ in P12A); (g) completely smooth surface (same as ‘a’ in P12A).
Fig. 1a. Dahlberg’s plaque P12A for classifying Carabelli trait, highlighting increasing size of the feature. There are eight categories represented: (a) no expression; (b) a furrow; (c) a pit; (d) double grooves; (e) a Y-shaped groove; (f) a small cusp; (g) a larger cusp; (h) a large cusp.
Y. HASEGAWA ET AL.

9
intra- and inter-observer reliability in scoring Carabelli trait, and plaque P12B was used to provide additional insights into variability in trait expression in selected pairs of MZ twins. Although Dahlberg stressed his plaque P12B should not be used to define classes of Carabelli trait, he emphasized that pit and grooves should be noted in addition to cuspal forms. Hanihara’s Plaque D7 was also used to score Carabelli trait, with the ‘D’ referring to ‘deciduous’ (Fig. 2). It presents eight categories of Carabelli trait and has been used to interpret the relationship between pit and cuspal forms in the primary dentition.
Assessments were made by one observer for all subjects on two separate occasions, enabling an estimation of the intra-observer reliability of both methods to be made. Two broad categories, referred to as ‘concavities’ and ‘convexities’, were used to compare intra-observer concordance rates using the methods of both Hanihara and Dahlberg. The ‘concavities’ category included scores 0 to 3 in Hanihara’s system and categories a-d in Dahlberg’s P12A system. The ‘convexities’ category included scores 4 to 7 in Hanihara’s system and categories ‘e-g’ in Dahlberg’s P12A system. In his analysis of the American Indian dentition, Dahlberg (1963) grouped the ‘b’ and ‘c’ categories together to represent various types of grooves and pits, and then combined the categories ‘d’ to ‘g’ to represent all sizes of cusps. We have chosen to include category ‘d’ as a ‘concavity’ for the purposes of our reliability tests, reflecting the presence of two grooves or furrows.
To assess inter-observer reliability, ten pairs of twins were selected at random and classified for Carabelli trait by three observers using the methods of Dahlberg and Hanihara. These three observers had different amounts of experience in classifying Carabelli trait. Observer A was a person with considerable experience, observer B had one year of experience, and it was the first time that observer C had scored Carabelli trait. After making their observations, inter-observer concordance rates between the three observers were calculated. Chi-square tests were also performed to compare the scoring of Carabelli trait between methods with statistical significance set at an alpha level = 0.05.
After assessing reliability, Carabelli trait was re-examined in all pairs of MZ twins where co-twins showed discordant expression of the feature by referring to both of Dahlberg’s plaques, P12A and P12B, as well as Hanihara’s D7 plaque. Given the recognized strong genetic contribution to variation of the trait, it was considered that close examination of those MZ twin pairs who showed different degrees of expression of the feature on primary and permanent teeth, or between sides, would provide additional insights into the validity of the scoring systems and also into the underlying biological processes leading to the observed phenotypes.
CARABELLI TRAIT IN AUSTRALIAN TWINS
Fig. 2. Hanihara’s plaque D7 developed for scoring Carabelli trait in the primary dentition. There are eight grades: (0) no expression; (1) a shallow groove; (2) a shallow depression; (3) a deeper depression or pit but no bulge; (4) similar to 3 but a slight eminence; (5) a stronger eminence but smooth; (6) a cusp encircled by a groove; (7) a strong cusp.
has been commonly used for categorizing the size of Carabelli trait in the permanent dentition, whereas the latter, less well-known plaque was designed to highlight groove-cusp morphology, following on from descriptions by Meredith and Hixon (1953). Dahlberg created plaque P12B with the intention of evaluating pits and other surface irregularities found at the sites commonly occupied by Carabelli cusp. He suggested that, for future reference, pits and grooves should be counted as features relative to Carabelli trait, and that plaque P12B might be used to provide a limited guide to the trait’s development (Dahlberg, 1956).
In this study, plaque P12A was used for assessing

10
RESULTS
Table 1 shows the intra-observer concordance rates for scoring Carabelli trait on two separate occasions for primary second molars. Values ranged from around 70% to 90% reflecting good intra-observer reliability. A significant difference in concordance rates between the scoring methods was noted for ‘concavities’ in the DZ sample. In the ‘convexities’ category there was a significant difference in concordance rates between the methods for MZ twins and for the total sample (Table 1).
Table 2 shows the concordance rates between first and second assessments for permanent first molars. Values ranged from 75% to 85%. No significant differences in either the ‘concavities’ or ‘convexities’ categories were found between the methods.
Table 3 indicates the inter-observer concordance rates among the three observers for scoring Carabelli trait on primary second molars and Table 4 provides similar data for permanent first molars. The concordance rates were generally low, highlighting that inter-observer reliability for scoring was relatively poor. Using the method of Hanihara, the concordance rate between observer A and C was highest, followed by the rate between observer B and C, and the rate between observer A and B was lowest for both primary second molars and permanent first molars. Using Hanihara’s method, the concordance rate between observer A and C was 65% for primary second molars and 40% for permanent first molars. The concordance rates between observer B and C, and between observer A and B, were around 35% for both
Hanihara Dahlberg
Concordance Discordance Concordance Discordance n % n % total Significance n % n % total
Total 315 78.8 85 21.3 400 ns 301 75.3 99 24.8 400 DZ 158 79.0 42 21.0 200 ns 152 76.0 48 24.0 200 MZ 157 78.5 43 21.5 200 ns 149 74.5 51 25.5 200
Concavity 224 78.6 61 21.4 285 ns 229 73.6 82 26.4 311 DZ 106 78.5 29 21.5 135 ns 110 72.8 41 27.2 151 MZ 118 78.7 32 21.3 150 ns 119 74.4 41 25.6 160
Convexity 91 79.1 24 20.9 115 ns 72 80.9 17 19.1 89 DZ 52 80.0 13 20.0 65 ns 42 85.7 7 14.3 49 MZ 39 78.0 11 22.0 50 ns 30 75.0 10 25.0 40
ns: not significant*0.05 > P > 0.01; **P < 0.01
TABLE 2. Concordance rates between first and second assessments (permanent first molars)
Y. HASEGAWA ET AL.
Hanihara Dahlberg
Concordance Discordance Concordance Discordance n % n % total Significance n % n % total
Total 305 76.3 95 23.8 400 ns 297 74.3 103 25.8 400 DZ 152 76.0 48 24.0 200 ns 138 69.0 62 31.0 200 MZ 153 76.5 47 23.5 200 ns 159 79.5 41 20.5 200
Concavity 242 78.3 67 21.7 309 ns 253 72.1 98 27.9 351 DZ 118 78.1 33 21.9 151 * 115 66.1 59 33.9 174 MZ 124 78.5 34 21.5 158 ns 138 78.0 39 22.0 177
Convexity 63 69.2 28 30.8 91 ** 44 89.8 5 10.2 49 DZ 34 69.4 15 30.6 49 ns 23 88.5 3 11.5 26 MZ 29 69.0 13 31.0 42 ns 21 91.3 2 8.7 23
ns: not significant*0.05 > P > 0.01; **P < 0.01
TABLE 1. Concordance rates between first and second assessments (primary second molars)

11
primary second molars and permanent first molars. Using the method of Dahlberg with plaque P12A, the concordance rate between observer B and C was 62.5% and the rates between observer A and B and between observer A and C were each 47.5% for primary second molars. The concordance rate between observer A and B was 47.5% and the rate between observer A and C was 45%, but the rate between observer B and C was only 35% for permanent first molars.
There were differences between observers regarding the interpretation of what constituted a groove or an eminence in both Hanihara’s and Dahlberg’s systems. The observers also had difficulty in classifying both the pit and Y-shaped categories using Hanihara’s system, and there were differences in interpretation between the groove, Y-shaped, and cuspal grades in Dahlberg’s system. Where there were differences in classification or scoring of Carabelli trait within or between MZ co-twins, the differences tended to be small, as we had hypothesized. By examining closely the cases where there were differences between sides or between primary and
permanent dentitions within an MZ twin, or differences between MZ co-twins, we were able to gain some insight into the ability of the different classification systems to reflect the phenotypic variation observed, and also to clarify how each category or score related to others.
Figures 3 and 4 represent two pairs of MZ twins who were selected because they showed discordant expressions of Carabelli trait that assisted in considering the validity of the Dahlberg and Hanihara systems. Table 5 shows the categories and scores for the trait, based on Dahlberg’s plaques P12A and P12B, and also using Hanihara’s plaque, for both the primary second molars and the permanent first molars in these two pairs of twins. The results provided in Table 5 were obtained by three observers each scoring the feature independently, then reaching a consensus on which category or score best matched the phenotypic expressions observed. It can be seen that there were differences in expression both within and between the twin pairs. For example, the primary and permanent molars for T331A were all scored as category ‘b’ according to Dahlberg’s plaque
Observer A Observer B Observer C Hanihara’s Dahlberg’s Hanihara’s Dahlberg’s Hanihara’s Dahlberg’s method method method method method method
Observer A concordance --- --- 13 (32.5%) 19 (47.5%) 26 (65.0%) 19 (47.5%) discordance --- --- 27 (67.5%) 21 (52.5%) 14 (35.0%) 21 (52.5%)Observer B concordance 13 (32.5%) 19 (47.5%) --- --- 15 (37.5%) 25 (62.5%) discordance 27 (67.5%) 21 (52.5%) --- --- 25 (62.5%) 15 (37.5%) Observer C concordance 26 (65.0%) 19 (47.5%) 15 (37.5%) 25 (62.5%) --- --- discordance 14 (35.0%) 21 (52.5%) 25 (62.5%) 15 (37.5%) --- ---
(n = 40; sum of left and right sides)
TABLE 3. Concordance rates among three observers (primary second molars)
CARABELLI TRAIT IN AUSTRALIAN TWINS
Fig. 4. A pair of MZ twins (T338A and B) showing different expressions of Carabelli trait within and between co-twins. The categories or scores are summarized in Table 5.
Fig. 3. A pair of MZ twins (T331A and B) showing different expressions of Carabelli trait within and between co-twins. The categories or scores are summarized in Table 5.

12
Observer A Observer B Observer C Hanihara’s Dahlberg’s Hanihara’s Dahlberg’s Hanihara’s Dahlberg’s method method method method method method
Observer A concordance --- --- 13 (32.5%) 19 (47.5%) 16 (40.0%) 18 (45.0%) discordance --- --- 27 (67.5%) 21 (52.5%) 24 (60.0%) 22 (55.0%)Observer B concordance 13 (32.5%) 19 (47.5%) --- --- 14 (35.0%) 14 (35.0%) discordance 27 (67.5%) 21 (52.5%) --- --- 26 (65.0%) 26 (65.0%) Observer C concordance 16 (40.0%) 18 (45.0%) 14 (35.0%) 14 (35.0%) --- --- discordance 24 (60.0%) 22 (55.0%) 26 (65.0%) 26 (65.0%) --- ---
(n = 40; sum of Left and Right)
TABLE 4. Concordance rates among three observers (permanent first molars)
T331A T331B
Deciduous m2 Permanent M1 Deciduous m2 Permanent M1 Right Left Right Left Right Left Right Left side side side side side side side side
Dahlberg’s plaque 12A b b b d b e e eDahlberg’s plaque 12B e e e NC e b b bHanihara’s plaque D7 1 1 1 NC 1 3 2 3
T338A T338B
Deciduous m2 Permanent M1 Deciduous m2 Permanent M1 Right Left Right Left Right Left Right Left side side side side side side side side
Dahlberg’s plaque 12A e h b a e c a bDahlberg’s plaque 12B b a e h b g h eHanihara’s plaque D7 4 6 1 0 3 2 0 1
There is no equivalent category in Dahlberg’s plaque P12B or Hanihara’s plaque D7 to category ‘d’ in Dahlberg’s plaque P12A .NC = no category.
TABLE 5. Categories and scores of Carabelli trait expression in two pairs of monozygotic twins
Y. HASEGAWA ET AL.
P12A, except for the permanent left first molar that was scored as category ‘d’. The co-twin, T331B, displayed a ‘b’ category for the primary right second molar but all of the other teeth were scored as category ‘e’. The corresponding categories and scores based on Dahlberg’s plaque P12B and on Hanihara’s D7 plaque, are also shown in Table 5. Similarly, there were differences in the categories and scores recorded for twins T338A and B. In these cases, the expression of Carabelli trait was greater on the primary molars than the permanent teeth, and there were also differences in expression between sides and between co-twins. The reader is encouraged to view the figures carefully and then to score the different teeth in both sets of twins. It becomes evident that the different phenotypic forms of Carabelli trait do seem to be linked to each other but there are many forms of the feature that are difficult to classify with any certainty.
DISCUSSION
The method of Dahlberg (1963) has been used commonly by many researchers to classify Carabelli trait on permanent first molars, although there have been numerous scoring methods developed over the years, including Shapiro’s (1949) nine-grade classification, Goose and Lee’s (1971) five-grade classification and Alvesalo et al.’s (1975) five-grade classification. Currently, the most widely used method for classifying Carabelli trait in the permanent dentition is The Arizona State University Dental Anthropology System devised by Christy G. Turner and his colleagues (Turner et al., 1991). This method is based on Dahlberg’s plaque P12A but the categorical classification system of Dahlberg has been replaced by a numerical system from 0 to 7. The categories and the scores match reasonably well, although scores 3 and 4 in Turner’s system refer to small and large Y-shaped

13
depressions, whereas categories ‘d’ and ‘e’ on Dahlberg’s plaque P12A represent a double groove and a Y-shaped groove, respectively.
Dahlberg’s P12A plaque includes absence and seven degrees of expression of Carabelli trait, ranging from a single groove (or so-called ‘furrow’), a pit, a double groove, a Y-shaped groove, to various sizes of cusps. In this scheme, categories ‘f ‘to ‘h’ represent increasing sizes of cusp. However, his P12B plaque does not address any size sequence, rather it considers pit-groove relationships. Although this plaque does not appear to have been used very widely in the past, it did assist the observers in this study to focus on the inter-relationship among pits, furrows and grooves, and cusps of various sizes. In cases where Carabelli trait was difficult to categorize, reference to P12B provided additional guidance in deciding which category to choose. Although Dahlberg’s method was developed for the permanent dentition, it has been used to score Carabelli trait in both the primary and mixed dentitions (Pinkerton et al., 1999) with additional reference to the plaque of Hanihara (1961).
As this study progressed it became clearer that there were some discrepancies in the expression of Carabelli trait between the primary and permanent dentitions. The primary molars tended to display a higher frequency of Y-shaped groove forms, whereas cuspal forms were more common in the permanent dentition. This finding has been reported previously by other researchers (Saunders and Mayhall, 1982; Pinkerton et al., 1999; Adler, 2006).
Kieser (1984) examined the expression of Carabelli trait on primary and permanent molars and reported a high degree of equivalence of expression of Carabelli trait in both dentitions. He hypothesized that this result was consistent with low epigenetic but high genetic influence on Carabelli trait expression. We have noted previously that, if the trait appears on the permanent first molar of an individual, it is almost always present on the primary second molar. However, if the trait appears on the primary molar, it may not be expressed on the permanent molar. Consistent with Kieser’s view, we have interpreted this finding as reflecting similar underlying genetic influence for Carabelli trait in both dentitions, with environmental and/or epigenetic influences being more likely to modify trait expression on the permanent molar that forms later and develops over a longer period of time (Townsend and Brown, 1981).
The plaque D7 of Hanihara was designed specifically to score Carabelli trait in the primary dentition and, therefore, some limitations were noted when attempting to use it to score different convexity categories in the permanent teeth. Interestingly, Hanihara’s description of his system does not refer to Y-shaped grooves specifically, rather the term ‘depression’ is used. Nevertheless, the examples of depressions provided on Hanihara’s plaques do have a characteristic Y-shaped appearance. Dahlberg’s P12A system provides a comprehensive categorization of the cuspal categories of the trait but it does not address
the peculiarities of the various pit/groove relationships to any extent. For example, it is often difficult to decide whether a short groove that ends in a deeper depression should be classed as a groove or a pit. It is also often difficult to determine whether double grooves lie either side of a slight elevation that would warrant a cuspal classification. Similarly, Y-shaped grooves may or may not be associated with a convexity of the lingual surface of the tooth.
Despite these difficulties, it appears that an acceptable level of intra-observer reliability can be reached for scoring Carabelli trait using the methods of either Dahlberg or Hanihara. We achieved concordance values in the range of 70-90%. Observers tend to develop their own internal calibration for classifying difficult examples of the trait that is based on their interpretation of the system of classification being used. It would appear that it is probably best to use the Dahlberg system when classifying Carabelli trait in the permanent dentition and the Hanihara system in the primary dentition, while acknowledging that each method has its limitations. However, the level of inter-observer reliability was very low whichever method was used in either dentition. Our concordance values were in the range of only 35-60%. This finding reinforces the view that considerable caution is needed when making comparisons of data for Carabelli trait derived from different samples by different researchers.
For studies of the mixed dentition, where a uniform system of classifying Carabelli trait on both primary and permanent molars is desirable, it is suggested that a modified system could be used that draws on the methods of both Hanihara and Dahlberg. It is interesting that the Arizona State University (ASU) system for classifying Carabelli trait in the permanent dentition is slightly different from the system proposed originally by Dahlberg, with the ‘double groove’ category of Dahlberg replaced by a ‘Y-shaped groove’ category (Turner et al., 1991; Dahlberg, 1963). Even though it was developed for the permanent dentition, the ASU system, with its use of scores rather than categories and its modification of the original Dahlberg system, provides an additional very useful perspective for attempting to classify the range of expression of Carabelli trait in both dentitions.
Although distinguishing and classifying minor differences in phenotypic expression of Carabelli trait may not be as important in population-based anthropological studies as deciding whether the trait is present or not, we contend that fine discrimination in phenotypic expression is desirable in genetic studies and also in clarifying ontogenetic processes. We would propose for these types of studies that all available reference sources should be considered, including Dahlberg’s plaque P12B, to assist in describing and then recording the rather complex inter-relationships between grooves and cusps.
The variations in expression of Carabelli trait demonstrated in the two pairs of MZ twins reported
CARABELLI TRAIT IN AUSTRALIAN TWINS

14
in this paper highlight the wide range of expressions of the trait that are possible and confirm that no single scoring system is likely to be able to capture all possible phenotypic forms. The two examples we have provided also support the view that, despite a strong over-riding genetic influence on observed variation, relatively minor modifications in environmental and/or epigenetic influences within or between co-twins can apparently lead to different phenotypic expressions in Carabelli trait.
The types of expressions of Carabelli trait observed within the MZ co-twins, particularly in terms of the expression of different groove forms, confirm that there is an inter-relatedness between groove forms and cuspal forms of the trait. Our findings in twins suggest that increasing expression of Carabelli trait follows a continuum from simple grooves, to pits, to double grooves, to Y-shaped grooves, and then to cusps of various sizes, in a similar order to that represented in Dahlberg’s plaque P12A. Even though Carabelli trait has probably been studied by dental anthropologists more than any other dental feature, there is still much to learn about the nature of the ontogenetic mechanisms that lead to its various expressions on primary and permanent molar teeth. We would strongly encourage researchers who are planning to study Carabelli trait to refer to the the plaque of Hanihara and plaque P12B of Dahlberg prior to commencing any study, as these earlier, often over-looked works, provide valuable insights into the rationale and limitations of the classification systems used most commonly nowadays, for example, the ASU system which is based on Dahlberg’s plaque P12A.
One area that deserves further exploration is comparison of the expression of Carabelli trait on the external surface of dental crowns with its expression at the dentino-enamel junction, a structure that reflects the folding of the internal enamel epithelium of the developing tooth. Researchers such as Kraus (1952), Korenhof (1963), Sasaki and Kanazawa (1999), Avishai et al. (2004) and Skinner et al. (2009) have all explored the morphology of the dentino-enamel junction using different approaches. We plan to extend these studies by applying micro-CT scanning to exfoliated molar teeth of MZ twins where there are differences in phenotypic expression of Carabelli trait within and between co-twins.
In conclusion, we would like to reiterate the comments of Mayhall (1999) who emphasized the need for “more and better genetic studies” of dental morphological traits and the need to improve our understanding of “why the traits we observe are as they appear.”
ACKNOWLEDGEMENTS
The support of the National Health and Medical Research Council of Australia is gratefully acknowledged. We particularly thank the twins and their families who have agreed to participate in the research project and the Australian Twin registry for their continuing assistance. The assistance of Ms. Sandra Pinkerton and Dr Daniela
Ribeiro is also greatly appreciated.
LITERATURE CITED
Adler C. 2006. Sexual dimorphism in the morphometric crown traits in the deciduous dentition of a Caucasoid Australian sample. Bachelor of Science (Honours) thesis, Department of Anatomy and Histology, The University of Sydney.
Alvesalo L, Nuutila M, Portin P. 1975. The cusp of Carabelli. Occurrence in first upper molars and evaluation of its heritability. Acta Odont Scand 33:191-197.
Avishai G, Muller R, Gabet Y, Bab I, Zilberman U, Smith P. 2004. New approach to quantifying developmental variation in the dentition using serial microtomographic imaging. Micro Res Tech 65:263-269.
Cucina A, Wrobel G. 2008. Dental morphology of the ancient Maya: an analysis of interobserver error. 14th International Symposium on Dental Morphology, Griefswald, Germany (Abstract O 64).
Dahlberg AA. 1956. Materials for the establishment of standards for classifications of tooth characters, attributes and techniques in morphological studies of the dentition. Mimeo associated with plaster casts. Chicago, Zoller Laboratory of Dental Anthropology, University of Chicago, 24 p.
Dahlberg AA. 1963. Analysis of the American Indian dentition. In: Brothwell DR, editor. Dental anthropology. Oxford, Pergamon Press, p 149-177.
Eaves LJ. 1982. The utility of twins. In: Anderson VE, Hauser WA, Penry JK, and Sing CF, editors. Genetic basis of the epilepsies. New York: Raven Press, p 249-276.
Goose DH, Lee GTR. 1971. The mode of inheritance of Carabelli’s trait. Hum Biol 43:64-69.
Hanihara K. 1961. Criteria for classification of crown characters of the human deciduous dentition. J Anthrop Soc Japan 69:27-45.
Harris EF. 1977. Anthropologic and genetic aspects of the dental morphology of Solomon Islanders, Melanesia. PhD thesis. University Microfilms, Michigan, Ann Arbor.
Kieser JA. 1984. An analysis of the Carabelli trait in the mixed deciduous and permanent human dentition. Arch Oral Biol 29:403-406.
Kieser JA, Merwe CA. 1984. Classificatory reliability of the Carabelli trait in man. Arch Oral Biol 29:795-801.
Korenhof CAW. 1963. The enamel-dentine border: anew morphological factor in the study of the (human) molar pattern. Ned Tijdschr Tandheelk Suppl 70:30-57.
Kraus BS. 1952. Morphologic relationship between enamel and dentin surfaces of lower first molar teeth. J Dent Res 31:248-256.
Mayhall JT. 1999. The dental complex: a morphological smokescreen or compass? In: Townsend G, Kieser J, editors. Perspectives in Human Biology, vol 4, no.
Y. HASEGAWA ET AL.

15CARABELLI TRAIT IN AUSTRALIAN TWINS
3, Dento-facial Variation in Perspective. Centre for Human Biology, The University of Western Australia, Nedlands, p 1-7.
Meredith HV, Hixon EH. 1954. Frequency, size, and bilateralism of Carabelli’s tubercle. J Dent Res 33:435-440.
Pinkerton S, Townsend G, Richards L, Schwerdt W, Dempsey P. 1999. Expression of Carabelli trait in both dentitions of Australian twins. In: Townsend G, Kieser J, editors. Perspectives in Human Biology, vol 4, no. 3, Dento-facial Variation in Perspective. Centre for Human Biology, The University of Western Australia, Nedlands, p 19-28.
Sasaki K, Kanazawa E. 1999. Morphological traits on the dentino-enamel junction of lower deciduous molar series. In: Mayhall JT, Heikkinen T, editors. Proceedings of the 11th International Symposium on Dental Morphology, Oulu, Finland, 1198. Oulu University Press, Oulu, Finland, p 167-178.
Saunders SR, Mayhall JT. 1982. Developmental patterns of human dental morphological traits. Arch Oral Biol 27:45-49.
Scott GR. 1980. Population variation of Carabelli’s trait. Hum Biol 52:63-78.
Shapiro MMJ. 1949. The anatomy and morphology of the tubercle of Carabelli. J Dent Assoc South Africa 4:355-362.
Skinner MM, Gunz P, Wood BA, Hublin J-J. 2009 How many landmarks? Assessing the classification accuracy of Pan lower molars using a geometric morphometric analysis of the occlusal basin as seen at the enamel-dentine junction. In: Koppe T, Meyer G, Alt KW, editors. Comparative dental morphology, frontiers in oral biology. Basel: Karger. p 23-29.
Townsend GC, Brown T. 1981. The Carabelli trait in Australian Aboriginal dentition. Arch Oral Biol 26:809-814.
Townsend GC, Martin NG. 1992. Fitting genetic models to Carabelli trait data in South Australian twins. J Dent Res 71:403-409.
Townsend G, Hughes T, Luciano M, Brook A. 2009. Genetic and environmental influences on human dental variation: limitations and advantages of studies involving twins. Arch Oral Biol 54S1:S45-S51.
Turner CG II, Nichol CR, Scott GR. 1991. Scoring procedures for key morphological traits of the permanent dentition: the Arizona State University Dental Anthropology System. In: Kelley MA, Spencer Larsen CS, editors. Advances in dental anthropology, New York: Wiley-Liss, p 13-31.

16
Many studies of dental maturation during the last 50 years have described the timing of permanent tooth formation stages. Several reports remain important because they include very young children and follow individuals longitudinally (Moorrees et al., 1963) or use clearly defined stages and a large sample (Demirjian et al., 1973; Demirjian and Goldstein, 1976; Demirjian and Levesque, 1980; Demirjian, 1994), although none give full descriptive results. The ease of statistical analyses and a better understanding of age estimation have highlighted the lack of descriptive data of the timing of tooth formation stages. This paper presents detailed results from a collaboration of published cross-sectional studies organised by Nils Chaillet in Canada that has resulted in several published reports including a polynomial approach to Demirjian’s dental maturity scale (Chaillet et al., 2004; Chaillet et al., 2005) and maturity data of individual tooth stages (Liversidge et al., 2006). Tooth formation data are presented here in different formats to assess maturity and estimate age using developing teeth in living children, in forensic cases, or in archaeological cases where sex is uncertain.
MATERIAL AND METHODS
Tooth formation data from dental radiographs using Demirjian stages (Demirjian et al., 1973; 1976; Demirjian, 1994) were combined to form the International Data Base. The sample consisted of cross-sectional data from published studies from Finland, Sweden, England, Korea, Belgium, Australia, Belgium, Canada and France (Nyström et al., 1986; Nyström et al., 1988; Kataja et al., 1989; Liversidge and Speechly, 2001; Teivens and Mörnstad, 2001; Willems et al., 2001; McKenna et al., 2002; Chaillet and Demirjian,
Demirjian Stage Tooth Formation Results from a Large Group of ChildrenHelen M. Liversidge
Queen Mary University of London, Barts and The London School of Medicine and Dentistry, London, United Kingdom
Correspondence to: Helen M. Liversidge, Institute of Dentistry, Turner Street, E1 2AD, London, United KingdomEmail: [email protected]
ABSTRACT The aim of this study is to present further data on the timing and variation of individual permanent mandibular teeth using Demirjian stages from a large collaboration. Seven mandibular permanent teeth were assessed from dental radiographs of healthy dental patients from Australia, Belgium, Canada, England, Finland, France, South Korea and Sweden (cross-sectional study; n = 9,371, 4,710 males, 4,661 females; aged 2–18). Data are presented in three ways, namely by tooth stage for males, females, and pooled sex. Mean age at entry of each tooth formation stage (maturity data) was calculated
using logistic regression and modified for age prediction. The 51% confidence interval for age within stage of individual tooth stages was calculated for use in forensic age estimation where the burden of proof is on the balance of probabilities. Average age, standard deviation, standard error, 3rd and 97th percentile within tooth stage was calculated from a uniform age sample (171 for each year of age from 3 to 16, n = 2,394). Modified maturity data and average age within stage from the uniform age distribution are two new methods of age estimation. Dental Anthropology 2010;23(1):16-23.
2004). The sample studied in this paper, after cleaning was radiographic data from 4,710 males and 4,661 females aged 2 to 18 (when all individuals had reached second molar maturity) shown in Figure 1 (left). Previous results of the timing of Demirjian tooth stages of individual teeth are available for males and females for each group separately (Finland, Sweden, England, Korea, Belgium, Australia, Belgium, Canada and France) and for all groups combined for individuals from age 2 up to and including 16 years of age (Table 9 in Liversidge et al., 2006).
Mean age of entering a tooth stage was calculated by logistic regression for males, females and sexes combined (Table 1). Logistic regression calculates the average age at entry of a specific formation stage and represents the age when half of children at that age, have reached or passed the stage (Taranger, 1976; Eveleth and Tanner, 1990; Cameron, 2004) and is similar to probit regression used to calculate mean age of tooth eruption (Liversidge, 2003). In this regard the mean age is identical to median age, half of children enter the stage prior to mean age, and half enter subsequent to mean age. This is an appropriate method to compare maturation between groups; it is not equivalent to the mean or median age of a child in the specific maturity stage (see below). Maturity data were modified for each stage of each developing tooth (Table 2) by adding half the interval to the next stage (see Smith, 1991). The second way of presenting results is the 51% confidence interval of age

17
for each individual tooth stage. This was calculated using the 24.5th and 75.5th percentiles of average age within stage (Table 10 from Liversidge et al., 2006) and is shown in Table 3. This is slightly greater than the inter-quartile range and just over half of individuals in the specific stage will fall within this interval. The third way data are presented is average age within stage from a uniform age sample. The age cohort with the lowest number of children was 171 for three year olds (87 male, 84 female) and 87 males and 84 females were randomly selected from each year of age from 3 to 16 (total n 2,394, Figure 1 right). Descriptive statistics of age within individual tooth formation stages, including 3rd and 97th percentiles (using the normal deviate, see Cole, 2002) were calculated from this group and are shown in Table 4. This is referred to as L10a in Liversidge et al. (2010) in a comparison of dental age estimation methods using the same target sample of Maber et al. (2006).
RESULTS AND DISCUSSION
Maturity data representing the average age entering a tooth formation stage (age when half of children have reached or passed the stage) are shown in Table 1. The ages when 3% and 97% of girls and boys had entered some stages including D (crown complete with initial root) and H (mature apex) are shown in Figure 2. The left and right hand edges of the open diamond are the ages when 3% and 97% of girls had reached or passed this stage. Filled diamonds are data for boys. The sex difference is smaller for earlier stages and greatest for stage H (mature apex) of the canine. This is the only appropriate measure of the final maturity stage. Smoothed cumulative frequency distribution curves are shown for M2 stages in Figure 3. This is the only tooth in this study where data are available from crypt stage to mature apex; however the variation for early tooth stages is probably unrepresentative as
Fig. 1. Age and sex of radiographic sample (left), selected group for a uniform age distribution (right).
Fig. 2. Timing of some Demirjian tooth stages including D (crown complete with initial root) and H (mature apex). Diamond extends from 3rd to 97th percentile, apex is mean age. Open diamonds females, solid diamonds males.
this collaborative study includes only 38 two year olds. Maturity data modified for age prediction are shown in Table 2 (referred to as L9a in Liversidge et al., submitted). Once a tooth reaches the most mature stage (apex closed with mature periodontal ligament width) age cannot be estimated using development and this stage is omitted from tables of modified maturity data and within stage data. The second type of result is the 51% confidence interval (Table 3, Figure 4) similar to what Koningsberg et al. (2008) term ‘coverage’. This interval is useful when estimating age in forensic cases where the burden of proof is on the balance of probabilities. Coverage also
DEMIRJIAN TOOTH FORMATION STAGES
18
Males Alone Females Alone Sexes PooledMandibular Mean for Mean for Mean for Tooth Grade prediction sd prediction sd prediction sd
I1 E 4.39 0.44 4.24 0.42 4.33 0.43 F 6.02 0.38 5.70 0.36 5.88 0.38 G 6.97 0.40 6.68 0.37 6.82 0.39 H 8.35 0.60 7.84 0.57 8.09 0.60 I2 E 5.21 0.47 4.87 0.42 5.05 0.46 F 6.68 0.38 6.28 0.37 6.49 0.39 G 7.82 0.47 7.32 0.44 7.56 0.47 H 9.41 0.65 8.79 0.59 9.09 0.65 C D 4.75 0.59 4.19 0.53 4.49 0.59 E 6.60 0.45 5.99 0.44 6.31 0.47 F 8.51 0.51 7.59 0.50 8.04 0.56 G 11.04 0.61 9.84 0.56 10.42 0.67 H 13.23 0.64 11.73 0.68 12.47 0.80 P1 C 3.58 0.40 3.41 0.35 3.49 0.39 D 5.56 0.43 5.28 0.41 5.43 0.43 E 7.26 0.49 6.78 0.43 7.02 0.48 F 9.19 0.53 8.70 0.49 8.94 0.53 G 11.44 0.62 10.70 0.58 11.05 0.63 H 13.03 0.64 12.27 0.65 12.64 0.69 P2 B 3.81 0.57 3.80 0.55 3.81 0.56 C 4.94 0.55 4.81 0.55 4.89 0.55 D 6.48 0.57 6.21 0.56 6.35 0.57 E 8.02 0.58 7.62 0.64 7.82 0.62 F 9.83 0.69 9.35 0.60 9.58 0.65 G 12.26 0.75 11.57 0.71 11.90 0.76 H 14.09 0.73 13.44 0.76 13.77 0.78 M1 E 3.99 0.32 3.81 0.38 3.91 0.35 F 5.46 0.41 5.21 0.41 5.35 0.42 G 6.84 0.48 6.42 0.45 6.64 0.46 H 9.95 0.71 9.33 0.68 9.64 0.71 M2 O 3.40 0.30 2.92 0.51 3.19 0.40 A 3.46 0.33 3.33 0.42 3.40 0.37 B 3.97 0.33 3.72 0.46 3.87 0.38 C 4.91 0.44 4.85 0.44 4.88 0.42 D 6.79 0.52 6.43 0.54 6.61 0.54 E 8.80 0.56 8.48 0.52 8.64 0.55 F 10.68 0.60 10.12 0.56 10.39 0.60 G 12.18 0.60 11.57 0.60 11.86 0.63 H 15.22 0.71 14.75 0.77 14.99 0.75
TABLE 1. Mean age of entering Demirjian tooth stages for mandibular permanent teeth recalculated from cleaned data using logistic regression of 4,710 males and 4,661 females1
1These statistics represent the age when half of children have reached or passed the stage. Code O refers to crypt formation prior to evidence of tooth mineralization.
provides a means to test if a target sample is representative (Konigsberg et al., 2008); 24.5% should fall below the interval, 51% within the interval and 24.5% above. The third type of result is average age within stage from a uniform age distribution (similar number of individuals in each age category). Konigsberg and Frankenberg (1992) suggest that age could be more accurately estimated using a reference sample based on a uniform age distribution.
Results of this type from this study are shown in Table 4 and are referred to as L10a in Liversidge et al. (submitted). This flat age distribution, together with an adequate sample size and wide age range, are important features of a reference sample that contribute to accuracy (Konigsberg and Frankenberg, 2002; Konigsberg et al., 2008).
Understanding how maturity data differ to within stage data is challenging and Figure 5 illustrates some of these
H.M. LIVERSIDGE.

19
Males Alone Females Alone Sexes PooledMandibular Mean for Mean for Mean for Tooth Grade prediction sd prediction sd prediction sd
I1 E 5.24 0.44 5.01 0.42 5.11 0.43 F 6.48 0.38 6.18 0.36 6.35 0.38 G 7.64 0.40 7.29 0.37 7.45 0.39 I2 E 5.94 0.47 5.62 0.42 5.77 0.46 F 7.20 0.38 6.86 0.37 7.02 0.39 G 8.56 0.47 8.06 0.44 8.32 0.47 C D 5.68 0.59 5.09 0.53 5.40 0.59 E 7.64 0.45 6.83 0.44 7.18 0.47 F 9.86 0.51 8.76 0.50 9.23 0.56 G 12.14 0.61 10.80 0.56 11.44 0.67 P1 C 4.61 0.40 4.37 0.34 4.46 0.39 D 6.34 0.43 5.99 0.41 6.22 0.43 E 8.20 0.49 7.82 0.43 7.98 0.48 F 10.32 0.53 9.83 0.49 10.00 0.53 G 12.24 0.62 11.49 0.58 11.84 0.63 P2 B 4.41 0.57 4.30 0.54 4.34 0.56 C 5.62 0.55 5.46 0.55 5.62 0.55 D 7.16 0.57 6.86 0.56 7.08 0.57 E 8.90 0.58 8.48 0.64 8.70 0.62 F 11.04 0.69 10.50 0.60 10.74 0.65 G 13.19 0.75 12.56 0.71 12.84 0.76 M1 E 4.80 0.32 4.58 0.38 4.63 0.35 F 6.20 0.41 5.81 0.41 6.00 0.42 G 8.38 0.48 7.84 0.45 8.14 0.46 M2 O 3.43 0.30 3.12 0.51 3.30 0.40 A 3.65 0.33 3.74 0.42 3.64 0.37 B 4.35 0.33 4.74 0.46 4.38 0.38 C 5.59 0.44 5.84 0.44 5.75 0.42 D 7.45 0.52 7.78 0.54 7.62 1.05 E 9.35 0.56 9.74 0.52 9.52 1.10 F 10.84 0.60 11.46 0.56 11.13 1.15 G 12.92 0.60 13.74 0.60 13.42 1.20
TABLE 2. Maturity data modified for age prediction for mandibular permanent tooth stages
differences. Smoothed cumulative distribution curves for stages D, E and F of M2 (sexes pooled) are shown. These curves represent the increasing proportion of children at each age who have reached or passed the specific stage. A tooth is considered to be ‘in’ a stage until it enters the next stage. The shaded area shows the age interval of all individuals within stage D; ranging from the youngest (most dentally advanced) to the oldest individual in that stage (most dentally delayed). Maturity is a continuum and we arbitrarily divide this into discrete stages, even though the process of maturation is gradual. Stage D in molars is defined as crown complete with initial root spicules visible at the mesial and distal edges. These root spicules increase in length and the root bifurcation becomes visible, firstly as a dot or line, then as a semi-lunar radio-opacity. Once this occurs, the tooth is deemed to be in stage E. The three types of tooth data in this study are summarised in Figure 5. Mean age at entry for M2 stage D is shown as a dot,
maturity data modified for age prediction for this stage is shown as a triangle. The age interval for individuals ‘in’ stage D, extends from the youngest child in stage D, up to the age when the most delayed child leaves this stage and enters the next stage (when all individuals have entered stage E). The age range of individuals within stage D and E are marked. The 51% age coverage for stage D is also shown. This figure was chosen for the forensic odontologist where the burden of proof is ‘on the balance of probabilities.’ This is an expression of the probability of estimated age being on one side of an age threshold. If an individual of unknown age presents with a second permanent molar in stage D (crown complete with initial root), the 51% age interval (from Table 3) is 7.01 to 8.50. On the balance of probabilities, the age of this individual is older than six but younger than nine.
The existence of population differences in dental maturity is unclear and uncertain. Many studies report
DEMIRJIAN TOOTH FORMATION STAGES

20 H.M. LIVERSIDGE.
Males (n = 4,710) Females (n = 4,661) Combined (n = 9,371) Tooth Grade n 24.5% 75.5% n 24.5% 75.5% n 24.5% 75.5%
I1 D 222 3.62 4.70 162 3.49 4.48 384 3.54 4.58 E 425 4.73 5.91 297 4.58 5.60 722 4.67 5.80 F 308 6.05 7.03 269 5.80 6.83 577 5.98 6.99 G 561 7.25 8.57 460 7.01 8.09 1021 7.10 8.30 I2 C 42 3.38 4.21 29 2.83 4.05 71 3.06 4.10 D 386 4.08 5.20 253 3.80 4.95 639 3.98 5.03 E 425 5.39 6.60 335 5.10 6.19 770 5.23 6.46 F 428 6.96 8.00 353 6.50 7.64 781 6.72 7.95 G 684 8.01 9.54 643 7.67 8.97 1327 7.90 9.10 C C 327 3.85 5.01 173 3.52 4.62 500 3.71 4.93 D 512 5.00 6.51 370 4.72 5.96 882 4.92 6.27 E 745 6.99 8.40 542 6.46 7.78 1287 6.79 8.06 F 1063 8.97 10.60 995 8.00 9.58 2058 8.43 10.06 G 800 11.02 12.97 817 10.00 11.65 1617 10.44 12.30 P1 A 20 2.57 3.34 21 2.59 3.33 B 69 3.33 4.26 55 3.01 3.79 124 3.10 4.07 C 433 4.38 5.44 308 4.18 5.28 741 4.28 5.40 D 554 5.95 7.20 406 5.60 6.95 960 5.78 7.05 E 803 7.67 9.00 795 7.20 8.53 1598 7.47 8.96 F 918 9.40 11.00 889 8.90 10.54 1807 9.05 10.92 G 580 11.32 12.97 657 10.63 12.10 1237 10.96 12.70 P2 O 10 2.39 4.92 16 2.67 4.52 A 89 3.54 4.72 77 3.30 4.44 166 3.45 4.60 B 222 4.27 5.21 160 4.19 5.33 382 4.23 5.23 C 446 5.17 6.68 338 5.06 6.48 784 5.10 6.58 D 570 6.70 8.10 494 6.61 7.96 1064 6.66 8.01 E 769 8.06 9.87 744 7.86 9.05 1513 7.99 9.46 F 945 9.98 11.97 969 9.64 11.39 1914 9.83 11.76 G 626 12.00 13.98 708 11.32 13.29 1334 11.70 13.74 M1 D 131 3.31 4.22 100 3.22 4.03 231 3.25 4.14 E 358 4.47 5.42 247 4.25 5.23 605 4.39 5.38 F 432 5.66 9.53 313 5.42 6.56 745 5.56 6.90 G 1279 7.70 9.53 1187 7.28 9.00 2466 7.50 9.20 M2 O 19 2.89 3.91 28 3.11 4.28 A 66 3.68 4.49 42 3.54 4.56 108 3.60 4.52 B 215 4.31 5.05 175 4.08 5.00 390 4.20 5.02 C 562 5.39 6.78 402 5.28 6.65 964 5.32 6.72 D 799 7.10 8.70 791 6.98 8.30 1590 7.01 8.50 E 794 8.98 10.48 734 8.57 10.01 1528 8.80 10.25 F 572 10.55 12.03 629 10.04 11.59 1201 10.25 11.97 G 983 12.53 14.50 1096 11.97 13.98 2079 12.02 14.11
TABLE 3.Fifty one percent coverage for mandibular tooth stages1
1This age interval includes 51% of individuals within each stage. Stage included if n ≥ 10
significant differences in average age within tooth stage between groups, but this is inappropriate to compare maturity or average age at entry. For example, imagine if the minimum age of a study was 7 and the average age at entry of M2 stage D is calculated. Looking at Figure 5, this will exclude many individuals younger than 7 who have entered this stage. Looking at the cumulative incidence curve for stage D, it is clear that more than half of 7 years old in this large study have M2 in stage D (or later), indicating
that a minimum age of 7 is too old to calculate the average age for this stage. Significant differences between groups have also been shown using a single dental maturity score such as Nolla (Nolla, 1960) or Demirjian (Demirjian et al., 1973; 1976; Demirjian, 1994). These have been interpreted as due to either a secular trend or regional differences in dental maturation but little attempt has been made to investigate this more fully. There is little doubt that these differences occur, but it is questionable if they have any

21
differences and similarities indicate, but no clear pattern or developmental shift is evident.
Most studies of dental maturity are based on children of European origin. Mean age at entry for individual tooth stages was compared in the groups of this collaborative study. Children in Canada, Finland, Sweden, Belgium, England, France, Australia and a small group from Korea showed a wide age range of individuals within each tooth stage with many similarities in average age at entry (Liversidge et al., 2006). No single tooth type was consistently earlier or later and no clear pattern emerged from this analysis. A comparison of mean age at entry of tooth stages by Moorrees et al. (1963) on White and Bangladeshi children aged 2 to 22 in London, United Kingdom showed few significant differences in mean age between these ethnic groups (Liversidge 2009). The lack of published data of dental maturity from other regions of the world is sparse, but being addressed. Preliminary results from a worldwide comparative study showing stage H (apex mature) of the mandibular first molar in girls is shown in Figure 7. Smoothed cumulative distribution curves and 95% confidence interval of mean age (calculated from one year age groups using probit regression) are shown from the following regions: Australian Aboriginal (Liversidge and Townsend, 2006), Inuit, Japanese, Maori and Pacific Islanders (Moananui et al., 2008), South African Black and Cape Coloured, UK, Bangladeshi and White (Liversidge, 2009). The most advanced girls (youngest) girls in this stage are 6 years old and by 12, almost all have reached this stage. The average age at entry, when 50% of girls have reached this stage, is similar between groups, although two groups are slightly earlier than the others.
These similarities between the reference study and the present study and between world groups are supported by recent histological findings in the duration of crown formation (Reid and Dean 2006) between the past and the present. For instance, molar crowns take around 3 to 3.4 years to develop in maxillary, mandibular, first, second and third molars from Medieval Danes, northern European, South African Black and North American groups (Reid and Dean, 2006). The largest permanent crowns are found in Australian aborigines and the duration of enamel formation in molars in three first molars from this group is from 3 to 3.5 years (pers. comm. DJ Reid). Despite little documentation of the rate of dentine growth and root formation between individuals or groups, these findings suggest that the time it takes to grow a tooth is similar across time and between groups, especially at the resolution of crown and root fractions from radiographs.
Assessing maturity or estimating age from crown and root stages is usually used for an individual child. In this regard the individual is compared to reference data while, in human biology, differences between groups are of interest. Small differences in the mean age of individual tooth stages at the group level have little influence on the estimated age for an individual. Population specific reference data of radiographic tooth stages may be
Fig. 3. Smoothed cumulative distribution curves (proportion of individuals and age) for stages crypt to H for the permanent mandibular second molar (sexes pooled).
Fig. 4. Age interval of 51% coverage for stages A to G of permanent teeth (pooled sex).
biological meaning. The time interval between the original study Demirjian
et al. (1973) and the present collaboration is between twenty to forty years. Mean age at entry of individual tooth stages in girls from the Canadian reference (triangles apex at bottom; Demirjian and Levesque, 1980) and this study (triangles apex at top) are shown in Figure 6. The largest differences occur as a single stage difference in four teeth; the earliest stage with data for both incisors and canine and the second stage for first premolars with mean age in the recent study being later than the original reference. The mean ages in subsequent stages in these teeth are similar or close in age. A comparison of the most mature stage in all tooth types is similar or marginally earlier in the recent study compared to the reference. It is unclear what these
DEMIRJIAN TOOTH FORMATION STAGES
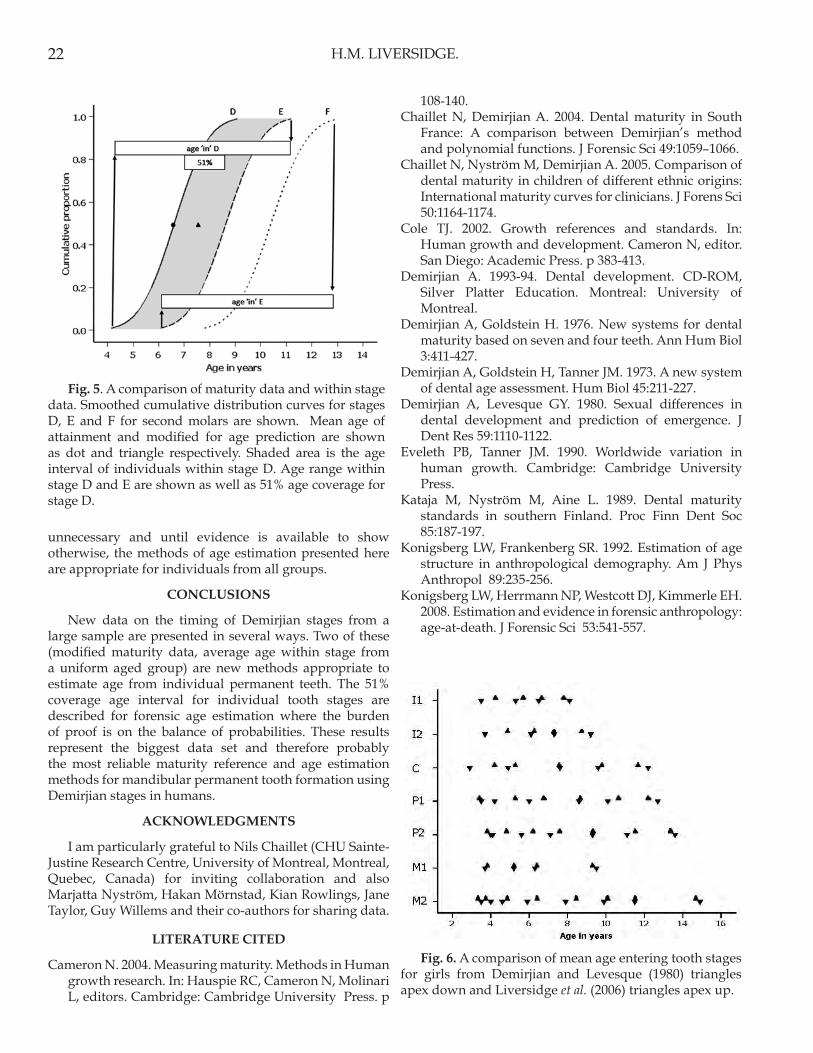
22
108-140.Chaillet N, Demirjian A. 2004. Dental maturity in South
France: A comparison between Demirjian’s method and polynomial functions. J Forensic Sci 49:1059–1066.
Chaillet N, Nyström M, Demirjian A. 2005. Comparison of dental maturity in children of different ethnic origins: International maturity curves for clinicians. J Forens Sci 50:1164-1174.
Cole TJ. 2002. Growth references and standards. In: Human growth and development. Cameron N, editor. San Diego: Academic Press. p 383-413.
Demirjian A. 1993-94. Dental development. CD-ROM, Silver Platter Education. Montreal: University of Montreal.
Demirjian A, Goldstein H. 1976. New systems for dental maturity based on seven and four teeth. Ann Hum Biol 3:411-427.
Demirjian A, Goldstein H, Tanner JM. 1973. A new system of dental age assessment. Hum Biol 45:211-227.
Demirjian A, Levesque GY. 1980. Sexual differences in dental development and prediction of emergence. J Dent Res 59:1110-1122.
Eveleth PB, Tanner JM. 1990. Worldwide variation in human growth. Cambridge: Cambridge University Press.
Kataja M, Nyström M, Aine L. 1989. Dental maturity standards in southern Finland. Proc Finn Dent Soc 85:187-197.
Konigsberg LW, Frankenberg SR. 1992. Estimation of age structure in anthropological demography. Am J Phys Anthropol 89:235-256.
Konigsberg LW, Herrmann NP, Westcott DJ, Kimmerle EH. 2008. Estimation and evidence in forensic anthropology: age-at-death. J Forensic Sci 53:541-557.
Fig. 5. A comparison of maturity data and within stage data. Smoothed cumulative distribution curves for stages D, E and F for second molars are shown. Mean age of attainment and modified for age prediction are shown as dot and triangle respectively. Shaded area is the age interval of individuals within stage D. Age range within stage D and E are shown as well as 51% age coverage for stage D.
unnecessary and until evidence is available to show otherwise, the methods of age estimation presented here are appropriate for individuals from all groups.
CONCLUSIONS
New data on the timing of Demirjian stages from a large sample are presented in several ways. Two of these (modified maturity data, average age within stage from a uniform aged group) are new methods appropriate to estimate age from individual permanent teeth. The 51% coverage age interval for individual tooth stages are described for forensic age estimation where the burden of proof is on the balance of probabilities. These results represent the biggest data set and therefore probably the most reliable maturity reference and age estimation methods for mandibular permanent tooth formation using Demirjian stages in humans.
ACKNOWLEDGMENTS
I am particularly grateful to Nils Chaillet (CHU Sainte-Justine Research Centre, University of Montreal, Montreal, Quebec, Canada) for inviting collaboration and also Marjatta Nyström, Hakan Mörnstad, Kian Rowlings, Jane Taylor, Guy Willems and their co-authors for sharing data.
LITERATURE CITED
Cameron N. 2004. Measuring maturity. Methods in Human growth research. In: Hauspie RC, Cameron N, Molinari L, editors. Cambridge: Cambridge University Press. p
Fig. 6. A comparison of mean age entering tooth stages for girls from Demirjian and Levesque (1980) triangles apex down and Liversidge et al. (2006) triangles apex up.
H.M. LIVERSIDGE.
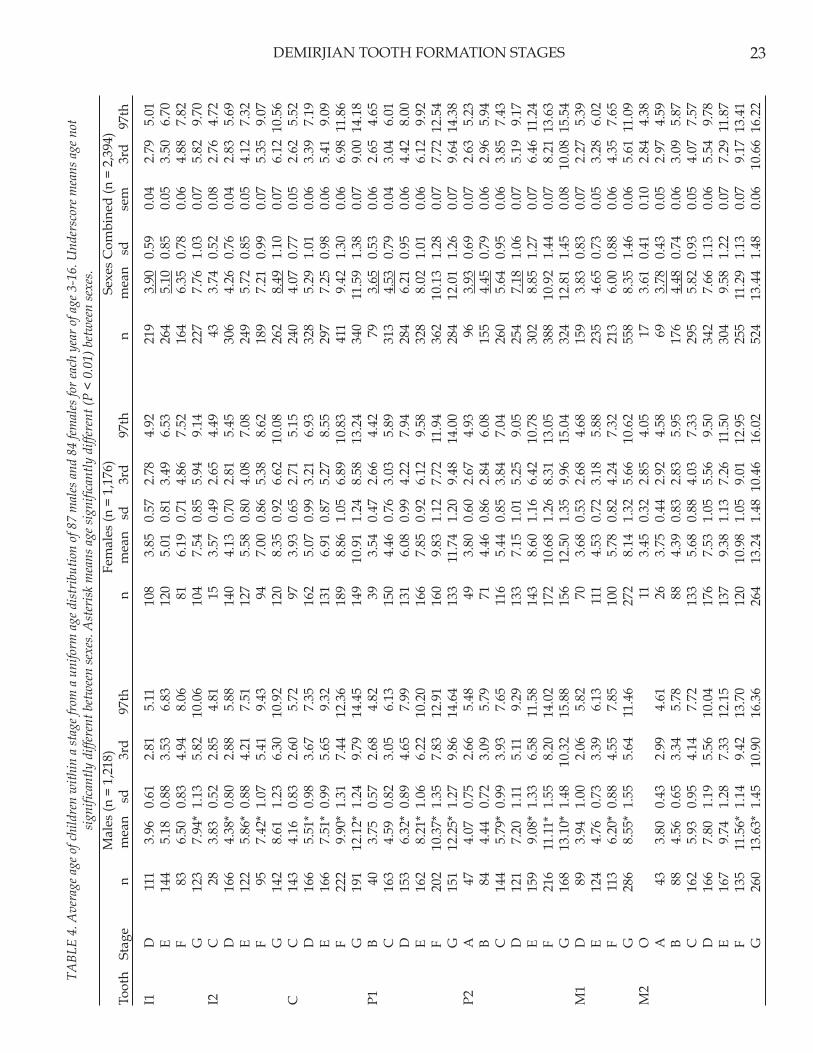
23
M
ales
(n =
1,2
18)
Fem
ales
(n =
1,1
76)
Sexe
s C
ombi
ned
(n =
2,3
94)
Toot
h St
age
n m
ean
sd
3rd
97th
n
mea
n sd
3r
d 97
th
n m
ean
sd
sem
3r
d 97
th
I1
D
111
3.96
0.
61
2.81
5.
11
108
3.85
0.
57
2.78
4.
92
219
3.90
0.
59
0.04
2.
79
5.01
E
144
5.18
0.
88
3.53
6.
83
120
5.01
0.
81
3.49
6.
53
264
5.10
0.
85
0.05
3.
50
6.70
F
83
6.50
0.
83
4.94
8.
06
81
6.19
0.
71
4.86
7.
52
164
6.35
0.
78
0.06
4.
88
7.82
G
12
3 7.
94*
1.13
5.
82
10.0
6 10
4 7.
54
0.85
5.
94
9.14
22
7 7.
76
1.03
0.
07
5.82
9.
70I2
C
28
3.
83
0.52
2.
85
4.81
15
3.
57
0.49
2.
65
4.49
43
3.
74
0.52
0.
08
2.76
4.
72
D
166
4.38
* 0.
80
2.88
5.
88
140
4.13
0.
70
2.81
5.
45
306
4.26
0.
76
0.04
2.
83
5.69
E
122
5.86
* 0.
88
4.21
7.
51
127
5.58
0.
80
4.08
7.
08
249
5.72
0.
85
0.05
4.
12
7.32
F
95
7.42
* 1.
07
5.41
9.
43
94
7.00
0.
86
5.38
8.
62
189
7.21
0.
99
0.07
5.
35
9.07
G
14
2 8.
61
1.23
6.
30
10.9
2 12
0 8.
35
0.92
6.
62
10.0
8 26
2 8.
49
1.10
0.
07
6.12
10.
56C
C
14
3 4.
16
0.83
2.
60
5.72
97
3.
93
0.65
2.
71
5.15
24
0 4.
07
0.77
0.
05
2.62
5.
52
D
166
5.51
* 0.
98
3.67
7.
35
162
5.07
0.
99
3.21
6.
93
328
5.29
1.
01
0.06
3.
39
7.19
E
166
7.51
* 0.
99
5.65
9.
32
131
6.91
0.
87
5.27
8.
55
297
7.25
0.
98
0.06
5.
41
9.09
F
222
9.90
* 1.
31
7.44
12
.36
189
8.86
1.
05
6.89
10
.83
411
9.42
1.
30
0.06
6.
98 1
1.86
G
19
1 12
.12*
1.2
4 9.
79
14.4
5 14
9 10
.91
1.24
8.
58
13.2
4 34
0 11
.59
1.38
0.
07
9.00
14.
18P1
B
40
3.75
0.
57
2.68
4.
82
39
3.54
0.
47
2.66
4.
42
79
3.65
0.
53
0.06
2.
65
4.65
C
16
3 4.
59
0.82
3.
05
6.13
15
0 4.
46
0.76
3.
03
5.89
31
3 4.
53
0.79
0.
04
3.04
6.
01
D
153
6.32
* 0.
89
4.65
7.
99
131
6.08
0.
99
4.22
7.
94
284
6.21
0.
95
0.06
4.
42
8.00
E
162
8.21
* 1.
06
6.22
10
.20
166
7.85
0.
92
6.12
9.
58
328
8.02
1.
01
0.06
6.
12
9.92
F
202
10.3
7* 1
.35
7.83
12
.91
160
9.83
1.
12
7.72
11
.94
362
10.1
3 1.
28
0.07
7.
72 1
2.54
G
15
1 12
.25*
1.2
7 9.
86
14.6
4 13
3 11
.74
1.20
9.
48
14.0
0 28
4 12
.01
1.26
0.
07
9.64
14.
38P2
A
47
4.
07
0.75
2.
66
5.48
49
3.
80
0.60
2.
67
4.93
96
3.
93
0.69
0.
07
2.63
5.
23
B 84
4.
44
0.72
3.
09
5.79
71
4.
46
0.86
2.
84
6.08
15
5 4.
45
0.79
0.
06
2.96
5.
94
C
144
5.79
* 0.
99
3.93
7.
65
116
5.44
0.
85
3.84
7.
04
260
5.64
0.
95
0.06
3.
85
7.43
D
12
1 7.
20
1.11
5.
11
9.29
13
3 7.
15
1.01
5.
25
9.05
25
4 7.
18
1.06
0.
07
5.19
9.
17
E 15
9 9.
08*
1.33
6.
58
11.5
8 14
3 8.
60
1.16
6.
42
10.7
8 30
2 8.
85
1.27
0.
07
6.46
11.
24
F 21
6 11
.11*
1.5
5 8.
20
14.0
2 17
2 10
.68
1.26
8.
31
13.0
5 38
8 10
.92
1.44
0.
07
8.21
13.
63
G
168
13.1
0* 1
.48
10.3
2 15
.88
156
12.5
0 1.
35
9.96
15
.04
324
12.8
1 1.
45
0.08
10
.08
15.5
4M
1 D
89
3.
94
1.00
2.
06
5.82
70
3.
68
0.53
2.
68
4.68
15
9 3.
83
0.83
0.
07
2.27
5.
39
E 12
4 4.
76
0.73
3.
39
6.13
11
1 4.
53
0.72
3.
18
5.88
23
5 4.
65
0.73
0.
05
3.28
6.
02
F 11
3 6.
20*
0.88
4.
55
7.85
10
0 5.
78
0.82
4.
24
7.32
21
3 6.
00
0.88
0.
06
4.35
7.
65
G
286
8.55
* 1.
55
5.64
11
.46
272
8.14
1.
32
5.66
10
.62
558
8.35
1.
46
0.06
5.
61 1
1.09
M2
O
11
3.
45
0.32
2.
85
4.05
17
3.
61
0.41
0.
10
2.84
4.
38
A
43
3.80
0.
43
2.99
4.
61
26
3.75
0.
44
2.92
4.
58
69
3.78
0.
43
0.05
2.
97
4.59
B
88
4.56
0.
65
3.34
5.
78
88
4.39
0.
83
2.83
5.
95
176
4.48
0.
74
0.06
3.
09
5.87
C
16
2 5.
93
0.95
4.
14
7.72
13
3 5.
68
0.88
4.
03
7.33
29
5 5.
82
0.93
0.
05
4.07
7.
57
D
166
7.80
1.
19
5.56
10
.04
176
7.53
1.
05
5.56
9.
50
342
7.66
1.
13
0.06
5.
54
9.78
E
167
9.74
1.
28
7.33
12
.15
137
9.38
1.
13
7.26
11
.50
304
9.58
1.
22
0.07
7.
29 1
1.87
F
135
11.5
6* 1
.14
9.42
13
.70
120
10.9
8 1.
05
9.01
12
.95
255
11.2
9 1.
13
0.07
9.
17 1
3.41
G
26
0 13
.63*
1.4
5 10
.90
16.3
6 26
4 13
.24
1.48
10.
46
16.0
2 52
4 13
.44
1.48
0.
06
10.6
6 16
.22
TA
BLE
4. A
vera
ge a
ge o
f chi
ldre
n w
ithi
n a
stag
e fr
om a
uni
form
age
dis
trib
utio
n of
87
mal
es a
nd 8
4 fe
mal
es fo
r ea
ch y
ear
of a
ge 3
-16.
Und
ersc
ore
mea
ns a
ge n
ot
sign
ifica
ntly
diff
eren
t bet
wee
n se
xes.
Ast
eris
k m
eans
age
sig
nific
antl
y di
ffere
nt (P
< 0
.01)
bet
wee
n se
xes.
DEMIRJIAN TOOTH FORMATION STAGES

24
Liversidge HM. 2003. Worldwide variation in human dental development. In: Thompson JL, Nelson A, Krovitz G, editors. Growth and development in the genus Homo. Cambridge: Cambridge University Press. p 73-113.
Liversidge HM. 2008. Dental age revisited. In: Irish JD, Nelson GC, editors. Technique and application in dental anthropology. Cambridge: Cambridge University Press. p 234-265.
Liversidge HM. 2009. Permanent tooth formation as a method of estimating age. Front Oral Biol 13:153-157.
Liversidge HM, Chaillet N, Mörnstad H, Nyström M, Rowlings K, Taylor J, Willems G. 2006. Timing of Demirjian tooth formation stages. Ann Hum Biol 33: 454-470.
Liversidge HM, Smith BH, Maber M. 2010. Bias and accuracy of age estimation using developing teeth in 946 children. Am J Phys Anthropol (doi:10.1002/ajpa.21349).
Liversidge HM, Speechly T. 2001. Growth of permanent mandibular teeth of British children aged 4-9 years. Ann Hum Biol 28:256-262.
Liversidge HM, Townsend G. 2006. Tooth formation in Australian Aborigines. In: Zadzinska E, editor. Current trends in dental morphology research. Lodz: University of Lodz Press. p 405-410.
Maber M, Liversidge HM, Hector MP. 2006. Accuracy of age estimation of radiographic methods using developing teeth. Forensic Sci Int 159:S68-73.
McKenna CJ, James H, Taylor JA, Townsend GC. 2002. Tooth development standards for South Australia. Aust Dent J 47:223–227.
Moananui RT, Kieser JA, Herbison P, Liversidge HM. 2008. Advanced dental maturation in New Zealand Maori and Pacific Island children. Am J Hum Biol 20:43-50.
Moorrees CFA, Fanning EA, Hunt EE. 1963. Age variation of formation stages for ten permanent teeth. J Dent Res 42:1490-1502.
Nolla CM. 1960. The development of the permanent teeth. J Dent Child 27:254–266.
Nyström M, Haataja J, Kataja M, Evalahti M, Peck L, Kleemola–Kujala E. 1986. Dental maturity in Finnish children, estimated from the development of seven permanent mandibular teeth. Acta Odontol Scand 44:193–198.
Nyström M, Ranta R, Kataja M, Silvola H. 1988. Comparisons of dental maturity between the rural community of Kuhmo in north eastern Finland and the city of Helsinki. Commun Dent Oral Epidemiol 16:215–217.
Reid DJ, Dean MC. 2006. Variation in modern human enamel formation times. J Hum Evol 50:329-346.
Smith BH. 1991. Standards of human tooth formation and dental age assessment. In: Kelly MA, Larsen CS, editors. Advances in dental anthropology. New York: Wiley-Liss. p 143-168.
Taranger J. 1976. Evaluation of biological maturation by means of maturity criteria. Acta Paediatr Scand 258, suppl, 77-82.
Teivens A, Mörnstad H. 2001. A comparison between dental maturity rate in the Swedish and Korean populations using a modified Demirjian method. J Forensic Odontostomatol 19:31–35.
Willems G, Van Olmen A, Spiessens B, Carels C. 2001. Dental age estimation in Belgian children: Demirjian’s technique revisited. J Forensic Sci 46:893–895.
Fig. 7. Preliminary results of maturation of stage H of the mandibular first molar from world regions. Left: smoothed curves (proportion of girls vs. age). Right: 95% confidence interval of mean age for Australian Aborigine, Inuit, Japanese, Maori and Pacific Islanders, South African Black, South African Cape Coloured, UK Bangladeshi, UK White girls.
H.M. LIVERSIDGE.

25
Dental fusion of the primary dentition is a rare congenital anomaly. Examples in the literature of bioarchaeology are exceedingly scarce. Skeletal remains of an infant from the Law’s Site (1MS100), in Marshall County, Alabama, presents a clear case of triple fusion of the primary dentition. This is a highly unusual condition, and thus a significant find for the fields of dental anthropology and bioarchaeology.
LITERATURE REVIEW
Examples of dental fusion in the anthropological literature are uncommon, and texts on dental anthropology, developmental osteology, and paleopathology give the topic little or no attention (Aufderheide and Rodríguez-Martín, 1998; Hillson, 1996; Ortner, 2003; Scheuer and Black, 2000). Two fused deciduous mandibular incisors are shown in Figure 1.1 of The Anthropology of Modern Teeth (Scott and Turner, 1997: 5), but neither the defect nor the provenance of the specimen is discussed in detail. A rare “talon cusp” found on a deciduous lateral incisor was the primary topic of a case report of a juvenile skeleton excavated in England, though the report states that “the affected incisor also shows abnormal widening, probably representing a double tooth”, and mentions the presence of a supernumerary permanent incisor (Mays, 2004:206). It is unclear if this “double tooth” is an actual case of dental fusion, or a case of gemination, defined as the unsuccessful or incomplete division of one tooth germ into two (Canut Brusola, 1988; Oliván Rosas et al. 2004). Some authors agree that distinction between fusion and gemination can sometimes be confusing, and the term “double teeth” should be used when the diagnosis is inconclusive (Andlaw and Rock, 1999; Gonzalez Marquez and Mendez-Nuñez, 1993; Killian and Croll, 1990; Oliván Rosas et al., 2004; Uys and Morris, 2005).
Although there is little in anthropological sources concerning the topic of dental fusion, there have been some relevant clinical studies on modern populations, and some patterns have been documented regarding this dental anomaly. These clinical studies agree that fusion in the primary dentition usually affects two teeth
Triple Fusion in the Primary Dentition from Law’s Site, Alabama (1MS100): A Case ReportBrian D. Padgett
Frankfort, KY
Correspondence to: Brian D. Padgett, 313 Juniper Drive, Frankfort, KY 40601E-mail: [email protected]
ABSTRACT Dental fusion of the primary dentition is a rare congenital anomaly. Evidence in the literature of bioarchaeology is scarce. Burial MS100-14 was recovered from Law’s Site on Pine Island, in Marshall County, Alabama. Analysis of the remains found that MS100-14
presented a clear case of triple fusion of primary dentition in the maxilla. This appears to be the first case of triple fusion reported from among prehistoric Native American remains in the Southeastern United States. Dental Anthropology 2010;23(1):25-27.
unilaterally in the mandibular arch, and most often in the anterior region; that is, either two incisors, an incisor and a canine, or a supernumerary tooth fused with an incisor (Barberia et al., 2001; Cheng et al., 2003; Favalli et al., 1998; Modrizuki et al., 1999; Oliván Rosas et al., 2004; Yonezu et al., 1997).
Studies among European, (Asian) Indian, and Turkish populations reveal a prevalence of less than 1% for double fusion in primary dentition (Aquiló et al., 1999; Barberia Leache and Boj Quesada, 2001; Boj Quesada 1990; Bruce et al., 1994; Erdem et al., 2001; Reddy and Munshi, 1999). North American populations have a prevalence ranging from 0.14 to 3% (Hagman, 1988). A study in Shenyang city, China, reported 1.52% prevalence among children there (Cheng et al., 1999). The prevalence appears to be highest in Japan, where 4.1 to 5% of children studied presented this anomalous feature, and unlike other populations, there was a tendency regarding sex, as a significantly higher proportion of boys displayed congenital dental fusion (Modrizuki et al., 1999; Yonezu et al., 1997).
As rare as double fusion appears to be, it is not surprising that triple fusion of primary dentition is even less common. In the study of Indian children (n = 4,205), there was no case of triple fusion (Reddy and Munshi, 1999), though a separate team from India reports the case of a child with triple fusion involving two ipsilateral incisors and a supernumerary tooth (Prabhakar et al., 2004). Among Chinese children studied (n = 4,286), only one case of triple fusion was found, involving two ipsilateral incisors and the adjoining canine (Cheng et al., 1999). The prevalence of “triplication of primary teeth” among Turkish children was stated as 0.02% (Erdem et al., 2001).
Problems associated with the congenital fusion of primary dentition may include an increased susceptibility to caries in the fused teeth (Reddy and Munshi, 1999).

26
There is also an association between fusion of primary dentition and agenesis of the corresponding permanent teeth; with regard to this condition, various authors cite percentages of incidence ranging from 20 to 75%, the occurrence of which may depend on which teeth are fused (Aquiló et al., 1999; Barberia Leache and Boj Quesada, 2001; Boj Quesada 1990; Canut Brusola 1988; Oliván Rosas et al., 2004; Ostos Garrido and Peñalva Sanchez, 1996; Hagman, 1988; Reddy and Munshi, 1999).
MATERIALS AND METHODS
A standard osteological analysis was performed on the skeletal remains recovered from Law’s Site (1MS100). The Law’s Site was a village on the southern end of Pine Island in Marshall County, Alabama. The site was excavated in 1938 by the Works Project Administration (WPA) under the direction of Carl F. Miller (Webb and Wilder, 1951). Shortly thereafter, Pine Island was inundated when construction of Guntersville Dam was completed and the low-lying Guntersville Basin flooded to become Guntersville Lake.
The site had seen Native American occupation since the Archaic Period (about 8,000-1,000 B.C.) (Walthall, 1980); though many of the burials have been convincingly attributed to the post-contact period, between 1540 and about 1715 (Fleming, 1976; Padgett, 2007; Webb and Wilder, 1951). It is believed that the Native occupants of this latter period were the historically known Koasati, or Coushatta, tribe (Padgett, 2007; Swanton, 1985, 1989), though there is some dispute on this issue (Hudson, 1997).
CASE REPORT
Burial MS100-14 was an infant of indeterminate sex, aged about 9 months based on dental eruption. No indications of pathological infection or physical trauma were found among the remains.
Burial MS100-14 exhibited fused dentition, appearing as a block of three teeth fused side by side in their standard position. The fused set consists of the deciduous left maxillary central incisor, lateral incisor, and canine (Fig. 1). The central incisor and canine appear to be of normal dimensions, while the lateral incisor is reduced in mesiodistal width, and appears to be a conically-shaped “peg tooth.”
DISCUSSION
The three teeth are fused at both the enamel and the dentin, though all three can be recognized as distinct from the others (Fig. 1). Furthermore, it is apparent that although the pulp cavities of the three teeth are continuous with each other, each tooth was maintained by its own root canal. These observations support the assertion that this is a true case of dental fusion, rather than gemination of a single tooth (Oliván Rosas et al., 2004; Uys and Morris, 2005).
Some studies have found a predilection for one sex or the other regarding fused teeth or peg teeth (Wu and Feng 2005; Yonezu et al., 1997); however, no evidence relating to sex can be interpreted from the remains or associated materials of Burial MS100-14.
CONCLUSION
The expression of triple fusion in MS100-14 as a dental anomaly is unusual in that it occurred among the maxillary dentition, as other researchers have found that when dental fusion occurs it is predominantly in the mandibular arch (Cheng et al., 2003; Yonezu et al., 1997). The peg-shaped tooth, while an anomalous feature, is typical in the respect that it is a lateral incisor (Wu and Feng, 2005). Burial MS100-14 represents a rare case in physical anthropology of triple fusion of primary dentition found in an archaeological context. Furthermore, the case
Fig. 1. Fused teeth of Burial MS100-14. (Left) Labial view with the left primary central incisor (i1) to the left of the photograph, a conical lateral incisor (i2) in the center, and the canine (c) to the right. (Center) Lingual view of the fused teeth, with c to the left and i1 to the right. (Right) Alveolar (apical) view of the formative roots with c to the left and i1 to the right of the photograph.
B.D. PADGETT

27PRIMARY TOOTH TRIPLE FUSION
of MS100-14 is significant as it appears to be the first case of triple fusion reported from among prehistoric Native American remains in the Southeastern United States.
LITERATURE CITED
Andlaw RJ, Rock WP. 1999. Manual de odontopediatría. Mexico City: McGraw-Hill Interamericana.
Aquiló L, Gandia JL, Cibrian R, Catala M. 1999. Primary double teeth: a retrospective clinical study of their morphological characteristics and associated Anomalies. Int J Pediatric Dent 9:175-183.
Aufderheide AC, Rodríguez-Martín C. 1998. The Cambridge encyclopedia of human paleopathology. Cambridge: Cambridge University Press.
Barberia Leache E, Boj Quesada JR. 2001. Odontopediatría, 2nd ed. Barcelona: Masson.
Boj Quesada JR. 1990. Dientes Dobles. Archivos Odontología 6:321-325.
Bruce C, Manning-Cox G, Stanback Fryer C, Banks K, Gilliam M. 1994. A radiographic survey of dental anomalies in black pediatric patients. NDA J 45:6-13.
Canut Brusola JA. 1988 Ortodoncia Clínica. Barcelona: Salvat.
Cheng RB, Chen X, Liu SJ, Pan L, Wu XG. 2003. [An epidemiological survey on fusion of deciduous teeth of 4286 kindergarten children in Shenyang City.]Shanghai Kou Qiang Yi Xue. (Shanghai J Stomatology) 12:424-426. Translated from Chinese.
Erdem GB, Uzamis M, Olmez S, Sargon MF. 2001. Primary incisor triplication defect. ASDC J Dent Child 68:322-325.
Favalli O, Webb M, Culp J. 1998. Bilateral twinning: report of case. ASDC J Dent Child 65: 268-271.
Fleming VK, Jr. 1976. Historic aboriginal occupation of the Guntersville Basin, Alabama. M.A. thesis, Department of Anthropology, University of Alabama, Tuscaloosa.
Gonzalez Marquez MI, Mendez-Nuñez M. 1993. Problemas de nomenclatura en alteraciones morfológicas dentarias. Archivos Odontoestomatología 9:197-204.
Hagman FT. 1988. Anomalies of form and number, fused primary teeth, a correlation of the dentitions. ASDC J Dent Child 55:359-361.
Hillson S. 1996. Dental anthropology. Cambridge University Press, United Kingdom.
Hudson C. 1997. Knights of Spain, Warriors of the Sun: Hernando de Soto and the South’s ancient chiefdoms. Athens, GA: University of Georgia Press.
Killian CM, Croll TP. 1990. Dental twinning anomalies: the nomenclature enigma. Quintessence Int 21:571-576.
Mays S. 2004. Talon cusp in a primary lateral incisor from a Medieval child. ASDC J Dent Child 71:206-208.
Modrizuki K, Yoneku T, Yakushiji M, Machida I. 1999. The fusion of three primary incisors: report of case. ASDC J Dent Child 66:421-425.
Oliván Rosas G, López-Jiménez J, Giménez-Prats MJ, Piqueras-Hernández M. 2004. Considerations and differences in the treatment of a fused tooth. Medicina Oral 9:224-228.
Ortner DJ. 2003. Identification of pathological conditions in human skeletal remains, 2nd ed. San Diego: Academic Press.
Ostos Garrido MJ, Peñalva Sanchez MA. 1996. Dientes dobles asociados a inclusión dentaria: posibilidades terapéuticas. Odontología Pediátrica 5:91-96.
Padgett BD. 2007. Islands in the River of Time: the bioarchaeology of two village sites (1MS32 and 1MS100) in Marshall County, Alabama, with new interpretations of the ethnohistoric and archaeological records. M.A. thesis, Department of Anthropology, University of Alabama, Tuscaloosa.
Prabhakar AR, Marwah N, Raju OS. 2004. Triple teeth: case report of an unusual fusion of three teeth. ASDC J Dent Children 71:206-208.
Reddy NN, Munshi AK. 1999. Fusion of primary incisors—a report of six cases. J Indian Soc Pedod Prev Dent 17:55-60.
Scheuer L, Black S. 2000. Developmental juvenile osteology. San Diego: Academic Press.
Scott GR, Turner CG II. 1997. The anthropology of modern human teeth: dental morphology and its variation in recent human populations. Cambridge: Cambridge University Press.
Swanton JR. 1985. Final Report of the United States De Soto Expedition Commission. Smithsonian Institute Press, Washington, D.C. Originally published 1939, U.S. Government Printing Office, Washington, D.C.
Swanton JR. 1987. The Indians of the Southeastern United States. Reprinted. Smithsonian Institute Press, Washington, D.C. Originally published 1946, U.S. Government Printing Office, Washington, D.C.
Uys H, Morris D. 2005. “Double” teeth—a diagnostic conundrum. Dental Update 32:237-239.
Walthall JA. 1980. Prehistoric Indians of the Southeast: Archaeology of Alabama and the Middle South. Tuscaloosa, AL: University of Alabama Press.
Webb WS, Wilder CG. 1951. An archaeological survey of Guntersville Basin on the Tennessee River in Northern Alabama. Lexington, KY: University of Kentucky Press.
Wu H, Feng HL. 2005. [A survey of number and morphology anomalies in permanent teeth of 6,453 youths between 17 to 21 years old.] Zhonghua Kou Qiang Yi Xue Za Zhi [Chinese J Stomatology] 40:489-490. Translated from Chinese.
Yonezu T, Hayashi Y, Sasaki J, Machida Y. 1997. Prevalence of congenital dental anomalies of the deciduous dentition in Japanese children. Bull Tokyo Dental College 38:27-32.

28
The protostylid exhibits a range of morphological expression ranging from a pit to a prominent cusp. However, its most common form is a surface irregularity (Dahlberg, 1963; Mayhall, 1979). Human teeth possess an active cingular zone that serves as the point of origin for specific accessory cusps (Butler, 1956). In the maxilla, this zone is active primarily on the lingual surfaces of the anterior teeth whereas in the molars, lingual tubercles and Carabelli’s trait are expressed. The mandibular teeth are less likely to exhibit development from the lingual cingular zone, while a cingular trait of the lower molars, the protostylid, is sometimes present on the buccal surface of the mesiobuccal cusp. Simons (1972) points out that a correlation exists in pongids between well-developed lingual cingula of the upper molars and buccal cingula of the lower molars. This suggests that the Carabelli’s trait-protostylid association in the human dentition reflects a long-term developmental relationship in hominoid phylogeny (Scott, 1978). The protostylid is also more frequent in early hominid species like those from the genus Australopithecus than in later Homo species. Among Australian Aborigines, the remarkable characters include those termed the “Mongoloid dental complex” (Hanihara, 1966, 1967, 1968, 1970) and Carabelli’s cusp. The Mongoloid dental complex is composed of five crown characters, namely shovel-shape in the maxillary central incisors, cusp six, cusp seven, deflecting wrinkle, and protostylid on the mandibular first molars. This suite of characteristics is similar for deciduous maxillary incisors and mandibular second molars (Hanihara 1970).
Hanihara (1967) stated the protostylid occurs more frequently on the primary than permanent molars. According to Dahlberg (1950) and Hanihara (1961), whenever the protostylid is present on a permanent molar the trait was present on the primary second molar. However, the reverse situation does not always occur (Tongkoom, 1994). Hanihara (1961) provides a
Correspondence to: Anand L. Shigli, Department of Pedodontics and Preventive Dentistry, Modern Dental College and Research Centre, Gandhi Nagar, Airport Road, Indore – 453112, Madhya Pradesh, India.Email address: [email protected]
A Rare Form of Protostylid: Review of Literature and Case ReportsAnand L. Shigli1, Sangeeta P. Wanjari2, and Ruchi Ahuja1
1Department of Pedodontics and Preventive Dentistry, 2Department of Oral and Maxillofacial Pathology,Modern Dental College and Research Centre, Indore, Madhya Pradesh, India.
ABSTRACT Human teeth possess an active cingular zone that serves as the point of origin for specific accessory cusps. The term protostylid or protoconid is used for any additional cusps on the buccal surface of maxillary and mandibular premolars and molars. Their occurrence in maxillary and mandibular deciduous and permanent
dentition is discussed in the literature. This article presents a review of literature in relation to formation of the protostylid, and two cases of prominent protostylids are described, one each in the deciduous and permanent dentitions. Dental Anthropology 2010;23(1):28-31.
classification consisting of seven grades of the protostylid (Table). The protostylid also can occur on the primary mandibular second molars (Tongkoom, 1994).
This cingular feature, which was first reported by Bolk (1916), is seen most frequently on the buccal surface of the mesiobuccal cusp of both primary and permanent molars, so an additional cusp on the buccal surface of a molar is referred to as a paramolar tubercle, or Bolk’s cusp (Tongkoom, 1994). Broom (1937) described the protostylid feature on ‘‘a rudimentary external cingulum.” Dahlberg (1945) later proposed the term protostylid or parastyle for any anomalous cusp on the buccal surface of maxillary and mandibular premolars and molars (Goaz and Miller, 1966). Dart (1948) described the feature on a molar as ‘‘a laterally-disposed enamel ridge’’ separated from the protoconid by a cingular furrow. Dahlberg (1950) also noted that ‘‘although the cusp had its origin as an expression of the cingulum, it is a unit structure, an entity in itself and definitely unlike the continuing cingular eminence seen on the gorilla and other anthropoids.’’
The Arizona State University Dental Anthropology System (ASUDAS), which was devised for the analysis of modern human teeth, defines the protostylid as “a secondary groove that extends mesially from the buccal groove and which culminates in teeth with a marked expression of the protostylid, as a cusp with a free apex” (Turner et al., 1991). Turner et al. (1991) described it as “a paramolar cusp found on the buccal surface of the protoconid that is normally associated with the buccal groove.” As noted by Hlusko (2004), the terms

29
‘‘protostylid’’ and ‘‘protoconidal cingulum’’ have been used interchangeably when describing features the buccal surface of hominin lower molars.
The prevalence of the protostylid varies with race (Dahlberg, 1963). It may be present in up to 40% of a population. The protostylid can occur with or without Carabelli’s trait on the maxillary molars of Arctic people. The Carabelli trait frequently appears in Caucasoids. Like Carabelli’s trait, the protostylid has both a similar range of morphological variation and frequency of forms (Turner, 1967). Hanihara (1968) reported a high frequency of this character in Pima Indians. Suzuki and Sakai (1954) found fairly frequent appearance of the protostylid in the mandibular molars of Japanese. In Mongoloid groups, the protostylid trait occurs in more than 40% of individuals, while in non-Mongoloid populations the prevalence is generally below 20%.
CASE REPORTS
The following are case reports of two patients who visited the Department of Pedodontics and Preventive Dentistry of Modern Dental College and Research Centre, Indore, Madhya Pradesh, India.
The first case was a 14 year old girl with the chief complaint of decay in right and left lower back teeth. There was no history of pain or any discomfort, and she had no significant health history. Examination revealed an unusual accessory cusp in relation to the mesiobuccal cusp of the lower first permanent molars, which also exhibited a four cusp pattern (Figs. 1-3). This accessory cusp is grade 6 using Hanihara’s (1961) classification (Table). The protostylid was strongly developed, giving the appearance of an extra cusp on the buccal surface. There also was a prominent cusp of Carabelli on the upper first permanent molars. The lower second premolars showed a Y-shape groove pattern.
The second case was an 11 year old girl with the chief complaint of a white spot on her upper left front tooth, and she wanted to have her teeth cleaned. She had no significant medical or dental history. Examination revealed that the patient had Turner’s hypoplasia on the permanent maxillary left central incisor. An accidental finding was an accessory cusp (Fig. 4) on the mesiobuccal cusp of the deciduous maxillary right first molar classified as grade 6 using Hanihara’s classification, and a pronounced bulge similar in relation to deciduous maxillary left first molar classified as grade 4 of the same (Table).
DISCUSSION
The protostylid forms during the morphogenetic phase of tooth formation, before the onset of dentinogenesis or amelogenesis. The fact that, it is actually the beginning of a cusp formation can be established by the shape of the enamodentin junction (EDJ) beneath it. These are considered outer enamel surface (OES) traits that are the
Grade 0: The mesiobuccal groove is straight and there is no trace of any irregularity.
Grade 1: No evidence of a protostylid, but its presence is suggested by the curvature and branching of the mesiobuccal groove. There may be a small but distinct pit at the lower terminus of the mesiobuccal groove separating the protoconid from the hypoconid. In such a case the buccal groove is slightly bent distalward at the point of the pit.
Grade 2: The divergence of the mesiobuccal groove is evident
Grade 3: The two branches of the mesiobuccal groove are more strongly developed than in grade 2. A small triangular area with its tip downward occurs between the branches of the buccal groove
Grade 4: A shallow groove appears at the mesial corner of the buccal surface. The area between this groove and the mesial branch of the mesiobuccal groove bulges slightly and gives a triangular shape with its tip upward.
Grade 5: The triangular area is more strongly developed than in grade 4.
Grade 6: The protostylid is strongly developed so that the tooth seems to have an extra cusp on the buccal surface of mesiobuccal cusp.
TABLE 1. Hanihara’s (1961) classification is composed of seven grades of protostylid forms
RARE PROTOSTYLID FORM
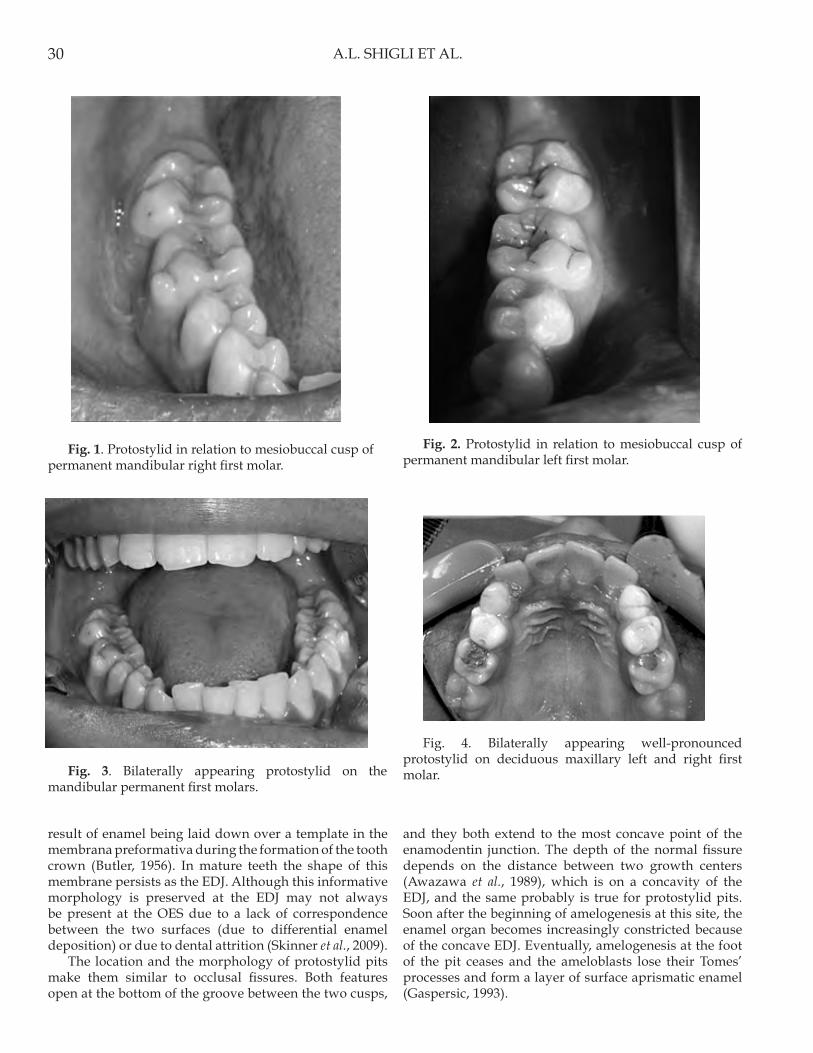
30
Fig. 1. Protostylid in relation to mesiobuccal cusp of permanent mandibular right first molar.
Fig. 2. Protostylid in relation to mesiobuccal cusp of permanent mandibular left first molar.
Fig. 3. Bilaterally appearing protostylid on the mandibular permanent first molars.
Fig. 4. Bilaterally appearing well-pronounced protostylid on deciduous maxillary left and right first molar.
result of enamel being laid down over a template in the membrana preformativa during the formation of the tooth crown (Butler, 1956). In mature teeth the shape of this membrane persists as the EDJ. Although this informative morphology is preserved at the EDJ may not always be present at the OES due to a lack of correspondence between the two surfaces (due to differential enamel deposition) or due to dental attrition (Skinner et al., 2009).
The location and the morphology of protostylid pits make them similar to occlusal fissures. Both features open at the bottom of the groove between the two cusps,
and they both extend to the most concave point of the enamodentin junction. The depth of the normal fissure depends on the distance between two growth centers (Awazawa et al., 1989), which is on a concavity of the EDJ, and the same probably is true for protostylid pits. Soon after the beginning of amelogenesis at this site, the enamel organ becomes increasingly constricted because of the concave EDJ. Eventually, amelogenesis at the foot of the pit ceases and the ameloblasts lose their Tomes’ processes and form a layer of surface aprismatic enamel (Gaspersic, 1993).
A.L. SHIGLI ET AL.

31RARE PROTOSTYLID FORM
The protostylid has been viewed both as an accessory cusp and as a remnant of a cingulum (i.e., a crestal feature). This distinction is relevant to considerations of whether the feature is a cusp or a crest, but this depends on the definition of a cusp. The primary cusps of all primate teeth have a dentin horn, which forms early in the development of the tooth crown on the surface of the inner enamel epithelium, and is subsequently covered by enamel. This is also the case for the majority of accessory cusps, such as cusp six and cusp seven (Skinner et al., 2008), and even small features such as marginal ridge tubercles on upper molars and the mammelons present on unworn incisors (Kraus and Jordan, 1965). Only in rare circumstances in extant hominoids and fossil hominins are there ‘‘enamel-only’’ cuspules (i.e., small cusps with no underlying dentin horn). Thus, for the purpose of defining the protostylid trait a structure defined as a cusp should exhibit an underlying dentin horn at the EDJ surface. The protostylid pit may lie between a large protoconid and a nearly negligible protostylid consisting only of dentin core (Gaspersic, 1993).
CONCLUSION
The protostylid and Carabelli’s trait was found to co-occur in the two cases described. This combination is interesting because these traits occur on homologous cusps in opposite jaws (Tongkoom, 1994). The similarity in form and position of this structure in contemporary man and in prehistoric forms is considered as evidence of a relationship between these groups.
LITERATURE CITED
Awazawa Y, Hayashi K, Awazawa I, Tobari H. 1989. Pathomorphological study of the supplemental groove. Bull Group Int Rech Sci Stomatol Odontol 32:145-156.
Bolk L. 1916. Problems of human dentition. Am J Anat 19:91-148.
Broom R. 1937. Discovery of a lower molar of Australopithecus. Nature 140:681-682.
Butler PM. 1956. The ontogeny of molar pattern. Biol Rev 31:30-70.
Dahlberg AA. 1945. The changing dentition of man. J Am Dent Assoc 32:676-690.
Dahlberg AA. 1950. The evolutionary significance of the protostylid. Am J Phys Anthropol 8:15–25.
Dahlberg AA. 1963. Analysis of the American Indian dentition. In: Brothwell DR, editor. Dental anthropology. Oxford: Pergamon, p 149-177.
Dart RA 1948. The adolescent mandible of Australo-pithecus prometheus. Am J Phys Anthropol 6:391-411.
Gaspersic D. 1993. Morphology of the most common form of protostylid on human lower molars. J Anat 182:429-431.
Goaz PW, Miller MC. 1966. A preliminary description of the dental morphology of the Peruvian Indian. J Dent Res 45:106-119.
Hanihara K. 1961. Criteria for classification of crown characters of human deciduous dentition. J Anthropol Soc Nippon 69:27-45.
Hanihara K. 1966. Mongoloid dental complex in deciduous dentiton. J Anthropol Soc Nippon 74:9-20.
Hanihara K. 1967. Racial characteristics in the dentition. J Dent Res 46:923-926.
Hanihara K. 1968. Morphological pattern of deciduous dentition—the Japanese American hybrids. J Anthropol Soc Nippon 76:114-121.
Hanihara K. 1970. Mongoloid dental complex in the deciduous dentition, with special reference to the dentition of the Ainu. J Anthrop Soc Nippon 78:3-17.
Hlusko LJ. 2004. Protostylid variation in Australopithecus. J Hum Evol 46:579-594.
Kraus BS, Jordan RE. 1965. The human dentition before birth. Philadelphia: Lea and Febiger.
Mayhall JT. 1979. The dental morphology of the Inuit of the Canadian Central Arctic. Ossa 6:199-218.
Scott GR. 1978. The relationship between Carabelli’s trait and the protostylid. J Dent Res 574:570-575.
Simons EL. 1972. An introduction to man’s place in nature: primate evolution. New York: Macmillan, p 242.
Skinner M., Wood BA, Hublin JJ. 2009. Protostylid expression at the enamel-dentine junction and enamel surface of mandibular molars of Paranthropus robustus and Australopithecus africanus. J Hum Evol 56:76-85.
Skinner MM, Wood BA, Boesch C, Olejniczak AJ, Rosas A, Smith TS, Hublin JJ. 2008. Dental trait expression at the enamel-dentine junction of lower molars in extant and fossil hominoids. J Hum Evol 54:173-186.
Suzuki M, Sakai T. 1954. On the “protostylid” of the Japanese. Zinruigaku Zassi 63:81-84.
Tongkoom S. 1994. The prevalence of dental anomalies in Chinese children. Thesis, Masters in Dental Surgery, Department of Children’s Dentistry and Orthodontics. Hong Kong. Retrieved on September 16, 2009. http://sunzi.lib.hku.hk/hkuto/view/B31953980/ft.pdf
Turner CG II. 1967. Dental genetics and microevolution in prehistoric and living Koniag Eskimo. J Dent Res 46:911-917.
Turner CG II, Nichol CR, Scott GR. 1991. Scoring procedures for key morphological traits of the permanent dentition: the Arizona State University Dental Anthropology System. In: Kelley M, Larsen CS. editors. Advances in dental anthropology. New York: Wiley-Liss, p. 13-31.

32

33
Sue Haeussler passed away in November, 2009, at the age of 77, following a lengthy period of illness linked with Alzheimer’s disease. Among the many reasons to remember Sue, especially for the readers of this journal, is that she was Editor of Dental Anthropology for 10 years (1991-2001), sharing editorship for her last issue with Edward F. Harris. During her tenure she advanced Dental Anthropology from being a short newsletter started by DAA founder, M. Yasar Iscan, to a professional journal in AJPA style with peer-reviewed articles, book reviews, DAA secretary and treasurer’s reports, presidential addresses, and other interesting items. Sue also promoted an international membership, paying out of her own pocket the annual dues for overseas scholars she knew who were in financial need. Whoever reads this necrology will hopefully carry on Sue’s helping our needy foreign dental anthropology colleagues.
Born on July 26, 1932, in Philadelphia, the city where in 1954 she earned a B.A. degree in microbiology from the University of Pennsylvania. As an undergraduate she was involved in various extra-curricular activities, notably photographic editor and feature writer for The Pennsylvania News, experiences that she expertly applied years later to her meticulous guidance of Dental Anthropology.
I first remember Sue being in an introductory anthropology class that I taught in the large auditorium at the 1930s-style Arizona State University agricultural building. The old, Depression-era concrete building had as its only architectural excess, large fronting intaglio portraits of five or six famous scientists. Only one was mostly hidden by a large tree—Charles Darwin. Sue often came up excitedly after class with a ream of questions, especially about the issue of the colonization of the New World, a subject that would eventually become the heart of her massive doctoral dissertation and her grand odyssey in the former USSR.
Later, Sue earned an M.A. in 1985 and a Ph.D. in 1996, both in physical anthropology at our explosively-growing Arizona State University campus in Tempe. Her dissertation data on dental morphology was collected traveling alone during a nine-month trip in the former USSR from December, 1990, to August, 1991. She was formally invited by scholars in various USSR Academy of Science institutes and universities housing archaeologically-derived human dental remains [St. Petersburg, Kiev (the Ukraine), Irkutsk, Novosibirsk, Tomsk, Tbilisi (Georgia), Moscow, and Krasnoyarsk], in that order, based on my examination of her more than 1,000 labeled color slides. Her grit and stamina at a mature age (58) can be appreciated by the fact that despite unrelenting back pain, she walked resolutely,
ObituaryAlice “Sue” Marie Frances Haeussler (1932-2009)
Fig. 1. Sue Haeussler (left) and Irkutsk State Univeristy archaeologist, German I. Medvedev, at the Siberian village of Mal’ta, south of Lake Baikal, March 31, 1991. The pair are standing on the frozen ground, beneath which (at about two meters depth) is the 21,000 year-old Upper Paleolithic site of the same name. The Mal’ta archaeological site is world famous for its carved ivory female figurines, carved images of birds, stone blade knives, other artifacts, and mammoth bone shelters, all strongly suggestive of a link with European Upper Paleolithic culture. This link is further strengthened by the European-like permanent incisor and molar morphology of a child found “buried” at the site. Sue and the author agree on the European character of the Mal’ta teeth, making Mal’ta the most eastern-known extension of Cro-Magnon culture and people. Photographer uncertain, but probably by Ekaterina Lipnina, Medvedev’s archaeologist wife.

34
with the help of a stout wooden walking stick (Fig. 1), even in the frigid winter months of her Russian odyssey. Her Soviet research was aided by an IREX fellowship and other sources. Her speaking and reading knowledge of Russian was gained with immense help from ASU language professor, Sanford Couch. Sue’s institute visits were greatly helped by the Russians in her photos that I know also spoke excellent English, including Serghei A. Arutionov, Moscow; Alexander G. Kozintsev, St. Petersburg; Alexander K. Konopatski, Novosibirsk; and the world renowned dental anthropologist, Alexander A. Zoubov, Moscow.
My own Russian travel and research before and after that of Sue’s has taken me to many of the institutes that she visited. Everyone asked how she was, and had very kind words to say about her. She was an excellent ambassador for the United States. Sue made an additional trip to Russia that I know about. She participated in an international conference held in Vladivostok. Hence, she traveled across the totality of Russia, from the Baltic (St. Petersburg), to the Sea of Japan (Vladivostok). I know of few other graduate students, or even seasoned professors, who have undertaken such an odyssey, and everywhere left so much good will.
In addition to her monumental two-volume dissertation (> 750 pages), Sue also published a number of articles, abstracts, and presented posters, all at national and international meetings. A few of her more easily obtained titles are cited in the following bibliography. Her dissertation lists several papers that were waiting publication or were in progress.
As a dental morphology researcher, Sue was a careful observer. Where she and I studied the same dental collections in the USSR, we were concordant in >90% of our ranked scale and discrete observations. The prime rule governing the ASU Dental Anthropology System of trait observation is: “when in doubt, never guess.” Sue followed this rule religiously. In Irkutsk, she found an example of Donald Morris’ “Uto-Aztecan” premolar. While her finding was only one of two examples ever recognized outside of the New World, there is absolutely no reason to doubt her observation. The gene(s) for this trait was present but very rare in northeastern Asia, but its relatively frequent occurrence in American Indians fits nicely with the views that there was founder’s effect in the crossing of Beringia, and more than one Siberian migration to the New World since the trait has never been found in Aleut-Eskimo populations. Sue’s thousands of other observations fit well with the hypothesis of a northeast Asian origin of all Native Americans, and not an origin from central Asia or Europe as has been suggested on the basis of some archaeological considerations. I mention these finding to make two points: (1) Very few archaeologists concerned with the colonization of the New World have traveled to Russia to learn what archaeologists have found there. Sue traveled to see the actual teeth of late Pleistocene and Holocene Eurasian
people. And, (2) few if any molecular geneticists (paleo- or modern) read or acknowledge the findings of dental anthropologists. Sue’s magnificent dental morphology study in the USSR will hopefully not be overlooked.
As wife of a busy psychiatrist (William B. Haeussler, M.D.), and mother, Sue balanced her professional and personal life with admirable skill, compassion, and charm, always hiding her chronic back pain. Her daily routine at ASU often started at 4:00 a.m. lasting until well after dinnertime. She usually rode the bus from her home in Phoenix to the ASU campus in Tempe. Her time in transit was usually spent editing or reading articles, a number published in Russian.
Peers and associates will greatly miss her, as will her family. At the risk of overlooking someone, Sue’s close dental anthropology colleagues of whom I am aware of included Edward F. Harris; G. Richard Scott; Diane E. Hawkey; Donald H. Morris; Shara E. Bailey; C. Loring Brace; Joel D. Irish; Scott Burnett; Christine Lee; Jaime Ulinger; Heather H. Edger; Kenneth A. R. Kennedy; Korri D. Turner; Christian R. Nichol; John R. Lukacs; Alma J. Adler; Lorrie Lincoln-Babb; Edwin F. Crespo; Stephen C. Reichardt; Thelma Dahlberg; Natalya I. Khaldeyeva; Alexander A. Zubov; Simon Hillson; and the late Daris R. Swindler, Albert A. Dahlberg, and Kazuro Hanihara. Sue had close professional colleagues in other branches of anthropology or science who will also miss her. Again, those whom I know of include Serghei A. Arutiumov, Russia; Liu Wu, China; Inna Potieklhim, Ukraine; Triona G. McNamara, Ireland; Yoshitaka Manabe, Japan; and a number of others who Sue met along the way during her USSR odyssey and during her DAA editorship. I mention these names here and earlier, probably inappropriately, but to simply illustrate the fine mesh of Sue’s professional and social net. A little of each of these friends of Sue, and myself, have or will die as a result of Sue’s passing. I am at a loss of words to say how much my late wife, Jacqueline, and I enjoyed Sue and Bill’s presence at various gatherings in our home honoring one or another graduate student’s completion of his or her program, and various visits by established scholars. Sue and Bill almost always sat on the large built-in couch by the big front room window. They were older than most of the other guests, but their quiet cheerful presence always gave class and respect to the evening gathering.
Christy G. Turner IIRegents’ Professor EmeritusArizona State University
CHRISTY G. TURNER II
Continued

35OBITUARY: ALICE M. F. HAEUSSLER (1932-2009)
PARTIAL BIBLIOGRAPHY
Haeussler AMF. 1993. Siberian Kitoi culture and its place in Paleo-Indian genealogy. Am J Phys Anthropol Suppl. 16:101-102.
Haeussler AMF. 1996. Dental anthropology of Russia, Ukraine, Georgia, Central Asia. Evaluation of five hypotheses for Paleo-Indian origins. Ph.D. dissertation, Arizona State University.
Haeussler AMF. 1995. Dental anthropology of the Russian Mesolithic era: Oleneostrovski Mogil’ink. In: Radlanski RJ, Renz H, editors. Proceedings of the 10th international symposium on dental morphology. Berlin: “M” Marketing Services, p 314-319.
Haeussler, AM. 1995. Upper Paleolithic teeth from the Kostenki sites on the Don River, Russia. In: J Moggi-Cecchi J, editor. Aspects of dental biology, paleontontology, anthropology and evolution. Florence: International Institute for the Study of Man, p 315-332.
DAA Subscription
The secretary-treasurer of the Dental Anthropol-ogy Association is Dr. Loren R. Lease of Youngstown State University.
Dr. Loren R. LeaseDepartment of Sociology and AnthropologyYoungstown State UniversityOne University PlazaYoungstown, Ohio 44555 USA
Telephone: (330) 941-1686E-mail: [email protected]
Dental Anthropology now is published electroni-cally and e-mailed to all members as a PDF. The PDF is published with color illustrations, though the printed version is in black-and-white. If you also want to receive a hard copy, be sure to make this clear on the membership form at the DAA website or contact Loren.
Speed communication about your membership by contacting Loren directly (other officers may not have current membership lists).
Electronic versions (as PDF files) of all back issues of Dental Anthropology are available gratis at the Association’s web site that is maintained at The Ohio State University: The web site’s home page is:
http://anthropology.osu.edu/DAA/index.htm
Haeussler AM, Irish JD, Morris DH, Turner CG II. 1989. Morphological and metrical comparison of San and central Sotho dentitions from southern Africa. Am J Phys Anthropol 78:115-122.
Haeussler, AM, and Turner CG II. 1992. The dentition of Central Asia and the quest for New World origins. Lukacs JR, editor. Culture, ecology, and dental anthropology. J Hum Ecol, special issue 2:273-297.

36
THE ALBERT A. DAHLBERG PRIZEThe Albert A. Dahlberg Prize is awarded annually to the best student paper submitted to the
Dental Anthropology Association (DAA). Dr. Dahlberg was a professor at the University of Chicago, one of the founders of the International Dental Morphology Symposia, and among the first modern researchers to describe variations in dental morphology and to write cogently about these variations, their origins, and importance. The prize is endowed from the Albert A. Dahlberg Fund established through generous gifts by Mrs. Thelma Dahlberg and other members of the association.
Papers may be on any subject related to dental anthropology. The recipient of the Albert A. Dahlberg Student prize will receive a cash award of $200.00, a one-year membership in the Dental Anthropology Association, and an invitation to publish the paper in Dental Anthropology, the journal of the association.
The student should submit a printed copy (or electronic PDF) of his or her paper in English to the President of the DAA. Manuscripts must be received by January 31 of the year that the prize will be awarded, in this case January 31, 2011. The format must follow that of Dental Anthropology, which is the same as the style of the American Journal of Physical Anthropology. The Style Guide to Authors is available at the web site for the AJPA (http://physanth.org/).
The manuscript should be accompanied by a letter from the student’s supervisor indicating that the individual is the primary author of the research and the paper. Multiple authorship is acceptable, but the majority of the research and writing must be the obvious work of the student applying for the prize. Send enquiries and submissions to the President of the DAA:
Dr. G. Richard ScottDepartment of AnthropologyUniversity of Nevada Reno1664 North Virginia MS0096Reno, Nevada 89557-0096 U.S.A.e-mail: [email protected]
The DAA reserves the right to select more than one paper, in which case the prize money will be shared equally among the winners. The selection committee also reserves the right to not select a winner in a particular year.
The winner of the Albert A. Dahlberg Student Prize will be announced at the Annual Meeting of the DAA, which is held in conjunction with the annual meeting of the American Association of Physical Anthropologists. In 2011, the meeting will be held in Minneapolis, Minnesota, April 12-16.
RESEARCH COMPETITION
in
DENTAL ANTHROPOLOGY

NOTICE TO CONTRIBUTORS
Dental Anthropology publishes research articles, book reviews, announcements and notes and comments relevant to the membership of the Dental Anthropology Association. Editorials, opinion articles, and research questions are invited for the purpose of stimulating discussion and the transfer of information. Address correspondence to the Editor, Dr. Edward F. Harris, Department of Orthodontics, University of Tennessee, Memphis, TN 38163 USA (E-mail: [email protected]). Electronic submissions by e-mail are strongly encouraged.
Research Articles. The manuscript should be in a uniform style (one font style, with the same 10- to 12-point font size throughout) and should consist of seven sections in this order: Title page Tables Abstract Figure Legends Text Figures Literature CitedThe manuscript should be double-spaced on one side of 8.5 x 11’’ paper (or the approximate local equivalent) with adequate margins. All pages should be numbered consecutively, beginning with the title page. Be certain to include the full address of the corresponding author, including an E-mail address. All research articles are peer reviewed; the author may be asked to revise the paper to the satisfaction of the reviewers and the Editor. All communications appear in English.
Title Page. This page contains (a) title of the paper, (b) authors’ names as they are to appear in publication, (c) full institutional affiliation of each author, (d) number of manuscript pages (including text, references, tables, and figures), and (3) an abbreviated title for the header. Be certain to include a working E-mail address and/or telephone number.
Abstract. The abstract does not contain subheadings, but should include succinct comments relating to these five areas: introduction, materials, methods, principal results, and conclusion. The abstract should not exceed 200 words. Use full sentences. The abstract has to stand alone without reference to the paper; avoid citations to the literature in the abstract.
Figures. One set of the original figures must be provided (or e-mailed) with the manuscript in publication-ready format. Drawings and graphics should be of high quality in black-and-white with strong contrast. Graphics on heavy-bodied paper or mounted on cardboard are encouraged; label each on the back with the author’s name, figure number, and orientation. Generally it is preferable to also send graphs and figures as computer files that can be printed at high resolution (300 dpi or higher). Most common file formats (Windows or Macintosh) are acceptable; check with the Editor if there is a question. The hard-copy journal does not support color illustrations, but the PDF version does. Print each table on a separate page. Each table consists of (a) a table legend (at top) explaining the contents of the table, (b) the table proper, and (c) any footnotes (at the bottom) needed to clarify contents of the table. Use as few horizontal lines as possible and do not use vertical lines in a table.
Literature Cited. Dental Anthropology adheres strictly to the current citation format of the American Journal of Physical Anthropology. Refer to a current issue of the AJPA or to that association’s web-site since the “current” style is periodically updated. Current guidelines are available at the AAPA website. Dental Anthropology adheres to the in-text citation style used by the AJPA consisting of the author’s last name followed by the year of publication. References are enclosed in parentheses, separated by a semicolon, and there is a comma before the date. Examples are (Black, 2000; Black and White, 2001; White et al., 2002). The list of authors is truncated and the Latin abbreviation “et al.” is substituted when there are three or more authors (Brown et al., 2000). However, all authors of a reference are listed in the Literature Cited section at the end of the manuscript.
Electronic Submission. Electronic submission instead of sending hard copies of articles is strongly encouraged. For articles that undergo peer review, the editor will request submission of the final revision of a manuscript in electronic format, not interim versions. Files can alternatively be submitted on a 3.5” diskette, or a 100-megabyte Iomega Zip disk or a compact disk (CD), either in Windows or Macintosh format. Files can also be sent as E-mail attachments. Microsoft Word documents are preferred, but most common formats are suitable. Submit text and each table and figure as a separate file. Illustrations should be sent in PDF or EPS format, or check with the Editor before submitting other file types. Be certain to include your name in each file label.

Published atCraniofacial Biology Laboratory, Department of Orthodontics
College of Dentistry, The Health Science CenterUniversity of Tennessee, Memphis, TN 38163 U.S.A.
The University of Tennessee is an EEO/AA/Title IX/Section 504/ADA employer
Dental AnthropologyVolume 23, Number 1, 2010
Original Articles
Gaurav Agnihotri and Vimal SikrCrown and Cusp Dimensions of the Maxillary First Molar:A Study of Sexual Dimorphism in Indian Jat Sikhs . . . . . . . . . . . . . . . . . . . . . . . . 1
Yuh Hasegawa, James Rogers, Graham Scriven and Grant TownsendCarabelli Trait in Australian Twins: Reliability and Validity ofDifferent Scoring Systems . . . . . . . . . . . . . . . . . . . . . . . . . . . . . . . . . . . . . . . . . . . . . . 7
Helen M. LiversidgeDemirjian Stage Tooth Formation Results from aLarge Group of Children . . . . . . . . . . . . . . . . . . . . . . . . . . . . . . . . . . . . . . . . . . . . . . 16
Brian D. PadgettTriple Fusion in the Primary Dentition from Law’s Site,Alabama (1MS100): A Case Report . . . . . . . . . . . . . . . . . . . . . . . . . . . . . . . . . . . . . 25
Anand L. Shigli, Sangeeta P. Wanjari and Ruchi AhujaA Rare Form of Protostylid:Review of Literature and Case Reports . . . . . . . . . . . . . . . . . . . . . . . . . . . . . . . . . . 28
Obituary
Christy G. Turner IIObituary: Alice “Sue” Marie Frances Haeussler (1932-2009) . . . . . . . . . . . . . . . 33
Association Business
Announcement: Albert Dahlberg Prize Competition, 2011 . . . . . . . . . . . . . . . . . . . . . 36