densities, viscosities and ultrasonic velocities of binary mixtures of methylbenzene with...
TRANSCRIPT

A
mvbp©
K
1
litoeuvtcItrba
I
0d
Fluid Phase Equilibria 252 (2007) 88–95
Densities, viscosities and ultrasonic velocities of binary mixturesof methylbenzene with hexan-2-ol, heptan-2-ol
and octan-2-ol at T = 298.15 and 308.15 K
Mehdi Hasan a,∗, Dinesh F. Shirude a,b, Apoorva P. Hiray a,Arun B. Sawant a, Ujjan B. Kadam a,1
a P.G. Department of Physical Chemistry, M.S.G. College, Malegaon Camp 423105, Indiab Arts, Science and Commerce College, Nampur 423204, India
Received 24 August 2006; received in revised form 1 January 2007; accepted 1 January 2007Available online 7 January 2007
bstract
Densities, viscosities and ultrasonic velocities of binary mixtures of methylbenzene with hexan-2-ol, heptan-2-ol and octan-2-ol have beeneasured over the entire range of composition, at 298.15 and 308.15 K and at atmospheric pressure. From the experimental values of density,
iscosity and ultrasonic velocity, the excess molar volumes (VE), deviations in viscosity (�η) and deviations in isentropic compressibility (�κs) haveeen calculated. The excess molar volumes, deviations in viscosity and deviations in isentropic compressibility have been fitted to the Redlich–Kisterolynomial equation. The Jouyban–Acree model is used to correlate the experimental values of density, viscosity and ultrasonic velocity.
2007 Published by Elsevier B.V.
opic c
2
(avr
gaeu
nc
eywords: Excess molar volumes; Deviations in viscosity; Deviations in isentr
. Introduction
Studies on thermodynamic and transport properties of binaryiquid mixtures provide information on the nature of interactionsn the constituent binaries. Literature provides extensive data onhe density and viscosity of liquid mixtures but a combined studyf density, viscosity and ultrasonic velocity is quite scarce. Theffect of molecular size, shape, chain length and degree of molec-lar association of normal alkanols and branched alkanols, on theolumetric, viscometric and acoustic properties of binary mix-ures containing acetonitrile, dimethylsulfoxide, ethyl acetate,hloroform and benzonitrile have been reported earlier [1–8].n continuation with our earlier study of intermolecular interac-ions in methylbenzene–alkanol binary mixtures [9–11] we noweport the density, viscosity and ultrasonic velocity data for the
inary mixtures of methylbenzene with hexan-2-ol, heptan-2-olnd octan-2-ol at 298.15 and 308.15 K.∗ Corresponding author. Tel.: +91 2554 561544; fax: +91 2554 251705.E-mail address: [email protected] (M. Hasan).
1 Present address: Arts, Science and Commerce College, Manmad 423104,ndia.
dbwatso
378-3812/$ – see front matter © 2007 Published by Elsevier B.V.oi:10.1016/j.fluid.2007.01.001
ompressibility; Methylbenzene; Hexan-2-ol; Heptan-2-ol; Octan-2-ol
. Experimental
Methylbenzene, hexan-2-ol, heptan-2-ol and octan-2-olQualigens Fine Chemicals, purity >99.5 mass%) were usedfter single distillation. The densities, viscosities and ultrasonicelocities of the pure components were compared with the cor-esponding literature values at 298.15 and 308.15 K (Table 1).
Binary mixtures were prepared by mass in air tight stopperedlass bottles. The masses were recorded on an Adairdutt bal-nce to an accuracy of ±1 × 10⁻⁴ g. Care was taken to avoidvaporation and contamination during mixing. The estimatedncertainty in mole fraction was <1 × 10⁻⁴.
Densities were determined by using 15 cm3 bicapillary pyc-ometer as described earlier [12,13]. The pycnometer wasalibrated using conductivity water with 0.99705 g cm−3 as itsensity [14] at 298.15 K. The pycnometer filled with air bub-le free experimental liquids was kept in a transparent walledater bath (maintained constant to ±0.01 K) for 10–15 min to
ttain thermal equilibrium. The positions of the liquid levels inhe two arms were recorded with the help of travelling micro-cope, which could read to 0.01 mm. The estimated uncertaintyf density measurements of solvent and binary mixtures was

M. Hasan et al. / Fluid Phase Equilibria 252 (2007) 88–95 89
Table 1Comparison of experimental density, viscosity and ultrasonic velocity of pure liquids with literature values at 298.15 K
Pure liquid ρ (g cm−3) η (mPa s) u (m s−1)
Experimental Literature Experimental Literature Experimental Literature
Methylbenzene 0.86218 0.86219a 0.554 0.5525a 1306 1304b
Hexan-2-ol 0.81084 0.8108c 4.105 – 1290 –Heptan-2-ol 0.81374 0.8134a 5.088 5.06c 1314 –Octan-2-ol 0.81708 0.8171a 6.429 6.490a 1328 1309d
a Ref. [24].
0w
si±ratlrd
2Met
3
saht
V
wxd
�
wa2
c
κ
o
�
wmc
ie
Y
wpeef
σ
wcw
biihaamhdWto
b Ref. [25].c Ref. [26].d Ref. [27].
.00005 g cm−3. At least three to four measurements were madehich had an average deviation of ±0.00005 g cm−3.The dynamic viscosities were measured using an Ubbelohde
uspended level viscometer [6–8], calibrated with conductiv-ty water. An electronic digital stop watch with readability of
0.01 s was used for the flow time measurements. At least threeepetitions of each data reproducible to ±0.05 s were obtained,nd the results were averaged. Since all flow times were greaterhan 200 s and capillary radius (0.5 mm) was far less than itsength (50–60 mm), the kinetic energy and end corrections,espectively, were found to be negligible. The uncertainties inynamic viscosities are of the order of ±0.003 mPa s.
The ultrasonic velocities (u) were measured at a frequency ofMHz in these solutions through interferometric method (usingittal’s F-81 model) at 298.15 and 308.15 K (±0.05 K). The
rror in velocity measurements is ±0.1%. The other experimen-al details are the same as reported earlier [2–4].
. Results and discussion
Experimental values of densities (ρ), viscosities (η) and ultra-onic velocities (u) of mixtures at 298.15 and 308.15 K are listeds a function of mole fraction in Table 2. The density valuesave been used to calculate excess molar volumes (VE) usinghe following equation:
E = x1M1 + x2M2
ρ12−
(x1M1
ρ1
)−
(x2M2
ρ2
)(1)
here ρ12 is the density of the mixture and x1, M1, ρ1, and2, M2, ρ2 are the mole fraction, the molecular weight, and theensity of pure components 1 and 2, respectively.
The viscosity deviations (�η) were calculated using
η = η12 − x1η1 − x2η2 (2)
here η12 is the viscosity of the mixture and x1, x2 and η1, η2re the mole fraction and the viscosity of pure components 1 and, respectively.
The ultrasonic velocity u was used to calculate the isentropic
ompressibility κs by the equations = 1
u2 × ρ(3)
aoib
The deviation from isentropic compressibility, (�κs), wasbtained using the relation:
κs = κs,mix − x1κs1 − x2κs2 (4)
here κs,mix is the experimental isentropic compressibility of theixture, x1, x2 and κs1, κs2 are the mole fraction and isentropic
ompressibility of pure components.The excess molar volumes and deviations in viscosity and
sentropic compressibility were fitted to Redlich–Kister [15]quation of the type
= x1x2
n∑i
ai(x1 − x2)i (5)
here Y is either VE, or �η, or �κs, and n is the degree ofolynomial. Coefficients ai were obtained by fitting Eq. (5) toxperimental results using a least-squares regression method. Inach case, the optimum number of coefficients is ascertainedrom an examination of the variation in standard deviation (σ).
σ was calculated using the relation
(Y ) =[∑
(Yexptl − Ycalcd)2
N − n
]1/2
(6)
here N is the number of data points and n is the number ofoefficients. The calculated values of the coefficients ai alongith the standard deviations (σ) are given in Table 3.The variation of VE with the mole fraction x1 of methyl-
enzene for hexan-2-ol, heptan-2-ol and octan-2-ol at 298.15s represented in Fig. 1. It is seen that the VE values are pos-tive for binary mixtures of methylbenzene with hexan-2-ol,eptan-2-ol and octan-2-ol over the entire composition ranget both the temperatures. It is well known fact that alkanolsre self-associated through hydrogen bonding. The mixing ofethylbenzene with alkanols is expected to induce changes in
ydrogen boding equilibrium and electrostatic interactions withifferent resultant contributions to the volumes of mixtures.eakening of interactions between molecules of methylbenzene
end to result in an increase in volume. Similarly, the disruptionf alkanol multimers through breaking of hydrogen bonds makes
positive contribution to VE. Our VE values of binary mixturesf methylbenzene with hexan-2-ol at x = 0.5 (0.240 cm3 mol−1)s in good agreement with the values of Ortega et al. [16],eing 0.236 cm3 mol−1. For the alkan-2-ols the VE values fol-
90 M. Hasan et al. / Fluid Phase Equilibria 252 (2007) 88–95
Table 2Density (ρ), viscosity (η), ultrasonic velocity (u), isentropic compressibility (κs), excess molar volume (VE), deviation in viscosity (�η) and deviation in isentropiccompressibility(�κs) for methylbenzene (1) + 2-alkanols (2) at 298.15 and 308.15 K
x1 ρ (g cm−3) VE (cm3 mol−1) η (mPa s) �η (mPa s) u (m s−1) κs (TPa−1) �κs (TPa−1)
Methylbenzene (1) + hexan-2-ol (2) 298.15 K0.0000 0.81084 0.000 4.105 0.000 1290 741 00.0497 0.81291 0.017 3.548 −0.381 1286 744 60.1007 0.81508 0.031 3.087 −0.660 1284 744 80.1588 0.81753 0.058 2.741 −0.800 1281 745 120.1993 0.81929 0.073 2.427 −0.970 1278 747 170.2520 0.82150 0.108 2.110 −1.100 1274 750 230.2999 0.82359 0.134 1.849 −1.191 1270 753 280.3495 0.82577 0.162 1.619 −1.245 1269 752 300.4016 0.82816 0.183 1.439 −1.240 1267 752 330.4468 0.83021 0.210 1.318 −1.200 1265 753 370.5012 0.83270 0.243 1.165 −1.160 1265 750 370.5502 0.83510 0.257 1.061 −1.090 1264 749 390.6003 0.83761 0.269 0.953 −1.020 1263 748 410.6492 0.84023 0.264 0.920 −0.880 1267 741 370.7008 0.84305 0.256 0.866 −0.750 1268 738 380.7476 0.84575 0.237 0.840 −0.610 1271 732 350.8006 0.84893 0.206 0.762 −0.500 1276 723 290.8502 0.85209 0.160 0.686 −0.400 1280 716 250.8945 0.85501 0.114 0.649 −0.280 1286 707 200.9407 0.85809 0.067 0.638 −0.127 1294 696 121.0000 0.86218 0.000 0.554 0.000 1306 680 0
Methylbenzene (1) + hexan-2-ol (2) 308.15 K0.0000 0.80175 0.000 2.920 0.000 1255 792 00.0497 0.80369 0.035 2.566 −0.234 1251 795 60.1007 0.80585 0.050 2.273 −0.403 1245 801 150.1588 0.80816 0.096 1.935 −0.600 1243 801 180.1993 0.80989 0.113 1.703 −0.734 1240 803 220.2520 0.81203 0.158 1.519 −0.790 1237 805 270.2999 0.81399 0.201 1.303 −0.890 1235 805 300.3495 0.81607 0.242 1.153 −0.920 1232 807 350.4016 0.81834 0.278 1.046 −0.901 1230 808 400.4468 0.82035 0.308 0.962 −0.875 1229 807 410.5012 0.82290 0.330 0.850 −0.855 1228 806 440.5502 0.82527 0.346 0.794 −0.792 1228 804 450.6003 0.82779 0.354 0.766 −0.699 1228 801 450.6492 0.83036 0.352 0.689 −0.657 1229 797 450.7008 0.83328 0.327 0.671 −0.550 1230 793 440.7476 0.83592 0.313 0.611 −0.497 1232 788 420.8006 0.83910 0.278 0.579 −0.400 1237 779 370.8502 0.84225 0.230 0.561 −0.298 1242 770 320.8945 0.84520 0.175 0.531 −0.221 1249 758 230.9407 0.84838 0.112 0.527 −0.113 1257 746 141.0000 0.85279 0.000 0.496 0.000 1270 727 0
Methylbenzene (1) + heptan-2-ol (2) 298.15 K0.0000 0.81374 0.000 5.088 0.000 1314 712 00.0514 0.81549 0.023 4.335 −0.520 1309 716 50.1014 0.81727 0.040 3.878 −0.750 1303 721 110.1469 0.81888 0.064 3.392 −1.030 1298 725 170.2008 0.82083 0.094 2.918 −1.260 1293 729 220.2519 0.82270 0.126 2.526 −1.420 1288 733 270.3007 0.82454 0.157 2.195 −1.530 1283 737 330.3480 0.82633 0.192 1.900 −1.610 1279 740 370.4006 0.82845 0.221 1.622 −1.650 1276 741 400.4526 0.83061 0.248 1.396 −1.640 1272 744 440.5002 0.83262 0.277 1.240 −1.580 1271 743 450.5501 0.83490 0.290 1.064 −1.530 1269 744 470.6011 0.83736 0.294 0.931 −1.431 1268 743 480.6574 0.84016 0.300 0.853 −1.255 1268 740 470.7011 0.84250 0.290 0.778 −1.131 1269 737 460.7560 0.84559 0.270 0.741 −0.920 1273 730 400.8000 0.84822 0.244 0.691 −0.770 1276 724 36

M. Hasan et al. / Fluid Phase Equilibria 252 (2007) 88–95 91
Table 2 (Continued)
x1 ρ (g cm−3) VE (cm3 mol−1) η (mPa s) �η (mPa s) u (m s−1) κs (TPa−1) �κs (TPa−1)
0.8540 0.85169 0.193 0.650 −0.566 1283 713 270.9009 0.85488 0.140 0.611 −0.392 1289 704 200.9475 0.85812 0.091 0.589 −0.204 1296 694 121.0000 0.86218 0.000 0.554 0.000 1306 680 0
Methylbenzene (1) + heptan-2-ol (2) 308.15 K0.0000 0.80488 0.000 3.683 0.000 1274 765 00.0514 0.80649 0.045 3.171 −0.348 1267 772 80.1014 0.80820 0.071 2.776 −0.584 1261 778 160.1469 0.80975 0.102 2.459 −0.756 1256 783 220.2008 0.81162 0.141 2.155 −0.888 1251 787 280.2519 0.81337 0.190 1.875 −1.005 1246 792 340.3007 0.81512 0.231 1.665 −1.060 1243 794 380.3480 0.81685 0.273 1.485 −1.089 1238 799 440.4006 0.81886 0.313 1.332 −1.075 1235 801 480.4526 0.82097 0.344 1.199 −1.042 1232 803 520.5002 0.82292 0.377 1.078 −1.011 1230 803 540.5501 0.82513 0.395 0.992 −0.938 1229 802 550.6011 0.82750 0.408 0.904 −0.863 1228 801 560.6574 0.83022 0.418 0.818 −0.770 1229 797 550.7011 0.83253 0.408 0.756 −0.692 1230 794 530.7560 0.83562 0.380 0.679 −0.595 1234 786 470.8000 0.83825 0.348 0.641 −0.492 1238 778 420.8540 0.84171 0.290 0.570 −0.392 1243 769 350.9009 0.84495 0.223 0.518 −0.294 1250 757 250.9475 0.84850 0.127 0.501 −0.162 1258 745 151.0000 0.85279 0.000 0.496 0.000 1270 727 0
Methylbenzene (1) + octan-2-ol (2) 298.15 K0.0000 0.81708 0.000 6.429 0.000 1328 694 00.0494 0.81849 0.020 5.547 −0.592 1323 698 50.0991 0.81989 0.053 4.813 −1.034 1317 703 100.1497 0.82139 0.082 4.186 −1.364 1313 706 140.1999 0.82291 0.115 3.559 −1.695 1306 712 200.2511 0.82447 0.156 3.069 −1.885 1299 719 270.2996 0.82603 0.190 2.652 −2.017 1294 723 320.3540 0.82783 0.230 2.239 −2.110 1289 727 370.3998 0.82943 0.260 1.966 −2.115 1285 730 400.4469 0.83112 0.293 1.690 −2.114 1279 736 460.5000 0.83315 0.322 1.462 −2.030 1277 736 480.5509 0.83522 0.343 1.263 −1.930 1273 739 510.5995 0.83733 0.355 1.104 −1.803 1271 739 520.6486 0.83967 0.349 0.947 −1.672 1270 738 520.7010 0.84233 0.334 0.880 −1.431 1270 736 510.7477 0.84488 0.311 0.791 −1.245 1271 733 480.7989 0.84789 0.272 0.716 −1.020 1273 728 440.8513 0.85118 0.224 0.628 −0.800 1278 719 360.9000 0.85446 0.170 0.636 −0.505 1286 708 260.9511 0.85812 0.107 0.574 −0.268 1294 696 151.0000 0.86218 0.000 0.554 0.000 1306 680 0
Methylbenzene (1) + octan-2-ol (2) 308.15 K0.0000 0.80989 0.000 4.365 0.000 1292 740 00.0494 0.81113 0.040 3.837 −0.337 1285 747 70.0991 0.81240 0.084 3.373 −0.608 1280 751 120.1497 0.81376 0.124 2.975 −0.811 1274 757 190.1999 0.81511 0.173 2.563 −1.029 1268 763 250.2511 0.81648 0.233 2.264 −1.129 1261 770 330.2996 0.81785 0.285 1.986 −1.220 1257 774 370.3540 0.81946 0.340 1.685 −1.310 1250 781 450.3998 0.82091 0.379 1.488 −1.330 1247 783 480.4469 0.82249 0.414 1.276 −1.360 1243 787 520.5000 0.82435 0.451 1.121 −1.310 1239 790 560.5509 0.82629 0.473 1.004 −1.230 1235 793 600.5995 0.82832 0.478 0.912 −1.134 1234 793 590.6486 0.83043 0.487 0.836 −1.020 1232 793 61

92 M. Hasan et al. / Fluid Phase Equilibria 252 (2007) 88–95
Table 2 (Continued)
x1 ρ (g cm−3) VE (cm3 mol−1) η (mPa s) �η (mPa s) u (m s−1) κs (TPa−1) �κs (TPa−1)
0.7010 0.83294 0.472 0.770 −0.883 1233 790 580.7477 0.83537 0.445 0.707 −0.765 1234 786 550.7989 0.83832 0.391 0.649 −0.626 1237 780 490.8513 0.84160 0.320 0.569 −0.502 1241 772 420.9000 0.84493 0.236 0.573 −0.310 1247 761 320.9511 0.84866 0.140 0.506 −0.179 1255 748 201.0000 0.85279 0.000 0.496 0.000 1270 727 0
Table 3Parameters and standard deviations σ of Eqs. (5) and (6) for methylbenzene + 2-alkanols
Temperature (K) a0 a1 a2 a3 σ
Toluene + hexan-2-ol
VE (cm3 mol−1) 298.15 0.960 0.821 −0.246 −0.444 0.004308.15 1.286 0.784 −0.014 – 0.008
�η (mPa s) 298.15 −4.548 2.698 −0.615 – 0.036308.15 −3.402 1.827 −0.091 −0.429 0.018
�κs (TPa−1) 298.15 150.407 68.571 5.210 – 0.928308.15 173.879 75.246 36.023 – 0.550
Toluene + heptan-2-ol
VE (cm3 mol−1) 298.15 1.071 0.798 −0.005 −0.092 0.005308.15 1.477 1.024 0.2615 – 0.006
�η (mPa s) 298.15 −6.244 1.901 −0.7205 1.7132 0.038308.15 −3.956 2.081 −1.4075 – 0.014
�κs (TPa−1) 298.15 186.021 72.990 −18.785 −8.7292 0.656308.15 214.196 80.501 23.973 −12.4082 0.658
Toluene + octan-2-ol
VE (cm3 mol−1) 298.15 1.252 0.748 0.034 0.253 0.001308.15 1.778 1.124 0.079 – 0.006
�η (mPa s) 298.15 −8.102 3.1864 −1.051 0.689 0.021308.15 −5.087 1.947 −0.276 – 0.024
�κs (TPa−1) 298.15 193.014 117.703 18.867 – 0.691308.15 217.858 108.349 68.226 50.906 1.495
Table 4Correlated results of McAllister’s multi-body models
Mixture T (K) Three-body model Four-body model
ν12 ν21 σ ν1112 ν1122 ν2221 σ
Methylbenzene + hexan-2-ol 298.15 1.120 1.760 3.91 1.109 0.970 2.603 0.126308.15 0.718 1.381 2.65 0.748 0.747 1.933 0.097
Methylbenzene + heptan-2-ol 298.15 0.822 2.361 3.05 0.828 1.043 3.230 0.133308.15 0.756 1.841 3.10 0.627 1.412 2.051 0.147
Methylbenzene + octan-2-ol 298.15 0.836 3.054 1.62 0.778 1.360 3.846 0.097308.15 0.766 2.265 2.34 0.723 1.074 2.844 0.135
M. Hasan et al. / Fluid Phase Eq
Fig. 1. Excess molar volumes (VE) at 298.15 K for x methylbenzene + (1 − x )a
lbao
mmtvom
ut
l
Fa
a
l
wa
ce
σ
wrfmifs
m[eds
1 1
lkanols: (�) hexan-2-ol, (�) heptan -2-ol, and (�) octan-2-ol.
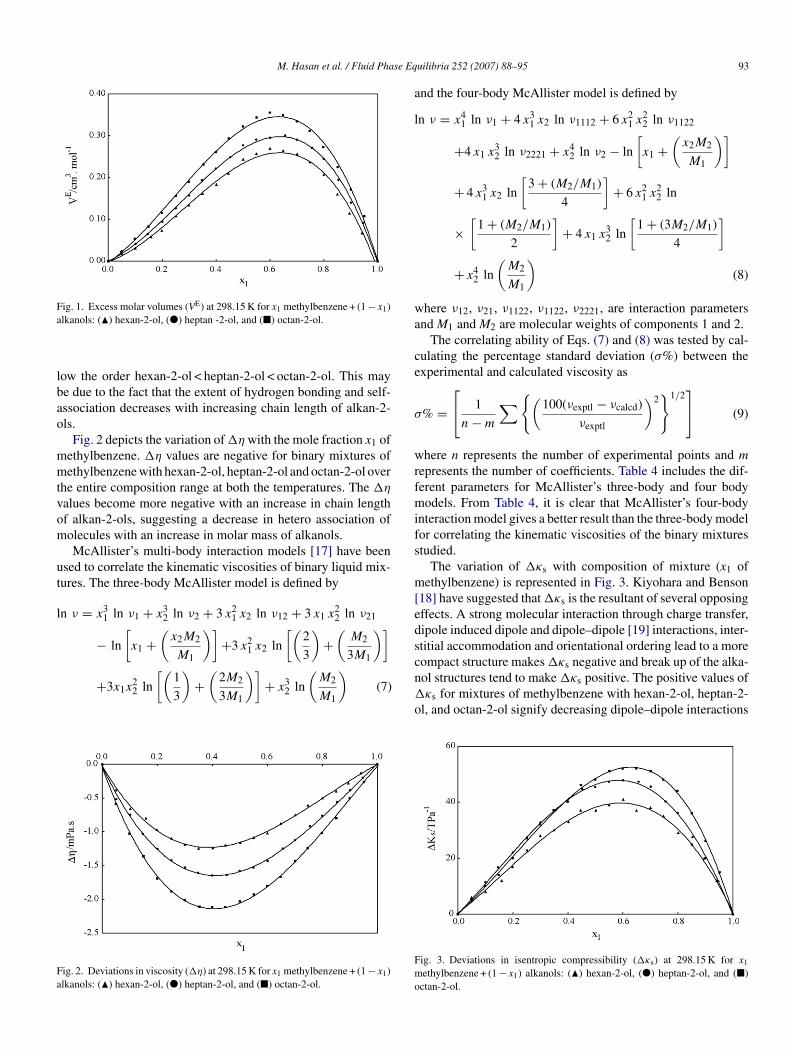
ow the order hexan-2-ol < heptan-2-ol < octan-2-ol. This maye due to the fact that the extent of hydrogen bonding and self-ssociation decreases with increasing chain length of alkan-2-ls.
Fig. 2 depicts the variation of �η with the mole fraction x1 ofethylbenzene. �η values are negative for binary mixtures ofethylbenzene with hexan-2-ol, heptan-2-ol and octan-2-ol over
he entire composition range at both the temperatures. The �η
alues become more negative with an increase in chain lengthf alkan-2-ols, suggesting a decrease in hetero association ofolecules with an increase in molar mass of alkanols.McAllister’s multi-body interaction models [17] have been
sed to correlate the kinematic viscosities of binary liquid mix-ures. The three-body McAllister model is defined by
n ν = x31 ln ν1 + x3
2 ln ν2 + 3 x21 x2 ln ν12 + 3 x1 x2
2 ln ν21
− ln
[x1 +
(x2M2
M1
)]+3 x2
1 x2 ln
[(2
3
)+
(M2
3M1
)]
+3x1x22 ln
[(1
3
)+
(2M2
3M1
)]+ x3
2 ln
(M2
M1
)(7)
ig. 2. Deviations in viscosity (�η) at 298.15 K for x1 methylbenzene + (1 − x1)lkanols: (�) hexan-2-ol, (�) heptan-2-ol, and (�) octan-2-ol.
cn�
o
Fmo
uilibria 252 (2007) 88–95 93
nd the four-body McAllister model is defined by
n ν = x41 ln ν1 + 4 x3
1 x2 ln ν1112 + 6 x21 x2
2 ln ν1122
+4 x1 x32 ln ν2221 + x4
2 ln ν2 − ln
[x1 +
(x2M2
M1
)]
+ 4 x31 x2 ln
[3 + (M2/M1)
4
]+ 6 x2
1 x22 ln
×[
1 + (M2/M1)
2
]+ 4 x1 x3
2 ln
[1 + (3M2/M1)
4
]
+ x42 ln
(M2
M1
)(8)
here ν12, ν21, ν1122, ν1122, ν2221, are interaction parametersnd M1 and M2 are molecular weights of components 1 and 2.
The correlating ability of Eqs. (7) and (8) was tested by cal-ulating the percentage standard deviation (σ%) between thexperimental and calculated viscosity as
% =⎡⎣ 1
n − m
∑ {(100(νexptl − νcalcd)
νexptl
)2}1/2
⎤⎦ (9)
here n represents the number of experimental points and mepresents the number of coefficients. Table 4 includes the dif-erent parameters for McAllister’s three-body and four bodyodels. From Table 4, it is clear that McAllister’s four-body
nteraction model gives a better result than the three-body modelor correlating the kinematic viscosities of the binary mixturestudied.
The variation of �κs with composition of mixture (x1 ofethylbenzene) is represented in Fig. 3. Kiyohara and Benson
18] have suggested that �κs is the resultant of several opposingffects. A strong molecular interaction through charge transfer,ipole induced dipole and dipole–dipole [19] interactions, inter-titial accommodation and orientational ordering lead to a more
ompact structure makes �κs negative and break up of the alka-ol structures tend to make �κs positive. The positive values ofκs for mixtures of methylbenzene with hexan-2-ol, heptan-2-l, and octan-2-ol signify decreasing dipole–dipole interactions
ig. 3. Deviations in isentropic compressibility (�κs) at 298.15 K for x1
ethylbenzene + (1 − x1) alkanols: (�) hexan-2-ol, (�) heptan-2-ol, and (�)ctan-2-ol.

94 M. Hasan et al. / Fluid Phase Eq
Fm
dleimst
vt
esat(rst
smothbat
hwaprpmmcmt
ct
l
wand solvents 1 and 2 at temperature T, respectively, f1 and f2 arethe mole fraction, and Aj are the model constants.
The correlating ability of the Jouyban–Acree model wastested by calculating the average percentage deviation (APD)
ig. 4. An FTIR spectra of methylbenzene + heptan-2-ol at 0.6 mol fraction ofethylbenzene.
ue to decreasing proton donating abilities with increasing chainength of alkan-2-ols. De-clustering of alkan-2-ols in the pres-nce of methylbenzene may also lead to positive �κs values. Its seen that the maximum in VE and �κs occur at about the sameole fraction of methylbenzene for all the three binary mixtures
uggesting the formation of a similar type of complex in all thehree binary mixtures.
Conclusions drawn from density, viscosity and ultrasonicelocity measurements could be well supported by spectroscopicechniques [20,21].
The FTIR spectrum of a substance is affected by the influ-nce by the medium in which it is phased due to presence ofpecific interactions between the proton donors (e.g. R–OH)nd acceptors (e.g. aromatic rings). In present case an IR ofhe two mixtures, namely, methylbenzene (x1) + heptan-2-ol1 − x ) and methylbenzene + 2-octanol at x = 0.6 have been
1 1ecorded at room temperature and then it is compared with thepectra of the corresponding pure components of the liquid mix-ures. Neat IR of self-associated 2-heptan-2-ol and 2-octanolFa
uilibria 252 (2007) 88–95
how νO–H at 3347 and 3348 cm−1. When methylbenzene isixed with reported alkanols, a frequency shift of νO–H is
bserved at higher wavelength, i.e. 3357 and 3363 cm−1, respec-ively. A representative figure of FTIR of methylbenzene witheptan-2-ol is shown in Fig. 4. This we can ascribe as due to thereaking of homo associated hydrogen bond i.e. O–H· · ·O–Hnd formation of complex between the hetero components ofhe liquid mixtures.
NMR is a powerful tool for identifying and characterizingydrogen bonds and dipole–dipole interactions. In the case ofeak hydrogen bonding, diamagnetic anisotropy of the donor
tom or group may become dominant. The PMR spectrum ofure liquids and liquid mixtures has been recoded in CDCl3 atoom temperature. It is seen that there is shifting of aromaticrotons in the liquid mixtures, i.e. methylbenzene (7–7.38δ),ethylbenzene + heptan-2-ol (7.09–7.23δ), shown in Fig. 5, andethylbenzene + 2-octanol (7.15–7.22δ). This is evidently the
ase of �· · ·H interaction between electron rich phenyl ring ofethylbenzene, as –CH3 group enhances the electron density of
he ring, and H- atom of –OH group of 2-alkanol.Recently Jouyban and Acree [22,23] proposed a model for
orrelating the density and viscosity of liquid mixtures at variousemperatures. The proposed equation is
n ym,T = f1 ln y1,T + f2 ln y2,T + f1f2
∑ [Aj(f1 − f2)j
T
](12)
here ym,T, y1,T and y2,T is density, or viscosity of the mixture
ig. 5. Varian mercury YH-300 PMR spectra of methylbenzene + heptan-2-olt 0.6 mol fraction of methylbenzene.

M. Hasan et al. / Fluid Phase Equilibria 252 (2007) 88–95 95
Table 5Parameters of Jouyban–Acree model and average percentage deviation for densities, viscosities and ultrasonic velocities
System A0 A1 A2 APD
DensityMethylbenzene + hexan-2-ol −5.439 −2.191 0.146 0.0298Methylbenzene + heptan-2-ol −7.655 −3.249 −0.766 0.0354Methylbenzene + octan-2-ol −9.328 −4.15 −0.954 0.0331
ViscosityMethylbenzene + hexan-2-ol −351.142 42.231 193.508 3.3377Methylbenzene + heptan-2-ol −306.14 −115.914 −47.1 2.7267Methylbenzene + octan-2-ol −299.454 −185.986 0.583 1.5262
Ultrasonic velocity
ba
A
wne
uAtc
aacbc
A
v
R
[
[
[
[
[
[[
[[
[
[
[
[
[
[
[
Methylbenzene + hexan-2-ol −31.869Methylbenzene + heptan-2-ol −38.96Methylbenzene + octan-2-ol −38.759
etween the experimental and calculated density and viscositys
PD = 100
N
∑ [( |yexptl − ycalcd|yexptl
)](13)
here N is the number of data points in each set. The optimumumbers of constants Aj, in each case, were determined from thexamination of the average percentage deviation value.
The Jouyban–Acree model was not previously applied toltrasonic velocity measurements, we extend the Jouyban–cree model (Eq. (12)) to ultrasonic velocity of the liquid mix-
ures with f as the mole fraction and again apply Eq. (13) fororrelating ability of the model.
The constant Aj calculated from the least squares analysis,re presented in Table 5 along with the average percentage devi-tion (APD). The proposed model provides reasonably accuratealculations for the density, viscosity and ultrasonic velocity ofinary liquid mixtures at various temperatures and the modelould be used in data modeling.
cknowledgment
Authors thank Principal M.S.G. College for the facilities pro-ided.
eferences
[1] P.S. Nikam, L.N. Shirsat, M. Hasan, J. Chem. Eng. Data 43 (1998) 732–737.[2] P.S. Nikam, M.C. Jadhav, M. Hasan, J. Mol. Liquids 76 (1998) 1–11.[3] P.S. Nikam, M.C. Jadhav, M. Hasan, Acustica, Acta Acustica 83 (1997)
86–89.[4] P.S. Nikam, T.R. Mahale, M. Hasan, Acustica Acta Acustica 84 (1998)
579–584.[5] P.S. Nikam, B.S. Jagdale, A.B. Sawant, M. Hasan, Acoustic Lett. 22 (1999)
199–203.[6] U.B. Kadam, A.P. Hiray, A.B. Sawant, Mehdi Hasan, J. Chem. Eng. Data
51 (2006) 60–63.
[
[
−14.503 −4.486 0.1333−14.18 −1.962 0.1416−24.783 −9.814 0.1222
[7] M. Hasan, U.B. Kadam, A.P. Hiray, A.B. Sawant, J. Chem. Eng. Data 51(2006) 671–675.
[8] U.B. Kadam, A.P. Hiray, A.B. Sawant, M. Hasan, J. Chem. Thermodyn.38 (2006) 1675–1683.
[9] P.S. Nikam, B.S. Jagdale, A.B. Sawant, M. Hasan, J. Chem. Eng. Data 45(2000) 559–563.
10] P.S. Nikam, B.S. Jagdale, A.B. Sawant, M. Hasan, J. Pure Appl. Ultrasonics22 (2000) 115–122.
11] M. Hasan, D.F. Shirude, A.P. Hiray, U.B. Kadam, A.B. Sawant, J. Chem.Eng. Data 51 (2006) 1922–1926.
12] P.S. Nikam, M. Hasan, R.P. Shewale, A.B. Sawant, J. Solut. Chem. 32(2003) 987–995.
13] P.S. Nikam, R.P. Shewale, A.B. Sawant, M. Hasan, J. Chem. Eng. Data 50(2005) 487–491.
14] K.N. Marsh, Recommended Reference Materials for the Realisation ofPhysicochemical Properties, Blackwell Scientific Publications, Oxford,U.K., 1987.
15] O. Redlich, A.T. Kister, Ind. Eng. Chem. 40 (1948) 345–348.16] J. Ortega, S. Matos, M.I. Paz Andrade, J. Fernandez, I. Romani, J. Chem.
Thermodyn. 18 (1986) 419–422.17] R.A. McAllister, AIChE J. 6 (1960) 427–431.18] O. Kiyohara, G.C. Benson, J. Chem. Thermodyn. 11 (1979) 861–
873.19] R.D. Rai, R.K. Shukla, A.K. Shukla, J.D. Pandey, J. Chem. Thermodyn.
21 (1989) 125–129.20] G.A. Jeffey, An Introduction to Hydrogen Bonding, Oxford University
Press, 1997.21] L.M. Jackman, S. Sternhell, Applications of Nuclear Magnetic Resonance
in Organic Chemistry, Pegamon Press, Oxford, 1969.22] A. Jouyban, M. Khoubnasabjafari, Z. Vaez-gharamaleki, Z. Fekari, W.E.
Acree Jr., Chem. Pharm. Bull. 53 (2005) 519–523.23] A. Jouyban, A. Fathi-Azarbayjani, M. Khoubnasabjafari, W.E. Acree Jr.,
Indian J. Chem. 44 (2005) 1553–1560.24] J.A. Riddick, W.B. Bunger, T.K. Sakano, Organic Solvents, Physical Prop-
erties and Methods of Purification, Techniques of Chemistry, vol. II, 4thed., Wiley–Interscience, New York, 1986.
25] J.A. Dean, Handbook of Organic Chemistry, McGraw-Hill International
Edition, Chemistry Series, 1988.26] J.D. Pandey, A.K. Shukla, N. Tripathi, J.P. Dubey, Pramana J. Phys. 2(1993) 81–87.
27] T.M. Aminabhavi, M.I. Aralaguppi, S.B. Harogoppad, R.H. Balundgi, J.Chem. Eng. Data 43 (1993) 31–39.