demystifying private sector credit slowdown: a case study
TRANSCRIPT

Demystifying Private Sector Credit Slowdown: A Case
Study of Kenya and Uganda
Presented by: Britam Asset Managers
20th September 2017

| Unit Trust Funds | Wealth Management | Pensions | Property
| Discretionary Management | Offshore Investments | Alternative
Investments
2
Presentation Outline
Part One: Who We Are
I. Overview of Britam Group
II. Introduction to Britam Asset Managers
Part Two: Private Sector Credit Growth
I. Monetary Policy Effects
II. Fiscal Policy Effects
III. Asset Quality Effects
IV. Summary & Outlook

I. Who We Are
I. Overview of Britam Group
II. Introduction to Britam Asset Managers

I. Britam Holdings PLC Overview
Britam is a leading diversified financial services group and is listed on the Nairobi
Securities Exchange. The group has presence in seven Africa countries in Kenya, Uganda,
Tanzania, Rwanda, South Sudan, Mozambique and Malawi.
Britam offers a wide range of financial products and services which include: Asset
Management, Life Assurance, Retirement Planning, General Insurance, Health Insurance,
Banking and Property. These financial solutions enable our customers to create and protect
their wealth and lives every step of the way.
For more information please visit http://www.britam.com

| Unit Trust Funds | Wealth Management | Pensions | Property
| Discretionary Management | Offshore Investments | Alternative
Investments
5
Our Footprint
1965 2017

| Unit Trust Funds | Wealth Management | Pensions | Property
| Discretionary Management | Offshore Investments | Alternative
Investments
6
Corporate & Business Leadership
Benson I. Wairegi EBS
Group Managing Director
“ experienced, dynamic and cohesive leadership team and staff”
Kenneth Kaniu
CEO, Britam Asset Managers
Gladys Karuri
Principal Executive Director, Finance & Strategy
Muthoga Ngera
Director, Marketing & Corporate Affairs
Nancy K. Kiruki,
Director, Legal& Company Secretary
Stephen O. Wandera
Principal Executive Director, Insurance

| Unit Trust Funds | Wealth Management | Pensions | Property
| Discretionary Management | Offshore Investments | Alternative
Investments
7
0.6
1.0%
1.0%
Britam Holdings
Insurance
Business
Asset
Management
Banking
Business
• Life Insurance
• General
Insurance
• Health Insurance
• Pension Business
• Unit Trust Funds
• Discretionary
Portfolio
Management
• Property
• Pensions
• Wealth
Management
• Diaspora
Services
• Equity Bank
Stake – 8.2%
• Housing
Finance Stake –
48.82%
• Britam Properties-
100%
Property
Business

II. Introduction to Britam Asset Managers

| Unit Trust Funds | Wealth Management | Pensions | Property
| Discretionary Management | Offshore Investments | Alternative
Investments
9
James Mose, CFA
Ag Chief Investment
Officer
Asset Management Executive Team
Kenneth Kaniu
Chief Executive
Officer
Janet Waweru ACCA
Chief Accountant
John Etyang
Head, Business
Development
Charles Chirchir
Chief Operating
Officer
Miriam Kahiro
Legal Manager
Dennis Katei
Compliance Manager
Eva Mbora
Human Resources
Manager

| Unit Trust Funds | Wealth Management | Pensions | Property
| Discretionary Management | Offshore Investments | Alternative
Investments
10
Our Business Is Categorized as follows:
• Development Funds
• Income Funds
Asset Management Businesses
Retail Products Institutional Solutions Real Estate
Investments
• Unit Trust Funds
• Wealth Management
• Diaspora Services
• Discretionary Portfolio
Management
• Pension Schemes

| Unit Trust Funds | Wealth Management | Pensions | Property
| Discretionary Management | Offshore Investments | Alternative
Investments
11
Our Approach Is To Understand Client Needs And Apply Our
Resources To Meeting Those Needs, through:
Experienced & World Class Capabilities
Strong Brand & Group Backing
Customized Investment Approach
Diverse Product Set

| Unit Trust Funds | Wealth Management | Pensions | Property
| Discretionary Management | Offshore Investments | Alternative
Investments
12
Our Accolades
Britam Asset Managers Clinched the Fund Manager of the
Year Award in 2011, 2012 and 2013 and the Unit Trust of the
Year Award in 2012, 2013, 2015 and 2016
Think Business Awards 2011-2016
• Unit Trust of the Year, Winner - 2012, 2013, 2015, 2016
• Best Performing Money Market Fund, Winner - 2014, 2016
• Best Performing Equity Fund, 2nd Runner up 2014, Winner,
2015, 2016
• Fund Manager of the Year: Alternative Investments and
Private Equity, Winner - 2014, 2015, 2016
• Fund Manager of the Year: Overall Winner – 2011, 2012,
2013, 2nd Runner up 2014, and 1st Runner up 2015, 2016
• Fund Manager of the Year: Pensions - 1st Runner-up, 2014,
2016
• Fund Manager of the Year: Equity- 1st Runner Up, 2014,
2016, Winner – 2015
• Fund Manager of the Year: Money Market - 1st Runner-up,
2014, 2016
“Our history of success provides
financial security for our clients”

I. Introduction
I. Introduction
II. Factors Affecting Private Sector Credit Growth
Monetary Policy Effects
Fiscal Policy Effects
Asset Quality Effects
III. Summary & Outlook

| Unit Trust Funds | Wealth Management | Pensions | Property
| Discretionary Management | Offshore Investments | Alternative
Investments
14
Economic Growth GDP growth has remained stronger than regional peers
Source:: IMF
Kenya
GDP – USD 68.9bn
Population – 45.5mn
Economies of Kenya and Uganda have outpaced that of peers and the growth has mainly been infrastructure
led
The private sector has however not similarly benefited from the headline growth due to constraints in accessing
funding
1.4%
2.6%
3.5%
5.9%
5.3% 5.8%
4.7% 5.0%
5.8%
0%
1%
2%
3%
4%
5%
6%
7%
2016 2017P 2018F
SSA Kenya Uganda
GDP Growth

| Unit Trust Funds | Wealth Management | Pensions | Property
| Discretionary Management | Offshore Investments | Alternative
Investments
15
Credit Comparison
Kenya and Uganda lags peers in terms of Credit to GDP, implying more room for credit
growth
Source: World Bank ,BAM Research
Kenya
GDP – USD 68.9bn
Population – 45.5mn
Despite the improvement in headline economic growth, credit/GDP still lags behind regional peers, suggesting
greater access to credit can further spur economic growth in the medium term
26%
9%
61%
14%
27%
13%
55%
20%
33%
14%
30% 28%
0%
10%
20%
30%
40%
50%
60%
70%
Kenya Uganda SSA Least DevelopedCountries
Credit to GDP vs Peers
2005 2010 2016

| Unit Trust Funds | Wealth Management | Pensions | Property
| Discretionary Management | Offshore Investments | Alternative
Investments
16
Kenya Private Sector Credit Growth
Private Sector Credit Growth has been slowing down since 2015
Source: CBK, BAM Research
Kenya
GDP – USD 68.9bn
Population – 45.5mn
Private sector credit has been sluggish in the last two years, with growth coming in at 5.1% in 2016 and
contracting by 1.5% in the first 7 months of 2017 – the first incidence of contraction in the last 7 years
1,167 1,293
1,552
1,898
2,224 2,337 2,302
30.4%
10.8%
20.0% 22.3% 17.1%
5.1%
-1.5%
-5%
0%
5%
10%
15%
20%
25%
30%
35%
0
500
1,000
1,500
2,000
2,500
2011 2012 2013 2014 2015 2016 2017 YTD
Private Sector Credit, KES Bns Credit Growth
Kenya Private Sector Credit Growth
YTD 2017 figures as at July 2017

| Unit Trust Funds | Wealth Management | Pensions | Property
| Discretionary Management | Offshore Investments | Alternative
Investments
17
Uganda Private Sector Credit Growth
Credit Growth has been slowing since 2015
Source: BOU, BAM Research
Kenya
GDP – USD 68.9bn
Population – 45.5mn
The same was observed in Uganda where credit growth slowed down similarly over the last two years
At its lowest point, March 2016, credit growth in Uganda had contracted by 1.2% but this has since recovered to
a 0.2% growth in the first six months of 2017
7,269 8,128
8,614
9,826
11,328 12,058 12,085
28.3%
11.8%
6.0%
14.1% 15.3%
6.4%
0.2%
0.0%
5.0%
10.0%
15.0%
20.0%
25.0%
30.0%
0
2,000
4,000
6,000
8,000
10,000
12,000
14,000
2011 2012 2013 2014 2015 2016 2017 YTD
Private Sector Credit, UGX Bns Credit Growth
YTD 2017 figures as at June 2017

| Unit Trust Funds | Wealth Management | Pensions | Property
| Discretionary Management | Offshore Investments | Alternative
Investments
18
Kenya Private Sector Credit Breakdown
Access to credit in the real economic sectors remains disproportionately skewed
Source: CBK, BAM Research
Kenya
GDP – USD 68.9bn
Population – 45.5mn
Most sectors of the real economy have disproportionate access to credit, with real estate and trade’s share of
total credit coming in at almost double their relative contribution to the real economy
55% of Kenya’s loans are concentrated in manufacturing, trade, real estate and transport. Agriculture, the biggest
contributor to GDP, remains relatively starved of credit
22%
10%
8% 8% 7%
6% 5%
2% 1% 1%
4%
12%
20%
14%
9%
4% 5% 5%
3% 1%
0%
5%
10%
15%
20%
25%
Agriculture Manufacturing Trade Real Estate Transport FinancialServices
Construction Energy Tourism Mining
% GDP % Credit
Loan Access by sector 2016

| Unit Trust Funds | Wealth Management | Pensions | Property
| Discretionary Management | Offshore Investments | Alternative
Investments
19
Uganda Private Sector Credit Breakdown
Similar to Kenya some sectors remain relatively starved of credit
Source: BOU BAM Research
Kenya
GDP – USD 68.9bn
Population – 45.5mn
Real estate and trade’s share of total credit coming in at almost double their relative contribution to the real
economy
Agriculture and services which have a combined contribution of 44% to GDP remain underserved
23%
13%
9%
12%
5%
21%
10%
19%
14%
23%
8% 8%
0%
5%
10%
15%
20%
25%
Agriculture Trade Manufacturing Building Construction andReal Estate
Transport andCommunication
Services
Proportion of GDP Proportion of Loans
Loan Access by sector 2016
II. Factors Affecting Private Sector Credit Growth
I. Introduction
II. Factors Affecting Private Sector Credit Growth
Policy Effects
• Monetary Policy Effects
• Fiscal Policy Effects
Asset Quality Effects
III. Summary & Outlook

| Unit Trust Funds | Wealth Management | Pensions | Property
| Discretionary Management | Offshore Investments | Alternative
Investments
21
Kenya: Monetary Policy Effects
Credit Growth has been negatively impacted by increased short term rates
Source: Bloomberg, BAM Research
Kenya
GDP – USD 68.9bn
Population – 45.5mn
Increased short term rates have led to depressed credit growth as banks allocate more to government
securities leading to crowding out of the private sector as the government gets preferential credit
The relationship between short term rates and private sector credit growth has however been weak, with
growth remaining at 10% in 2012 despite the spike in short term rates
20.2%
-1.5%
8.6%
10%
0%
2%
4%
6%
8%
10%
12%
14%
16%
18%
-5%
0%
5%
10%
15%
20%
25%
30%
35%
2010 2011 2012 2013 2014 2015 2016 2017
Private Sector Credit Growth 91 Day Tbill Rates CBR
Rates vs. Credit Growth

| Unit Trust Funds | Wealth Management | Pensions | Property
| Discretionary Management | Offshore Investments | Alternative
Investments
22
Kenya: Monetary Policy Effects- Interest Rate Caps
Interest rate capping has been detrimental to credit growth
Source: CBK, BAM Research
Kenya
GDP – USD 68.9bn
Population – 45.5mn
Banks have become more averse to lending since the enactment of the interest rate caps. The effect has been
more severe in 2017 where credit has contracted 1.5% from the levels seen in December 2016.
The direct link between the Central Bank Rate and lending rates has impeded setting of monetary policy due to
the ramifications of any change in CBR to loan pricing
-1.5%
-1.0%
-0.5%
0.0%
0.5%
1.0%
1.5%
2.0%
2.5%
3.0%
Jan
Ma
r
Ma
y
Ju
l
Sep
No
v
Jan
Ma
r
Ma
y
Ju
l
Sep
No
v
Jan
Ma
r
Ma
y
Ju
l
Sep
No
v
Jan
Ma
r
Ma
y
Ju
l
Sep
No
v
Jan
Ma
r
Ma
y
Ju
l
Sep
No
v
Jan
Ma
r
Ma
y
Ju
l
2012 2013 2014 2015 2016 2017
Month-on-month Private Sector Credit Growth
5 Year Historical Average = 1.0%

| Unit Trust Funds | Wealth Management | Pensions | Property
| Discretionary Management | Offshore Investments | Alternative
Investments
23
Uganda: Monetary Policy Effects
Similar to Kenya, short term rates have had negative correlation to credit growth
Source: BOU BAM Research
Kenya
GDP – USD 68.9bn
Population – 45.5mn
Rising short term rates have negatively impacted credit growth as banks allocate more to government
securities which are perceived to be risk free unlike loans which have a higher probability of default
From its lowest point, private sector credit has recovered by more than 8% due to the Central Bank’s aggressive
monetary easing
28.3%
0.2%
18.2%
11.2%
14.6% 11.8%
0%
2%
4%
6%
8%
10%
12%
14%
16%
18%
20%
0%
5%
10%
15%
20%
25%
30%
2011 2012 2013 2014 2015 2016 *June 17
Rates vs. Credit Growth
Private Sector Credit Growth CBR Average 91 day tbill

| Unit Trust Funds | Wealth Management | Pensions | Property
| Discretionary Management | Offshore Investments | Alternative
Investments
24
Kenya: Fiscal Policy Effects
Source: National Treasury, BAM Research
Kenya
GDP – USD 68.9bn
Population – 45.5mn
38%
14%
22%
4%
-2%
38%
14%
20%
31%
10%
20% 22%
17%
5%
-10%
0%
10%
20%
30%
40%
2010 2011 2012 2013 2014 2015 2016
Public Sector Credit Growth Private Sector Credit Growth
Public vs Private Sector Credit Growth
The government has recently been increasing its fiscal deficits, largely due to infrastructure led spending
The Governments increased use of domestic financing has resulted in crowding out of the private sector
Increased fiscal deficits have led to increased domestic borrowing

| Unit Trust Funds | Wealth Management | Pensions | Property
| Discretionary Management | Offshore Investments | Alternative
Investments
25
Source: BOU,BAM Research
Kenya
GDP – USD 68.9bn
Population – 45.5mn
Uganda: Fiscal Policy Effects
The Ugandan government has had a similar pattern to Kenya’s, increasing budget deficit from 3.4% of GDP in
2013 to 6.4% in 2016 thus increasing government borrowing to fund infrastructure spending
However, this has been more pronounced than Kenya which has sourced more external borrowing
36%
-20%
43%
21% 21%
-10%
27%
42%
28%
12% 6%
14% 15%
6%
-30%
-20%
-10%
0%
10%
20%
30%
40%
50%
2010 2011 2012 2013 2014 2015 2016
Public Sector Credit Growth Private Sector Credit Growth
Public vs Private Sector Credit Growth
Increased fiscal deficits have led to increased government borrowing

II. Factors Affecting Private Sector Credit Growth
I. Introduction
II. Factors Affecting Private Sector Credit Growth
Policy Effects
• Monetary Policy Effects
• Fiscal Policy Effects
Asset Quality Effects
III. Summary & Outlook

| Unit Trust Funds | Wealth Management | Pensions | Property
| Discretionary Management | Offshore Investments | Alternative
Investments
27
Kenya : Asset Quality Effects
Slowing loan growth has coincided with a worsening non performing loans position
Source: CBK; BAM Research
Kenya
GDP – USD 68.9bn
Population – 45.5mn
An overall slowdown in the growth of loans in 2015 and 2016 was followed by a corresponding increase in
non-performing loans necessitating an investigation into developments per sector
21.4%
31.5%
12.5%
18.2%
22.8%
11.2%
4.4% 6.6%
4.6% 4.8% 5.3% 5.8% 7.0%
9.8%
0%
5%
10%
15%
20%
25%
30%
35%
2010 2011 2012 2013 2014 2015 2016
Loan Growth Gross NPL Ratios
Loan Growth vs NPLs

| Unit Trust Funds | Wealth Management | Pensions | Property
| Discretionary Management | Offshore Investments | Alternative
Investments
28
Kenya: Non Performing Loan ratios per sector
Construction, Trade & Agriculture all have above banking sector average NPL ratios
Source: CBK, BAM Research
Kenya
GDP – USD 68.9bn
Population – 45.5mn
Agriculture’s weak asset quality may have been affected by recent drought experience, with trade suffering as a
result of weak consumer demand while construction was influenced by delayed government payments
10% 9%
14%
8% 8%
3%
26%
5%
8% 9%
6% 4%
12%
20%
14%
9%
4% 5% 5%
3% 1%
25%
0%
5%
10%
15%
20%
25%
30%
Agriculture Manufacturing Trade Real Estate Transport FinancialServices
Construction Energy Tourism Mining Household
NPL Ratio % Credit
NPLs Ratios per sector
Figures are as at 31st December 2016

| Unit Trust Funds | Wealth Management | Pensions | Property
| Discretionary Management | Offshore Investments | Alternative
Investments
29
Kenya: Historical Evolution of NPLs
Construction & Trade had significantly better asset quality historically
Source: CBK, BAM Research
Kenya
GDP – USD 68.9bn
Population – 45.5mn
Historical performance of construction & trade sectors points to their relatively large shares of credit in the
banking sector, as these have had lower NPLs than other sectors
10% 9%
14%
8% 8%
3%
26%
5%
8% 9%
6% 7%
3% 4% 4%
3% 2%
4%
1%
7%
1%
6%
0%
5%
10%
15%
20%
25%
30%
Agriculture Manufacturing Trade Real Estate Transport FinancialServices
Construction Energy Tourism Mining Household
2016 2011
NPL Ratio Evolution
| Unit Trust Funds | Wealth Management | Pensions | Property
| Discretionary Management | Offshore Investments | Alternative
Investments
30
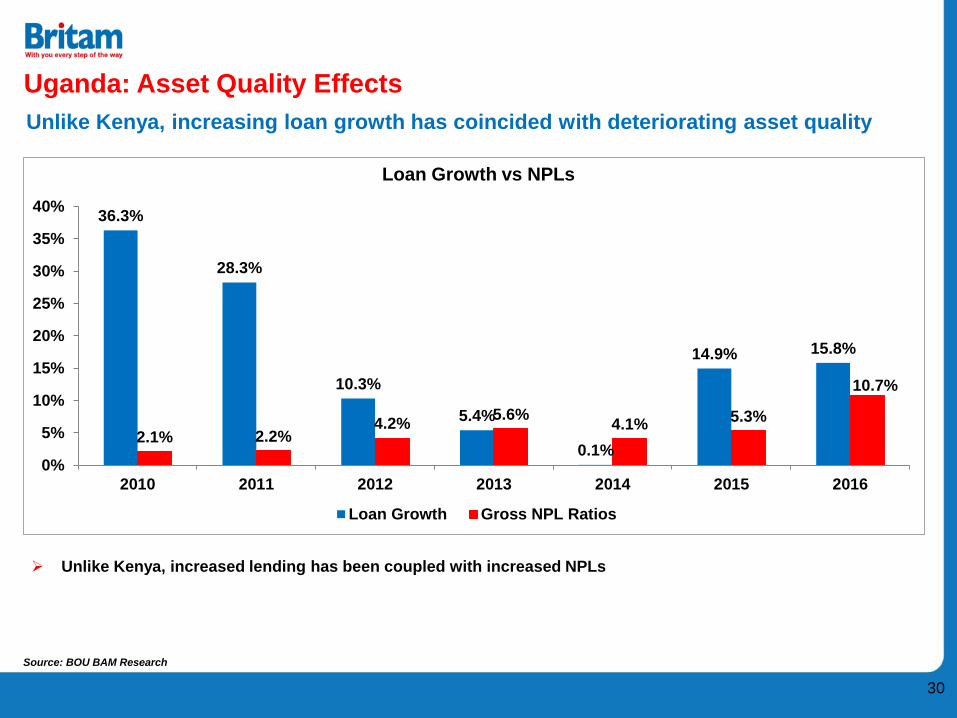
Uganda: Asset Quality Effects
Unlike Kenya, increasing loan growth has coincided with deteriorating asset quality
Source: BOU BAM Research
Kenya
GDP – USD 68.9bn
Population – 45.5mn
Unlike Kenya, increased lending has been coupled with increased NPLs
36.3%
28.3%
10.3%
5.4%
0.1%
14.9% 15.8%
2.1% 2.2% 4.2%
5.6% 4.1%
5.3%
10.7%
0%
5%
10%
15%
20%
25%
30%
35%
40%
2010 2011 2012 2013 2014 2015 2016
Loan Growth Gross NPL Ratios
Loan Growth vs NPLs

| Unit Trust Funds | Wealth Management | Pensions | Property
| Discretionary Management | Offshore Investments | Alternative
Investments
31
Uganda: Non Performing Loans per sector
Agriculture and Construction have the highest NPL ratios
Source: BOU, BAM Research
Kenya
GDP – USD 68.9bn
Population – 45.5mn
Similar to Kenya, agriculture, trade and construction’s NPL ratios remain above average
10%
15%
18% 16%
24%
12%
6%
11%
4%
12%
0%
5%
10%
15%
20%
25%
Agriculture Manufacturing Trade Household Construction
% Credit NPLs
NPLs Ratios per sector
Figures are as at 31st December 2016

| Unit Trust Funds | Wealth Management | Pensions | Property
| Discretionary Management | Offshore Investments | Alternative
Investments
32
Uganda: Historical Evolution of NPLs
NPL ratios have increased across all sectors in Uganda
Source: CBK, BAM Research
Kenya
GDP – USD 68.9bn
Population – 45.5mn
Historical NPL ratios point to a fundamental problem in the credit environment in Uganda. We believe this could
be a direct result of being in an economic downturn, which the BOU has been trying to reverse with loose
monetary policy – we expect to see improvement across the sectors in 2017
12%
6%
11%
4%
12%
2%
0% 1% 2% 1%
0%
2%
4%
6%
8%
10%
12%
14%
Agriculture Manufacturing Trade Household Construction
2016 2011
NPLs Ratio Evolution

III. Summary & Outlook
I. Introduction
II. Factors Affecting Private Sector Credit Growth
Monetary Policy Effects
Fiscal Policy Effects
Asset Quality Effects
III. Summary & Outlook

| Unit Trust Funds | Wealth Management | Pensions | Property
| Discretionary Management | Offshore Investments | Alternative
Investments
34
Summary: Influences on Private Sector Credit Growth
Private Sector Credit Growth has mainly been influenced by asset quality & fiscal policy
Asset Quality Monetary
Policy Fiscal Policy
Mainly through
movement in short
term interest rates
Mainly through
crowding out of
private sector
Mainly through banks’
credit appetite
Affects both demand
and supply of credit Affects supply of
credit
Affects Supply
Kenya: Fiscal policy and asset quality have been the main influences on private sector credit growth
in 2016-17 with the Central Bank unable to utilize monetary policy to drive increased lending
Uganda: The same has been observed in Uganda. However, private sector credit growth has seen a
recovery from mid 2016 since the Bank of Uganda has been able to effectively employ monetary
policy to boost growth

| Unit Trust Funds | Wealth Management | Pensions | Property
| Discretionary Management | Offshore Investments | Alternative
Investments
35
Way Forward
A combination of policy & lending reforms will be required to improve credit growth
Monetary Policy
Fiscal Policy
Fiscal consolidation will significantly reduce crowding out of the private
sector which will provide greater incentive for banks to grow their loan
books
Prioritization of investment spending while including the private sector will
ensure inclusive and sustainable growth
Asset Quality
Kenya: Adoption of market-based policies such as reversal or
amendment of the interest rate caps in Kenya would allow banks to
adequately price for credit risk thus spurring private sector credit growth
Uganda: Sustained loose policies will continue to support the rebound in
growth of credit to real sectors of the economy
Enhanced risk and credit assessment as well as improved information
sharing to more easily identify good borrowers and reduce underwriting
risk
Diversifying loan book exposures could dampen the effects of weak asset
quality in specific sectors of the economy

| Unit Trust Funds | Wealth Management | Pensions | Property
| Discretionary Management | Offshore Investments | Alternative
Investments
36
Risks Going Forward
Several risks remain which could further slow down private sector credit growth
Regulatory Risk:
• Implementation of IFRS 9: Expected to come into effect from January 2018. It will increase
the threshold of provisions for impairment losses thereby requiring banks to hold a more
capital buffers to cushion the loan loss allowances following its implementation
• Interest Rate Caps: The longer the rate caps stay in place the greater the magnitude of
credit contraction which further puts the anticipated economic growth at risk
Political Risk: Outcome of elections remains uncertain which in turn affects business output in
the country
Economic underperformance: Prolonged periods of extreme weather conditions continues to
place pressure on the performance of Agriculture which remains a significant contributor to GDP

| Unit Trust Funds | Wealth Management | Pensions | Property
| Discretionary Management | Offshore Investments | Alternative
Investments
37
Recap
Repeal of interest rate caps will help in improving private sector credit growth
Weak Private Credit Growth
Interest Rate Caps
Declining Asset
Quality
Increased government borrowing

THANK YOU
With you every step of the way