demonstration and evaluation of solid phase microextraction for the
TRANSCRIPT

FINAL REPORT Demonstration and Evaluation of Solid Phase Microextraction
For the Assessment of Bioavailability and Contaminant Mobility
ESTCP Project ER-200624
May 2012
Danny Reible The University of Texas at Austin Gui Lotufo Engineer Research and Development Center US Army Corps of Engineers

Standard Form 298 (Rev. 8/98)
REPORT DOCUMENTATION PAGE
Prescribed by ANSI Std. Z39.18
Form Approved OMB No. 0704-0188
The public reporting burden for this collection of information is estimated to average 1 hour per response, including the time for reviewing instructions, searching existing data sources, gathering and maintaining the data needed, and completing and reviewing the collection of information. Send comments regarding this burden estimate or any other aspect of this collection of information, including suggestions for reducing the burden, to the Department of Defense, Executive Services and Communications Directorate (0704-0188). Respondents should be aware that notwithstanding any other provision of law, no person shall be subject to any penalty for failing to comply with a collection of information if it does not display a currently valid OMB control number. PLEASE DO NOT RETURN YOUR FORM TO THE ABOVE ORGANIZATION. 1. REPORT DATE (DD-MM-YYYY) 2. REPORT TYPE 3. DATES COVERED (From - To)
4. TITLE AND SUBTITLE 5a. CONTRACT NUMBER
5b. GRANT NUMBER
5c. PROGRAM ELEMENT NUMBER
5d. PROJECT NUMBER
5e. TASK NUMBER
5f. WORK UNIT NUMBER
6. AUTHOR(S)
7. PERFORMING ORGANIZATION NAME(S) AND ADDRESS(ES) 8. PERFORMING ORGANIZATION REPORT NUMBER
9. SPONSORING/MONITORING AGENCY NAME(S) AND ADDRESS(ES) 10. SPONSOR/MONITOR'S ACRONYM(S)
11. SPONSOR/MONITOR'S REPORT NUMBER(S)
12. DISTRIBUTION/AVAILABILITY STATEMENT
13. SUPPLEMENTARY NOTES
14. ABSTRACT
15. SUBJECT TERMS
16. SECURITY CLASSIFICATION OF: a. REPORT b. ABSTRACT c. THIS PAGE
17. LIMITATION OF ABSTRACT
18. NUMBER OF PAGES
19a. NAME OF RESPONSIBLE PERSON
19b. TELEPHONE NUMBER (Include area code)

ii
EXECUTIVE SUMMARY
1.1. OBJECTIVES OF THE DEMONSTRATION The goal of the project was to develop and standardize a procedure using field deployable solid phase microextraction (SPME) for the measurement of freely-dissolved porewater concentrations of hydrophobic organics and demonstrate the relationship of these measurements to contaminant flux, bioavailability and bioaccumulation.
Specific objectives of the PDMS technology for hydrophobic organic compounds include:
Determination of mobile and available contaminants in sediments
Assessment of bioaccumulation potential in benthic organisms
Assessment of vertical chemical profiles in surficial sediments and sediment caps
The work was conducted in sediments both in laboratory and field testing. Laboratory testing allows sediments to be collected and tested in the laboratory, avoiding problematic field deployments where placement and retrieval is too difficult or costly. This testing also allows coupling of availability measurements with laboratory bioassays under controlled conditions avoiding the difficulties and variability of field bioassays. The field testing allows determination of availability and cap performance under conditions that might not be reproducible in the laboratory. All porewater measurements herein were measured in-situ (i.e. in sediments whether field or lab) and require no porewater separation from the sediments prior to analysis.
1.2. TECHNOLOGY DESCRIPTION In-situ solid-phase microextraction (SPME) is a passive sampling approach for measuring hydrophobic organic contaminants in porewater and involves the insertion of a polymer sorbent into the sediments, withdrawal after a period of time, preferably after achievement of equilibrium, and measuring the contaminants sorbed to the polymer. The contaminant concentration that accumulates in the polymer sorbent at equilibrium is directly proportional to the dissolved contaminant concentration in the porewater. The technology demonstrated here uses polydimethylsiloxane (PDMS) as a polymer sorbent as a thin coating on a glass core but is essentially equivalent to SPME using other sorbents such as polyoxymethylene (POM) and polyethylene (PE) that exhibit modest differences with PDMS. The primary advantages of PDMS are cylindrical geometry (for ease of insertion into sediments), somewhat lower sorption capacity than POM and PE (which aids the rapid achievement of equilibrium) and commercial availability in a variety of sizes and polymer coating thicknesses. Simple approaches to shield the PDMS fiber and to segment and analyze the fiber were developed as part of the demonstration. Conventional analyses are employed that require no special processing or analytical techniques so any lab that can conduct PAH and PCB analyses can support the technology. Porewater concentrations inferred from sorbent concentrations can be used to correlate with bioaccumulation or other measures of risk in benthic organisms or compared directly to comparison criteria such as surface water quality criteria. Changes in profiles over time can be linked to mechanisms and rates of contaminant migration.

iii
1.3. DEMONSTRATION RESULTS Demonstration of the technology was conducted in several phases
• Laboratory demonstration of detection limits, accuracy and reproducibility of PDMS-SPME for measurement of water concentrations
The demonstration led to generalization of existing PDMS-water partition coefficients and showed that the technology could measure HOCs with accuracy and reproducibility equivalent to conventional techniques but with very low detection limits .
• Evaluation of kinetics of uptake of PDMS-SPME for water and porewater concentrations
The demonstration led to the development of models capable of describing PDMS-SPME uptake kinetics and to the development of practical methods to evaluate uptake kinetics in field situations including the simultaneous use of fibers of different sizes to infer kinetics as well as the use of performance reference compounds.
• Laboratory demonstration of the relationship between measured porewater concentrations and bioaccumulation in various benthic organisms
The demonstration showed that the potential for bioaccumulation was proportional to measured porewater concentration for a variety of organisms and sediments. The bioconcentration factor between porewater concentration and organism lipid-normalized bioaccumulation was approximately given by the octanol-water partition coefficient, Kow, of the bioaccumulating compound.
• Laboratory demonstration of cap performance assessment using measured porewater concentration profiles
The demonstration showed that porewater concentrations in the biologically active zone of a sediment cap also indicated bioaccumulation in benthic organisms populating a cap. The dilution of bulk sediment concentration by inert nonsorbing sand was not effective at decreasing bioaccumulation in exposed organisms. The separation of benthic organisms from contaminated sediments by an inert nonsorbing sand layer, however, was effective as long as the depth of active bioturbation was less than the thickness of the sand layer.
• Field measurement of porewater concentration profiles in sediments
The demonstration showed that vertical profiles in hydrophobic organic contaminants could be measured in-situ assisting in the evaluation of the mechanisms and rates of transport. In general, multiple time series measurements are required to define contaminant dynamics. The approach was shown to be far more effective than bulk solid measurements at indicating contaminant migration in a cap.
• Field measurement of relationship between bioaccumulation in benthic organisms and measured porewater concentrations

iv
Field measurements of bioaccumulation in various benthic organisms and sediments were shown to correlate with measured porewater concentrations in the near surface sediments. Field measurements were complicated by the dynamics of uptake onto the sorbents, the dynamics of uptake in the organisms and the presence of other stressors in the field. Measured bioaccumulation was generally 20-50% of that predicted by ow pwK C although some measurements indicated bioaccumulation equal to ow pwK C .
1.4. IMPLEMENTATION ISSUES The primary difficulties associated with the in-situ PDMS measurement of porewater concentration is the time and cost of deployment and the complexities of interpretation of the results. Deployment may involve divers for both placement and retrieval (although alternative approaches exist with some limits in attainable objectives) and long delay times between placement and retrieval (7-28 days). Expert knowledge is required to appropriately balance considerations such as achievable detection limit and rate of attainment of equilibrium. Failure to accurately assess polymer uptake kinetics and the degree of equilibration with a given exposure can significantly limit the applicability of the results.
The in-situ technology described here also exhibits both advantages and disadvantages relative to an ex-situ porewater concentration approach such as that described in Hawthorne et al. (2005)1. Both technologies exhibit the advantages of porewater concentrations vs other chemical measures such as bulk –solid concentrations. Advantages of the in-situ method relative to the ex-situ method include the ability to monitor porewater concentrations under actual field conditions and the vertical distribution of porewater concentrations. Disadvantages include long exposure times in the field and the complexity of field deployments as indicated above. In addition, however, the in-situ method is more capable of detecting higher molecular weight, strongly hydrophobic compounds that are effectively concentrated on the sorbent rather than low molecular weight, less hydrophobic compounds. Thus the method is most effective at evaluating concentrations or bioaccumulation of highly hydrophobic compounds in porewater, and assessing profiles of particular contaminants to test and develop models of contaminant mobility. The method is not as effective in assessing broadly based effect parameters such as organism narcosis, which is often controlled by low molecular weight PAHs such as naphthalene and alkylated naphthalenes. The measurement of these low molecular weight compounds can be optimized with in-situ SPME but at a potential cost of negatively impacting the rate of uptake of the high molecular weight compounds.
1 Hawthorne SB, CB Grabanski, DJ Miller, and JP Kreitinger. 2005. “Solid-Phase Microextraction Measurement of Parent and Alkyl Polycyclic Aromatic Hydrocarbons in Milliliter Sediment Pore Water Samples and Determination of KDOC Values.” Environmental Science and Technology. 39: 2795-2803.

v
Contents
EXECUTIVE SUMMARY II
1.1. OBJECTIVES OF THE DEMONSTRATION .............................................. ii
1.2. TECHNOLOGY DESCRIPTION ................................................................. ii
1.3. DEMONSTRATION RESULTS .................................................................. iii
1.4. IMPLEMENTATION ISSUES .................................................................... iv
1. INTRODUCTION 1
1.1. Background .....................................................................................................1
1.2. Objectives of the Demonstration ....................................................................2
1.3. Regulatory Drivers ..........................................................................................3
2. TECHNOLOGY 4
2.1. Technology Description ..................................................................................4
2.2. Technology Development ...............................................................................5
Laboratory demonstration of detection limits, accuracy and kinetics of PDMS-SPME for measurement of water concentrations ..............................................5
Evaluation of kinetics of uptake of PDMS-SPME for water and porewater concentrations ........................................................................................8
Laboratory demonstration of the relationship between measured porewater concentrations and bioaccumulation in selected benthic organisms ....10
Laboratory demonstration of cap performance assessment using measured porewater concentration profiles...........................................................................12
Field measurement of porewater concentration profiles in sediments ..........13
Field measurement of relationship between bioaccumulation in benthic organisms and measured porewater concentrations .....................................................15

vi
2.3. Advantages and Limitations of the Technology ...........................................17
3. PERFORMANCE OBJECTIVES 19
4. DEMONSTRATION DESIGN AND RESULTS 22
4.1. Laboratory Demonstration of Detection Limits, Accuracy and Reproducibility of PDMS-SPME for Measurement of Water Concentrations ...........................23
Summary of Results ......................................................................................23
Introduction ...................................................................................................25
Project Description........................................................................................25
Procedures .....................................................................................................26
Analysis and Results .....................................................................................27
High Concentration Range ............................................................................31
Fiber-water Partition Coefficient- Correlation with Kow ..............................35
4.2. Evaluation of kinetics of uptake of PDMS-SPME for water and porewater concentrations ...............................................................................................37
4.3. Laboratory demonstration of the relationship between measured porewater concentrations and bioaccumulation in various benthic organisms ..............40
Preliminary experiments ............................................................................40
Introduction ...................................................................................................41
Materials and Methods ..................................................................................42
Prediction of bioaccumulation from porewater concentration......................46
Results and Discussion .................................................................................47
Conclusions ...................................................................................................52
Comprehensive Bioaccumulation Experiments .......................................53
Sediments ......................................................................................................53
Experimental Organisms ...............................................................................54
Sediment Bioaccumulation Exposures .........................................................55
Porewater Concentration Measurements ......................................................55
PCB Bioavailability Experiment 1................................................................56
Methods.........................................................................................................56
Results ...........................................................................................................57
PCB Bioavailability Experiment 2................................................................69

vii
Methods.........................................................................................................69
Results ...........................................................................................................70
PAH Bioavailability Experiment 1 ...............................................................77
Methods.........................................................................................................77
Exposure Design ...........................................................................................77
Results ...........................................................................................................78
PAH Bioavailability Experiment 2 ...............................................................84
Methods.........................................................................................................84
Results ...........................................................................................................85
Summary of Bioaccumulation Experiments .................................................90
4.4. Laboratory demonstration of cap performance assessment using measured porewater concentration profiles....................................................................................90
Summary .......................................................................................................90
Introduction ...................................................................................................91
Materials and Methods ..................................................................................92
Experimental Results and Discussion ...........................................................94
4.5. Field measurement of porewater concentration profiles in sediments ........101
Summary .....................................................................................................101
Introduction .................................................................................................102
Passive Sampling Background ....................................................................102
Materials and Methods ................................................................................103
Conclusions .................................................................................................111
4.6. Field measurement of relationship between bioaccumulation in benthic organisms and measured porewater concentrations ............................................................111
Anacostia River, Washington, DC ..............................................................111
Hunter’s Point, San Francisco, CA .............................................................113
ER-1550 Field Locations (San Diego and Pennsacola Naval Bases) .........115

viii
5. PERFORMANCE ASSESSMENT 119
6. COST ASSESSMENT 123
6.1. COST MODEL ...........................................................................................123
6.2. COST DRIVERS and ANALYSIS .............................................................124
7. IMPLEMENTATION ISSUES 125
8. REFERENCES 126

1
1. INTRODUCTION
1.1. Background Soils and sediments acting as natural sorbents are the ultimate sink for many hydrophobic organic contaminants (HOCs). The equilibrium distribution of HOCs between sediments, water and benthos has often been considered to be a linear and reversible partitioning process, which suggests that all of the sorbed contaminants is available to partitioning to porewater and biological receptors in the environment. This is the basis for the EPA Equilibrium Partitioning Sediment Benchmarks (ESBs) described in Hansen et al., 20031.
Common adsorption/desorption behavior such as nonlinear isotherms, desorption hysteresis and aging has been linked to reductions in the rate and extent of availability to organisms and are not described by the conventional 100% labile contaminant linear partitioning model. The sequestration of contaminants into organic matter in sediments and soils has been ascribed to the effects of different soil or sediment organic matrices changing the rate or extent of contaminant sorption. The net effect, however, is a reduction in the rate or extent to which a contaminant may desorb into the adjacent porewater and accumulate in biota.
Because of the difficulty in predicting the actual partitioning between sediments and water, an alternative approach is to directly measure the porewater concentration. Studies by Lu et al. (20032, 20043, and 20064) provided strong evidence that steady state bioaccumulation of a wide range of PAHs in benthic organisms is related to porewater concentration. Route of uptake and organism assimilation efficiency appears to influence only the dynamics of uptake and not the steady state accumulation (Lu et al., 20043). Evidence that porewater concentration is a reliable predictor of benthic bioaccumulation of hydrophobic organic compounds has also been provided by Kraaij et al. (2003)5 and Vinturella et al. (2004)6. In addition, Zimmerman et al. (2004)7 has shown reductions in bioaccumulation in clams due to the addition of activated carbon to sediments in approximate proportion to the reduction in porewater concentrations.
Despite these results, porewater concentrations are not routinely employed for the evaluation or assessment of bioavailability. Measurement of porewater concentrations by conventional methods are fraught with difficulties including an inability to detect low concentrations in small sample volumes, geochemical changes in sediments upon collection and processing, and the difficulty of separating colloidally bound and truly dissolved contaminants from porewaters (Carr and Nipper, 2003)8. These effects complicate the analysis of porewater concentrations even in carefully controlled laboratory studies such as those conducted by Lu et al. (20032 and 20043) and make practical routine determination of porewater concentrations exceedingly difficult. Hawthorne et al. (2005)9 demonstrated an approach for the measurement of porewater concentration requiring only a small water volume under controlled laboratory conditions as long as the colloidal particles and associated contaminants could be separated from the sample. This method employs polydimethylsiloxane (PDMS) to extract and concentrate the sample (ex-situ, i.e. after porewater separation) prior to analysis.
The goal of the project is to demonstrate that the porewater concentration can be measured with high resolution and accuracy without a priori separation of the porewater from sediments. The particular approach taken herein is to employ PDMS-coated glass fibers to measure porewater

2
concentration and profiles in sediments via an in situ (i.e. in whole sediments) solid phase microextraction (SPME) technique. The use of SPME has also been employed in laboratory evaluations of porewater concentrations in whole sediments, including by Meyer et al. (2000)10, Conder et al. (2003)11, and Hawthorne et al. (2005)9. The focus herein is primarily to evaluate the applicability of the approach to in-sediment (i.e. in-situ) conditions, particularly in the field. The testing evaluated the ability of SPME using a PDMS sorbent phase to provide direct measurements of mobile phase concentrations (i.e. porewater concentrations) and indicate the bioavailability of the contaminants as measured by bioaccumulation in various organisms. In so doing, the work seeks to strengthen the confidence and range of conditions under which porewater concentration of HOCs can be used as an indicator of the bioavailable fraction of contaminants as well as provide a tool capable of routine measurement of porewater concentrations.
1.2. Objectives of the Demonstration The specific objectives of the project are listed below as well as the conclusions relative to that objective.
• Laboratory demonstration of detection limits and accuracy of PDMS-SPME for measurement of water and porewater concentrations
The demonstration led to generalization of existing polymer-water partition coefficients and showed that the technology could measure HOCs with accuracy and reproducibility equivalent to conventional techniques but with much lower detection limits for strongly hydrophobic organic contaminants.
• Laboratory demonstration of kinetics of uptake of PDMS-SPME for water and porewater concentrations
The demonstration led to the development of models capable of describing PDMS-SPME uptake kinetics and to the development of practical methods to evaluate uptake kinetics in field situations including the simultaneous use of fibers of different sizes to infer kinetics as well as the use of performance reference compounds.
• Laboratory demonstration of the relationship between measured porewater concentrations and bioaccumulation in selected benthic organisms
The demonstration showed that the potential for bioaccumulation was proportional to measured porewater concentration for a variety of organisms and sediments. The bioconcentration factor between porewater concentration and organism bioaccumulation was approximately given by the octanol-water partition coefficient, Kow, of the bioaccumulating compound.
• Laboratory demonstration of cap performance assessment using measured porewater concentration profiles
The demonstration showed that porewater concentrations in the biologically active zone of a sediment cap also indicated bioaccumulation in benthic organisms populating a cap. The dilution of bulk sediment concentration by inert nonsorbing sand was not effective at decreasing

3
bioaccumulation in exposed organisms. The separation of benthic organisms from contaminated sediments by an inert nonsorbing sand layer, however, was effective as long as the depth of active bioturbation was less than the thickness of the sand layer.
• Field measurement of porewater concentration profiles in sediments
The demonstration showed that vertical profiles in hydrophobic organic contaminants could be measured in-situ assisting in the evaluation of the mechanisms and rates of transport. In general, multiple time series measurements are required to define contaminant dynamics.
• Field measurement of relationship between bioaccumulation in benthic organisms and measured porewater concentrations
Field measurements of bioaccumulation in various benthic organisms and sediments were shown to correlate with measured porewater concentrations in the near surface sediments. Field measurements were complicated by the dynamics of uptake onto the sorbents, the dynamics of uptake in the organisms and the presence of other stressors in the field. Measured bioaccumulation was generally 20-50% of that predicted by ow pwK C .
1.3. Regulatory Drivers Screening levels and cleanup standards at contaminated sediment sites are generally based upon bulk solid concentrations either on the basis of statistical inferences of effects (e.g. Long et al. 1995)12 or from water toxicity and the assumption of linear, reversible partitioning (Hansen et al., 2003)1. The assumption of linear, reversible partitioning does not account for the reduced availability of contaminants sorbed to desorption-resistant phases and will generally lead to overly conservative estimates of levels of concern or cleanup levels. Statistical inferences of effects are based upon data from a number of sites but do not take into account site specific characteristics and may be either overly conservative or not conservative based upon contaminant availability at the site. Appropriate and cost-effective prioritization of sites and remedial planning is dependent upon the definition of appropriate cleanup levels that are neither overly conservative or lack any conservatism.
Site specific bioassays could be used to help assess appropriate levels for a particular site but chemical measures can generally be implemented with greater density and sensitivity. It is toward providing such a tool the technology demonstrated herein is directed. The goal is demonstration of a tool that can provide an assessment of the bioavailable contaminants at a particular site and thus provide a tool that can help set cleanup levels that are neither overly conservative nor lead to unacceptable exposure and risks at a site.

4
2. TECHNOLOGY
2.1. Technology Description Solid-phase microextraction for hydrophobic organic contaminants involves the insertion of a polymer sorbent into the sediments, withdrawal after a period of time, preferably after achieving equilibrium, and measuring the contaminants sorbed to the polymer. The achievement of equilibrium allows the estimation of porewater concentration with the ratio of the concentration in the sorbent, here as the concentration in a polymer- coated fiber, fC , and a polymer sorbent-water partition coefficient, fwK
fw
fw
CC
K= (1)
Non-equilibrium exposures must be corrected for the kinetics of uptake. In solid-phase microextraction, the amount sorbed to the polymer does not significantly modify equilibrium in the soil-water system due to the small mass absorbed. Despite this there is some depletion in the immediately vicinity of the polymer during a transient uptake period and the rate of equilibration of the polymer sorbent is generally associated with transport processes in the sediment and not within the polymer. Polymer sorbents that are used typically include polyoxymethylene (POM), polyethylene (PE) and polydimethylsiloxane (PDMS). POM and PE are normally used in thin (25-100µm) bulk layers while PDMS is coated in a thin layer (10-30µm) on glass fibers. The term solid phase microextraction (SPME) has been most often applied to the use of PDMS but POM and PE are essentially equivalent extraction processes. PDMS is used herein in that it is available as a thin coating (10-30 µm) on a variety glass capillaries of various sizes (110-1000 µm). The capillary can be of arbitrary length and can be coiled in long, continuous lengths. The cylindrical shape is convenient for insertion into sediments and the availability of thin layers with modest sorption capacity (compared to the slightly more sorbing POM and PE) speeds equilibration kinetics. The length can be segmented to achieve the desired vertical resolution or to provide sufficient sorbent volume to meet detection limit requirements. Costs of fabricating the PDMS coated glass fibers ranges from approximately $1/m (for commercial available optical fibers) to $10-25/m (for specially fabricated coated fibers). Only 1-5 cm of this fiber is necessary for detection of HOCs at sub-ng/L concentrations and therefore the cost of the PDMS is negligible compared to the chemical analysis. In addition, the analysis method demonstrated herein generally requires no special extraction or sample processing procedures and the analysis cost is equal to or less than conventional water sample analysis costs.
For laboratory applications, the fiber can be placed directly into sediments. For smaller fiber sizes (< 500 µm) they are easier to locate if inserted through a septum and then placed in the sediments. For field applications, the fiber should be placed in a holder to protect from breakage. In coarse sediments (gravel, rocky or filled with debris) the holder should be shielding by an external sheath. The holder used includes a 1-2 mm slot in a stainless steel rod. The PDMS fiber is fixed at each end within this slot using contaminant-free silicon (e.g. aquarium silicon). The holder can then be covered with a protective sheath (cylindrical tubing) with holes to allow

5
water exchange (Figure 2-1a) or left unshielded for short lengths (up to 30 cm) in soft sediments (Figure 2-1b).
Figure 2-1 Shielded and unshielded holders for SPME fiber (a, left- holder with shielding, a modified Henry’s type sampler and b, right- unshielded holder)
2.2. Technology Development This section summarizes the technology development undertaken as part of this project and the key advances made. Each of these topics are detailed in Section 4.
Laboratory demonstration of detection limits, accuracy and kinetics of PDMS-SPME for measurement of water concentrations Laboratory studies have achieved their desired goal of defining the basic parameters of routine field deployment of solid phase microextraction (SPME) as a tool for the assessment of water concentration to indicate in-situ contaminant migration processes and bioavailability of PAH and PCB contaminants. In the current study, PDMS coated fibers from two different sources and three different sizes were employed. Table 2-1 summarizes the fibers used in these studies.
Chemical analysis involved exposure of the fiber to a contaminant in water or sediments and then extraction into a solvent which is subsequently analyzed by chromatography. Studies of various extraction methods demonstrated that desorption into solvents suitable for subsequent chemical analysis (into acetonitrile for HPLC analysis or hexane for GC analysis) is rapid and
Large shielded sampler- 36” Small unshielded sampler- 14”
10 µm PDMS210 µm core

6
complete. In this work, PAHs were analyzed by Waters 2795 HPLC with fluorescent detection (EPA Method 8310) and PCBs were analyzed by Hewlett Packard 6890 GC with electron capture detection (Method 8082). Table 2-1 PDMS Coated fibers used in this demonstration dimensions and source. Polymicro Industries (Phoenix, AZ) and Fiberguide (Sterling, NJ)
Fiber Designation
Inside dia.
µm
Outside dia.
µm
PDMS Volume (V)
µL/m
PDMS
L=V/Area(A)
µm
Source
170/110 110 170 24.7 13.2 Polymicro
230/210 210 230 9.6 6.9 Fiberguide
1060/1000 1000 1060 29.2 97.1 Polymicro
The fiber-water partition coefficients, Kfw, of the various fibers were measured. No differences in fiber-water partition coefficient were noted among the three fibers used in this study despite their fabrication at different times from different manufacturers. The fiber-water partition coefficient should correlate with the hydrophobicity of the compound and thus can be correlated with Kow. It is important to employ a consistent source of Kow values when developing and using such a correlation. In the present study, fiber-water partition coefficients of PCBs and PAHs as measured by Mayer et al. (2000)13 were employed to correlate with a consistent set of Kow values, Mackay et al. (1992) 14for PAHs and Hawker and Connell (1988)15 for PCBs. Mayer et al. (2000)10 employed Kow values based only on PCB chlorine number and thus the correlation as given was inconsistent with the Hawker and Connell Kow values. Since only two PAHs, phenanthrene and fluoranthene, were measured by Mayer et al. (2000)13,10, we measured PDMS-water partition coefficients of seven medium to high molecular weight PAHs to supplement Mayer’s data. The resulting correlation and confidence intervals for PAHs only is given by
20.839( 0.048) 0.117( 0.21) 0.97fw owLogK LogK R PAHs= ± + ± = (2)
The resulting correlation and confidence intervals for high molecular weight PAHs and PCBs is given by
21.06( 0.058) 1.16( 0.35) 0.94fw owLogK LogK R HPAHs PCBs= ± − ± = − (3)
Equation (2) gives similar values to Equation (3) for the Kow range of mid to high molecular weight PAHs but is more consistent with observations for low Kow PAHs. Note that other factors such as temperature and salinity may influence fiber-water partition coefficients but measurements showed no significant trend with either suggesting that the effects of these factors are within the accuracy of the correlations (approximately +/- 0.2-0.3 log units).
Polyoxymethylene (POM) and polyethylene (PE) sorbents behave similarly to PDMS but are slightly more sorbing. As reported in Gschwend et al. (2011)16, the polymer water partition coefficient for PE is given by log KPE-water (Lwater/kgPE) = 1.00(±0.05)*log Kow – 0.287(±0.335)

7
(r2= 0.96) and log KPOM-water = 0.791*log Kow + 1.018 (r2 = 0.947) for POM. The estimated partition coefficients are typically 2-5 times larger for POM and PE than PDMS. This gives rise to lower detection limits for a given volume of sorbent but longer uptake kinetics as is discussed in the next section.
The hydrophobicity of a compound largely defines detection limits, with the more hydrophobic, high molecular weight compounds being detected more sensitively. Low molecular weight PAHs are also difficult to measure due to volatility from both solutions and from PDMS fibers. A combination of these factors leads to relatively high uncertainty in the measurement of naphthalene. High molecular weight compound standards are also difficult to prepare and maintain, leading to relatively high uncertainty in measurements of these compounds. In both cases, the correlation of fiber-water partition coefficient with octanol-water partition coefficient is expected to more accurately indicate partitioning to the PDMS than the measurements.
Detection limits are summarized in Table 2-2 for PDMS coated fibers for selected PAHs using EPA Method 8310 and fluorescent detection on a Waters 2795 HPLC. The detection limits are based upon 1 cm of a fiber coated with 6.9 µL/m (10 µm layer of PDMS on 210 µm glass core). The fiber sorption and the detection limits are proportional to PDMS volume. Thus the detection limit using 10 cm of fiber is 10 times lower and the detection limit using 1 cm of the 30 µm thick PDMS layer on a 1 mm core fiber is 14 times lower than the listed value. In addition, Table 2-2 shows the coefficient of variation at a specific low concentration and the correlation coefficient indicating linearity of the fiber response to concentration as well as a comparison of the fiber detection limit to that by direct injection. The concentration level selected for the coefficient of variation measurements was chosen to be a concentration well below surface water quality criteria (National Recommended Water Quality Criteria) that is often used a comparison for surface water and porewater concentration measurements. The coefficient of variation provides an indication of the accuracy of the concentration measurements.

8
Table 2-2 Comparison of detection limits by direct water injection vs solid phase microextraction (SPME) with PDMS and coefficient of variation and correlation coefficient for SPME. Analysis by HPLC with EPA 8310 with fluorescent detection.
a) surface water quality criteria (NRWQC) are given for comparison to detection limits
b) PDMS volume for SPME is 0.069 µL (1 cm length of 230/210 fiber)
Evaluation of kinetics of uptake of PDMS-SPME for water and porewater concentrations The accurate measurement of water and porewater concentration depends upon the ability to achieve equilibrium uptake in the PDMS fiber. Equilibrium is relatively rapid in stirred water (hours to days) and can be easily established by measurement of a time sequence. In laboratory experiments under static conditions, the kinetics of uptake are largely a function of diffusion in the sediment media and models may be used to predict uptake. Consistent with the predictions of Lu et al.17 the deviations from equilibrium predicted by a diffusion model in the sediment are expected to be subject to an uncertainty of approximately a factor of ±50% when the fractional approach to equilibrium is of the order of 0.50, a factor of 2 when the fractional approach to equilibrium is of the order of 0.25 and a factor of 4 when the fraction approach to equilibrium is of the order of 0.05. Measurements of uptake kinetics, particularly in the laboratory, can also be accomplished directly by examining a time series of measurements in homogenized sediments.
log K ow
Surface Water Quality Criteria
µg/La
Water MDL µg/L
Direct Injection
SPME MDL µg/Lb
Low Conc µg/L
COV % Lowest Conc.
Linearity SPME
r2
Naphthalene 3.37 9.58 0.07 0.3332 2.35 88.8% 0.1547DBF 4.30 0.14 0.0123 1.64 10.0% 0.985
2-MNP 3.90 0.19 0.0268 3.73 70.2% 0.9817Fluorene 4.18 3460 0.81 0.0697 0.503 5.6% 0.9984
Acenaphthene 3.92 640 0.32 0.0315 0.526 14.1% 0.9996Phenanthrene 4.57 0.23 0.0076 0.362 1.3% 0.9973
Anthracene 4.54 26400 0.222 0.0075 0.018 18.1% 0.998Fluoranthene 5.22 90 0.210 0.0025 0.101 9.9% 0.9985
Pyrene 5.18 2590 0.209 0.0021 0.055 8.1% 0.9987Chrysene 5.86 0.018 0.0698 0.00048 0.0012 19.1% 0.9967
Benz[a]anthracene 5.91 0.018 0.0266 0.00011 0.0048 3.9% 0.9978Benzo[b]fluoranthene 5.80 0.018 0.03650 0.00011 0.00089 11.6% 0.9945Benzo[k]fluoranthene 6.00 0.018 0.00650 0.00002 0.00039 8.0% 0.9781
Benzo[a]pyrene 6.04 0.018 0.01830 0.00005 0.0021 5.8% 0.9755Dibenz[a,h]anthracene 6.75 0.018 0.02630 0.00007 0.009 5.5% 0.9241Benzo[ghi]perylene +
Indenopyrene 6.50 0.018 0.04540 0.00010 0.0234 7.0% 0.9179

9
Under field conditions, time to achieve equilibrium uptake may be more difficult to establish due to uncertain transport processes other than diffusion and heterogeneity. A practical means of estimating the kinetics or estimating equilibrium uptake by extrapolating from limited data is required for field evaluation. Huckins et al. (2002) 18 described the use of impregnated performance reference compounds (PRC) during field deployments to estimate the extent of equilibrium attained within the device. Alternative approaches were also developed and demonstrated herein that could be used to complement performance reference compounds using sorbent fiber of two different sizes (which exhibit different uptake kinetics) or sorbent fibers of the same size collected at two different times. These measurements can be fit to a model of sorbent uptake and used to estimate deviation from equilibrium. Assuming external mass transfer resistances control uptake in a thin film (locally two dimensional) surrounding by static sediment (diffusion controlled transport), the mass uptake into a sorbent fiber is given by
2 2( ) 1 exp erfc for uptakeof contaminantsfw pwfw fw
RDt RDtM t K C LL K LK
= −
(4)
Where L is the surface volume to area ratio of the fiber (the thickness if a rectangular film), erfc is the complementary error function, and the other parameters are as defined previously. RD is an effective transport parameter that can be fit to observations of PRC release or uptake at different times or with two different size fibers. Details are described in Section 4.
The kinetics of uptake of different compounds (pyrene and benzo[a]pyrene) on different size PDMS fibers (230/210 and 1060/1000) are illustrated by example in Figure 2-2. In this example, a 14 day exposure of the sorbent fiber in a stagnant (diffusion controlled) system led to uptake of approximately 41% and 74% of steady state for benzo[a]pyrene in the 1060/1000 and 230/210 fiber, respectively. The predictions of deviation from steady state are relatively insensitive to error in the estimated value of RD. If the ratio of RD to owK is in error by a factor of 2 there is a 22% error in the predicted fractional approach to steady state for benzo[a]pyrene (32 vs 41%) and even less for less hydrophobic compounds. The sensitivity to estimation error can be substantially greater far from steady state and therefore it is desirable to design sediment exposures to achieve as close to steady state as possible. The PDMS update rates are also compared to POM (76µm thick- half thickness 38 µm) and PE (25 µm thick, half thickness of 12.7 µm) in Figure 2-2. The latter two materials tend to be slower due to their greater sorption capacity although that can be offset by the use of thin sorbent layers.

10
Active mixing of porewaters by tidal mixing, groundwater upwelling, bioturbation or hyporheic exchange will speed transport and can be incorporated into Equation (4) by considering an effective diffusion coefficient. In general, however, this is difficult to estimate a priori in field sediments and the use of performance reference compounds (e.g. deuterated compounds), time series measurements, or two different size sorbent fibers is recommended to fit uptake kinetics model to observations as outlined above.
Laboratory demonstration of the relationship between measured porewater concentrations and bioaccumulation in selected benthic organisms A series of laboratory experiments were conducted focused on comparison of fiber concentrations to measured bioaccumulation in freshwater and marine deposit feeding organisms. Bare fibers were exposed to PAH and/or PCB contaminated sediment during a 21 or 28 day bioaccumulation test using the selected organisms. The common deposit feeding organisms used in these studies are ideal indicators of steady state bioaccumulation due to the intensity of their interactions with sediment and lack of significant metabolism of the contaminants of interest.
• In Anacostia River (DC) sediments, the bioaccumulation in a freshwater oligochaete, Ilyodrilus templetoni, was well-predicted by the product of porewater concentration and compound octanol-water partition coefficient (slope=1.08, r2=0.76) as reported in Lu et al. (2011)17. No corrections were required for steady state uptake in the 28 day tests based upon static experiments in the same sediment. A similar relationship between
0.00
0.10
0.20
0.30
0.40
0.50
0.60
0.70
0.80
0.90
0 5 10 15
Frac
tion
of S
tead
y St
ate
Time, days
Pyrene 230/210
BaP 230/210
BaP 1060/1000
BaP PE 12.7
BaP POM 38
Figure 2-2 Approach to steady state of various polymer sorbents and contaminants (PDMS outer and inner thickness in µm, PE, POM half thickness in µm)

11
bioaccumulation and porewater concentrations in Anacostia river sediment was also observed in a previous study, in which the porewater concentrations were measured by conventional liquid-liquid extraction (Lu et al., 2003)2. The bioaccumulation in the Ilyodrilus can also be characterized with a bioconcentration factor of 1.08 defined by the ratio of the lipid normalized tissue concentration to the porewater concentration.
• In a sediment from New Bedford Harbor (New Bedford, MA) diluted with a fresh-water sediment from Brown Lake (Vicksburg, MS), the bioaccumulation of PAHs and PCBs in the freshwater oligochaete, Ilyodrilus templetoni, was also well-predicted by the product of porewater concentration and compound octanol-water partition coefficient (slope=1.24, r2=0.76) as reported in Lu et al. (2011)17. Corrections for unsteady bioaccumulation were made via a model (Lampert, 2010)27 and the fractional approach to equilibrium ranged from 0.43-0.97 for PAHs (benzo[a]pyrene to phenanthrene, respectively) and 0.04-0.60 for PCBs (PCB 180-28, respectively). The use of the sequentially diluted sediment allowed evaluation of a much larger range of sediment and porewater concentration than could be evaluated using the fresh sediment. In addition, the dilution with freshwater sediment allowed use of the freshwater oligochaete in the bioaccumulation testing. The large estimated corrections for steady state in the more hydrophobic compounds subjected their porewater concentration and bioconcentration factor estimates to greater uncertainty.
• In sediment from Hunter’s Point, CA, the bioaccumulation of PCBs in the marine polychaete, Neanthes arenaceodentata, was also well-predicted by the product of pore-water concentration and compound’s octanol-water partition coefficient (slope=1.17-2.21, r2=0.7-0.76) as reported in Gschwend et al. (2011)16. The range of slopes reflects uncertainty in estimation of the correction for non-equilibrium accumulation in the fiber. The estimated fractional approach to steady state was 0.73-0.83 for PCB 31, the least hydrophobic PCB measured, and 0.08-0.16 for PCB 180, the most hydrophobic.
All of these preliminary studies exhibited lipid normalized bioaccumulation proportional to the product of the porewater concentration and octanol-water partition coefficient with a slope of approximately unity. This suggests that the lipid normalized bioaccumulation in organisms ( /b lC f ) at steady state appears to be well represented by the relationship
~bow
l pw
C Kf C
(5)
or that the effective bioaccumulation factor (BCF) is approximately the octanol-water partition coefficient. The ratio represented by Equation (5) was tested in 8 additional laboratory bioaccumulation tests with two different sediments (New Bedford Harbor and Elizabeth River) and four different freshwater and marine organisms. The measured lipid- normalized bioaccumulation of each PCB congener and PAH was divided by the product of the octanol-

12
water partition coefficient and the measured porewater concentration as suggested by Equation 5. The results are depicted in Table 2-3.
Table 2-3 - Measured normalized bioaccumulation in laboratory studies of various organisms
Site/# Organism b
l ow pw
Cf K C
Standard Deviation N
New Bedford Harbor #1 Leptocheirus plumulosus 1.257 0.868 247
Neanthes arenaceodentata 0.841 1.08 213
Lumbriculus variegatus 1.66 0.81 322
New Bedford Harbor #2 Leptocheirus plumulosus 1.45 0.82 318
Macoma nasuta 1.18 0.45 144
Elizabeth River #1 Leptocheirus plumulosus 1.2 0.7 10
Neanthes arenaceodentata 0.9 0.79 11
Elizabeth River #2 Leptocheirus plumulosus 0.617 0.503 18
Averages 1.32 0.82 1283
This data shows that bioaccumulation is well estimated by an effective bioconcentration factor (BCF) of approximately 1. While the best estimate is 1.32, it is not significantly different from unity.
Bioaccumulation cannot normally be estimated by bulk solid concentration as a result of variations in chemical availability. Porewater concentrations as measured by PDMS SPME, however, have shown a high ability to predict bioaccumulation in a variety of organisms and sediments under steady conditions. Porewater concentrations appear to be a direct indicator of availability and provide a measure of the labile contaminant that is equilibrating between sediment, organism and porewater. Because the organisms typical accumulate contaminants as a result of ingestion rather than directly from the porewater, the validity of the porewater approach depends upon the equilibration of all three phases. While this is a reasonable assumption in the relatively static sediments, there may be conditions in which it is not applicable.
Laboratory demonstration of cap performance assessment using measured porewater concentration profiles The final laboratory experiments were designed to demonstrate the effectiveness of PDMS fibers for the measurement of contaminant concentration profiles in sediments and to use the profile measurements to demonstrate the ability to monitor effectiveness of a sediment cap. Specifically, the effectiveness of thin-layer sand capping was explored through experiments with laboratory-scale microcosms populated with the deposit-feeding oligochaete, Ilyodilus templetoni. Passive sampling of porewater concentrations in the microcosms using polydimethylsiloxane (PDMS)-coated fibers enabled quantification of high resolution vertical concentration profiles that were

13
used to infer contaminant migration rates and mechanisms. A series of laboratory microcosms of PAH-contaminated sediments with sand caps of varying thicknesses were set up and analyzed. Details of the experimental procedures and results can be found in Lampert et al. (2011)19
The PDMS fibers successfully measured porewater migration through the cap as a result of organism activity and molecular diffusion. Pyrene concentration profiles illustrate the observed behavior and are shown in Figure 2-3. Also shown is the correlation between lipid normalized organism bioaccumulation versus that predicted by porewater concentrations.
Figure 2-3 Observed pyrene concentration profiles as a function of cap thickness illustrating rapid mixing of contaminants in a thin layer cap when depth of organism interaction is greater than cap thickness. Also shown is the correlation between lipid normalized bioaccumulation and bioaccumulation predicted by
ow pwK C where pwC is measured by PDMS fibers averaged over 0-5 cm
Predictions of bioaccumulation based on contaminant porewater concentrations within the surface layer of the cap correlated well with observed bioaccumulation in the benthic organism (correlation coefficient of 0.92). The results of this study show that thin-layer sand caps of contaminated sediments can be effective at reducing the bioaccumulation of polycyclic aromatic hydrocarbons (PAHs) in benthic organisms as long as the thickness of the cap layer exceeds the depth of organism interaction with the sediments and transport in the underlying sediment is dominated by diffusion. Advective conditions were not tested but may result in contaminant migration into the biologically active zone without organism interactions.
Field measurement of porewater concentration profiles in sediments The field deployable SPME system was developed with a protective sheath over a slotted rod containing the fiber as previously shown in Figure 2-1. To demonstrate the applicability of the system to the field, the tools were deployed in the Anacostia River, Washington. An active capping project was conducted in the river to demonstrate the ability to place cap amendments in sediments for purposes of remediation. The demonstration was implemented by a team led by Danny Reible and the Hazardous Substance Research Center/South and Southwest with the support and assistance of a number of other organizations. Amendments placed included Aquablok (a permeability control agent), coke in a reactive core mat (to demonstrate the ability to place high value sorbents in a thin layer in sediments), apatite (as a phosphate based metals control agent) and sand (as a control). Details of the caps placement and analysis of
-4
-2
0
2
4
6
8
10
12
140 0.2 0.4 0.6 0.8 1 1.2
Dimensionless Pyrene Pore Water Concentration
Dep
th fr
om C
ap-W
ater
Inte
rfac
e (c
m)
.
control2.5-cm cap4.5-cm cap6.5-cm cap10.5-cm cap
clean overlying water
underlying contaminated sediment
increasing cap thickness reducespore water concentrations
10
100
1000
10000
100000
1000000
10 100 1000 10000 100000 1000000
q lipid (ng/g)q p
redi
cted
= C
w *
Kow
(ng
/g) PHE
PYR
CHR
BAA
BBF
BKF
BAP
1:1
correlation = 0.92
1:1 line

14
aspects of cap behavior can be found in Reible et al. (2006)20, McDonough et al. (2007)21 and Barth et al. (2008)22. The sand cap was nominally1 ft (30 cm thick). The coke in the reactive core mat was approximately 1 cm thick and was overlain by 6 inches (15 cm) of sand. The AquaBlok® layer was approximately 4-6 inches thick (10-15 cm) and overlain by approximately 6 inches (15 cm) of sand. These nominal thicknesses could be as much as 10 cm thicker in some locations and intermixing with the underlying sediment may have contributed to an even greater apparent thickness.
Because sources were not controlled in the vicinity of the demonstration the surficial sediments ultimately trended toward contamination concentrations similar to pre demonstration levels. Thus the bulk sediment profile observed post demonstration cap placement was a layer of contaminated sediment at the surface, a relatively clean capping layer and then contaminated underlying sediment. An analysis of diffusive migration from the sediment through the cap layers suggests that contaminants in the underlying sediment should penetrate entirely through the relatively nonsorbing sand layer of 6-12 inches within 15-36 months. Tidally induced motion, particularly in the high permeability sand layer would be expected to speed that migration and lead to relatively uniform concentrations in the sand cap layer. The present of contamination at the surface would also be expected to lead to rapid contamination and relatively uniform concentration profiles with depth.
The use of non- sorbing cap materials (e.g. sand which was used in the surface layer of all caps), however, limited the ability of bulk solid measures to indicate contaminant migration through the cap (Reible et al., 2006)20. Unlike the bulk solid measures, the porewater profiles show extensive mixing throughout the cap and “diffusion-like” profiles consistent with the tidal driven mixing in the sediments and caps. The detection of the contaminants throughout the cap layer demonstrates that the porewater profiling system is a more sensitive indicator of contaminant migration into a sediment cap than a bulk solid measurement. The porewater concentrations in the cap layers are substantially lower than the porewater concentration in the sediment suggesting that the caps are more protective than the exposed sediment. The relatively low concentrations despite significant mixing throughout the cap may be the result of mixing related dilution or limited migration of contaminants from below.
A second deployment of PDMS fibers in the Anacostia River was conducted in October of 2008. This test was intended to evaluate bioaccumulation in organisms but organism recovery was poor. The samples collected were, however, useful to evaluate the ability of a commercial laboratory to analyze the PDMS samples as well as a check of inter-lab variability. Randomly selected samples were processed by placing PDMS fibers into solvent and then analyzed both at the University of Texas and at TestAmerica, Pittsburgh, PA. Phenanthrene, Pyrene and Benzo[a]pyrene were selected representing low, medium and high molecular weight PAHs. The range of hydrophobicities in these three compounds allows evaluation of mobility of the entire range of PAHs (assuming that contaminant mobility is dominated by hydrophobicity and sorption related retardation). As shown in Figure 2-4, the inter-laboratory comparison suggests that the samples could be analyzed by a commercial laboratory with similar analytical results. There was a consistent variation between UT and TestAmerica measurement of pyrene (although within a factor of two) suggesting a difference in calibration between the two laboratories. The variability in benzo[a]pyrene was also substantial between the two laboratories, particularly at

15
low concentrations, although the average deviation was less than 10%. The conclusions of this test was that a commercial laboratory could provide chemical analysis for the processed PDMS samples and achieve concentration and detection limits similar to that achieved in the research laboratory.
Figure 2-4 Comparison of Test America and UT PDMS samples. All porewater concentrations in ng/L
The methodology presented here for evaluation of porewater profiles as a function of depth for the evaluation of cap performance has also been applied to the following sites as part of separate programs
• McCormick and Baxter, Portland OR (in cooperation with Oregon DEQ) • Pacific Sound Resources, Seattle, WA (in cooperation with USACE) • Chattanooga Creek, TN (in cooperation with EPA)
These studies have served to provide wider use and dissemination of the technology and will lead to greater acceptance and use of the technology.
Field measurement of relationship between bioaccumulation in benthic organisms and measured porewater concentrations The final focus of the demonstration program was demonstration of the relationship between bioaccumulation in benthic organisms and PDMS measured porewater concentrations under field conditions. This is inherently more difficult than in the laboratory due to variability in organisms and their behavior as well as an inability to control environmental conditions. These studies were undertaken at four locations as part of the core program and in extensions of the core program in support of activities under SERDP project ER- 1550. These are discussed in more detail in section 4. Here the results from the Anacostia and Hunter’s Point are summarized to indicate the relationship between porewater concentration and the basic behavior of bioaccumulation under field conditions.
Field bioaccumulation experiments using the deposit feeding tubificid oligochaete, Lumbriculus variegates, were conducted in the area of the Anacostia active capping demonstration in June 2007, 38 months after cap placement, using the procedures outlined by Burton et al. (2005)23.
y = 1.72xR² = 0.90
0
50
100
150
200
0 100 200Te
st A
mer
ica
UT Value
Pyrene
y = 1.045xR² = 0.656
050
100150200250
0 50 100 150 200 250
Test
Am
eric
a
UT Value
Phenanthrene
y = 1.09xR² = 0.30
0.0
0.5
1.0
1.5
2.0
0.0 1.0 2.0
Test
Am
eric
a
UT Value
Benzo[a]Pyrene

16
As indicated previously, organism deployments were planned at other times but organism recovery was poor. Organism recovery in the AquaBlok® capped area was also low during this deployment and so bioaccumulation results are based on organism bioaccumulation in the uncapped sediment control area, a sand cap, and a coke breeze/sand cap designed to effectively contain hydrophobic organics. The worm tissues were analyzed for PAH concentrations and lipid content after 28 days of exposure. PDMS porewater profilers were placed in the sediment adjacent to the cages to allow comparison of porewater concentrations to measured bioaccumulation. The profilers were deployed and retrieved by divers at the same time as the organism cages, that is, after 28 days.
Both bulk solid and measured porewater concentration (applying Equation (5)) were evaluated as a predictor of bioaccumulation. Bulk solid strongly overestimated (by an average factor of 15) bioaccumulation (assuming BSAF=1) and did not strongly correlate with measured bioaccumulation (r2=0.51). The porewater concentration, however, correlated well with bioaccumulation (r2=0.81) and provided a much better estimate of measured bioaccumulation. The average prediction for bioaccumulation using Equation (5) was approximately twice the observed bioaccumulation suggesting an observed water-lipid partition coefficient or water-lipid bioaccumulation factor (BCF) of 0.5Kow. The difference most likely represents experimental variability and, in particular, the potential for the field organisms to be stressed by environmental conditions and exhibit somewhat lower bioaccumulation than can be measured in the more controlled laboratory studies.
A similar difference between observed and porewater predicted bioaccumulation was noted in the second demonstration with PCBs at Hunter’s Point, San Francisco, CA. This bioaccumulation test was conducted with Neanthes arenaceodentata in cooperation with R.G. Luthy and E. Janssen of Stanford University. The organisms were placed in an intertidal zone in cages similar to those used in the Anacostia and exposed to Hunter’s Point sediment containing total PCBs of approximately 1 mg/kg (0.966 mg/kg). Both untreated cells and cells treated with activated carbon (3.4% activated carbon by dry weight) were deployed. The organisms were exposed for 14 days and then their lipid content and PCB body burden were measured by Stanford personnel using GC-ECD. Steady state uptake onto the PDMS was predicted from the 14 day measurements based upon a model assuming diffusion controlled transport in the pore space of the sediment.
The relationship between body burden (lipid normalized) and PDMS measured porewater concentration were evalutated for both untreated and activated carbon treated microcosms. The untreated microcosms showed bioaccumulation that correlated well with measured porewater concentration although the apparent BCF is about 0.21Kow, less than the approximately unity found in laboratory studies and less than the 0.5Kow found in the Anacostia studies. Bioaccumulation in the activated carbon treated microcosms also correlated well with the measured porewater concentration with an average BCF of about ~Kow. There was a lot of variability for a number of low concentration PCB congeners, however, because the activated carbon caused reductions in bioaccumulation and porewater concentrations to near detection limits.
The field studies indicated that porewater concentration could be related to bioaccumulation in benthic organisms just as had been indicated by laboratory experiments. The extent of

17
bioaccumulation under field conditions was often less than under laboratory conditions by a factor of 2-5, presumably as a result of environmental stresses or kinetic limitations that occur in the field but not in laboratory bioassays. Porewater concentrations were shown to indicate performance of capping and in-situ treatment of sediments. Solid phase concentrations, in comparison, are not capable of indicating the performance of these remedial approaches.
2.3. Advantages and Limitations of the Technology The work described above has shown that passive sampling via PDMS has an excellent ability to describe the mobile and available fraction of hydrophobic organic contaminants such as PAHs and PCBs. The universal regulatory standard, solid phase concentration, has limited ability to define the risks and bioaccumulation potential from contaminated sediments because it cannot differentiate between bioavailable and non-bioavailable contaminants. Normalization of bulk solid phase concentration with organic carbon can provide, in some instances, an improved ability to determine bioavailability and bioaccumulation potential for hydrophobic organic contaminants. Theoretically, normalization of bulk solid phase concentration with organic carbon content should indicate bioavailability as long as the sediment and adjacent porewaters are in equilibrium and if the partitioning between these phases is linear and reversible. Unfortunately, this is not always the case.
Passive sampling with PDMS to estimate porewater concentrations provides a more direct indication of the available fraction of contaminants. The truly dissolved porewater concentration that is measured by PDMS, appears to be directly related to bioaccumulation potential with a biota-water concentration factor given by approximately the octanol-water partition coefficient. This was demonstrated to be true for deposit feeders, even when the route of uptake is via sediment ingestion. In such cases, the porewater is not the source of contaminants to the organism but appears to be a good indicator because the sediment, organism and adjacent porewater are in a state of quasi-equilibrium. Measurement of the porewater concentration provides a direct indicator of what can partition to other phases (either water or organism) from the solid phase. Ingestion of the sediment by a benthic organism may speed their approach to this equilibrium but does not change what can ultimately accumulate in the organism.
POM and PE could also be used as passive samplers with similar advantages and with similar results. The intrinsic kinetics of PDMS is somewhat faster than either POM or PE as a result of a lower sorbent-water partition coefficient (and therefore less depletion of the porewater adjacent to the sampler). PDMS can also be fabricated in a wide range of sizes on cylindrical glass cores, providing a convenient geometry for insertion directly into sediment for in-situ measurement in the field or laboratory and allowing tailoring of detection limits (related to sorbent volume) and uptake kinetics (related to sorbent volume and surface area) to a particular situation. PDMS as well as POM and PE can also be used in the laboratory in tumbled sediments. In this scenario, the external mass transfer resistances are reduced and there are no significant advantages of PDMS over POM or PE.
Other means of porewater concentration measurement are generally unable to directly measure dissolved concentrations. Colloidal matter will typically be suspended in the porewaters and artificial increase the effective porewater concentration. Filtration and flocculation can reduce but not eliminate the effects of colloidal matter, the effect of which is more important for more

18
hydrophobic compounds. Centrifugation is a means of generating large amounts of porewater relatively rapidly, but holds the potential to artificially increase suspended HOC concentration by increasing the suspended colloidal and particulate matter.
The primary limitation of passive sampling with PDMS or other sorbent is the difficulty of achieving equilibrium or accurately estimating the approach to equilibrium. Good results are reported herein using both performance reference compounds or by using sorbents with two different characteristic dimensions (and therefore two different intrinsic kinetic behaviors). The ratio of the concentration between the two different size sorbents provides an indication of kinetics in any particular situation. It should be emphasized that the kinetics of uptake are controlled by the rate of equilibration of the surrounding media after local depletion of the porewater by the sorbent. In essentially all cases, the exterior mass transfer resistances control kinetics of uptake. Tidal or rapidly upwelling systems or systems with a large reservoir of contaminants (e.g. high organic carbon) will achieve equilibrium more rapidly than stagnant systems with a small contaminant reservoir. The fact that external processes control uptake means that passive sampling with PDMS, POM or PE should include some means of estimating site specific uptake kinetics, particular for highly hydrophobic PCBs.

19
3. PERFORMANCE OBJECTIVES
The primary objectives of the demonstration program were to show that PDMS solid phase microextraction could be used in-situ (in lab or field) for the
• Determination of mobile and available contaminants in sediments • Assessment of bioaccumulation potential of hydrophobic contaminants in benthic
organisms • Assessment of vertical chemical profiles in surficial sediments and sediment caps
A summary of the quantitative and qualitative performance objectives are shown in Table 3-1. Table 3-1 - Performance Objectives
Performance Objective
Data Requirements Success Criteria Results
Quantitative Performance Objectives
High analytical accuracy and reproducibility under laboratory conditions
Measurement of fiber-water partition coefficients and replicate variability
% error of Kfw<20%
COV in replicates<20%
Linearity of calibration curve r2>0.9
Demonstrated for all PAH16 compounds except naphthalene due to weak sorption and subsequent loss of naphthalene. Linearity generally greater than 0.99 for PAHs except most hydrophobic due to difficulty in maintaining aqueous standards for highly hydrophobic compounds (also effects PCBs).
Low detection limits
Controlled measurement of detection limits
Detection limits of PAHs at least 10 times lower than comparison surface water quality criteria
Demonstrated for all PAH compounds except naphthalene due to weak sorption of naphthalene. Use of additional sorbent can improve naphthalene results. Demonstrated for PCBs based upon literature and extrapolation of measured sorbent-water partition coefficients
Estimation of PDMS uptake kinetics
Evaluate methods for kinetics estimation
Development of analytical model and methodology to fit to kinetics data from different approaches
External mass transfer resistance model transport model verified and applied under field and lab conditions to time series data, two different size sorbents data and performance reference compounds data

20
Indicate cap performance
Evaluate profiles in sediments in lab and field
Demonstrate ability to determine porewater profiles with vertical resolution ~ 1 cm
Demonstrated in laboratory and field. Used to demonstrate cap performance in lab and field. Demonstrated substantial improvement over bulk solids measures
Predict bioaccumulation potential in laboratory in-situ tests
Simultaneous measurement of bioaccumulation and porewater concentration
Correlate PDMS and bioaccumulation with r2>0.7. Measure biota-water concentration factor (BCF) with precision of factor of 2
Demonstrated with variety of organisms and sediments. Measured steady state biota-water concentration factor 1.32 (±0.82)*Kow with PAHs and PCBs, marine and freshwater systems and a variety of deposit feeding benthic organisms
Predict bioaccumulation in field in-situ tests
Simultaneous PDMS and bioaccumulation measurement in field
Correlate PDMS uptake and measured porewater concentration with bioaccumulation with r2>0.7
Correlation r2 typically > 0.8
Biota-water accumulation factor more scattered than with laboratory tests and often lower, 0.2-0.5 Kow, presumably due to influences of site stressors not found in laboratory tests
Qualitative Performance Objectives
Ease of application to laboratory in-situ use
Evaluate ability to place and retrieve sorbent fibers from laboratory microcosms
Recovery and processing of fibers during laboratory experiments
Demonstrated. No significant losses, fiber integrity maintained during experiments, no losses due to organisms.
Low molecular weight, volatile HOCs such as naphthalene do exhibit significant losses with time

21
Ease of field use Evaluate ability to deploy and retrieve samplers in the field
Evaluate ability to process sorbent in the field and ship stabilized samples back to lab
Successful deployment and retrieval with divers
Successful processing without sample loss
Demonstrated
Demonstrated- shipping of unprocessed sorbent success but substantial losses for low molecular weight compounds (e.g. naphthalene). Processing before shipment using prefilled autosampling vials eases field use and insures sample stability
Ease of analysis Evaluate ability to directly analyze solvent in stabilized samples returned to lab
Analyses without further processing
Demonstrated- Some samples (Hunters Point) showed evidence of desirability of additional processing (sample cleanup)
Desirable to remove fiber from sample vials for thicker 1060/1000 fibers prior to autosampling to avoid interference with sampling needle

22
4. DEMONSTRATION DESIGN AND RESULTS
In this section the testing and results for each of the primary project demonstration objectives are discussed. As indicated previously these included,
• Laboratory demonstration of detection limits, accuracy and reproducibility of PDMS-SPME for measurement of water concentrations
The demonstration led to generalization of existing PDMS-water partition coefficients and showed that the technology could measure HOCs with accuracy and reproducibility equivalent to conventional techniques but with very low detection limits
• Evaluation of kinetics of uptake of PDMS-SPME for water and porewater concentrations
The demonstration led to the development of models capable of describing PDMS-SPME uptake kinetics and to the development of practical methods to evaluate uptake kinetics in field situations including the simultaneous use of fibers of different sizes to infer kinetics as well as the use of performance reference compounds.
• Laboratory demonstration of the relationship between measured porewater concentrations and bioaccumulation in various benthic organisms
The demonstration showed that the potential for bioaccumulation was proportional to measured porewater concentration for a variety of organisms and sediments. The bioconcentration factor between porewater concentration and organism lipid-normalized bioaccumulation was approximately given by the octanol-water partition coefficient, Kow, of the bioaccumulating compound.
• Laboratory demonstration of cap performance assessment using measured porewater concentration profiles
The demonstration showed that porewater concentrations in the biologically active zone of a sediment cap also indicated bioaccumulation in benthic organisms populating a cap. The dilution of bulk sediment concentration by inert nonsorbing sand was not effective at decreasing bioaccumulation in exposed organisms. The separation of benthic organisms from contaminated sediments by an inert nonsorbing sand layer, however, was effective as long as the depth of active bioturbation was less than the thickness of the sand layer.
• Field measurement of porewater concentration profiles in sediments
The demonstration showed that vertical profiles in hydrophobic organic contaminants could be measured in-situ assisting in the evaluation of the mechanisms and rates of transport. In general, multiple time series measurements are required to define contaminant dynamics. The approach was shown to be far more effective than bulk solid measurements at indicating contaminant migration in a cap.
• Field measurement of relationship between bioaccumulation in benthic organisms and measured porewater concentrations

23
Field measurements of bioaccumulation in various benthic organisms and sediments were shown to correlate with measured porewater concentrations in the near surface sediments. Field measurements were complicated by the dynamics of uptake onto the sorbents, the dynamics of uptake in the organisms and the presence of other stressors in the field. Measured bioaccumulation was generally 20-40% of that predicted by ow pwK C .
4.1. Laboratory Demonstration of Detection Limits, Accuracy and Reproducibility of PDMS-SPME for Measurement of Water Concentrations
The demonstration led to generalization of existing PDMS-water partition coefficients and showed that the technology could measure HOCs with accuracy and reproducibility equivalent to conventional techniques but with very low detection limits. This was shown by various laboratory studies conducted throughout the project but perhaps best shown by a laboratory calibration study undertaken as a collaborative effort with the USACE-Seattle District in preparation for subsequent evaluation of the performance of a sediment cap at Pacific Sound Resources in Seattle WA. This section summarizes the detection limits, accuracy and reproducibility of PDMS-SPME as indicated by PAHs in standard water solutions. It is possible to prepare and maintain a water standard of the most important PAHs (PAH16) even with absorption onto small PDMS fibers and thus detection limits, accuracy and reproducibility could be measured directly.
PCBs were not used in this effort primarily due to the inability to maintain standard concentrations of the highly sorbing PCBs in water, requiring alternative dynamic calibration methods. Fiber-water partition coefficients of PCBs (and two PAHs) as measured by Mayer et al. (2000)10 were employed to correlate with a consistent set of Kow values, Mackay et al. (1992) 24for PAHs and Hawker and Connell (1988)25 for PCBs. Mayer et al. (2000)13 employed Kow values based only on PCB chlorine number and thus the correlation as given was inconsistent with the Hawker and Connell Kow values. Since only two PAHs, phenanthrene and fluoranthene, were measured by Mayer et al. (2000)13, we measured PDMS-water partition coefficients of seven medium to high molecular weight PAHs to supplement Mayer’s data. The resulting correlation and confidence intervals, applicable to high molecular weight PAHs and PCBs, was given by Equation (3). Selected measurements of PCB fiber water partition coefficients gave results within the error bounds of this relationship 26 . Because of the availability of this relationship for highly hydrophobic compounds, the focus was on extending this correlation to moderate to low hydrophobicity compounds with Kow ≤5-5.5. Correlation (3) included compounds with Log Kow up to 7.36 but only a single compound with a Kow < 5.
Summary of Results A calibration study was conducted to accurately estimate fiber-water partition coefficients for polydimethylsiloxane (PDMS) as a sorbent for PAHs in water using a solid phase microextraction technique (SPME). The calibration study was funded by EPA’s Innovative Technologies Program, and was intended to confirm the reliability SPME approach for Pacific Sound Resources (PSR) Superfund Site in Seattle, Washington. Puget Sound seawater from an uncontaminated location was used for the calibration, which focused compounds of concern (COC) from the PSR site, 15 PAH compounds, dibenzofuran, and 2-methylnaphthylene (2-MNP). Acenaphthylene, although a COC, was excluded due to an inability to detect this

24
compound at low concentrations via fluorescent detection. Benzo(g,h,i)perylene and indenopyrene were also treated as a single compound due to coelution under the high performance liquid chromatography (HPLC) conditions employed. Both high and low concentration standards were prepared and diluted to generate 10 different concentration mixtures, 5 mixtures within each range. The calibration’s low concentration range extended below surface ambient water quality standards, and was intended for use to compare against shallow PSR sediment cap porewater; while the high concentration range extended to near the limits of solubility in water for individual compounds, and was intended for use in testing potential breakthrough at deeper locations within the sediment cap.
All compounds are expected to be detectable at concentrations below the surface water quality standard using a single cm of a 230/210 PDMS SPME fiber (230 µm outside diameter with PDMS sheath and 210 µm glass core). The concentration magnification afforded by the fiber varied from a factor of 78.5 for naphthalene to 161,000 for benzo(g,h,i)perylene/ indenopyrene. The lowest measured concentrations were below surface water quality criteria except for the combined benzo(g,h,i)perylene/indenopyrene concentration which was slightly higher than the surface water quality standard concentration for indenopyrene alone. Detectable concentrations for benzo(g,h,i)perylene/indenopyrene, as indicated by extrapolation of the linear calibration curve and estimation from method detection limits, were well below the surface water quality criteria. Coefficient of variation at the lowest measured concentration (i.e. at or below the surface water quality standard) was less than 20% for all compounds except naphthalene and 2-methylnaphthylene. Most compounds exhibited a coefficient of variation at the lowest sample concentrations of less than 10% (i.e. equivalent to the variability in water measurements by conventional analytical techniques). Low range correlation coefficients for linear calibration of fiber-water partition coefficients exceeded 0.97 for all compounds except naphthalene, dibenzo(a,h)anthracene and benzo(g,h,i)perylene/indenopyrene. Only naphthalene exhibited a correlation coefficient less than 0.9. Naphthalene measured by PDMS is subject to measurement uncertainty due to the relatively low sample concentration magnification of naphthalene afforded by the sorbent and potential volatilization losses during processing.
PDMS SPME sorption was also tested for high concentration range samples approaching the water solubility of the compounds. All compounds were introduced simultaneously into the test solutions and co-solvent effects apparently led to the formation of separate phases and inconsistent water concentrations at small dilutions of the high concentration standard. In particular, when the concentration of individual compounds was in the range of 50% of solubility, the mixture no longer behaved as though it were dissolved in water. Concentrations within approximately 10% of individual compound solubility were also observed to represent the maximum concentration that exhibited linear sorption onto the PDMS SPME fiber. At concentrations above 10% of solubility of individual compounds, the PDMS SPME fiber would be expected to provide semi-quantitative concentration measurements. This would not be expected to limit the ability to use the PDMS SPME fiber as an early warning indicator of cap breakthrough. The high concentration range samples containing approximately 1-10% of the water solubility of the individual compounds (i.e. in the linear sorption range of the high concentration samples) were also fit to a linear calibration for the fiber-water partition coefficient. Correlation coefficients were in excess of 0.93 for all compounds.

25
Introduction The current effort is a laboratory calibration study to verify the capability of SPME technology for the measurement of water concentrations. The project goal is to develop accurate estimates of the fiber partition coefficients for SPME in known dissolved concentrations of the contaminants at the PSR site. The SPME sorbent material is the compound polydimethylsiloxane (PDMS), and the fiber partition coefficients relate to the mass of this sorbent. The scope of work consists of preparing known concentrations of pure contaminants, exposing the SPME to these concentrations, and analyzing for recovery against the standard. The two ranges represent the concentrations near the surface water standards applicable to the site (low range), which requires a quantitative measurement, and high concentrations values that might be found should an active nearby source (e.g., a NAPL source or contaminated sediment lower in the sediment column) occur (high range), for which either a quantitative or semi-quantitative response may be appropriate. Together, the ranges will demonstrate the appropriateness and sensitivity of the SPMEs to these ranges of interest.
Project Description This calibration study measured the SPME method’s ability for PDMS to adsorb polynuclear aromatic hydrocarbons (PAHs), as well as the compounds 2-methylnaphthalene (2-MNP) and dibenzofuran, over a relevant range of freely-dissolved concentrations of the compounds in Puget Sound seawater. A series of water concentration standards (low range for near-criteria concentrations and high range for near solubility limit concentrations) were prepared. SPME with PDMS sorbent were placed in the water standards and allowed to equilibrate. Both water and PDMS SPME were then analyzed. Water concentrations were analyzed by direct injection into an HPLC (SW-846 Method 8310), where possible using either UV or fluorescence detection. When concentrations were too low for direct injection analysis, liquid-liquid extraction was employed to concentrate water samples. PDMS SPME fibers were analyzed by extraction directly into acetonitrile and direct injection of the solvent extract. Best fit relationships between measured PDMS SPME concentration and water concentrations were determined as well as sorbent-water partition coefficients at each measured concentration. Linearity of the best fit relationships and constancy of measured sorbent-water partition coefficients were used as an indication of the ability to predict water concentration on the basis of measured PDMS SPME concentration. This report evaluates the efficacy of the SPME in quantifying the concentrations of these compounds over a range of concentrations. Project objectives, data gaps and investigation methods are summarized in Table 4-1 below.

26
Table 4-1 Summary of data quality objectives
Data Gap Project Objectives Investigation Methods
Performance Goal Decision Criteria
Fiber (PDMS) coefficients over appropriate ranges for PAHs in water.
Assure that fiber coefficients are accurately characterized for PAHs, 2-methylnaphthlene, and dibenzofuran.
Provide a suitable range of concentrations in a controlled laboratory environment in site-relevant seawater; tumble SPMEs for a week, extract SPMEs, and perform regression analysis to determine partitioning relationship between SPMEs and known water concentrations.
Determine fiber coefficients in two concentration ranges of contaminants, and the error of the concentration estimates
The fiber coefficients should be reliable predictors of freely dissolved concentrations in the low range of interest (against ambient water quality standards) and reliable quantitative or semi-quantitative predictors of higher (“early warning” levels) in deep cap samples to determine potential breakthrough
Procedures A low concentration standard (Std 1) and a high concentration standard (Std 2) were prepared and sequentially diluted with site surface water to generate a range of PAH concentrations in water. Concentration was measured in each diluted standard via either direct injection (at high concentrations) or liquid-liquid extraction (at low concentrations). Note that instrument calibration employs standards in solvent which are quite stable and less subject to losses during processing.
Three 1 cm fibers from Fiberguide Inc (NJ) containing polydimethylsiloxane (PDMS) in a 10 micron annulus on a 210 micron glass core (7 µL PDMS/m) were added to each bottle. NaNO3 was added to prevent biodegradation of PAHs. The bottle was shaken for one week on a shaker at150 rpm. At the end of equilibration, the bottle was taken from the shaker table, three water samples were analyzed immediately by direct injection and three 300 ml water samples were analyzed by liquid-liquid extraction (extraction into dicholoromethane, sample concentration via blowdown and solvent exchange into acetonitrile). The three fibers were removed, blotted dry with tissue and extracted with 100 μL acetonitrile directly into autosampling vials for analysis. All analyses involved injection of 25 µL of sample (water for direct injection, acetonitrile for liquid-liquid extraction and PDMS) via SW-846 Method 8310. PAH detection was via UV for high concentrations and fluorescence for low concentrations. Calibration information, including

27
second source standard calibration, of the UV and fluorescence detectors is summarized in Appendix B. For fiber samples, the measured solvent concentration was converted to PDMS fiber equivalent concentration assuming that 100% of the PAHs on the equilibrated fiber were removed by extraction.
DOC content in site surface water was also measured via Method 5310B. The average DOC concentration in the collected water was 1.82 (±0.11 std. dev.) mg/L. At this DOC concentration, no significant influence of colloidal organic carbon is expected for any but the most hydrophobic PAHs as estimated by Cfree water = Ctotal/(1+DOC*KDOC ). As DOC concentration increases and DOC*KDOC becomes significantly greater than 1, the effect of colloidal organic carbon increases. With a DOC concentration of less than 2 mg/L, a KDOC in excess of 5x10⁵ L/kg is required before a majority of the contaminant is associated with colloidal organic carbon. This would typically require a compound with an octanol-water partition coefficient in excess of 106. That is, compounds more hydrophobic than benzo[a]pyrene would be required before significant effects would be noted. Background PAH concentrations in site water and SPME fibers were also measured. PAHs were below detection limits in the Puget Sound surface water collected at a non-contaminated location near Edmonds, WA.
Analysis and Results Low Concentration Range
Water concentrations were reported as µg compound/L of water while fiber concentrations were reported as µg compound/L of PDMS. The ratio of the two provides an estimate of the fiber water partition coefficient Kfw. Table 4-2 summarizes both measured water concentrations and the standard deviations of each measurement for the low range water concentrations. Note that low concentration range solutions were prepared from a 1:4000 dilution of the high concentration range standard rather than a 1:100 dilution of the low concentration standard to avoid any concerns about the solvent (methanol) concentration in the lesser dilution. Table 4-3 summarizes the measured fiber concentration for these low range water concentrations and Table 4-4 summarizes the effective fiber-water partition coefficient at each concentration.

28
Table 4-2 Measured Water Concentrations- Low Concentration Range . Average of 3 replicates plus standard deviation (in red). Direct injection measurements in black and liquid-liquid extraction measurements in green.
Table 4-3 Measured PDMS SPME fiber Concentrations- Low Concentration Range . Average of 3 replicates plus standard deviation (in red). (ND=not determined)
Low Concentration Range std1 1:5000 std1 1:2000 std1 1:1000 std1 1:500std1 1:100= std2 1:4000
Water conc(µg/L) average stdev average stdev average stdev average stdev average stdev
Naphthalene 2.35 0.259 6.51 1.87 13.2 1.52 20.3 0.92 435 19.7
DBF 1.64 0.140 4.89 1.25 9.01 1.39 15.2 0.44 69.7 3.93
2-MNP 3.73 0.344 11.0 3.11 19.4 2.22 34.7 1.36 138 1.56
Fluorene 0.503 0.109 1.90 0.586 3.94 0.57 6.66 0.68 26.0 0.32
Acenaphthene 0.526 0.105 1.55 0.603 3.08 0.26 5.34 0.46 48.7 0.98
Phenanthrene 0.362 0.092 0.82 0.039 2.17 0.18 3.57 0.36 12.9 0.34
Anthracene 0.0184 0.00127 0.0340 0.00731 0.065 0.012 0.149 0.019 0.698 0.072
Fluoranthene 0.1008 0.00222 0.239 0.00531 0.533 0.037 0.902 0.120 2.766 0.090
Pyrene 0.0548 0.00210 0.115 0.00927 0.200 0.009 0.459 0.050 1.558 0.136
Chrysene 0.00117 0.00002 0.00242 0.00003 0.00459 0.00050 0.00898 0.00094 0.05502 0.00605
Benz[a]anthracene 0.00480 0.00000 0.01050 0.00047 0.02289 0.00439 0.04070 0.00292 0.11277 0.00739
Benzo[b]Fluoranthene 0.00089 0.00010 0.00146 0.00028 0.00268 0.00052 0.00647 0.00102 0.01581 0.00045
Benzo[k]Fluoranthene 0.00039 0.00001 0.00065 0.00002 0.00123 0.00024 0.00231 0.00027 0.00547 0.00019
Benzo[a]pyrene 0.00215 0.00016 0.00410 0.00046 0.00916 0.00181 0.01633 0.00130 0.04564 0.00165
Dibenz[a,h]anthracene 0.00900 0.00176 0.01390 0.00166 0.03323 0.00772 0.05850 0.00402 0.00238 0.00008
Benzo[ghi]+Indeno 0.02339 0.00795 0.02820 0.00183 0.06207 0.01408 0.10586 0.00705 0.00729 0.00042
Low Concentration Range std1 1:5000 std1 1:2000 std1 1:1000 std1 1:500std1 1:100= std2 1:4000
Fiber conc(µg/L) average stdev average stdev average stdev average stdev average stdev
Naphthalene 247 219 405 146 3619 938 927 812 55930 40775
DBF 5408 542 11567 1161 31809 5872 58157 13283 445305 33711
2-MNP 3256 2287 4811 922 26929 11464 30905 16903 339257 83168
Fluorene 2480 138 5762 515 14586 2205 30085 8603 108960 7449
Acenaphthene 1291 182 2816 422 8559 1571 14856 4229 175734 13842
Phenanthrene 2795 35.0 7174 662 15917 1861 32880 5938 137871 4606
Anthracene 190 ND 443 80.1 938 61.8 1951 186 7651 523
Fluoranthene 2379 236 6645 1579 12429 1235 25394 2830 82611 2832
Pyrene 1268 103 3573 386 7345 1049 14302 1902 54760 1240
Chrysene 89.4 17.0 228 16.4 373 88.5 695 124 3010 75.3
Benz[a]anthracene 352 13.7 1107 115 1985 293 3847 487 9646 274
Benzo[b]Fluoranthene 98.9 11.5 238 49.0 461 113 801 119 1948 118
Benzo[k]Fluoranthene 41.8 3.35 119 13.1 222 39.6 364 48.5 682 40.4
Benzo[a]pyrene 357 20.6 992 85.2 1849 293 2997 391 5953 325
Dibenz[a,h]anthracene 1396 76.6 3874 316 6703 1066 9023 1921 264 75.3
Benzo[ghi]+Indeno 2532 178 7180 590 12376 2112 17328 3419 786 67.7

29
Table 4-4 Effective PDMS SPME fiber-water partition coefficient – Low Concentration Range plus average, standard deviation and coefficient of variation (standard deviation divided by average) in %.
The coefficient of variation in the average fiber-water partition coefficient gives an indication of the linearity between PAH concentration and sorption onto the fiber (or alternatively the constancy of the fiber-water partition coefficient (i.e. independent of concentration). The fiber-water partition coefficient is effectively constant(<25% coefficient of variation) for all compounds except the three least hydrophobic naphthalene, dibenzofuran and 2 methylnaphthalene, and the two most hydrophobic compounds, dibenzo[a,h]anthracene and benzo(g,h,i)perylene/indenopyrene. The variation in dibenzofuran is driven by a single outlier concentration at the least diluted standard.
An alternative means of evaluating the linearity between sorption onto the PDMS SPME fiber and water concentration is to conduct a linear regression on the data. The slope of this relationship is the fiber-water partition coefficient, Kfw or a concentration magnification factor. Table 4-5 summarizes the best-fit fiber-water partition coefficients and the correlation coefficient of the fit. The fiber-water partition coefficient varies from 78.5 to 161,000 and the correlation coefficients are generally above 0.99. The most hydrophobic compounds have slightly weaker fits and naphthalene has a very low correlation coefficient. Naphthalene measured by PDMS is subject to uncertainty due to the relatively low sample concentration magnification afforded by the sorbent and potential volatilization losses during processing.
Low Concentration Range
K f-w std1 1:5000 1:2000 1:1000 1:500
std1 1:100= std2 1:4000 average stdev COV (%)
Naphthalene 105 62 275 46 129 123 91 74DBF 3293 2365 3532 3816 6391 3879 1506 39
2-MNP 873 437 1385 890 2452 1207 772 64Fluorene 4930 3028 3699 4517 4192 4073 738 18
Acenaphthene 2453 1820 2783 2783 3612 2690 648 24Phenanthrene 7731 8764 7323 9213 10710 8748 1335 15
Anthracene 10290 13047 14413 13136 10968 12371 1697 14Fluoranthene 23597 27811 23317 28140 29867 26546 2928 11
Pyrene 23140 31099 36705 31157 35141 31448 5256 17Chrysene 76190 94181 81358 77340 54711 76756 14243 19
Benz[a]anthracene 73328 105377 86752 94522 85539 89104 11846 13Benzo[b]Fluoranthene 110892 162914 172010 123845 123258 138584 27057 20Benzo[k]Fluoranthene 106828 183790 181224 157684 124677 150840 34195 23
Benzo[a]pyrene 166060 241838 201921 183504 130440 184753 41395 22Dibenz[a,h]anthracene 155012 278758 201735 154228 111114 197433 58590 30Benzo[ghi]perylene +
Indenopyrene 108283 254586 199383 163689 107897 181485 61480 34

30
Table 4-5 Summary of linear correlation between measured water and PDMS fiber concentrations. Also included is minimum measured concentration and coefficient of variation in both fiber and water at that concentration. Also included is the concentration that is effectively indistinguishable from zero on the basis of the best fit linear correlation (based upon the correlation intercept). The theoretical detection limit for a 1 cm length of PDMS fiber is also included based upon calculation from the direct water injection MDL from Table B3. The surface water quality concentration, the desired low concentration endpoint is also included for comparison and the maximum concentration used in fitting the fiber-water partition coefficient.
*Fiber MDL = MDL (Table B3)*(25µL injection volume)/(Kfw*0.069 µL PDMS/cm)
Table 4-5 also shows the lowest measured concentration and the coefficient of variation at that lowest concentration based upon the three triplicate samples for both PDMS SPME fiber and water. For most compounds, the coefficient of variation in the PDMS SPME fiber measurement is similar to or less than the coefficient of variation in the water measurement by conventional means. Only naphthalene and 2-methylnaphthalene exhibit coefficients of variation at the lowest concentration that are substantially higher due to the difficulties of measuring compounds of low hydrophobicity with the PDMS SPME method.
Also included in Table 4-5 is the predicted concentration that is indistinguishable from zero concentration based upon the best-fit intercept of the linear correlation. The estimate is the best-fit intercept divided by the slope (or fiber-water partition coefficient) and indicates the concentration that corresponds to the best-fit intercept. This is generally a conservative indicator of detection limit (and in fact many of the lowest measured concentrations are less than this intercept). The theoretical detection limit, or fiber MDL, is the water concentration that would lead to a PDMS fiber concentration detectable at the MDL by direct water injection in the HPLC. This is calculated by
(25 )( )
MDLf MDL
fw
C LinjectionvolumeCK PDMS volume
µ− =
(6)
Low Range r2
Low Range
Min Conc µg/L
COV % Fiber
Lowest Conc.
COV % Water Lowest
Conc
Low Conc ~ 0
(linear fit)
µg/L
Water MDL µg/L
Direct Injection COV SPME
COV Direct
Analysis
SPME MDL µg/L
*
Surface Water Quality Criteria
µg/L
Low Range
Max Conc µg/L
Naphthalene 0.1547 2.35 88.8% 11.0% 5.96 0.07 88.8% 11.0% 0.3332 9.58 435DBF 0.985 1.64 10.0% 8.5% 1.06 0.14 10.0% 8.5% 0.0123 70
2-MNP 0.9817 3.73 70.2% 9.2% 10.19 0.19 70.2% 9.2% 0.0268 138Fluorene 0.9984 0.503 5.6% 21.7% 0.14 0.81 5.6% 21.7% 0.0697 3460 26
Acenaphthene 0.9996 0.526 14.1% 20.0% 0.73 0.32 14.1% 20.0% 0.0315 640 49Phenanthrene 0.9973 0.362 1.3% 25.5% 0.36 0.23 1.3% 25.5% 0.0076 13
Anthracene 0.998 0.018 18.1% 6.9% 0.014 0.222 18.1% 6.9% 0.0075 26400 0.7Fluoranthene 0.9985 0.101 9.9% 2.2% 0.054 0.210 9.9% 2.2% 0.0025 90 2.77
Pyrene 0.9987 0.055 8.1% 3.8% 0.018 0.209 8.1% 3.8% 0.0021 2590 1.56Chrysene 0.9967 0.0012 19.1% 1.5% 0.0022 0.0698 19.1% 1.5% 0.00048 0.018 0.055
Benz[a]anthracene 0.9978 0.0048 3.9% 0.1% 0.0015 0.0266 3.9% 0.1% 0.00011 0.018 0.112Benzo[b]fluoranthene 0.9945 0.00089 11.6% 11.5% 0.00047 0.03650 11.6% 11.5% 0.00011 0.018 0.0158Benzo[k]fluoranthene 0.9781 0.00039 8.0% 1.4% 0.00036 0.00650 8.0% 1.4% 0.00002 0.018 0.0055
Benzo[a]pyrene 0.9755 0.0021 5.8% 7.5% 0.00431 0.01830 5.8% 7.5% 0.00005 0.018 0.046Dibenz[a,h]anthracene 0.9241 0.009 5.5% 19.5% 0.00829 0.02630 5.5% 19.5% 0.00007 0.018 0.059

31
Where f MDLC − is the PDMS MDL, MDLC is the direct injection water concentration MDL, fwK is the PDMS fiber-water partition coefficient (second column Table 4-5) and the PDMS volume is the volume extracted into a single injection (in this case, 1 cm of a 10 µm PDMS layer on a 210 µm core or 0.069 µL PDMS). Routine quantification may be expected at a concentration approximately 10 times this concentration. For comparison purposes, the targeted lower concentration, the surface water quality standard is also included in Table 4-5 as well as the highest concentration used in the fitting for the low concentration range.
A review of the information in these Tables indicates that the PDMS SPME was able to accurately quantitate water concentrations at concentrations below the ambient surface water quality standards. There is greater uncertainty with the least hydrophobic compounds for which PDMS does not provide as great a magnification effect and which can evaporate from both aqueous solutions and the PDMS fibers. In general, however, the PAHs can be detected accurately and at low concentrations.
High Concentration Range In the high concentration range, a more limited range of concentrations are available for evaluation of PDMS SPME. At the lowest dilutions (1:200 and 1:100 dilutions) of the high concentration range standard 2, concentration results were inconsistent with the dilutions. For the 1:100 dilution in particular, the water solution looked cloudy and concentrations, especially for the more hydrophobic compounds, were significantly greater than their solubility. This was likely the result of the difficulty of achieving full dissolution of the PAHs at these high concentrations, resulting in inconsistent measurements. Additionally, the mixture of multiple PAHs, and solvent from the dilution standard, may have led to an effective solubility different from that reported for individual compounds. Table 4-6 shows the water concentration measured in the various dilutions in the high concentration standard. The associated SPME concentrations and fiber-water partition coefficients in the high concentration range are shown in Table 4-7 and Table 4-8, respectively. Dibenz[a,h]anthracene and benzo[ghi]perylene + indenopyrene are not included in Table 4-8 due to the difficulty in achieving consistent results for these hydrophobic compounds in the high concentration range.

32
Table 4-6 Measured Water Concentrations- High Concentration Range . Average of 3 replicates plus standard deviation (in red). Direct injection measurements in black and liquid-liquid extraction measurements in green.
Table 4-7 Measured PDMS SPME fiber Concentrations- High Concentration Range . Average of 3 replicates plus standard deviation (in red).
High Concentration Range std2 1:2000 std2 1:1000 std2 1:500 std2 1:200 std2 1:100
Water conc(µg/L) average stdev average stdev average stdev average stdev average stdev
Naphthalene 1108 59.85 2002 50.9 4167 749 8631 107 22280 5593
DBF 289 25.93 471 38.4 1018 184 2051 38.6 28439 5880
2-MNP 605 46.99 1051 16.4 2238 407 4529 71.2 44954 11522
Fluorene 66.1 4.18 115 1.87 247 42.7 461 6.84 7166 1597
Acenaphthene 137 10.5 254 37.7 549 95.1 979 50.4 14156 4827
Phenanthrene 35.0 1.92 51.9 1.13 129 24.2 248 4.91 5106 1446
Anthracene 1.98 0.089 2.60 0.199 5.06 0.871 8.40 0.351 252 81.2
Fluoranthene 7.22 0.315 13.0 0.262 30.4 4.53 54.6 0.232 1292 415
Pyrene 4.05 0.547 7.55 0.218 17.5 2.45 34.2 0.749 718 242
Chrysene 0.1015 0.0166 0.1977 0.0585 0.3637 0.0567 0.5691 0.3978 13.1 3.64
Benz[a]anthracene 0.2724 0.0258 0.4815 0.0102 1.1155 0.1915 1.9177 0.1117 43.9 5.57
Benzo[b]Fluoranthene 0.0377 0.0038 0.0725 0.0094 0.1555 0.0319 0.2735 0.0926 6.58 1.89
Benzo[k]Fluoranthene 0.0102 0.0007 0.0223 0.0021 0.0511 0.0084 0.0975 0.0532 2.84 0.87
Benzo[a]pyrene 0.1033 0.0052 0.1838 0.0029 0.4882 0.0856 0.8961 0.0110 23.5 7.11
Dibenz[a,h]anthracene 0.0044 0.0003 0.0067 0.0005 0.0207 0.0018 0.0602 0.0633 69.8 3.54Benzo[ghi]perylene +
Indenopyrene 0.0141 0.0011 0.0195 0.0028 0.0584 0.0037 0.1367 0.0352 129 5.50
High Concentration Range std2 1:2000 std2 1:1000 std2 1:500 std2 1:200 std2 1:100
Fiber conc(µg/L) average stdev average stdev average stdev average stdev average stdev
Naphthalene 182793 123575 297862 197884 1512208 983727 3738759 1539796 27770597 5499014
DBF 976869 92734 2053231 191618 5031291 471242 23727873 5840387 82846789 15265473
2-MNP 853703 233929 1659906 531744 5416910 1711548 17080533 6376717 80439711 3305216
Fluorene 278080 19634 598937 51439 1507396 110805 8652378 2252714 28468068 6722338
Acenaphthene 592110 128744 983803 19498 2341020 265903 12411151 4590316 33985411 12854493
Phenanthrene 278631 13469 611978 54141 1469968 80869 6388929 1158506 10114168 1338879
Anthracene 17614 1514 33476 2671 94133 9595 667317 274060 1017475 200193
Fluoranthene 165620 5668 357838 21004 900006 31892 2874628 292530 1639451 127461
Pyrene 107846 5700 228871 8348 591738 12530 1861314 227959 968756 69684
Chrysene 6415 85.3 11049 951 29557 3233 42238 5635 18192 3604
Benz[a]anthracene 21560 746 36565 8381 92034 3529 130489 17496 53796 5041
Benzo[b]Fluoranthene 4756 62.3 6732 3695 13728 1339 7859 1209 5865 1061
Benzo[k]Fluoranthene 1712 38.3 2355 1370 4839 482 2773 372 2181 244
Benzo[a]pyrene 13507 245 19153 10916 41033 3715 22761 2924 19165 1700
Dibenz[a,h]anthracene 690 53.6 638 535 937 161 504 242 1002 234Benzo[ghi]perylene +
Indenopyrene 1785 24.3 1906 1511 2786 575 1438 232 2958 1149

33
Table 4-8 Effective PDMS SPME fiber-water partition coefficient – High Concentration Range plus average, standard deviation and coefficient of variation (standard deviation divided by average) in %. Also included is student t test of whether the estimated fiber-water partition coefficient in the high concentration range is significantly different from the fiber-water partition coefficient in the low concentration range. Values of p<0.05 indicate that the results are significantly different in the two concentration ranges.
The average fiber-water partition coefficient in Table 4-8 excludes both the 1:100 standard dilution (indicated previously as exhibiting separate phase behavior) and the 1:200 standard dilution. The elimination of the 1:200 dilution is the result of the fact that the fiber concentrations and the fiber-water partition coefficients are not linear in this concentration range. The concentrations in the 1:200 dilution are typically approximately 25% of the individual compound solubilities. The deviation from linearity could be the result of separate phase behavior in the solution due to the mixture of compounds and solvent although the water concentrations in Table 4-3 do not indicate that behavior. It is also possible that sorption to the PDMS is nonlinear at these high concentrations. Because of the deviation from linearity, however, the averages in Table 4-8 reflect only the 3 dilutions 1:2000, 1:1000 and 1:500 and extend up to a concentration that is approximately 5-10% of the individual compound solubility. The coefficients of variation of the fiber-water partition coefficients are generally good although somewhat higher, in general, than for the low concentration range partition coefficients. Also included in Table 4-8 is a test of whether the fiber-water partition coefficient at high concentration is statistically different from the low concentration range partition coefficient. If the p value is less than 0.05 then it is statistically likely that the fiber-water partition coefficient is different in the high concentration range. Only benzo(a)pyrene and acenaphthene differ based upon the results. For acenaphthene, the relatively low p value is primarily associated with the low coefficient of variation in the high concentration samples which means that even relatively small differences with the low concentration fiber-water partition coefficient may be statistically significant. It should be remembered that this low coefficient of variation in the high
High Concentration Range
K f-w std2 1:2000 1:1000 1:500 1:200* 1:100*
average 500-2000 dilutions stdev COV (%) p value
Naphthalene 165 149 363 433 1246 226 119 52.9 0.29DBF 3383 4357 4943 11571 2913 4228 788 18.6 0.15
2-MNP 1412 1579 2420 3771 1789 1804 540 30.0 0.25Fluorene 4205 5217 6095 18769 3972 5172 946 18.3 0.18
Acenaphthene 4314 3877 4267 12675 2401 4153 240 5.8 0.006Phenanthrene 7956 11785 11394 25719 1981 10378 2107 20.3 0.315
Anthracene 8905 12896 18608 79442 4033 13470 4877 36.2 0.74Fluoranthene 22931 27610 29588 52632 1269 26709 3419 12.8 0.95
Pyrene 26625 30320 33770 54420 1350 30238 3574 11.8 0.71Chrysene 63230 55878 81259 74215 1385 66789 13059 19.6 0.36
Benz[a]anthracene 79141 75942 82501 68043 1226 79195 3280 4.1 0.14Benzo[b]Fluoranthene 126141 92889 88273 28736 892 102434 20660 20.2 0.09Benzo[k]Fluoranthene 167201 105536 94602 28443 769 122446 39143 32.0 0.36
Benzo[a]pyrene 130800 104190 84044 25401 815 106345 23452 22.1 0.01* Not included in averages

34
concentration samples is based upon only three samples. Benzo[a]pyrene is the most hydrophobic of the compounds for which a high range concentration fiber-water partition coefficient estimation was attempted and the significant difference between the high and low concentration partition coefficient is largely the result of the apparent decrease in partition coefficient at the highest concentrations. This may represent a concentration dependent effect or simply the result of the solution instability at high concentrations for highly hydrophobic compounds. All other differences in the other compounds between the fiber-water partition coefficient at high and low concentrations were not statistically significant.
Table 4-9 summarizes the best-fit fiber-water partition coefficients and the correlation coefficient of the fit in the high concentration range. The fiber-water partition coefficient varies from 78.5 to 161,000 and the correlation coefficients are generally above 0.99. The most hydrophobic compounds have slightly weaker fits and naphthalene has a very low correlation coefficient. Naphthalene measured by PDMS is subject to substantial errors due to the limited sample concentration magnification of naphthalene afforded by the sorbent and potential volatilization losses during processing. Table 4-9 Summary of linear correlation between measured water and PDMS fiber concentrations in high concentration range. Also included is minimum and maximum measured concentration used to create the fit. The maximum concentration is also compared to the solubility of the individual PAH compound.
High Range
Kfw
High Range r2
High Range
Min Conc µg/L
High Range
Max Conc µg/L Sol ug/L
Naphthalene 401 0.9337 1108 4167 31000DBF 5536 0.9997 289 1020 3100
2-MNP 2869 0.9897 605 2238 24600Fluorene 6800 0.9999 66 247 1690
Acenaphthene 4320 0.996 137 549 3900Phenanthrene 12199 0.989 35 129 1150
Anthracene 24777 1 1.98 5.06 43.4Fluoranthene 31519 0.9998 7.22 30.4 260
Pyrene 36021 0.9999 4.05 17.5 430Chrysene 90781 0.9676 0.101 0.364 3.45
Benz[a]anthracene 84494 0.9986 0.272 1.116 9.4Benzo[b]fluoranthene 77630 0.9936 0.038 0.156 1.5Benzo[k]fluoranthene 78206 0.9909 0.01 0.051 0.8
Benzo[a]pyrene 71606 1 0.103 0.488 9.4Dibenz[a,h]anthracene ND ND ND ND 2.49Benzo[ghi]perylene +
Indenopyrene ND ND ND ND 0.26/1.76

35
A review these tables indicates that the PDMS SPME was also able to accurately measure water concentrations in the high concentration range. Accurate measurement assuming a linear model should be limited to concentrations less than 10% of the individual compound solubility, at least in the tested mixture. In general the fiber-water partition coefficients are not substantially different in the low or high concentration ranges. Extrapolation to higher concentrations, however, would be expected to be only semi-quantitative. Thus the PDMS SPME could be used for indicating potential source areas as an early warning indicator of contaminant migration but that at high concentrations, absolute concentration measurements may not be as accurate as at lower concentrations
Fiber-water Partition Coefficient- Correlation with Kow
All compounds except naphthalene, dibenzoanthracene and benzo[g,h,i]perylene/indenopyrene were used to identify a correlation between the fiber-water partition coefficient, Kfw, and the hydrophobicity of the compound as measured by the octanol-water partition coefficient, Kow. The result is the correlation
Log Kfw= 0.757 Log Kow + 0.513 (r2=0.970) (6)
The correlation is shown in Figure 4-1. The predicted Kfw and the error between the predicted and observed values are shown in Table 4-10. The correlation can be used to predict fiber-water partition coefficients for compounds other than those included in the measurements herein. Due to the difficulties in measurement for naphthalene and the two highly hydrophobic compounds, the correlation is likely a better predictor of actual fiber-water partition coefficient for these compounds than the observations. Also shown Table 4-10 is a correlation based upon past work in our laboratory that is essentially identical to that above (also Equation (2).
Log Kfw= 0.0.839 Log Kow + 0.117 (7)

36
Table 4-10 Summary of calibration fits between water concentration and fiber- water partition coefficients (Kfw). Correlation (Eqn 7- 0.839*Log Kow+0.117a ) includes all data except compounds shown in red. Also shown is correlation based upon literature and laboratory measurements (Eqn 6 – 0.757 Log Kow+0.513 b)
Figure 4-1 - Correlation between fiber-water partition coefficient, Kfw, and octanol- water partition coefficient, Kow. This work (0.757LogKow+0.513) and a correlation based upon a broader data set of PAHs (0.839*LogKow+0.117)
Measured Predicted PredictedPAHs log K ow Log Kf w Log Kf w
a % error Log Kf wb % error
Naphthalene 3.37 1.89 2.94 55.8% 3.06 62.1%DBF 4.30 3.60 3.72 3.5% 3.77 4.7%
2-MNP 3.90 3.41 3.39 -0.6% 3.47 1.6%Fluorene 4.18 3.63 3.62 -0.2% 3.68 1.3%
Acenaphthene 3.92 3.56 3.41 -4.3% 3.48 -2.2%Phenanthrene 4.57 4.04 3.95 -2.2% 3.97 -1.7%Anthracene 4.54 4.03 3.93 -2.6% 3.95 -2.0%
Fluoranthene 5.22 4.48 4.50 0.4% 4.46 -0.3%Pyrene 5.18 4.55 4.46 -1.9% 4.43 -2.5%
Chrysene 5.86 4.72 5.03 6.6% 4.95 4.9%Benzo[a]anthracene 5.91 4.93 5.08 3.0% 4.99 1.2%Benzo[b]fluoranthene 5.80 5.08 4.98 -1.9% 4.90 -3.5%Benzo[k]fluoranthene 6.00 5.08 5.15 1.4% 5.06 -0.5%
Benzo[a]pyrene 6.04 5.09 5.18 1.9% 5.09 -0.1%Dibenz[a,h]anthracene 6.75 5.15 5.78 12.2% 5.62 9.2%
Benzo[ghi]perylene+Indenopyrene 6.50 5.21 5.57 6.9% 5.43 4.3%
y = 0.757x + 0.513R² = 0.970
3.0
3.5
4.0
4.5
5.0
5.5
6.0
3.0 3.5 4.0 4.5 5.0 5.5 6.0 6.5 7.0
Log K
fw
Log Kow
Log Kfw
0.839*LogKow+0.117
Linear (Log Kfw)

37
4.2. Evaluation of kinetics of uptake of PDMS-SPME for water and porewater concentrations
The demonstration led to the development of models capable of describing PDMS-SPME uptake kinetics and to the development of practical methods to evaluate uptake kinetics in field situations including the simultaneous use of fibers of different sizes to infer kinetics as well as the use of performance reference compounds.
The accurate measurement of water and porewater concentration depends upon the ability to achieve equilibrium uptake in the PDMS fiber. Equilibrium is relatively rapid in stirred water (hours to days) and can be easily established by measurement of a time sequence. In sediments, equilibrium can take far longer and may be more difficult to establish, particularly in the field, due to uncertain transport processes, heterogeneity and time requirements.
Laboratory measurements of uptake kinetics can be accomplished directly by examining a time series of measurements in homogenized sediments. Figure 4-2 depicts the approach to steady state of several PAH and PCB compounds in static laboratory experiments with Anacostia River sediments.
PAH Kinetics in Bare Fiber
Time (d)
0 5 10 15 20
Fibe
r con
c (µ
g/L)
0
100
200
300
400
500
600Phe
Chrysene
B[b]F
B[a]P
Time (d)
0 10 20 30
Fibe
r con
c (µ
g/L)
0
100
200
300
400
500
PCB28
PCB52
PCB153
PCB180
PCB Kinetics in Bare Fiber
Figure 4-2 - Kinetics of uptake of selected PAHs and PCBs from Anacostia River sediments onto 30 µm PDMS fiber on 110 µm glass core
The kinetics of uptake are dependent upon the sediment and external transport processes and are difficult to define under field conditions. Huckins et al. (2002)18 described the use of impregnated performance reference compounds (PRC) during field deployments to estimate the extent of equilibrium attained within the device. The passive sampling device is initially equilibrated with an innocuous species that is not native to the sediment. The mass of the PRC is then measured after the deployment in an effort to determine the extent of equilibrium. Difficulties with this approach include appropriate identification of a compound not present or present in very low concentrations that can be used as a PRC. In addition, the hydrophobicities (and therefore kinetics of uptake) of the PRCs should be similar to the compounds of interest and equilibrium must be achieved during pre-equilibration prior to use of the passive sampler. To measure porewater concentrations of compounds with a range of hydrophobicities, more than one PRC would typically be required to assess the variation of uptake with hydrophobicity. Finally sorption and desorption must be linear, first order and reversible processes (generally valid at low concentrations but may not be valid at high concentrations or in the presence of strongly sorbing phases such as activated carbon). Radio labeled compounds (3H or 14C labeled compounds) are convenient for this purpose but may require a separate chemical analysis for the

38
PRC. Deuterated compounds are not radioactive and are detectable by the same analytical techniques as the compounds of interest. Here, selected deuterated PAHs (d10-Fluoranthene, d12-chrysene, d12-benzo[b]fluoranthene and d14-dibenz[a]anthracene) were used as PRCs for other PAHs because they eluted from a HPLC chromatographic separation at different times than the parent compound and still allowed fluorescence detection. The fractional loss of these compounds provides an estimate of the fractional approach to steady state after a period of exposure. That is, a 75% reduction in the PRC corresponds to 75% of the achievement of steady state conditions for that compound. By fitting the fractional approach to steady state for these deuterated PAHs to a model of sorption onto the passive sampler (as described below), the fractional approach to steady state for any compound could be estimated.
Alternative approaches were also developed and demonstrated herein that could be used to complement performance reference compounds using
• Sorbent fibers of two different sizes (which exhibit different uptake kinetics) • Sorbent fibers of the same size collected at two different times.
These measurements were fit to a model of sorbent uptake (described below) and used to estimate deviation from equilibrium. One advantage of the sorbent exposure for two different times or two different size fibers is that there is no additional analytical complexity. In addition, if the compounds of interest represent a wide range of hydrophobicities such as PAH16, PAH34 or PCB congeners, data from all compounds over the entire range of hydrophobicities can be used to calibrate the model and yield higher accuracy estimates of the required non-equilibrium corrections. The approach can be applied to any passive sampling device using PDMS, POM, PE or e.g. semi-permeable membrane devices (SPMDs).
The uptake kinetics model used to calibrate the data is described in Lampert (2010)27. Because the PDMS layer on the fiber is thin, the time to achieve steady state in passive sediment porewater sampling is normally controlled by external mass transfer resistances. A small zone around the polymer sorbent is depleted during the transient process and the achievement of steady state is controlled by how fast this zone is replenished by the surrounding media. In a static system, this occurs via diffusion but it can occur much more rapidly by groundwater upwelling or downwelling, tidal pumping, bioturbation or hyporheic exchange, hence the requirement for site specific calibration of fiber uptake kinetics. An analysis of uptake into a thin film from a static sediment (in which diffusion is the only operative process) suggests that the external mass transfer controls as long as the following relationship holds
236
1 s fwexternal
internal
D Ktwheret RD
σ σ = =
(7)
Where sD is the diffusivity in the sorbent, fwK is the sorbent polymer-water partition coefficient and RD is the product of the retardation factor and effective diffusivity in the surrounding sediment. Assuming the diffusivity of the sorbent is less than or equal to 1/36 of the diffusivity in the surround medium, the value of σ is approximately given by the ratio of 2 /fw b swK Kρ where
bρ is the bulk density of the sediments and swK is the sediment water partition coefficient for the compound of interest. Since ~fw swK K the value of σ is typically of the order of fwK and much greater than 1 and therefore external mass transfer resistances dominate, at least under

39
diffusion controlled conditions. This is also typically true of other polymer sorbents such as POM and PE.
Assuming external mass transfer resistances control uptake in a thin film (locally two dimensional) surrounding by astatic sediment (diffusion controlled transport), the mass uptake into a sorbent fiber is given by
2 2
0 2 2
( ) 1 exp erfc for uptakeof contaminants
( ) exp erfc for desorption of PRCs
fw pwfw fw
fw fw
RDt RDtM t K C LL K LK
RDt RDtM t CL K LK
= −
= (8)
Where L is the surface volume to area ratio of the fiber (the thickness if a rectangular film) and the other parameters are as defined previously. The bracketed term is the fractional approach to steady state or equilibrium for uptake of compounds. Key simplifications that lead to this solution are locally flat coordinates (which is a good approximation even for the small cylindrical fibers used herein due to the thin layer of PDMS) and control by external mass transfer resistances. When performance reference compounds are used, the bracketed term (fractional approach to equilibrium) is measured directly and a value of RD can be determined for each performance reference compound. When measures at two different times or two different size fibers are used, the ratio of the observed concentration determines a value of RD for each compound measured A correlation between these measured values of RD and a measure of hydrophobicity, owK , can then be developed to allow predictions of RD for any other compound owK . The retardation factor, R, is normally expected to be linearly dependent upon owK , while the effective diffusivity, D, is only a weak function of compound and therefore RD is normally expected to be linearly dependent upon owK . This is shown in Figure 4-3 in which measurements of RD estimated by two different size fibers and RD estimated from performance reference compounds are compared in a field experiment conducted in Chattanooga Creek TN. This system represents a non-tidal, low permeability and low sorbing sediment system where uptake is expected to be very slow. The blue symbols represent estimated values of RD from the ratio of two different size fibers (230/210 and 1060/1000) while the red symbols indicate the values from 4 deuterated performance reference compounds (d10-fluoranthene, d12-chrysene, d12-benzo[b]fluoranthene, and d14-dibenz[a]anthracene). Both give essentially the same result, shown by linear fitted line in blue. Note that the thick vs thin fiber data provides estimates of RD for each compound present above detection limits, in this case, 7 mid-to high range PAH compounds. The performance reference compound approach provides estimates for only the four reference compounds. In this case RD is given by the best fit
0.001
0.01
0.1
1
10
3 3.5 4 4.5 5 5.5 6 6.5 7 7.5
RD (m
2/d)
Log Kow
Thick v Thin
PRC
RD=5e-7 Kow
Figure 4-3 Experimentally determined external transport factor (RD) relationship to Kow (with std error) to estimate PDMS uptake kinetics- (Chattanooga Creek, TN)

40
relationship 7 25 10 /owRD x K m day−= which can be substituted into Equation (8) to estimate the fraction of steady state for any sorbent fiber dimension (L), compound ( fwK ) and time of
exposure (t). Note also that a linear relationship between RD and owK is not expected if particle-related transport such as bioturbation is the primary mechanism of contaminant transport in the zone of interest. In such cases, RD would be expected to be essentially independent of owK .
The model of transient uptake could also be used directly to estimate the fractional approach to equilibrium by using predictive estimates of retardation factor and effective diffusivity. In static environments in which active mixing processes are expected to be minimal, the diffusivity and retardation can be estimated by
4/3~ granular media ~ consolidatedsediment1 ln
~
ww
b sw
D D
R K
φφφ
φ ρ−
+
DD
(9)
The estimate of effective diffusivity in granular media is from Millington and Quirk (1961)28 while that for consolidated sediment is from Boudreau (1997) 29 . In both cases, wD is the molecular diffusivity of the compound in water and φ is the void fraction or porosity of the sediment. In situations where linear reversible sorption is expected to apply, Ksw~focKoc where foc is the fraction organic carbon and Koc is the organic carbon based partition coefficient (e.g. related to the octanol-water partition coefficient, Kow in a relationship such as
0.903 0.094 Baker et al. (1996)oc owLogK LogK= + )30.
Active mixing of porewaters by tidal mixing, groundwater upwelling, bioturbation or hyporheic exchange will speed transport and can be incorporated into Equation (8) by considering an effective diffusion coefficient. In general, however, this is difficult to estimate a priori in field sediments and the use of performance reference compounds (e.g. deuterated compounds), time series measurements, or two different size sorbent fibers is recommended to fit uptake kinetics model to observations as outlined above.
4.3. Laboratory demonstration of the relationship between measured porewater concentrations and bioaccumulation in various benthic organisms
The demonstration showed that the potential for bioaccumulation was proportional to measured porewater concentration for a variety of organisms and sediments. The bioconcentration factor between porewater concentration and organism lipid-normalized bioaccumulation was approximately given by the octanol-water partition coefficient, Kow, of the bioaccumulating compound. The laboratory experiments in this component of the demonstration was initiated with preliminary experiments involving a single organism, the deposit feeding freshwater organism, Ilyodrilus templetoni. These results were reported in Lu et al. (2011)17. These experiments were followed with more comprehensive studies involving multiple organisms and sediments.
Preliminary experiments Bioaccumulation of polycyclic aromatic hydrocarbons (PAHs) and polychlorinated biphenyls (PCBs) was measured in preliminary experiments using the deposit feeding oligochaete

41
Ilyodrilus templetoni exposed for 28 d to Anacostia river sediment (Washington, DC) and to an initially uncontaminated sediment from Brown Lake (Vicksburg, MS) sequentially diluted with 3-25% contaminated New Bedford Harbor sediment (New Bedford, MA). The Anacostia river sediment studies represented exposure to a historically contaminated sediment with limited availability, while exposure to the other sediment included both the historically contaminated New Bedford Harbor sediment and fresh redistribution of contaminants into the Brown Lake sediments. Organism tissue concentrations did not correlate with bulk sediment concentrations in the Anacostia river sediment but did correlate with the sequentially diluted sediment. Porewater concentrations measured via disposable solid phase micro-extraction fiber (SPME) with polydimethylsiloxane (PDMS), however, correlated well with organism uptake in all sediments. Bioaccumulation was well predicted by a linear relationship with the product of pore porewaterwater concentration and compound octanol-water partition coefficient (Anacostia, slope=1.08, r2=0.76; Sequentially diluted sediments, slope=1.24, r2=0.76). The data demonstrate that the octanol-water partition coefficient is a good indicator of the lipid water partition coefficient and that porewater concentrations provide a more reliable indicator of bioaccumulation in the organism than sediment concentrations, even when the route of uptake is expected to be via sediment ingestion.
Introduction Hydrophobic organic compounds (HOCs) such as polycyclic aromatic hydrocarbons (PAHs) and polychlorinated biphenyls (PCBs) are common sediment contaminants around the world. Due to their persistence and potential for bioaccumulation, these contaminants are of high concern to environmental risk assessors. Assessment of toxicity and bioaccumulation of HOCs with total extractable contaminant concentration in the sediment (i.e. bulk sediment concentration) is unreliable and often provides poor predictions31. Sediment porewater concentration of HOCs, particularly the freely dissolved porewater concentration, however, has been shown to be a good indicator of bioavailability32,33,34,35. Predicted porewater concentration was also used to develop equilibrium partitioning benchmarks for protecting benthic organisms in PAH contaminated sediments by the U.S. EPA 36 although this approach is limited by the ability to estimate porewater concentrations in sediments. By directly examining the porewater that organisms are exposed to, factors that affect bulk sediment bioavailability, including pH, grain size, and fraction organic carbon (foc) are inherently taken into account37. However, measurement of freely dissolved sediment porewater concentration represents an analytical challenge. Obstacles such as inherent method shortcomings and low detection limits have made consistent characterization of porewater concentration quite demanding. The most commonly used conventional method for porewater measurement is centrifugation, which includes sediment centrifugation or filtration, solvent extraction, solvent exchange, concentrating and analysis 38 . However, due to hydrophobicity of most HOCs and thus very low porewater concentration especially for HOCs with log Kow greater than 6.0, an impractical large volume of sample is usually needed to achieve analytically detectable concentrations. Additionally, this approach suffers from incomplete water phase separation38, sorption or evaporation loss during sample transition, and interference from contaminants associated with colloids and dissolved organic carbons 39 . Several chemical techniques have been developed to overcome these limitations and detect freely dissolved water concentrations. These approaches include equilibrium dialysis 40 , gas purging 41 , alum flocculation to remove colloids 42 , and passive samplers such as semipermeable membranes (SPMD)43, Empore disks44, poly(oxymethylene) solid phase (POM)45, polyethylene (PE)46 and

42
polydimethylsiloxane (PDMS)10,5, 47 , 48 . Passive sampling has also been used as a direct biological surrogate since tissue concentrations show strong linear correlation with fiber concentrations35,49,50. POM, PE and PDMS are sorbents with similar, but not identical, sorption capacities for PAHs and PCBs. They are typically available in different geometries (i.e. different surface area to volume ratios) which has implications for detection limits and equilibration kinetics. In this work, PDMS is used because of its availability as a thin annular layer on a small diameter core that provides a high surface area to volume ratio (relatively fast kinetics) and can be easily inserted into sediments during bioaccumulation studies. Solid-phase micro extraction (SPME) is a partition-based, solvent free, negligible-depletion extraction technique that was introduced by Arthur and Pawliszyn in 199051. Since only a very small amount of HOC is extracted, the extraction does not influence the existing equilibrium between the bound and free form of a chemical, thus only freely dissolved concentration is measured51. Mayer et al.10 extended the SPME technique to measure the freely dissolved porewater concentration in sediments. In this approach, SPME fibers are directly inserted into the sediment and allowed to equilibrate with the sediment- porewater system. At equilibrium, fibers are retrieved from sediment either directly injected into the analytical instrument or solvent extracted into auto sampling vials. In practice, highly hydrophobic compounds will require long times to achieve equilibrium and corrections for disequilibrium are required52.
Our previous studies2,4 have shown that measurement of porewater concentrations via conventional approaches can be used to predict bioaccumulation and bioavailability of sediment-associated PAHs. In this study, this hypothesis will be further tested with a broader range of chemicals and sediments, and use of matrix-SPME to measure the porewater concentration. The present study is an effort to build on previous studies that have employed SPME to predict bioaccumulation33,35,49 by measuring bioaccumulation in the deposit feeding oligochaete Ilyodrilus templetoni exposed to five different sediment treatments over 28 d. The different sediment treatments were designed to specifically contrast a field contaminated sediment with previously demonstrated limited contaminant availability4 (Anacostia River, Washington, DC) and a laboratory contaminated sediment (Brown Lake, Vicksburg, MS) prepared by redistribution of contaminants during three weeks of mixing with 3%-25% mixtures (by weight) of a field contaminated sediment (New Bedford Harbor, MA).
Materials and Methods Chemicals, fibers and sediments A stock solution with 16 EPA priority pollutants PAHs was purchased from Ultra scientific analytical solutions Inc (North Kingstown, RI, USA). A separate stock solution with six PCB congeners, PCB10, PCB28, PCB52, PCB153, PCB138 and PCB180, was obtained from Supelco (Bellefonte, PA, USA). Six of the 16 PAHs, phenanthrene, pyrene, benz[a]anthracene, benzo[b]fluoranthene, benzo[k]fluoranthene, and benzo[a]pyrene were selected as model compounds based on detectability in all samples and to cover a wide range of partition coefficients. PCB congeners were selected simply based on the availability in the stock solution, the high frequency of these congeners detected in field samples and the lack of apparent coelution effects based upon comparison of common samples between our laboratories and complete congener analyses conducted by the US Army Engineer Research and Development Center (ERDC, Vicksburg, MS). Disposable glass fibers coated with a 30 µm layer of poly(dimethylsiloxane) (PDMS) on a glass core 110 microns in diameter were produced by Poly Micro Industries (Phoenix, AZ,USA). The coating concentration is about 13.5 µl PDMS per

43
meter of fiber. Before each use, fibers were cleaned by sonicating sequentially with hexane, acetonitrile, and Milliporewater. No interfering peaks were detected for both PAHs and PCBs analysis in the fibers after cleaning.
Two types of field contaminated sediments were employed in this study. The first sediment was collected from the Anacostia River, Washington DC as part of a continuing evaluation of active sediment capping. Surficial sediments were collected from a control area at a water depth between 10 and 15 ft. Total PAHs and PCB concentrations are approximately 30 mg/kg and 6-12 mg/kg, respectively (http://www.hsrcssw.org/ana-site.html). Total organic carbon (TOC) content was 5.4-5.8% (by CHN elemental analyzer). A second set of experiments were conducted using sediment more highly contaminated with PCBs from New Bedford Harbor diluted with a fresh-water sediment from Brown Lake, in Vicksburg, MS. This sediment was collected from the subtidal zone of New Bedford Harbor in 2001(New Bedford, MA). Measured concentrations in the collected sediment are 124 mg/kg total PCBs and 27 mg/kg of 16 EPA priority pollutant PAHs. The organic carbon content of the sediment was approximately 4% (by CHN elemental analyzer). Sediment from Brown Lake was collected in the fall of 2006 from a deep portion of the lake. The total PCB and 16 EPA priority pollutants PAH concentrations were below 15 and 32 µg/kg, respectively. The organic carbon content of Brown Lake sediment is 0.7 %. New Bedford harbor (NBH) sediment was diluted with the Brown Lake (BL) sediment to prepare the following NBH/BL sediment ratios: 25% (1:3), 12% (1:7.3), 6% (1:15.7), and 3% (1:32.3) on a dry weight basis identified as S25, S12, S6 and S3, respectively, in the present study. The sediments were homogenized for three weeks with a rotated pestle. The mixing with the New Bedford Harbor sediment led to a partial redistribution of available contaminants into the Brown Lake sediment and organic carbon. Dilution with fresh- water sediment allowed the use of the freshwater deposit feeding oligochaete Ilyodrilus templetoni and the lower concentrations in the mixture sediment minimized effects of the high concentration NBH sediment on organism survival and activity. Not only made it hospitable for fresh-water organisms, dilution with fresh- water sediment allowed exploration of a range of sediment concentrations.
Chemical Analysis Details of PAH analysis in sediment and tissue samples have been described in a previous paper2. Analysis of PCBs followed EPA method 808253. The procedure includes mixing samples with sodium sulfate, extracting in ultrasonic bath with solvents for 30 minutes (1:1 hexane and acetone for sediment samples and dichloromethane for worms tissue samples), solvent exchange to hexane, sample clean up following the method described by Froese et al. 54, and solvent concentration by nitrogen blow down. Preliminary tests showed that ultrasonic extraction of PCB exhibited similar extraction efficiency as soxhlet extraction. Organism lipid content was analyzed by a micro-gravimetric method2. Twenty worms instead of two worms were used for each sample analysis due to their small size; the volume of solvent (chloroform and methanol) and distilled water was increased accordingly.
Quantification of PAHs were performed via Waters 2795 high- performance liquid chromatography(HPLC, Waters, Milford, MA, USA) with ultraviolet-diode array and fluorescence detectors. The column was a Phenomenex (Torrance, CA, USA) Luna 5μ C18 column (250*4.6 mm). Analysis of PCBs were performed by Agilent (Santa Clara, CA, USA ) 6890 series gas chromatography equipped with an electron capture detector (GC-ECD) and HP-5 type 30-m capillary column (i.d.0.32 mm and film thickness 0.25). PCB congeners were identified based on the retention times of the corresponding peaks in the standard. No second

44
column was employed to confirm the individual congener. However, sediment samples were also analyzed by the US Army Engineer Research and Development Center (ERDC) (Vicksburg, MS), where a second column was employed to confirm individual congener. Congeners were selected for analysis based upon good agreement between the two analyses, suggesting little or no interference such as coeluting peaks for these congeners.
Bioaccumulation studies Bioaccumulation tests were conducted based on ASTM E1688-97a55 with an exposure period of 28 d. The fresh water deposit-feeding tubificid oligochaete Ilyodrilus templetoni (Southern) from a continuous culture in our laboratory was used in the bioaccumulation studies. Previous study showed that bioaccumulation of PAHs reached steady state within 28 d4. Preliminary studies on uptake kinetics of PCBs showed that 28 d was also sufficient to achieve steady state bioaccumulation in the organism for the most hydrophobic PCBs studied, PCB180. The ratio of total organic carbon in sediments to worm biomass was greater than 50 in all bioaccumulation tests to ensure that food was not limiting during the exposure55. Bioaccumulation in Anacostia river sediment was conducted in 2 L glass jars. Approximately 1.6 kg wet sediment (~50% moisture content) and 650 worms (~350 mg dry weight) were added to each of the nine jars. The exposure to sequential dilution sediments was investigated in 1L - tall beakers. Approximately 200 ml (~300g) wet sediment (~50% moisture content) and sixty worms (~35mg dry weight) were added to each beaker. Four replicates were set up for each sediment treatment and duplicates were set up with only brown lake sediment as controls. The overlying water, an artificial pond water (0.5 mM NaCl, 0.2 mM NaHCO3, 0.05 mM KCl, 0.4 mM CaCl2 ), was renewed every other day during the exposure. At the end of the experiment, sediments were sieved; worms were retrieved and allowed to depurate in artificial pond water for 6h in groups with 20 worms. Then worms were blotted dry, weighed and frozen for PAHs, PCBs and lipid analysis, 20 worms for each analysis.
Pore- water concentration measurement by Matrix-SPME Pore- water concentrations were measured via matrix-SPME developed by Mayer et al.10 and involving the measurement of the concentration on a fiber inserted into the sediment. Reproducibility of the fiber concentration was high. The relative standard deviation was 20±9% based upon all measurements. Pore- water concentrations were calculated based on the fiber concentrations at steady state. Fiber-water partition coefficients of PCBs and PAHs as measured by Mayer et al.10 were employed with consistent Kows for PAHs and PCBs from Mackay et al.24 and Hawker and Connell25, respectively combined with additional measurements of PAHs. The best fit of our measurements with seven PAHs and Mayer’s data with two PAHs, twelve PCBs and two chlorobenzenes is given by Equation (3) .
This correlation was used to estimate fiber-water partition coefficients of selected PAHs and PCBs in the present study. Note that correlation of only Mayer’s data using the octanol-water partition coefficients of Hawker and Connell25 produces the virtually identical relationship 1.03logKow -0.938 (gives values of Kf-w within 0.1 log unit of Eqn. 2 over the range of Kow of interest). Results are listed in
Table 4-11, and Figure 4-4 shows the fit of all data. The partition coefficients of the selected PAHs used in the present study are comparable to those measured by Ter Laak et al.48 with a maximum difference of 0.34 log units and minimum of -0.01 log units.

45
Table 4-11 Fiber-water partition coefficients (Kf-w, L water/L PDMS) for selected contaminants
aKow values are taken from Mackay et al14, bKow values are taken from Hawker and Connell15. cKf-w measured in this study. Values in parentheses are standard deviations based on four replicates. dKf-w estimated Equation 2 , eKf -w measured by Mayer13 fNA means not available
log Kow
3 4 5 6 7 8 9
log
Kf-w
2
3
4
5
6
7
8
the present studyMayer et al[28]best fit of data
Figure 4-4 Correlation of fiber-water partition coefficients of PAHs, PCBs and Chlorobenzenes measured in this work and from Mayer et al.13 with Octanol-water partition coefficients. Solid line represents best fit of all data (Eqn.2)
PAHs Log
Kowa
Log Kf-w (L/L) PCBs Log
Kowb
Log Kf-wc (L/L)
measuredc estimatedd measurede estimatedd
PHE 4.57 3.71(0.0214) 3.66
PYR 5.18 4.26(0.0619) 4.31 PCB28 5.67 NAf 4.90
CHR 5.86 4.76(0.149) 5.03 PCB 52 5.84 5.34 5.05
B[a]A 5.91 4.75(0.0835) 5.08
B[b]F 5.80 4.92(0.0834) 4.96 PCB153 6.92 6.16 6.18
B[k]F 6.00 4.96(0.0723) 5.18 PCB138 6.83 6.20 6.08
B[a]P 6.04 5.14(0.0174) 5.21 PCB180 7.36 6.4 6.64

46
Two fiber-exposure methods were employed in this study. In the experiment with Anacostia river sediment, porewater concentrations were measured independently from the bioaccumulation test, and fiber exposure followed the method of Mayer et al.13. In this exposure, 10-cm clean fibers were exposed to sediment via a syringe needle inserted through the septum of the 15-ml glass vials. The needle was withdrawn after the fiber was passed through the septum. The fiber length was adjusted so that there was approximately 6 cm of the fiber exposed to sediment. Two fibers were inserted in each vial: one for PAH analysis and one for PCB analysis. The vials were agitated on a shaker table. At specific times, 7d, 14d, 28d, and 56d, two vials were sacrificed for analysis. Fibers were withdrawn from the sediment and cleaned by wiping with a damp Kimwipe tissue to remove any solids. Five centimeters of the 6-cm fiber were cut into small pieces of approximately 1cm and transferred to 100-µl conical inserts in 2ml-autosampling vials. One hundred micro-liter of acetonitrile (for PAH analysis) or hexane (for PCB analysis) was added to the inserts. The vials were then analyzed directly by HPLC (PAHs) or GC-ECD (PCBs). Fiber achieved steady concentrations indicating equilibration with the porewater within one month for the most hydrophobic PCB investigated, congener 180.
In the experiment with sequentially diluted sediments, fibers were exposed in-situ with the worms through pierced Teflon-coated silicone disks with diameter of approximately 10 mm and thickness of 1 mm (septum of auto-sampling vials). A similar approach has been used by Conder and La Point11 to evaluate soil pore- water concentrations of explosive contaminants. One septum with four 2.5cm-fibers was put into each jar for a total of 5 cm fiber for PAH analysis and 5 cm for PCB analysis. At the end of the bioaccumulation test, the septa with fibers were removed with forceps, and fibers were separated from the septa. Fibers were then processed as described above. Because the fiber exposure was simultaneous with organism exposure, agitation the sediment was not possible. Therefore, more hydrophobic compounds would not be expected to achieve equilibrium during the period of organism exposure. Kinetic corrections were estimated by a fiber uptake model56. The model is a generalization of the model described in Fernandez et al. 46 to account for the geometry of the PDMS and to recognize that diffusion internal to the PDMS is negligible. PDMS uptake from sediments with low sorption capacity is limited by diffusive transport in sediment. Thus the corrections are large for the Brown Lake sediments due to the low organic carbon content and the resulting limited sorption capacity of the Brown Lake sediment. PAH corrections ranged from 0.43 for BaP (i.e. after 28 d, the fibers were estimated to be at 43% of equilibrium for BaP) to 0.97 for phenanthrene. PCB corrections ranged from 0.04 for PCB 180 to 0.60 for PCB 28. The correction for the most hydrophobic compound, PCB 180, is potentially subject to large error (factor of 2-4) while the corrections for the less hydrophobic compounds (e.g. all PAHs) are likely in error by much less than a factor of 2. The details of the model including comparisons to experimental data are described in Lampert56. In general, a better kinetic estimate is desired through the use of performance reference compounds57, sampling over time or simultaneous use of fibers with different kinetics to calibrate an uptake model. This was unavailable for the current estimate due to a failure to fully appreciate the slow uptake from the low capacity Brown Lake sediment prior to the experiment. Due to the small number of compounds with corrections potentially subject to large error (PCB 138, 153 and 180), this was not judged to be significant problem for this study.
Prediction of bioaccumulation from porewater concentration The octanol-water partition coefficient (Kow) has long been used as an estimate of the partitioning of organic contaminants from water to organism lipid phases58. The lipid-water

47
partition coefficient, Klip-w or bioconcentration factor here estimated as Kow, times the porewater concentration as measured by the SPME, is assumed to predict the lipid normalized accumulation in the worms’ tissue (Equation (5)). Kraaij et al.5 observed a best fit relationship between Kow and bioconcentration factors of two oligochaete species given by log BCF=1.01(±0.09)·log Kow-0.07(±0.46), which is essentially identical to Klip-w(BCF)=Kow over the range of Kow studied. Results and Discussion PAH and PCB concentrations in experimental sediments Due to the large volume of sediments used in each bioaccumulation test, sorption to fiber and septa, bioaccumulation by organisms or loss to evaporation are negligible (mass fraction of the contaminants in these phases is expected to be much less than 1% of the total contaminant mass in sediment). However, 15% biodegradation of phenanthrene was observed during a 7d exposure to laboratory- spiked sediment59. No significant biodegradation of any other compounds over the course of the experiment was observed or expected. The measured concentrations of the six selected PAH compounds and five PCB congeners in Anacostia River sediment and the four sequentially diluted sediments are given in Table 4-12. The two batches of the Anacostia River sediments represent different sediment samples and their differences may be reflective of site heterogeneity. The sequentially diluted sediments did not follow dilutions in some situations, suggesting that heterogeneity may also be an issue for those samples. The analytical variations within a given sample, however, are small, with an average coefficient of variation for Anacostia sediment of 9.37% with a maximum value of 32.0%, and the average coefficient of variation for sequentially diluted sediments of 17.0% with a maximum value of 38.0%. Table 4-12 Selected contaminant concentrations (ng/g) in Anacostia River and sequentially diluted sediments (S3-S25 represents 3-25% contaminated sediment in the exposure sediments)
Compounds Anacostia sediment Sequentially diluted sediments Batch 1 Batch 2 S3
a S6 S12 S25 PHE 2420
(299, 5)b 2160 (196, 3)
40.4 (4.70, 3)
163 (20.5, 3)
257 (72.1, 5)
583 (26.4, 3)
PYR 5400 (243, 5)
5610 (600, 3)
549 (129, 3)
485 (67.5, 3)
565 (112, 4)
1200 (290, 3)
B[a]A 2170 (106, 5)
1520 (97.3, 3)
59.0 (9.00, 3)
160 (23.1, 3)
241 (51.3, 5)
693 (65.6, 3)
B[b]F 2510 (93.3, 5)
2020 (57.4, 3)
84.4 (26.3, 3)
152 (50.5, 3)
270 (67.7, 4)
804 (70.4, 3)
B[k]F 1970 (149, 5)
1130 (57.1, 3)
33.2 (2.10, 3)
87.6 (15.4, 3)
128 (33.2, 5)
379 (27.2, 3)
B[a]P 2670 (150, 5)
2580 (310, 3)
70.9 (2.30, 3)
190 (32.2, 3)
242 (81.2, 5)
837 (57.1, 3)
PCB28 23.9 (2.60, 5)
58.7 (18.8, 5)
753 (70.5, 3)
1430 (65.0, 3)
1860 (65.8, 3)
6400 (1320, 3)
PCB 52 33.6 (2.30, 5)
36.2 (7.80, 5)
952 (104, 3)
1967 (355, 3)
2350 (133, 3)
7470 (1410, 3)
PCB 153 176.6 (11.1, 5)
95.2 (10.0, 5)
337 (26.7, 3)
651 (117, 3)
709 (168 ,3)
2520 (477, 3)
PCB138 155 (3.20, 5)
93.6 (17.3, 5)
187 (7.90, 3)
324 (71.8, 3)
501 (110, 3)
1370 (271, 3)
PCB180 124 (2.30, 5)
66.6 (7.30, 5)
52.8 (10.7, 3)
64.5 (17.1, 3)
94.3 (36.4, 3)
319 (65.9, 3)

48
Pore- water concentrations by matrix-SPME Porewater concentrations estimated from sorbed fiber concentrations as described previously are presented in Table 4-13. The lowest porewater concentrations measured by polydimethylsiloxane fiber is 0.052 ng/L for PCB180 in the Anacostia river sediment, which is approximately 40 times higher than the method detection limit. The method detection limits in porewater concentrations measured by 5 cm polydimethylsiloxane fiber are also shown in the Table. Most porewater concentrations listed in Table 4-13 are at least 10 times higher than the corresponding detection limits except for phenanthrene. The porewater concentrations of phenanthrene reported herein are within 5 times of the detection limits, so those data are associated with more uncertainty.
These measured porewater concentrations and organic carbon normalized sediment concentrations were used to calculate the organic carbon normalized sediment-water partition coefficients (Koc). The observed log Kocs were compared to the log Kocs predicted from equilibrium partition model based on a correlation with log Kow (log Koc=0.903*1og Kow+0.094)30. The results are illustrated in Figure 4-5. The equilibrium partition model over-predicted the porewater concentrations up to 2 orders of magnitude, e.g. for B[b]F, B[k]F and B[a]P in Anacostia river sediment. Similar extensive deviations of PAH porewater concentrations in field-contaminated sediments had been observed by many researchers48, 60. However, the deviations for PCBs were much smaller (within a factor of 10). Similar phenomena was observed by Kraaij et al.5 and was explained by the π-π interactions involved in the desorption of PCBs. Other literature has reported that sorption of PCBs to sediment and soils showed less desorption- resistant phenomena (slow desorption) when compared to PAHs60,61.In the sequentially diluted sediments, the relationship between the Brown Lake sediment component and water is expected to be well represented by equilibrium partitioning, however, the presence of contaminants in desorption- resistant phases of the New Bedford Harbor sediment led to an inability to use literature organic carbon based partition coefficients to represent overall partitioning in it. Thus direct measurement of porewater concentrations is the only means to reliably predict those concentrations.

49
Table 4-13 Porewater concentrations of selected contaminants (ng/L) in Anacostia river and sequentially diluted sediments by solid-phase microextraction
Values in parentheses represent standard deviations based on four replicates.
Figure 4-5 Measured organic carbon normalized sediment-water partition coefficients (Koc) vs predictions from equilibrium partition model based on a correlation with. The solid line represents a 1:1 relationship .
Compounds
MDL Anacostia sediment Sequentially diluted sediments Batch 1 Batch 2 S3 S6 S12 S25
PHE
18 255 (35.8)
251 (14.4)
24.0 (10.2)
36.0 (9.15)
43.3 (9.67)
50.7 (2.68)
PYR 7.2 587 (44.5)
875 (24.1)
51.0 (1.92)
53.5 (8.39)
83.9 (9.69)
131 (30.8)
B[a]A 1.1 2.49 (0.308)
2.79 (0.239)
1.10 (0.0509)
2.50 (0.368)
2.58 (0.0450)
5.21 (0.705)
B[b]F 1.9 2.33 (0.152)
1.57 (0.183)
1.57 (0.266)
1.94 (0.805)
2.88 (0.679)
4.72 (1.94)
B[k]F 0.37 0.591 (0.0310)
0.58 (0.0994)
0.405 (0.0991)
0.692 (0.216)
0.865 (0.172)
1.30 (0.200)
B[a]P 0.37 0.934 (0.0881)
0.96 (0.243)
0.639 (0.222)
1.076 (0.322)
1.37 (0.263)
2.64 (0.241)
PCB28 0.0050 3.41 (0.172)
4.65 (0.343)
227 (20.2)
311 (38.8)
326 (20.3)
636 (53.61)
PCB 52 0.0037 4.05 (0.214)
6.71 (0.290)
283 (19.8)
387 (44.9)
415 (22.9)
759 (47.7)
PCB 153 0.00019 0.34 (0.0535)
0.37 (0.0201)
8.35 (0.409)
11.7 (1.39)
12.7 (0.721)
24.6 (2.44)
PCB138 0.00027 0.42 (0.0796)
0.35 (0.0120)
4.53 (0.265)
6.38 (0.722)
7.27 (0.447)
13.4 (1.52)
PCB180 0.00013 0.065 (0.0108)
0.052 (0.00463)
0.359 (0.0483)
0.558 (0.0293)
0.613 (0.0251)
1.12 (0.131)
4
4.5
5
5.5
6
6.5
7
7.5
8
4 5 6 7 8predicted log K oc
mea
sure
d lo
g Koc
PAHs-S
PAHs-A
PCBs-S
PCBs-A

50
Comparison of accumulation in worms with sediment concentrations During the 28 d bioaccumulation test, no apparent weight loss (size) of organisms was observed in any sediment. As in previous experiments with these organisms, lipids content increased 20 to 30% during exposure, consistent with the increase in lipid content noted in controls. The sediment concentrations (organic carbon normalized) are compared to the associated organism bioaccumulation as lipid normalized tissue concentration in Figure 4-6. If the organic carbon normalized sediment concentration and the lipid normalized tissue concentration were linear correlated, the slope of the line would represent the biota-sediment accumulation factor. There is no correlation between lipid normalized organism bioaccumulation and organic carbon normalized sediment concentration, however, for the historically contaminated Anacostia sediment as shown in Figure 4-6a. Approximately one third of the organic carbon in this sediment is not volatile after 24 hours at 375 ºC, indicating the presence of significant black carbon62. The contaminants sorbed to this phase are often considered less available than that sorbed to volatile organic carbon, complicating the relationship between sorbed contaminant and bioaccumulation.
Figure 4-6 Comparison of lipid normalized tissue concentrations with organic carbon normalized sediment concentrations: Anacostia river sediment (a), and sequentially diluted sediments (b).
For the sequentially diluted sediment, however, there exists a generally good correlation between sediment concentration and organism bioaccumulation, at least for sequential dilutions of 3-12% (r2 are 0.78, 0.92, 0.92 for S3, S6, and S12 sediments, respectively) For the 25% dilution, the slope
0
2
4
6
8
10
12
0 20 40 60
Tiss
ue c
onc(
µg/g
lipi
d)
Sediment concentrations (µg/g OC)
a
Batch 1
Batch 2
0
50
100
150
200
250
300
350
400
450
500
0 100 200 300 400
Tiss
ue c
onc(
µg/g
lipi
d)
Sediment concentrations (µg/g OC)
b
S3
S6
S12
S25

51
of the relationship between bioaccumulation and sediment concentration is approximately half that of the other dilutions although a high correlation coefficient was also noted (r2=0.96). In this sediment, unlike the other treatments, the worms stayed at the sediment surface for 24 hours before burrowing. Although no change in survival or organism lipid content was noted in this treatment, the apparent reduced bioaccumulation in this treatment was possibly due to reduced organism activity in the sediment.
Comparison of accumulation in worms with pore- water concentrations Figure 4-7 compares the lipid- normalized tissue concentrations to the product of the PDMS SPME measured pore- water concentrations and Kow as an estimate of the lipid-water partition coefficient, Klip-w, and to account for compound hydrophobicity. The measured porewater concentrations should reflect the more limited availability observed with the Anacostia River sediment and, possibly, the 25% dilution sediment. The observed relationship between lipid- normalized tissue concentration and KowCpw is statistically indistinguishable for all sediment treatments. The observed bioaccumulation was well predicted by a linear relationship with the product of porewater concentration and compound octanol-water partition coefficient (Anacostia, slope=1.08, r2=0.76; Sequentially diluted sediments, slope=1.24, r2=0.76). A similar relationship between bioaccumulation and porewater concentrations in Anacostia river sediment was also observed in a previous study, in which the porewater concentrations were measured by conventional liquid-liquid extraction4. The bioaccumulation in the Ilyodrilus can also be characterized with a bioconcentration factor defined by the ratio of the lipid normalized tissue concentration to the porewater concentration. Data in both the Anacostia River sediments and the sequential dilution sediments fit a relationship defined by log BCF=1.03 Log Kow (r2=0.87), which supports our hypothesis that octanol-water partition coefficient is a good estimate for the lipid-water equilibrium coefficient. The relationship between BCF and Kows from the present study is essentially equivalent to that developed by Kraaij et al5.
Figure 4-7 Comparison of measured tissue concentrations (lipid normalized) with predictions from pore- water concentrations: Anacostia river sediment (square), sequentially diluted sediments (diamond). Solid lines represent best fit of data (Ct, measured =1.08 Ct, predicted, r2=0.757 (Anacostia), Ct, measured =1.24 Ct, predicted, r2=0.762(sequential)). The dashed line represents the 1:1 relationship. The data includes both PAHs and PCBs.

52
The observation that pore- water concentration indicates the ultimate bioaccumulation of HOCs is likely due to the quasistatic equilibrium that is achieved between organism lipid, sediment and porewater and does not imply that the route of uptake is via porewater. The route of uptake for the strongly hydrophobic compounds is expected to be through ingestion63. Despite this, the porewater concentration apparently remains a good indicator of bioaccumulation in the organism with a lipid-water partition coefficient approximately equal to the octanol-water partition coefficient.
Note that the organic carbon normalized sediment concentration, Cs/foc, is a surrogate for predicted pore- water concentration based upon reversible equilibrium partitioning theory with the organic carbon based partition coefficient, Koc (i.e. Cpw-pred= Cs/foc/Koc). The lack of a correlation between lipid normalized tissue concentration and organic carbon normalized sediment concentration for the Anacostia sediment suggests that no simple model of Koc predicts the relationship between sediment and porewater concentration and availability to the organism. Measurement of the porewater concentration or a model of sorption to the desorption- resistant phases would be required to characterize these relationships.
For the sequentially diluted sediments, the apparent existence of a correlation with sediment concentration may be due to the fact that both porewater and bulk sediment concentrations were reduced by the dilution with Brown Lake sediment. Thus a relationship between porewater concentration and bioaccumulation would also suggest that a correlation would exist with bulk sediment concentration. Note, however, that the relative reductions in porewater and bulk sediment concentration would depend upon the extent of redistribution of contaminants to the dilution sediment. Due to the lower sorption capacity of the Brown Lake sediment dilution, the porewater concentration decreased by an average factor of 3.1 between 25% and 3% dilutions while the sediment concentrations decreased by an average factor of 7.9. If the dilution were by non-sorbing material such as clean sand, we would expect that the porewater concentration would essentially be unchanged as would the expected bioaccumulation while the overall bulk sediment concentration would decrease in proportion to the amount of sand.
It should be emphasized that the experiments were under quasi-static conditions in which the pore- water concentration, sediments and organism lipids are in an approximate state of equilibrium. The observed relationship between porewater concentration and organism bioaccumulation would not be expected under dynamic conditions such as fast groundwater upwelling rates, or rapid contaminant degradation when sediment, pore- water and organism are not at equilibrium.
Conclusions The present study demonstrated that solid phase microextraction with PDMS can measure freely dissolved porewater concentrations of PAHs and PCBs and that the porewater concentration can be correlated with bioavailability and bioaccumulation in a deposit-feeding oligochaete, Ilyodrilus templetoni. In the current study with equilibrium bioaccumulation in deposit feeding benthic organisms, the lipid-water partition coefficient was well approximated by the octanol-water partition coefficient. For other organisms that may not achieve equilibrium with sediments or in environments where the porewater may not be in equilibrium with solid and organism phases, this relationship may not be valid.

53
Comprehensive Bioaccumulation Experiments The relationships developed above were explored further in experiments with other sediments and other organisms including marine and freshwater sediments. These are described in more detail below.
Sediments New Bedford Harbor - batch one (estuarine sediment). Sediment from the subtidal zone of New Bedford Harbor, New Bedford, MA, was collected in the spring of 2001. The total PCB concentration was 124 mg/kg. The concentration of 16 EPA priority pollutant PAHs was 27 mg/kg.
New Bedford Harbor - batch two (estuarine sediment). Sediment from the subtidal zone of New Bedford Harbor, New Bedford, MA, was collected in the fall of 2008. The total PCB concentration was 137 mg/kg. The concentration of 16 EPA priority pollutant PAHs was 17 mg/kg. The total organic carbon content was 4.1%.
Elizabeth River (estuarine sediment). Sediment from the subtidal zone of the Elizabeth River was collected in the spring of 2003. The concentration of 16 EPA priority pollutant PAHs was 27 mg/kg. The TOC was 3.4 %. The sediment was predominantly sandy.
Sequim Bay (estuarine sediment) – batch one. Uncontaminated sediment from the subtidal zone of Sequim Bay, WA, was collected in the fall of 2006. The total PCB and 16 EPA priority pollutant PAHs concentration was below laboratory reporting limit. The total organic carbon content was 1.0 %.
Sequim Bay (estuarine sediment) – batch two. Uncontaminated sediment from the subtidal zone of Sequim Bay, WA, was collected in the spring of 2008. The total PCB and 16 EPA priority pollutant PAHs concentration was below laboratory reporting limit. The total organic carbon content was 2.2 %.
Browns Lake (freshwater sediment). Sediment from deep portion of the lake situated at the Waterways Experiment Station (Vicksburg., MS) was collected in the fall of 2006. The total PCB and 16 EPA priority pollutant PAHs concentration was below laboratory reporting limit. The TOC was 0.7 %.
Lake Pontchartrain (estuarine sediment). Uncontaminated sediment from Lake Pontchartrain, LA, was collected in the fall of 2007. The total PCB and 16 EPA priority pollutant PAHs concentration was below laboratory reporting limit. The total organic carbon content was 4.5%.

54
Experimental Organisms Leptocheirus plumulosus is a borrowing amphipod that lives in close physical contact with the sediment. It builds semi-permanent tubes and is capable of surface deposit feeding (by ingestion of sediment, detritus, phytodetritus, and benthic microalgae). Leptocheirus plumulosus is easily cultured in the laboratory and has been widely used in sediment toxicity assessments according to standard guidelines (U.S. EPA 199464, 200065). This amphipod species has also been used in sediment bioaccumulation assessment of PCBs (Millward et al. 200566) and methylmercury (Lawrence and Mason, 200167).
Neanthes arenaceodentata is an infaunal marine polychaete widely distributed throughout the world. Neanthes arenaceodentata occurs primarily in estuarine intertidal sand or muddy sand beaches. This species constructs nonpermanent mucoid tubes and deposit feeds on small particles including course sediment particles. Neanthes arenaceodentata has been widely used in sediment toxicity assessments according to standard guidelines (ASTM 200768) as well as sediment bioaccumulation studies (e.g. Lee and Lee 200569; Millward et al. 200566).
Nereis virens, a marine polychaete, constructs deep (8-10 cm), vertical, well-irrigated, semi-permanent burrows lined with mucus, and has been reported as an omnivorous feeder that also non-selectively deposit feeds. This polychaete has been widely used in sediment bioaccumulation assessments according to standard guidelines (ASTM 201070).
Macoma nasuta is a free-burrowing bivalve that deposit feeds by siphoning the top 1-2 millimeter layer of the sediment surface. Suspension feeder is considered a supplementary feeding mode for this organism (Hylleberg and Gallucci 1975 71 ). This clam has been widely used in sediment bioaccumulation assessments according to standard guidelines (ASTM 201070).
Lumbriculus variegatus is a freshwater infaunal oligochaete widely distributed in North America and Europe. These species burrow in the sediment, and ingest sediment particles below the sediment surface. Lumbriculus variegatus is the most widely experimental species used in standard freshwater bioaccumulation testing (U.S. EPA 200065; ASTM 201070).
All experimental organisms were obtained from stock cultures maintained at ERDC-Vicksburg, except for Macoma nasuta and Nereis virens, which was field collected and obtained from a commercial vendor (Aquatic Research Organisms, Inc; Hampton, NH).

55
Sediment Bioaccumulation Exposures New Bedford Harbor or Elizabeth River sediments were used to create a decreasing concentration series by serial dilution using Sequim Bay (marine) or Brown’s Lake (freshwater) sediments. Five sediment exposures using simultaneous beaker deployment of SPME and benthic organisms were conducted. New Bedford Harbor sediment exposures were conducted for 21 days (round 1) and 28 days (round 2). Elizabeth river sediment exposures were conducted for 21 days (round 1) and 14 days (round 2).
Marine and estuarine invertebrate sediment exposures were conducted in using conducted using reconstituted sea water (RSW) prepared using Crystal Sea (Marine Enterprises International, Essex, MD). Freshwater sediment exposures were conducted with dechlorinated tap water.
The ratio of total organic carbon in sediment to dry weight of experimental animals was higher than 50:1 to minimize the depletion of sediment contaminants and to ensure an adequate food supply to infaunal experimental organisms.
Porewater Concentration Measurements Assessment of uptake to PDMS was conducted using the methods described by Conder and La Point (2005)50. SPME fiber consisting of a glass core (110 µm diameter) with a 30 µm thick PDMS coating (fiber 170/110) was purchased in bulk from Poly Micro Industries (Phoenix, AZ) and used in the first round of exposure. SPME fiber from Fiberguide (10 µm layer on 210 µm glass core- fiber 230/210) was used in the second round of exposures. The fiber was cut into 2.5-cm pieces using a double-bladed, stainless-steel razor blade apparatus. The SPME fiber was uniformly coated with 0.136 µL of PDMS per cm. Each fiber was inserted halfway through pierced, stapled, Teflon-coated silicone disks (septa for glass vials; diameter, 10 mm; thickness, 1 mm). The fibers (in disk holders) were rinsed with hexane, then with ultrapure water, and allowed to dry at room temperature. The Teflon-disk holder was designed to maximize fiber exposure to sediment while facilitating fiber handling and minimizing breaking and loss during deployment and retrieval. For each beaker, one 2.5-cm fiber segment was placed approximately halfway in the sediment column while the sediment was added to the beakers. Retrieval of fiber from sediment occurred simultaneously with retrieval of organisms.
The retrieved fiber was extracted and analyzed using the methods of Lu et al. 201117. The concentrations in the extract were analyzed by the US Army Corps of Engineers Engineer Research and Development Center chemical laboratory. Raw measurements were corrected for unsteady uptake in these static exposure experiments using the diffusive uptake model in Lu et al. (Table 4-14). The techniques for evaluating fiber uptake kinetics (PRCs, time series sampling or differential uptake on different size fibers) described previously were not used to estimate transient uptake. The long exposure times during the experiment were initially assumed to lead to steady state uptake. As noted in Table 4-14, the PAH accumulation on the fiber in the Elizabeth River sediment exposures are largely at equilibrium except for the 5 ring and higher PAHs. PCB accumulation on the fibers in the New Bedford Harbor sediment exposures, however, were substantially different from equilibrium. Consistent with the predictions of Lu et al.17, the deviations from equilibrium are expected to be subject to a maximum uncertainty of approximately a factor of ±50% when the fractional approach to equilibrium is of the order of 0.50, a factor of 2 when the fractional approach to equilibrium is of the order of 0.25 and a factor of 4 when the fraction approach to equilibrium is of the order of 0.05. Actual errors are expected to be less than these uncertainty estimates.

56
Table 4-14 Summary of corrections for transient uptake on the PDMS fibers for selected compounds. Shown as fraction of steady state uptake. Steady state uptake is estimated by dividing measured fiber uptake by the indicated fractions. Note that these are specific to the sediments, exposure scenario and fibers shown in the two tests
Compound
PCB Congener
NBH -1
21 days
170/110
NBH-2
28 days
230/210
Compound
PAH
ER-1
21 days
170/110
ER-2
14 days
230/210
18 0.96 0.95 Naphthalene 0.99 1.00
27/24 0.68 0.87 Anthracene 0.82 0.99
31 0.52 0.75 Phenanthrene 0.98 0.99
52 0.37 0.60 Pyrene 0.84 0.95
70 0.21 0.38 Fluoranthene 0.82 0.95
90/101 0.14 0.26 Benzo[b]fluoranthene ND 0.69
118 0.06 0.11 Benzo[a]pyrene ND 0.535
PCB Bioavailability Experiment 1 Methods Treatments New Bedford Harbor sediment - batch one and Sequim Bay sediment – batch one were mixed to create a decreasing concentration series. The desired ratio of New Bedford Harbor sediment and diluent sediment was determined on a dry weight basis. The sediments were homogenized using an impeller mixer to visual homogeneity for approximately two hours. Four dilution treatments (25%, 12%, 6%, and 3% New Bedford Harbor sediment by dry weight) were created. The dilution series sediments were stored at room temperature for four weeks. Diluent sediment was used as a positive control for evaluating the effect of diluted contaminated sediments on benthic invertebrate survival and biomass at termination the exposure period.
Exposure Design Lumbriculus variegatus (fifteen mixed aged individuals, approximately 6 mg each), Leptocheirus plumulosus (twenty sub-adults or adult individuals, approximately 2 mg each) or Neanthes arenaceodentata (two sexually mature 90-day-old males weighing approximately 15 to 30 mg) were placed in 600 mL beakers containing 200 g (wet wt.) of sediment and approximately 300 mL of overlying water (reconstituted freshwater or dechlorinated tap water for and Lumbriculus variegatus and artificial sea water for N. arenaceodentata and Leptocheirus plumulosus).
Sediment exposures, initiated in September of 2007, were 21-day long. The tissue concentration of hydrophobic organic compounds was expected to attain steady-state levels in the experimental organisms according to previous research (Lotufo, unpublished data). Overlying water was aerated gently. Two-thirds of the overlying water in the chambers was changed three times a week. Experimental chambers did not receive external food source during the exposure to maximize the exposure of experimental animals to the contaminated sediment. Experimental

57
conditions are summarized in Table 1. The organisms were removed at experiment termination by sieving the sediment through a 0.5 mm sieve and placed in clean water to depurate their gut contents. To minimize excessive depuration chemicals from tissues, the sediment purging period of 6 h recommended by Mount et al. (1999)72 for Lumbriculus variegatus was employed for all experimental organisms. Survivors were enumerated and weighed. Organisms from each replicate were frozen. Control replicate organisms were analyzed for total lipid content, and treatment replicate organisms were analyzed for PCB congeners.
Results PCBs in sediment The exposure conditions in the dilution series sediments are presented in Table 4-15. For each contaminated sediment treatment, total organic carbon content and the organic carbon normalized sum concentration of individual congeners is also presented in Table 4-16. The sum PCB concentration decreased stepwise with increasing dilution. The TOC concentration of the highest treatment was higher than was expected based on the TOC of the two sediments used to obtain this mixture. Despite the effort to obtain a homogeneous sediment mixture, it is possible that the subsample used for analysis was not representative of the sediment TOC. Table 4-15 Exposure conditions for Leptocheirus plumulosus, Neanthes arenaceodentata, and Lumbriculus variegatus exposed to New Bedford Harbor (batch one) dilution series sediment treatments.
Table 4-16 Total organic carbon (TOC) and total PCB congener concentration in New Bedford Harbor (batch one) dilution series sediment treatments
Parameter Condition Exposure vessel 0.6-L beaker
Replicates per treatment 5
Organisms per replicate 20 Leptocheirus plumulosus or 2 Neanthes arenaceodentata or
8 Lumbriculus variegatus
Salinity 20 ppt for Leptocheirus plumulosus
30 ppt for Neanthes arenaceodentata 0 for Lumbriculus variegatus
Sediment volume 0.2 L Temperature 23°C Light cycle 16:8 L:D
Water renewal 3 x / week Feeding None Aeration Trickle flow

58
For the 6% marine sediment treatment, the relative contribution of individual congener to the PCB sum concentration is presented in Figure 4-8 and the relative contribution of the sum concentration of homologue groups is presented in Figure 4-9. A similar pattern was observed for the other marine and freshwater sediments. Trichloro-, tetrachloro- and pentachorobiphenyl homologues contributed the most to the total PCB concentration in the sediments.
Figure 4-8 Relative concentration of individual congeners in the 6% New Bedford Harbor (batch one) dilution series sediment treatment. Total concentration 25.83 mg/kg PCBs
Figure 4-9 Relative concentration of PCB homologue groups in the 6% New Bedford Harbor (batch one) dilution series sediment treatment.
Treatment (% New Bedford Harbor by wt.)
TOC (%)
Sum congener Concentration
(mg/kg)
Sum congener Concentration (mg/kg OC)
3% - marine 0.9 14.0 1733 6% - marine 0.8 25.8 3189
12% - marine 0.9 42.1 4673 25% - marine 1.6 82.3 5310
3% - freshwater 0.9 10.6 1133 6% - freshwater 0.8 20.5 2473
12% - freshwater 1.1 41.2 3747 25% - freshwater 1.5 73.1 4905

59
Benthic invertebrate survival and biomass Invertebrate survival and biomass at exposure termination are presented in Table 4-17. Survival and biomass in control sediment were adequate, especially considering that Leptocheirus plumulosus and N. arenaceodentata were not fed during these experiments. Although these organisms are fed when used in standard sediment toxicity tests (ASTM 2007; 2008), they were not fed during this experiment following ASTM (2010) recommendations for conducting standard sediment bioaccumulation tests. According to the latter guideline, by ingesting added food, the organisms presumably ingest less sediment, resulting in less uptake of the sediment-associated contaminants. Supplemental food is also expected to enhance the rate of loss by passing uncontaminated material though the intestinal tract. The 25% treatment adversely impacted all invertebrate species but only Leptocheirus plumulosus was significantly impacted by the lower concentrations. Table 4-17 Mean percent survival and replicate biomass at termination of the Leptocheirus plumulosus, N. arenaceodentata and Lumbriculus variegatus exposure to New Bedford Harbor (batch one) dilution series sediment treatments.
Bioaccumulation and BSAF Despite the low biomass of tissue samples analyzed for PCB congener concentration, adequate tissue concentration data was obtained for all treatments for all species investigated. Mean lipid content of control-sediment exposed organisms was 1.7 ± 0.4% for Leptocheirus plumulosus, 1.7 ± 0.5% for N. arenaceodentata, and 3.5± 0.8% for Lumbriculus variegatus.
The lipid normalized bioaccumulation measures were first compared to biota–sediment accumulation factors (BSAFs). BSAFs were measured using body residues and sediment concentrations as:
BSAF = Lipid-normalized body residue / organic-carbon normalized sediment concentration
Treatment Survival (%) Final replicate biomass (mg)
Mean Std Mean Std Leptocheirus plumulosus
Control 81.3 4.9 39.0 7.8 3 % 59.0 5.7 28.3 9.2 6 % 43.7 10.0 21.0 15.9 12 % 9.7 3.2 4.6 5.1 25 % 0.0 0.0 0.0 0.0
Neanthes arenaceodentata Control 89.8 0.4 87.8 44.0
3 % 79.8 0.6 49.6 27.3 6 % 88.6 0.5 63.0 21.9 12 % 73.3 0.8 60.6 48.1 25 % 51.5 0.6 31.0 19.4
Lumbriculus variegatus Control ND ND 51.3 8.5
3 % ND ND 42.1 5.9 6 % ND ND 33.8 6.7 12 % ND ND 41.9 5.6 25 % ND ND 17.6 14.8
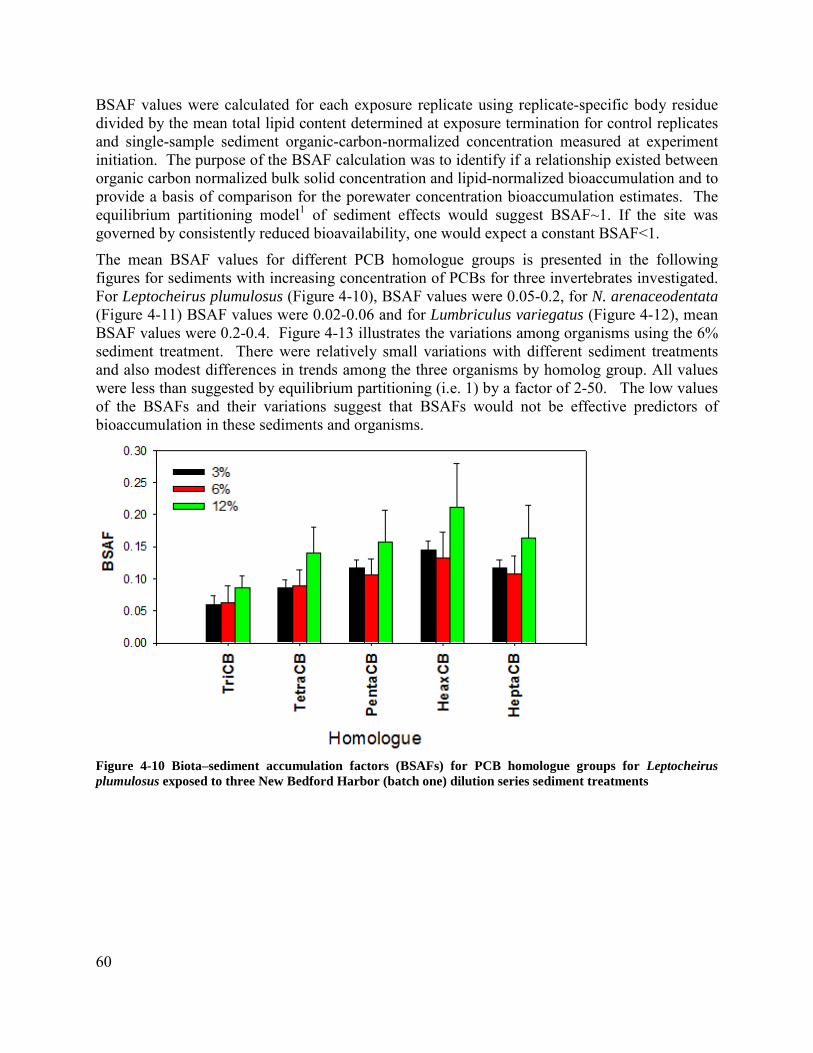
60
BSAF values were calculated for each exposure replicate using replicate-specific body residue divided by the mean total lipid content determined at exposure termination for control replicates and single-sample sediment organic-carbon-normalized concentration measured at experiment initiation. The purpose of the BSAF calculation was to identify if a relationship existed between organic carbon normalized bulk solid concentration and lipid-normalized bioaccumulation and to provide a basis of comparison for the porewater concentration bioaccumulation estimates. The equilibrium partitioning model1 of sediment effects would suggest BSAF~1. If the site was governed by consistently reduced bioavailability, one would expect a constant BSAF<1.
The mean BSAF values for different PCB homologue groups is presented in the following figures for sediments with increasing concentration of PCBs for three invertebrates investigated. For Leptocheirus plumulosus (Figure 4-10), BSAF values were 0.05-0.2, for N. arenaceodentata (Figure 4-11) BSAF values were 0.02-0.06 and for Lumbriculus variegatus (Figure 4-12), mean BSAF values were 0.2-0.4. Figure 4-13 illustrates the variations among organisms using the 6% sediment treatment. There were relatively small variations with different sediment treatments and also modest differences in trends among the three organisms by homolog group. All values were less than suggested by equilibrium partitioning (i.e. 1) by a factor of 2-50. The low values of the BSAFs and their variations suggest that BSAFs would not be effective predictors of bioaccumulation in these sediments and organisms.
Figure 4-10 Biota–sediment accumulation factors (BSAFs) for PCB homologue groups for Leptocheirus plumulosus exposed to three New Bedford Harbor (batch one) dilution series sediment treatments

61
Figure 4-11 Biota–sediment accumulation factors (BSAFs) for PCB homologue groups for Neanthes arenaceodentata exposed to three New Bedford Harbor (batch one) dilution series sediment treatment
Figure 4-12 Biota–sediment accumulation factors (BSAFs) for PCB homologue groups for Lumbriculus variegatus exposed to three New Bedford Harbor (batch one) dilution series sediment treatments.

62
Figure 4-13 Biota–sediment accumulation factors (BSAFs) for PCB homologue groups for Leptocheirus plumulosus, Neanthes arenaceodentata, and Lumbriculus variegatus exposed to the 6% New Bedford Harbor (batch one) dilution series sediment treatment.
PDMS-measured Porewater Concentrations The porewater concentrations in Leptocheirus plumulosus and N. arenaceodentata exposure beakers are illustrated in Figure 4-14. The purpose of this figure is to identify if there were significant differences in organism exposures so the porewater concentration was normalized to the individual congener concentrations in the Leptocheirus plumulosus beakers. Overall, the porewater concentrations between the two organism exposures were similar, but with concentrations in the Leptocheirus plumulosus microcosms being somewhat higher in the 6% and 12% treatments.

63
. Figure 4-14 Predicted porewater concentrations determined at exposure termination in New Bedford Harbor (batch one) dilution series sediment treatments in Leptocheirus plumulosus and Neanthes arenaceodentata beakers for PCB congeners. To simplify comparison between independently estimated values, porewater concentrations in the Leptocheirus plumulosus were arbitrarily assigned the value of 1. Error bars represents standard error based upon replicate variability.
PW-predicted vs. Measured Body Residues The measured PCB concentrations, corrected for unsteady state uptake onto the PDMS, were used to predict lipid normalized body residues using Kow as the bioconcentration factor (BCF) (i.e. use of Equation 5). All predicted PDMS-predicted body residues were similar in magnitude to observed body residues. This was previously shown in Table 2-3 in which the average BCF for this experiment was 0.84-1.66 Kow, depending upon organism.
A more rigorous comparison of PDMS-predicted and observed bioaccumulation was conducted by using linear regression for PCB homologue groups. Equation (5) would suggest that predicted (KowCpw) vs measured (lipid normalized) bioaccumulation should correlate with a straight line of unit slope. For Leptocheirus plumulosus, high r2 across homologue groups (Figure 4-15) and for sum PCB congener concentration (Figure 4-16) demonstrate that porewater concentrations are highly correlated with body residue. Contrasting to the high predictability of

64
porewater PCB concentration observed for Leptocheirus plumulosus, weaker relationship between predicted and measured body residues were observed for N. arenaceodentata (Figure 4-17, Figure 4-18), for which increasing porewater PCB concentration failed to result in corresponding increase in lipid-normalized body residues. Weak relationships between predicted and measured body residue was also observed from Lumbriculus variegatus (Figure 4-19, Figure 4-20).
Figure 4-15 Relationship between experimentally measured lipid-normalized body residue and predicted residues in Leptocheirus plumulosus exposed to New Bedford Harbor (batch one) dilution series sediment treatments for four PCB homologue groups.
Figure 4-16 Relationship between experimentally measured lipid-normalized body residue and predicted residues in Leptocheirus plumulosus exposed to New Bedford Harbor (batch one) dilution series sediment treatments for sum PCB residues.

65
Figure 4-17 Relationship between experimentally measured lipid-normalized body residue and predicted residues in Neanthes arenaceodentata exposed to New Bedford Harbor (batch one) dilution series sediment treatments for four PCB homologue groups
Figure 4-18 Relationship between experimentally measured lipid-normalized body residue and predicted residues in Neanthes arenaceodentata exposed to New Bedford Harbor (batch one) dilution series sediment treatments for sum PCB residues

66
Figure 4-19. Relationship between experimentally measured lipid-normalized body residue and predicted residues in Lumbriculus variegatus exposed to New Bedford Harbor (batch one) dilution series sediment treatments for four PCB homologue groups
Figure 4-20 Relationship between experimentally measured lipid-normalized body residue and predicted residues in Lumbriculus variegatus exposed to New Bedford Harbor (batch one) dilution series sediment treatments for sum PCB residues.

67
Note that even if there is a weak correlation between predicted and observed body residues, the magnitude of the observed body residues were generally predicted within a factor of two for all organisms and treatments. The weaker linear correlations for N. arenaceodentata and Lumbriculus variegatus may be due to the limited range of observed concentrations in any single comparison, analytical variability, or the accuracy of the estimated fractional approach to steady state.
Figure 4-21 compares the ratio of measured to predicted body residues for Leptocheirus plumulosus to N. arenaceodentata by homologue group for the 3% sediment treatment. No significant trends or deviation from a ratio of approximately unity were noted for these two organisms. Other sediment treatments were similar. For Lumbriculus variegatus, however, the ratio of measured to predicted body residue ranged between 1 and 2 across homologue groups, except for hexachlorobiphenyl (PCB 149), for which the measured concentration was much lower than the predicted concentration (Figure 4-22 for the 3% sediment treatment). Note that estimates of the fractional approach to steady state for these high molecular weight PCBs is subject to the largest uncertainty. It may also be that the organism had not achieved steady state bioaccumulation of this hydrophobic PCB. Note also that the ratio of observed to predicted body residue by homologue varies in the range of 1-2, much closer than 2-50 times difference in predictions based upon bulk solid phase concentrations assuming BSAF=1.
Figure 4-21 Mean ratio of experimentally measured lipid-normalized body residue and predicted residues in Leptocheirus plumulosus and Neanthes arenaceodentata exposed to 3% New Bedford Harbor (batch one) dilution series sediment treatments for four PCB homologue groups

68
Figure 4-22 Mean ratio of experimentally measured lipid-normalized body residue to predicted residues in Lumbriculus variegatus in New Bedford Harbor (batch one) dilution series sediment treatments for five PCB homologue groups.
Comparison of measured to porewater-predicted bioaccumulation is somewhat more variable on a congener by congener basis, perhaps due to congener misidentification, analytical variability or possibly true differences between congeners. Figure 4-23 shows this variation to be a factor of 0.5-5 for the 3% sediment treatment.
Figure 4-23 Ratio of measured to predicted PCB congener bioconcentration factors (BCFs) for Leptocheirus plumulosus, Neanthes arenaceodentata, and Lumbriculus variegatus exposed to the 3% New Bedford Harbor (batch one) dilution series sediment treatment.

69
PCB Bioavailability Experiment 2 Methods New Bedford Harbor sediment - batch two and Lake Pontchartrain sediment were mixed to create a decreasing concentration series. The desired ratio of New Bedford Harbor sediment and diluent sediment was determined on a dry weight basis. The sediments were homogenized using an impeller mixer to visual homogeneity for approximately two hours. Three dilution treatments (12%, 6%, and 3% New Bedford Harbor sediment by dry weight) were created. The dilution series sediments were stored at room temperature for four weeks. Diluent sediment was used as a positive control for evaluating the effect of diluted contaminated sediments on benthic invertebrate survival and biomass at termination the exposure period.
Exposure Design Leptocheirus plumulosus (fifty sub-adults or adult individuals, approximately 2 mg each) were placed in 1-L beakers containing a 3-cm thick layer of sediment and approximately 700 mL of overlying water. Macoma nasuta (two clams, approximately 1-2 g each) were placed in 2-L beakers containing a 5-cm thick layer of sediment and 1400 mL of overlying water. Sediment exposures, initiated in August 2007, were 28-day long. Overlying water was aerated gently. Two-thirds of the overlying water in the chambers was changed once weekly for Leptocheirus plumulosus and three times a week for N. nasuta. Leptocheirus plumulosus beakers received food as 20 mg of ground Tetramin per beaker twice weekly. Feeding was necessary to ensure adequate amphipod survival during the 4-week exposure period. Macoma nasuta did not receive any external food source to maximize the exposure of experimental animals to the contaminated sediment.
Experimental conditions are summarized in Table 4-18. Amphipods were removed at experiment termination by sieving the sediment through a 0.5 mm sieve and placed in clean water to depurate their gut contents. To minimize excessive depuration chemicals from tissues, the sediment purging period of 6 h recommended by Mount et al. (1999)72 was employed. Clams were removed from the sediment and their tissues separated from the shells. To remove ingested sediment, the gut was dissected with a scalpel, and contents were rinsed away using water prior to weigh determination and storage in freezer for later analysis. Control replicate organisms were analyzed for total lipid content, and treatment replicate organisms were analyzed for PCB congeners.

70
Table 4-18 Exposure conditions for Leptocheirus plumulosus and Macoma nasuta exposed to New Bedford Harbor (batch two) dilution series sediment treatments.
SPME fiber consisting of a glass core (230 µm diameter) with a 10 µm thick PDMS coating was purchased in bulk from Fiberguide Industries (Model SPC210/230R). The fiber was cut into 2.5-cm pieces using a double-bladed, stainless-steel razor blade apparatus. The SPME fiber was uniformly coated with 0.0691 µL of PDMS per cm. One fiber segment was placed in a 5 cm by 4 cm 100-µm stainless steel mesh (Model 165 Mesh T316 Stainless from TWP Inc.) envelope for each exposure beaker. The use of a mesh envelope provides a means to safely handle the fragile fibers when deploying into and retrieving from sediment. The 100-µm openings in the stainless mesh are large enough to allow free passage of porewater and fine sediment particles for intimate contact with the fiber but are small enough to retain the small diameter fibers. To secure fibers in the envelope, the edges of the stainless steel mesh are folded and firmly pressed on all edges. The fibers (housed in the envelopes) were rinsed with hexane, then with ultrapure water, and allowed to dry at room temperature. Mesh envelopes containing SPME fibers were inserted into the sediment by carefully pushing the envelope into the sediment until complete burial was achieved. SPME fibers were employed only in Leptocheirus plumulosus exposures beakers only. Retrieval of fiber from sediment occurred simultaneously with retrieval of organisms. PDMS-predicted porewater concentration data for Leptocheirus plumulosus was used as best estimates for Macoma nasuta exposures.
Results PCBs in sediment The concentration of total PCBs in the dilution series sediments, calculated as the sum concentration of individual congeners is presented in Table 4-19. For each contaminated sediment treatment, total organic carbon content and the organic carbon normalized sum concentration of individual congeners is also presented. The sum PCB concentration decreased stepwise with increasing dilution, approximately as predicted by the nominal dilutions.
Parameter Condition
Exposure vessel 1-L beaker Leptocheirus plumulosus 2-L beaker for Macoma nasuta
Replicates per treatment 4 for Leptocheirus plumulosus 2 for Macoma nasuta
Organisms per replicate 50 Leptocheirus plumulosus or 2 Macoma nasuta
Salinity 20 ppt for Leptocheirus plumulosus 30 ppt for Macoma nasuta
Sediment thickness 3 cm for Leptocheirus plumulosus 5 cm for Macoma nasuta
Temperature 23°C for Leptocheirus plumulosus 15°C for Macoma nasuta
Light cycle 16:8 L:D
Water renewal Once weekly for Leptocheirus plumulosus 3 x / week for Macoma nasuta
Feeding 20 mg/chamber twice weekly for Leptocheirus plumulosus None for Macoma nasuta
Aeration Trickle flow

71
Table 4-19. Total organic carbon (TOC) and total PCB congener concentration in New Bedford Harbor (batch two) dilution series sediment treatments
For the 6% marine sediment treatment, the relative contribution of individual congener to the PCB sum concentration is presented in Figure 4-24 and the relative contribution of the sum concentration of homologue groups is presented in Figure 4-25. Trichloro-, tetrachloro- and pentachorobiphenyl homologues contributed the most to the total PCB concentration in the sediments. A similar pattern was observed for the other dilution treatments.
Figure 4-24 Relative concentration of individual PCB congeners in the 6% New Bedford Harbor (batch two) dilution series sediment treatment. Total Concentration 18.51 mg/kg
Figure 4-25 Relative concentration of PCB homologue groups in the 6% New Bedford Harbor (batch two) dilution series sediment treatment.
Benthic invertebrate survival and biomass Invertebrate survival and biomass at exposure termination are presented in Table 4-20. For Leptocheirus plumulosus mean control survival was high. Biomass in the control and NBH
Treatment (% New Bedford Harbor by wt.)
TOC (%)
Total congeners (mg/kg)
Total congeners (mg/kg OC)
3% 2.9 7.0 247 6% 3.4 18.8 553
12% 3.4 46.8 1373

72
treatments were also higher relative to observed in the PCB Experiment 1, even taking into account the higher number of amphipods added to each replicate. This increase is a result of supplemental food, which was added in this experiment but not in the previous one. Full survival was observed in all treatments for Macoma nasuta, except for 12% NBH, which also adversely impacted Leptocheirus plumulosus survival as well. Final soft tissue weights of Macoma nasuta were not recorded at exposure termination. Table 4-20 Mean percent survival and replicate amphipod biomass at termination of the Leptocheirus plumulosus and Macoma nasuta exposure to New Bedford Harbor (batch two) dilution series sediment treatments.
Bioaccumulation and BSAF Adequate tissue concentration data was obtained for all treatments for both species investigated. Mean lipid content of control-sediment exposed organisms was 1.8 ± 0.1% for Leptocheirus plumulosus, 1.1 ± 0.1% for Macoma nasuta.
BSAF values were calculated for each exposure replicate using replicate-specific body residue divided by the mean total lipid content determined at exposure termination for control replicates and single-sample sediment organic-carbon-normalized concentration measured at experiment initiation.
The mean BSAF values for different PCB homologue groups are presented in Figure 4-26 and Figure 4-27. For Leptocheirus plumulosus (Figure 4-26), BSAFs were considerably different than in the first experiment with values generally exceeding unity, or as much as approximately 15-20 times larger than during the first experiment. The values increased with increasing chlorination (and hence hydrophobicity). For Macoma nasuta (Figure 4-27), mean BSAFs were overall similar across homologue groups for all treatments, with a trend for lower values for higher chlorinated groups, therefore contrasting with the trend observed for Leptocheirus plumulosus. Except for trichlorobiphenyls, mean BSAF values were higher for Leptocheirus plumulosus than for Macoma nasuta (Figure 4-28), with the magnitude of difference increasing with chlorination level.
Treatment Survival (%) Final replicate biomass (mg)
Mean Std Mean Std Leptocheirus plumulosus
Control 89.5 4.4 184 14 3 % 75 20.8 161 56 6 % 82.5 6.6 153 14 12 % 64.5 7.7 118 23
Macoma nasuta Control 100 0 ND ND
3 % 100 0 ND ND 6 % 100 0 ND ND 12 % 87.5 25.0 ND ND

73
Figure 4-26 Biota–sediment accumulation factors (BSAFs) for PCB homologue groups for Leptocheirus plumulosus exposed to three New Bedford Harbor (batch two) dilution series sediment treatments
Figure 4-27 Mean biota–sediment accumulation factors (BSAFs) for PCB homologue groups for Macoma nasuta exposed New Bedford Harbor (batch two) dilution series sediment treatments.

74
Figure 4-28 Mean biota–sediment accumulation factors (BSAFs) for PCB homologue groups for Macoma nasuta exposed to the 3% New Bedford Harbor (batch two) dilution series sediment treatment.
PW-predicted vs. Measured Body Residues As in the first experiment, the magnitude of the measured body residues were well-predicted by the porewater concentration with a BCF given by Kow (Equation 5). The average BCF was 1.18-1.45 Kow, with the higher average associated with Leptocheirus plumulosus. Thus while the ratio of sediment concentrations to body residue (i.e. BSAFs) was much different between the two tests, the average BCF based upon porewater concentration for Leptocheirus plumulosus varied only from 1.27 to 1.45.
The relationship between PDMS-estimated PCB concentration in lipids and lipid-normalized body residue for Leptocheirus plumulosus and Macoma nasuta was also examined using linear regression for PCB homologue groups. For Leptocheirus plumulosus, moderately high r2 (0.34 to 0.54) across homologue groups (Figure 4-29) and for sum PCB congener concentration (Figure 4-30) demonstrate that porewater concentrations are adequately predictive of body residue. Better correlations (r2 values 0.81 to 0.97) were determined for sum PCB homologue groups and sum PCB congeners for Macoma nasuta (Figure 4-31, Figure 4-32).

75
Figure 4-29 Relationship between experimentally measured lipid-normalized body residue and predicted residues in Leptocheirus plumulosus exposed to New Bedford Harbor (batch two) dilution series sediment treatments for four PCB homologue groups.
Figure 4-30 Relationship between experimentally measured lipid-normalized body residue and predicted residues in Leptocheirus plumulosus exposed to New Bedford Harbor (batch one) dilution series sediment treatments for sum PCB residues.

76
Figure 4-31 Relationship between experimentally measured lipid-normalized body residue and predicted residues in Macoma nasuta exposed to New Bedford Harbor (batch two) dilution series sediment treatments for four PCB homologue groups.
Figure 4-32 Relationship between experimentally measured lipid-normalized body residue and predicted residues in Macoma nasuta exposed to New Bedford Harbor (batch one) dilution series sediment treatments for sum PCB residues.

77
For Leptocheirus plumulosus exposed to 3% NBH treatment, the ratio of measured and predicted lipid normalized body residue ranged from 0.8 to 1.8 across homologue groups. For Macoma nasuta, the ratio of measured and predicted lipid normalized body residue was approximately 2 for trichlorobiphenyls and approximately unity for all higher molecular weight PCB congeners. This is illustrated on an individual congener basis in Figure 4-33 for the 3% sediment exposure treatment. No significant variations were noted in other treatments. Figure 4-33 Ratio of measured to predicted PCB congener bioconcentration factors (BCFs) for Leptocheirus plumulosus and Macoma nasuta exposed to the 3% New Bedford Harbor (batch two) dilution series sediment treatment.
Figure 4-33 Ratio of measured to predicted PCB congener bioconcentration factors (BCFs) for Leptocheirus plumulosus and Macoma nasuta exposed to the 3% New Bedford Harbor (batch two) dilution series sediment treatment. Predicted BCF is 1*Kow.
PAH Bioavailability Experiment 1 Methods Elizabeth River sediment - batch two and Sequim Bay sediment- batch 1 were mixed to create a decreasing concentration series. The desired ratio of Elizabeth River sediment and diluent sediment was determined on a dry weight basis. The sediments were homogenized using an impeller mixer to visual homogeneity for approximately two hours. Three dilution treatments (12%, 6%, and 3% Elizabeth River sediment by dry weight) were created. The dilution series sediments were stored at room temperature for four weeks. Diluent sediment was used as a positive control for evaluating the effects of diluted contaminated sediments on benthic invertebrate survival and biomass at termination the exposure period.
Exposure Design Leptocheirus plumulosus (fifty sub-adults or adult individuals, approximately 2 mg each) or Neanthes arenaceodentata (fifteen immature worms, approximately 6 mg each) were placed in 1-L beakers containing a 3-cm thick layer of sediment and 700 mL of overlying water.

78
Sediment exposures, initiated in May 2007, were 21-d long. Experimental conditions are summarized in Table 4-21. Overlying water was aerated gently. The overlying water in the chambers was not changed and the experimental organisms were not fed to maximize exposure to the contaminated sediment. Amphipods and polychaetes were removed at experiment termination by sieving the sediment through a 0.5 mm sieve and placed in clean water to depurate their gut contents. To minimize excessive depuration chemicals from tissues, the sediment purging period of 6 h recommended by Mount et al. (1999)72 was employed. Assessment of uptake to PDMS was conducted using the methods described in the PCB Bioavailability Experiment 1. Table 4-21 Exposure conditions for Leptocheirus plumulosus and Neanthes arenaceodentata exposed to Elizabeth River (batch one) dilution series sediment treatments
Results PAHs in sediment The concentration of sum PAHs in the dilution series sediments, calculated as the sum concentration of individual congeners is presented in 4-22. For each contaminated sediment treatment, total organic carbon content and the organic carbon normalized sum concentration of individual PAHs is also presented in the Table. The sum PAH concentration decreased stepwise with increasing dilution, with the difference in concentration between the 2% and 3% treatments much smaller than predicted, likely due to error in apportioning both sediments to create the 3% treatment. The concentration of individual PAHs in the sediment is presented in Table 4-23. Compounds detected at the highest concentrations are anthracene, phenanthrene, pyrene and fluoranthene.
Parameter Condition Exposure vessel 1-L beaker
Replicates per treatment 4 for Leptocheirus plumulosus 4 for Neanthes arenaceodentata
Organisms per replicate 50 Leptocheirus plumulosus or 15 Neanthes arenaceodentata
Salinity 20 ppt for Leptocheirus plumulosus 30 ppt for Neanthes arenaceodentata
Sediment thickness 3 cm for Leptocheirus plumulosus 3 cm for Neanthes arenaceodentata
Temperature 23°C for Leptocheirus plumulosus 23°C for Neanthes arenaceodentata
Light cycle 16:8 L:D
Water renewal 3 x / week for Leptocheirus plumulosus 3 x / week for Neanthes arenaceodentata
Feeding None for Leptocheirus plumulosus None for Neanthes arenaceodentata
Aeration Trickle flow

79
Table 4-22 Total organic carbon (TOC) and total PAH congener concentration in Elizabeth River (batch one) dilution series sediment treatments.
Table 4-23 Concentration of PAH compounds in Elizabeth River (batch one) dilution series sediment treatments.
Benthic invertebrate survival and biomass Invertebrate survival and biomass at exposure termination are presented in Table 4-24. For Leptocheirus plumulosus mean survival in the control and ER treatments was low and was attributed to lack of supplemental feeding during the 28 exposure. Survival of Neanthes arenaceodentata was not assessed. However, comparison of biomass between and ER treatments reveal suggest that toxicity as decreased mortality and growth relative to the control was not observed.
Treatment (% Elizabeth River Sediment by wt.)
TOC (%)
Total congeners (mg/kg)
Total congeners (mg/kg OC)
0.5% 0.8 3.6 450 1% 0.7 8.6 1229 2% 0.7 14.2 2029 3% 0.7 14.4 2057 5% 0.7 25.5 3643
PAH logK ow Treatment (% Elizabeth River) 0.5% 1% 2% 3% 5% Concentration (mg/kg)
Naphthalene 3.4 0.53 0.73 1.74 1.81 3.31 Acenaphthene 3.9 0.22 0.31 0.81 0.88 1.72
Acenaphthylene 4.0 0.00 0.01 0.01 0.01 0.02 Fluorene 4.2 0.16 0.25 0.62 0.68 1.23
Anthracene 4.5 0.41 3.33 1.96 1.40 1.92 Phenanthrene 4.6 0.59 0.93 2.11 2.34 4.13
Pyrene 5.2 0.51 0.82 1.91 1.97 3.69 Fluoranthene 5.2 0.66 1.18 2.68 2.98 4.96
Benzo[b]fluoranthene 5.8 0.08 0.13 0.35 0.31 0.60 Chrysene 5.9 0.13 0.34 0.56 0.63 1.16
Benzo[a]anthracene 5.9 0.11 0.24 0.54 0.59 1.13 Benzo [k]fluoranthene 6.0 0.08 0.15 0.34 0.31 0.62
Benzo[a]pyrene 6.0 0.05 0.11 0.29 0.27 0.54 Benzo[g,h,i]perylene 6.5 0.03 0.05 0.12 0.10 0.20
Indeno[1,2,3 - cd]pyrene 6.5 0.03 0.05 0.15 0.12 0.26
Dibenz[a,h]anthracene 6.8 0.01 0.01 0.03 0.02 0.04

80
Table 4-24 Mean percent survival and replicate biomass at termination of the Leptocheirus plumulosus and Neanthes arenaceodentata exposure to Elizabeth River (batch one) dilution series sediment treatments.
Bioaccumulation and BSAF Despite the low biomass of tissue samples analyzed for PAH compounds concentration, adequate body burden data was obtained for at least two compounds for all treatments. Measured lipid content results of control-sediment exposed organisms were unreliable. Therefore, the mean value of 1.7% obtained for both Leptocheirus plumulosus and N. arenaceodentata in the PCB Bioavailability Experiment 1 were used as best estimates for calculating of lipid-normalized body residues for this experiment. Bioavailability of PAH compounds detected both in the invertebrates and sediment were measured by calculating BSAF values as described above.
The individual replicate BSAF values of PAH compounds measured in both tissue and sediment are presented in Table 4-25 for Leptocheirus plumulosus and in Table 4-26 for N. arenaceodentata. Values were relatively low, likely due low bioavailability, potential transformation by the organisms, or both. For BSAF comparison between species, mean BSAF values for three PAH compounds across all treatments are depicted in Figure 4-34. Mean BASF values for pyrene and fluoranthene were higher for N. arenaceodentata.
Treatment Survival (%) Final replicate biomass (mg)
Mean Std Mean Std Leptocheirus plumulosus
Control 31.5 11.0 57.3 21.6 0.5% 38.0 8.5 72.4 17.5 1% 19.5 10.6 42.3 26.9 2% 25.5 6.6 72.3 12.5 3% 32.7 6.4 65.0 29.4 5% 40.0 8.2 75.5 19.3
Neanthes arenaceodentata Control ND ND 57.3 21.6 0.5% ND ND 72.4 17.5 1% ND ND 42.3 26.9 2% ND ND 72.3 12.5 3% ND ND 65.0 29.4 5% ND ND 75.5 19.3

81
Table 4-25 Biota–sediment accumulation factors (BSAFs) for PAH compounds for individual replicate Leptocheirus plumulosus exposed to Elizabeth River (batch one) dilution series sediment treatments.
Table 4-26 Biota–sediment accumulation factors (BSAFs) for PAH compounds for individual replicate Neanthes arenaceodentata exposed to Elizabeth River (batch one) dilution series sediment treatments.
Figure 4-34 Mean across-treatment biota–sediment accumulation factors (BSAFs) for three PAH compounds for Leptocheirus plumulosus and Neanthes arenaceodentata exposed to the Elizabeth River (batch one) dilution series sediment treatments
BSAF
Treatment
1% 2% 2% 2% 3% 5% 5% 5%
Replicate
2 1 2 3 4 1 2 4
Phenanthrene 0.016
0.029 0.010 0.016 0.017 Pyrene 0.057 0.029 0.035 0.022 0.034 0.015 0.024 0.016
Fluoranthene 0.050 0.021 0.035 0.016 0.026 0.014 0.023 0.017 Benzo[b]fluoranthene 0.056
Chrysene 0.058 Benzo[a]anthracene 0.041 Benzo[k]fluoranthene 0.054
Benzo[a]pyrene 0.063
BSAF
Treatment
0.5% 0.5% 1% 1% 1% 2% 2% 2% 3% 3% 5% 5% 5%
Replicate
1 4 1 2 4 1 2 3 3 4 1 2 3
Acenaphthene
0.04
0.04 Phenanthrene
0.02
0.02 0.02
0.02 0.07 0.01
Anthracene
0.03 Fluoranthene 0.12 0.15 0.07 0.06 0.04 0.04 0.02 0.01 0.08 0.05 0.10 0.01 0.01
Pyrene 0.15 0.19
0.06 0.04 0.03 0.02
0.07 0.04 0.07 Benzo[b]fluoranthene
0.06
Benzo[k]fluoranthene
0.05 Benzo[a]pyrene
0.06

82
PDMS-measured porewater concentrations The PDMS-measured mean porewater concentration of PAH compounds in exposure beakers is shown in Table 4-27 for Leptocheirus plumulosus and Table 4-28 for N. arenaceodentata. Overall, estimated concentrations were similar within a factor of 2, with higher values measured in N. arenaceodentata beakers, yielding more data points. Table 4-27 Predicted porewater concentrations determined at exposure termination in Elizabeth River (batch one) dilution series sediment treatments in Leptocheirus plumulosus beakers for PAH compounds with detectable concentrations
Table 4-28 Predicted porewater concentrations determined at exposure termination in Elizabeth River (batch one) dilution series sediment treatments in Neanthes arenaceodentata beakers for PAH compounds with detectable concentrations
PW-predicted vs. Measured Body Residues The relationship between predictions of body residues from PDMS-measured porewater PAH concentration and lipid-normalized body residue in infaunal invertebrates was examined by determining average BCF and linear regression. The average BCF varied between 0.9 (N. arenaceodentata) and 1.2 (Leptocheirus plumulosus), although with relatively few data points due to low PAH concentration. Fluoranthene and phenanthrene in Leptocheirus plumulosus and N. arenaceodentata (Figure 4-35) were the only PAH compounds with sufficient pairwise data (SPME and tissue) to allow a regression analysis. The r2 values were overall high but the scarcity of data points and variability in slope does not allowed reliable determination of the
PAH Predicted porewater concentration (µg/L) Leptocheirus plumulosus Experiment Treatment 2% 3% 3% 5% 5% 5% 5% Replicate 2 3 4 1 2 3 4
Naphthalene 4.03 3.36 2.01 Phenanthrene 0.20 0.20 0.53 0.20 0.33 Fluoranthene 0.08 0.06 0.06 0.06 0.18 0.08 0.08
PAH Predicted porewater concentration (µg/L) Neanthes arenaceodentata Experiment Treatment 1% 2% 3% 3% 5% 5% 5% Replicate 1 3 3 4 1 3 4
Naphthalene 2.01 4.70 4.70 Acenaphthene 0.69 1.15 0.69 0.92
Fluorene 0.57 0.43 Phenanthrene 0.27 0.20 0.33 0.87 0.60 0.73
Anthracene 0.21 Fluoranthene 0.10 0.08 0.06 0.10 0.22 0.14 0.18
Pyrene 0.11 0.09 0.09

83
degree certainty for predicting PAH body residue using porewater concentrations for those organisms.
Figure 4-35 Relationship between experimentally measured lipid-normalized body residue and predicted residues in Leptocheirus plumulosus (left) and Neanthes arenaceodentata (right) exposed to Elizabeth River (batch one) dilution series sediment treatments for fluoranthene and phenanthrene.
The ratio of measured to predicted (BCF=Kow) body residues are shown for the 5% treatment for phenanthrene and fluoranthene are shown in Figure 4-36. Similar bioaccumulation relative to porewater concentration was observed for Leptocheirus plumulosus and N. arenaceodentata and the measured BCF values were similar to the equilibrium partitioning predicted value. The relatively small difference between predicted and measured BCFs demonstrate that the low bioaccumulation of PAHs in the tissues indicated by low BSAFs values was likely a result primarily of the low bioavailability of these compounds in the sediment rather than efficient biotransformation in the tissues.

84
Figure 4-36 Ratio of measured tpredicted (BCF=Kow) and phenanthrene (Phe) and fluoranthene (Fla) body residuals for Leptocheirus plumulosus and Neanthes arenaceodentata exposed to the 5% to Elizabeth River (batch one) dilution series sediment treatment. Unity implies BCF of Kow.
PAH Bioavailability Experiment 2 Methods Elizabeth River sediment - batch two and Sequim Bay sediment –batch two were mixed to create a decreasing concentration series. The desired ratio of Elizabeth River sediment and diluent sediment was determined on a dry weight basis. The sediments were homogenized using an impeller mixer to visual homogeneity for approximately two hours. Four dilution treatments (20%, 10%, 5%, and 3% Elizabeth River sediment by dry weight) were created. The dilution series sediments were stored at room temperature for four weeks. Diluent sediment was used as a positive control for evaluating the effect of diluted contaminated sediments on benthic invertebrate survival and biomass at termination the exposure period.
Exposure Design
Leptocheirus plumulosus (fifty sub-adults or adult individuals, approximately 2 mg each) were placed in 1-L beakers containing a 3-cm thick layer of sediment and approximately 700 mL of overlying water.
Sediment exposures, initiated in September 2009, were 14-day long. Overlying water was aerated gently. Two-thirds of the overlying water in the chambers was changed twice weekly. Exposure beakers received food as 20 mg of ground Tetramin per beaker twice weekly. Experimental conditions are summarized in Table 4-29. Amphipods were removed at experiment termination by sieving the sediment through a 0.5 mm sieve and placed in clean water to depurate their gut contents for 6 h. Control replicate organisms were analyzed for total lipid content, and treatment replicate organisms were analyzed for PAHs.

85
Table 4-29 Exposure conditions for Leptocheirus plumulosus exposed to Elizabeth River (batch two) dilution series sediment treatments
Assessment of uptake to PDMS was conducted using the methods described for the PCB Bioavailability Experiment 2. SPME fibers (230 µm diameter glass core with a 10 µm thick PDMS coating, 0.0691 µL of PDMS per cm) were placed in stainless-steel mesh, four segments (10 cm total) per envelope. Mesh envelopes containing SPME fibers were inserted into the sediment by carefully pushing the envelope into the sediment until complete burial was achieved. Retrieval of fiber from sediment occurred simultaneously with retrieval of organisms.
Results PAHs in sediment The concentration of sum PAHs in the dilution series sediments, calculated as the sum concentration of individual congeners is presented in
Table 4-30. For each contaminated sediment treatment, total organic carbon content and the organic carbon normalized sum concentration of individual PAHs is also presented in Table 16. The sum PAH concentration decreased stepwise with increasing dilution. The concentration of individual PAHs in the dilution series sediment treatments is presented in
Table 4-31. Compounds detected at the highest concentrations were fluoranthene, phenanthrene, pyrene, and anthracene.
Table 4-30 Total organic carbon (TOC) and total PAH congener concentration in Elizabeth River (batch two) dilution series sediment treatments
Parameter Condition Exposure vessel 1-L beaker
Replicates per treatment 4 Organisms per replicate 50
Salinity 20 ppt Sediment thickness 3 cm
Temperature 23°C Light cycle 16:8 L:D
Water renewal Two-thirds of total volume twice weekly Feeding 20 mg Tetramin/ beaker twice weekly Aeration Trickle flow
Exposure duration 14 days
Treatment (% Elizabeth River Sediment by wt.)
TOC (%)
Total congeners (mg/kg)
Total congeners (mg/kg OC)
2.5% 2.3 12.9 561 5% 2.8 37.6 1343
10% 2.3 66.8 2904 20% 2.2 131.0 5955

86
Table 4-31 Concentration of PAH compounds in Elizabeth River (batch two) dilution series sediment treatments
Benthic invertebrate survival and biomass Invertebrate survival and biomass at exposure termination are presented in Table 4-32. Mean survival was significantly lower than in the control in the 10% and 20% treatments, but not in lower dilution treatments. Because of low individual replicate biomass in the 20% treatment, surviving amphipods from all replicate beakers were pooled into a single sample for chemical analysis.
PAH log kow Treatment
2.50% 5% 10% 20%
Concentration (mg/kg)
Naphthalene 3.37 0.01 4.65 4.21 9.60 Acenaphthene 3.92 0.64 2.74 4.80 9.40
Acenaphthylene 4.00 0.02 0.07 0.16 0.28 Fluorene 4.18 0.67 2.11 3.89 7.46
Anthracene 4.54 1.46 3.65 6.90 17.90 Phenanthrene 4.57 2.44 6.09 10.90 19.70
Pyrene 5.18 2.36 5.41 10.50 18.90 Fluoranthene 5.22 3.08 7.91 15.80 27.90
Benzo (b) fluoranthene 5.80 0.32 0.62 1.19 2.47 Chrysene 5.86 0.57 1.39 2.54 6.51
Benzo (a) anthracene 5.91 0.59 1.34 2.64 4.99 Benzo (k) fluoranthene 6.00 0.23 0.59 1.23 2.16
Benzo (a) pyrene 6.04 0.30 0.69 1.40 2.54 Benzo (g,h,i) perylene 6.50 0.10 0.21 0.44 0.79
Dibenz (a,h) anthracene 6.75 0.05 0.11 0.18 0.36 SUM PAH
12.9 37.6 66.8 131.0

87
Table 4-32 Mean percent survival and replicate biomass at termination of the Leptocheirus plumulosus exposure to Elizabeth River (batch two) dilution series sediment treatments.
Bioaccumulation and BSAF Mean lipid content of control-sediment exposed organisms was 1.07 ± 0.2%. Bioavailability of PAH compounds detected both in the amphipods and sediment were measured by calculating BSAF values as described above.
The mean BSAF values of PAH compounds measured in both tissue and sediment are presented in Table 4-33 and, for the 5% treatment, in Figure 4-37 . Values across compounds were highly variable, with an overall higher relative bioaccumulation for highly hydrophobic compounds. Table 4-33 Mean biota–sediment accumulation factors (BSAFs) for PAH compounds for individual replicate Leptocheirus plumulosus exposed to Elizabeth River (batch two) dilution series sediment treatments.
Treatment Survival (%) Final replicate biomass (mg)
Mean Std Mean Std Control 83.0 19.7 131.8 5.4 2.5% 87.0 5.0 127.3 2.9 5% 89.5 7.7 156.8 1.6
10% 46.5 13.3 268.0 38.6 20% 14.5 15.6 24.3 2.8
PAH BSAF
Treatment
2.5% 5% 10% 20%
Mean Std Mean Std Mean Std Composite Acenaphthene Ace 0.050 0.015 0.021 0.007 0.021 0.011 0.0059
Anthracene Anth 0.099 0.035 0.065 0.026 0.077 0.059 0.0165 Benzo (a) anthracene BaA 0.256 0.038 0.209 0.053 0.180 0.136 0.0738
Benzo (a) pyrene BaP 0.335 0.043 0.387 0.097 0.449 0.311 0.3196 Benzo (b) fluoranthene BbF 0.440 0.127 0.574 0.142 0.658 0.451 0.4406 Benzo (g,h,i) perylene BghiP 0.343 0.070 0.296 0.124 0.412 0.254 0.3489
Benzo (k) fluoranthene BkF 0.554 0.043 0.494 0.139 0.563 0.380 0.3164 Chrysene Chr 0.295 0.047 0.253 0.070 0.264 0.162 0.1162
Dibenz (a,h) anthracene DahA 0.516
0.254 0.174 0.426 0.232 0.3091 Fluoranthene Fla 0.197 0.037 0.179 0.041 0.130 0.094 0.0753
Fluorene Flu 0.028 0.011 0.023 0.009 0.0074
Indeno (1,2,3-cd) pyrene IcdPyr 0.216 0.155 0.302 0.077 0.381 0.265 0.3013 Naphthalene Naph 4.162 0.124 0.009 0.002 0.019 0.004 0.0077
Phenanthrene Phe 0.048 0.018 0.061 0.023 0.049 0.028 0.0299 Pyrene Pyr 0.131 0.032 0.096 0.025 0.093 0.054 0.0527 SUM 0.109 0.020 0.243 0.053 0.341 0.149 0.3410

88
Figure 4-37 Mean biota–sediment accumulation factors (BSAFs) for PAH compounds for individual replicate Leptocheirus plumulosus exposed to the 5% Elizabeth River (batch two) dilution series sediment treatment.
PW-predicted vs. Measured Body Residues The relationship between body residues predicted by PDMS-estimated porewater PAH concentration (with BCF=Kow) and lipid-normalized body residue in Leptocheirus plumulosus was examined using linear regression (Figure 4-38). The average BCF based upon the ratio of measured body residue to porewater concentration was 0.617, based upon anthracene, pyrene and fluoranthene. Significant linear relationship and moderately high r2 values were obtained for phenanthrene, pyrene and fluoranthene. Measured body residues were much lower than predicted values for acenaphthene, fluorene, and phenanthrene (Figure 4-38, Figure 4-39). The very low values for the low molecular weight PAHs, acenaphthene, fluorene, and phenanthrene, suggest that Leptocheirus plumulosus may biotransform less hydrophobic PAHs.

89
Figure 4-38 Relationship between experimentally measured lipid-normalized body residue and predicted residues in Leptocheirus plumulosus exposed to Elizabeth River (batch two) dilution series sediment treatments for PAH compounds.
Figure 4-39 Predicted and mean measured bioconcentration factors (BCFs) for Leptocheirus plumulosus exposed to Elizabeth River (batch two) dilution series sediment treatments. To simplify comparisons, the predicted BCFs were arbitrarily assigned the value of 1.
90
Summary of Bioaccumulation Experiments The bioaccumulation experiments can be summarized in the following way.
• Bulk solid concentrations do not provide consistent or accurate estimates of bioaccumulation of either PAHs or PCBs based upon a BSAF=1
• A single constant value of BSAF different from unity does not adequately characterize the bioaccumulation data for either PAHs or PCBs.
• Measured lipid normalized body residues are consistently predicted by porewater concentration with an effective BCF=Kow for all organisms tested for both PAHs and PCBs except for low molecular weight PAHs in Elizabeth Harbor Experiment 2, presumably as a result of metabolism of these PAHs.
• Linear relationships between measured and porewater concentration predicted body residues were noted for many compounds and conditions although analytical variability and uncertainty in corrections for unsteady uptake in PDMS fibers likely limited the degree of correlation.
• The accuracy of predicted body residues was typically within a factor of 2 of that measured although variations were noted for individual compounds due to factors such as metabolism (of low molecular weight PAHs), analytical uncertainty, uncertainty in achievement of steady state uptake in organisms and uncertainty in correcting for unsteady state accumulation in PDMS fibers.
4.4. Laboratory demonstration of cap performance assessment using measured porewater concentration profiles
The demonstration showed that porewater concentrations in the biologically active zone of a sediment cap also indicated bioaccumulation in benthic organisms populating a cap. The dilution of bulk sediment concentration by inert nonsorbing sand was not effective at decreasing bioaccumulation in exposed organisms. The separation of benthic organisms from contaminated sediments by an inert nonsorbing sand layer, however, was effective as long as the depth of active bioturbation was less than the thickness of the sand layer. This component of the overall demonstration was published in Lampert et al. (2011)19 and that publication is summarized here.
Summary The effectiveness of thin-layer sand capping for contaminated sediment management (capping with a layer of thickness comparable to the depth of benthic interactions) is explored through experiments with laboratory-scale microcosms populated with the deposit-feeding oligochaete, Ilyodilus templetoni. Passive sampling of porewater concentrations in the microcosms using polydimethylsiloxane (PDMS)-coated fibers enabled quantification of high resolution vertical concentration profiles that were used to infer contaminant migration rates and mechanisms. Observed concentration profiles were consistent with models that combine traditional contaminant transport processes (sorption-retarded diffusion) with bioturbation. Predictions of bioaccumulation based on contaminant porewater concentrations within the surface layer of the cap correlated well with observed bioaccumulation (correlation coefficient of 0.92). The results
91
of this study show that thin-layer sand caps of contaminated sediments can be effective at reducing the bioaccumulation of polycyclic aromatic hydrocarbons (PAHs) provided the thickness of the cap layer exceeds the depth of organism interaction with the sediments and the porewater concentrations within the biologically active zone remain low (e.g., when molecular diffusion controls transport from the underlying sediment layer).
Introduction One of the few in situ alternatives for remediation of sediments contaminated with persistent, bioaccumulative, and toxic hydrophobic organic compounds (HOCs) is capping with clean sand. Conventional sand capping provides a physical barrier between benthic receptors and contaminated sediments and reduces contaminant release by shifting hyporheic exchange into a layer of clean material. Field and laboratory assessments of sand capping have shown that capping can reduce contaminant fluxes from sediment73,74,75.
Sediment caps are often several feet thick to provide confidence of complete isolation of the underlying contaminants. Thick caps may not be a viable remedial alternative if they negatively impact flow or flood capacity in shallow water bodies. To minimize thickness, capping with materials that strongly sorb contaminants has been proposed76. These materials often require an overlying sediment layer to re-establish benthic ecology.
In some instances (such as for containment of residual surface contamination left after dredging) it may be possible to achieve remedial goals by placing a thin-layer cap77. Herein thin-layer capping is defined as capping with a layer of clean material having a thickness comparable to the mixing depth from benthic interactions. The mixing of sediments by benthic interactions such as organism burrowing, conveyor-belt feeding mechanisms, and porewater pumping is commonly referred to as bioturbation78. These benthic interactions could compromise the effectiveness of a thin-layer cap.
The intensity of mixing from bioturbation often decreases with depth, and at many sites there is a surface layer characterized by rapid mixing with isolated deeper benthic interactions. A literature survey found the depth of the well-mixed layer to be 9.8 cm with a standard deviation of 4.5 cm 79 . Healthy beds may have isolated regions of deeper interactions from large organisms80, but rapid mixing near the surface has a greater effect on cap integrity and solute transport81.
The bulk solid-phase concentration is often used for assessment of sediment quality despite relatively poor correlations with observed bioaccumulation or other measures of exposure and risk82, 83. These poor correlations may be the result of contaminants in desorption-resistant phases that limit availability to organisms61,84,85. Moreover, bulk solid concentrations are of limited usefulness in evaluating the performance of a sand cap due to the limited ability of sand to accumulate contaminants.
In situ porewater concentrations have been linked to bioaccumulation of HOCs in sediment environments2,5,86 and provide a direct indication of contaminant transport. However, direct measurement of HOC concentrations in the aqueous phase is frequently difficult due to analytical limitations. These difficulties can be overcome through in situ passive sampling. Various passive sampling approaches have been tested for estimation of in situ HOC porewater concentrations, including polydimethylsiloxane (PDMS)-coated glass fibers10. These fibers are readily available commercially and particularly convenient to insert into sediments with minimal

92
disturbance. They are thus well-suited for an in situ approach in which they are inserted, removed after attainment of equilibrium or a known fraction thereof, and segmented to determine high-precision concentration profiles. The PDMS-coated glass fibers can be manufactured with thin sorbent layers so that they do not significantly deplete contaminants from the neighboring sediment and attain equilibrium relatively rapidly10. The ability to determine high resolution vertical porewater concentration profiles provides an opportunity to infer availability, fluxes, and potential mechanisms of transport that are not available from bulk solid concentration measurements, particularly in the non-sorbing sand often used as a cap layer. In the current application, PDMS fibers are used to assess concentration profiles in thin-layer sediment caps.
This work had three primary objectives:
• to investigate bioaccumulation of HOCs in bioturbating organisms exposed to contaminated sediments covered with a thin-layer sand cap
• to demonstrate the applicability of the PDMS profiling technique for assessment of sediment capping
• to interpret observed porewater concentrations through models of contaminant migration in the biological active zone, the underlying sediment, and the cap layer
To meet these objectives, the results of a series of laboratory microcosm experiments are presented and analyzed. The laboratory microcosms simulated migration of polycyclic aromatic hydrocarbons (PAHs) from contaminated sediment through thin-layer sand caps populated by a test organism, Ilyodrilus templetoni, an annelid oligochaete representative of head down conveyor belt feeders that are intense sediment reworkers4,87. PDMS-coated glass fiber passive sampling devices were used to quantify contaminant concentration profiles in the caps. The results were analyzed to assess the effects of bioturbation on thin-layer caps and demonstrate the ability of the PDMS passive sampler to assess cap effectiveness.
Materials and Methods Thin-layer cap microcosm experiments were conducted in small plexiglass containers 27 cm long by 8 cm wide with a total depth of 15 cm. Similar capping microcosms have been described previously73,74,88. The microcosms consisted of an underlying contaminated sediment layer overlain with a clean sand layer overlain with a thin layer of clean (uncontaminated) sediment overlain with artificial river water. Contaminated sediments used in these studies were taken from the Anacostia River in Washington DC (total PAH concentration = 30 mg PAH/kg dry sediment and organic carbon fraction (foc) = 0.043). Cap material was 10 x 200 mesh sand (total PAH concentration < 0.5 mg PAH/kg dry sediment and foc < 0.0002). Clean sediment (total PAH concentration < 0.5 mg PAH/kg dry sediment and foc = 0.017) was taken from University Lake in Baton Rouge, LA and placed over the cap to simulate the deposition of fresh sediment after cap placement and to provide a suitable habitat for benthic invertebrates. Five microcosms with layer thicknesses (from bottom to top) were analyzed:
• 8.5 cm contaminated sediment, 4 cm water (control) • 6 cm contaminated sediment, 2 cm sand, 0.5 cm clean sediment, 4 cm water • 4 cm contaminated sediment, 4 cm sand, 0.5 cm clean sediment, 4 cm water • 2 cm contaminated sediment, 6 cm sand, 0.5 cm clean sediment, 4 cm water

93
• 2 cm contaminated sediment, 8 cm sand, 0.5 cm clean sediment, 4 cm water
Thus microcosms with cap thicknesses of 0 (control), 2.5, 4.5, 6.5, and 10.5 cm were monitored in this study. Artificial river water consisting of 0.5 mM NaCl, 0.2 mM NaHCO3, 0.05 mM KCl, and 0.4 mM CaCl2 dissolved in deionized water was passed over the microcosms at a velocity of approximately 10 cm/hr and constant depth of 4 cm in all microcosms. The flow of the overlying water was employed to maintain effectively zero PAH concentrations and high dissolved oxygen concentrations at the sediment-water interface throughout the experiments.
A culture of the freshwater deposit-feeding oligochaete Ilyodrilus templetoni was placed into this microcosm to encourage colonization of the surface sediments. This organism provides rapid mixing and a bioturbation depth close to the mean value reported by Boudreau (1998)7978. PDMS fibers were placed directly into the sand and sediment layers of the microcosms, then removed and analyzed in triplicate at 28 days to determine porewater concentration profiles at 1-cm resolution. Organisms were collected at 28 days in all microcosms. Additionally, a second 4-cm microcosm was maintained for 56 days to investigate longer-term bioaccumulation.
PAH analysis was performed using high performance liquid chromatography (HPLC) for separation with fluorescence detection for quantification. All analyses were performed in accordance with EPA Method 8310 using a Waters (Milford, MA) 2795 Separations Module. An isocratic flow rate of 1.0 mL/min composed of 3:7 water:acetonitrile (v:v) was used for separation of the target analytes. Detection was achieved using a Waters (Milford, MA) 2475 multi-wavelength fluorescence detector. All analyses utilized linear calibration curves with a minimum of five points. Check standards and blanks were used with every sample for quality control. Seven PAHs were analyzed in all of these studies: phenanthrene (PHE), pyrene (pyrene), benz[a]anthracene (BAA), chrysene (CHR), benzo[b]fluoranthene (BBF), benzo[k]fluoranthene (BKF), and benzo[a]pyrene (BAP); these compounds span a wide range of hydrophobicity.
Organism tissue samples were dried, weighed, and mixed with sodium sulfate to disperse the particles and absorb excess water using a modified version of EPA Method 3550. Twenty mL of dichloromethane (DCM) were added to the vial to extract the PAHs, and samples were sonicated using a Branson (Danbury, CT) Model 2200 Ultrasonicator for 30 minutes. A 3-mL aliquot of DCM was added to each sample in a 5-mL blow down vial. The DCM volume was then evaporated with a Labconco (Kansas City, MO) Model 79100 RapidVap N2 Evaporation System to a volume between 0.3 and 0.1 mL and reconstituted to a volume of 3 mL with acetonitrile. The vial was mixed thoroughly, blown down to the final volume, and analyzed.
The fraction organic carbon of the sediments was determined by elemental analysis on a Carlo-Erba 1108 according to Hedges and Stern89 modified according to Harris et al90. The oxidation column was run at 1020°C, while the reduction column was run at 650°C. The oven temperature was maintained at 60°C.
Lipid content was assessed using the method described by Herbes and Allen91 to convert wet worm tissue loadings to lipid-phase concentrations. Twenty worms (~100 mg wet weight) were transferred to pre-weighed 15 mL centrifuge tubes and then re-weighed to assess worm mass. Five mL of a 1:1 (v:v) solution of reagent-grade methanol and reagent-grade chloroform (Fisher Scientific, Waltham, MA) were added to each tube for lipid extraction. The samples were then sonicated, allowed to equilibrate, and the supernatant separated from the solids by centrifugation. The extract was equilibrated with two mL of water to remove tissue protein and then dried at

94
50°C and weighed to assess the lipid mass in the original sample. Observed lipid contents were similar to previous experiments4.
PDMS-coated fibers manufactured by Poly Micro Industries (Phoenix, AZ) and provided by P. Mayer, had a 110-µm core with a 30-µm PDMS coating or outer diameter of 170 µm. The PDMS fibers have been tested in the laboratory previously to verify their ability to quantify sediment porewater concentrations. The development of the PDMS fiber method including extraction efficiency, reproducibility, equilibration time, and partition coefficients are described by Reible et al. (2008)92. The partitioning relationship of the various PAHs between the PDMS phase (Cfiber, ng/L PDMS) and the porewater (Cw, ng/L water) is linear with a partition coefficient of Kf (L PDMS/L water):
w f fiberC K C= (10)
For all PDMS analyses, the method described by Lu et al. (2011)17 was used. The fiber was cleaned prior to deployment by sonication in hexane for a minimum of half an hour, followed by a rinse with acetone and then de-ionized water. After equilibration of the fibers with the sediment, fibers were rinsed clean (to remove any particles) with deionized water and then placed into 100-µL HPLC inserts with 100 µL of HPLC-grade acetonitrile.
Experimental Results and Discussion The effects of bioturbation on the microcosms were quantified using the results from the uncapped control cell. The bioturbation depth for Ilyodrilus templetoni was estimated from inspection and found to be limited to approximately 4.5 cm, which was consistent with expectations as organism lengths ranged from two to five cm and Ilyodrilus templetoni is a burrowing deposit feeder87. In natural systems the depth and intensity of bioturbation is a function of the organisms and the overall health of the ecosystem80, and therefore after placement of a cap in a natural system the actual bioturbation depth may be greater than observed here.
The effect of bioturbation on solute transport increases the net flux of contaminants and is often modeled using a biodiffusion coefficient78, particularly when organism densities and mixing rates are very high. In systems where bioturbation moves porewater and particles together (interphase mixing) and no other transport processes are present, solute transport by bioturbation is independent of the partitioning between the two phases and therefore approximately the same for all compounds. This is in contrast to molecular diffusion and porewater advection which are subject to retardation onto particles.
The porewater concentrations in the control cell for each compound were normalized using the average concentrations in the sediment beneath the bioturbation layer. The dimensionless concentration profiles for each of the contaminants showed no effect of hydrophobicity, which implied that the interphase particle diffusion approach was an appropriate model for the system and that bioturbation was the dominant transport mechanism. Because there was no trend with hydrophobicity, the data were reduced by averaging the dimensionless concentrations of all the compounds at each depth to provide a single value of dimensionless concentration at each depth at 28 days (Figure 4-40).

95
Figure 4-40 Dimensionless PAH profiles for control cell and depletion model. Depletion model assumes a biodiffusion coefficient (particles and porewater) of 3.1±0.3 (10)-7 cm2/s from an initially uniform concentration layer. Error bars represent 95% confidence intervals in the mean dimensionless porewater concentrations (n = 21).
To interpret the observed profiles in the control cell, a biodiffusion model of depletion from an initially contaminated layer into a clean overlying layer was applied to the data. More complex conveyor-belt approaches are sometimes used to model solute transport by bioturbation, although Mohanty et al. (1998) 93 found little difference between these approaches and the constant biodiffusion coefficient model. The transport equation, initial condition, and boundary conditions at depth z (where z = 0 is the sediment-water interface and the positive z–axis points down) and time t for the porewater concentration C with a retardation factor, R (defined as the ratio of the total mass in an elementary volume to that in the porewater), are:
2
2
0
( 0, ) 0( , 0)
( , ) 0
bioC CR RDt z
C z tC z t C
C z tz
∂ ∂=
∂ ∂= == =
∂ →∞=
∂
(11)
The solution for the dimensionless concentration C/C0 is94
0
erf4 bio
C zC D t
=
(12)
The left-hand side of Equation (11) represents the rate of change of mass in an elementary volume (both solid and porewater) while the right-hand side represents the flux associated with biodiffusion of particles and porewater. Equation (12) is independent of the partitioning between the two phases (R), and Dbio reflects the mixing intensity of the particles and porewater. This approach avoids the complications associated with any desorption resistance for the compounds and assumes sorptive exchanges are relatively rapid. The value of Dbio was fit to the observed
-4
-2
0
2
4
6
8
100.0 0.2 0.4 0.6 0.8 1.0 1.2
Dimensionless Concentration
Dep
th (c
m)
overlying water
underlying sediment
bioturbation layer

96
28-day dimensionless concentrations in the bioturbation zone using nonlinear least squares regression and inferred to be 3.1 ± 0.3 (10)-7 cm2/s. Subsequent interpretation of observed profiles utilized this value for the biodiffusion coefficient. Transient depletion was expected in the bioturbation layer initially, although the system is expected to achieve a quasi- steady state condition when depletion reaches the bottom of the bioturbation layer (~4.5 cm). At that point a steady-state balance is reached between the flux from the underlying sediment by molecular diffusion and the bioturbation flux to the overlying water. The observed concentration profile suggested that this quasi steady condition was being approached but had not yet been achieved in the control cells.
The observed profiles in the 2.5-cm and 4.5-cm capped microcosms after 28 days were generally consistent for all PAHs. The data were reduced to a single dimensionless profile (Figure 4-41) since a well-mixed bioturbation layer developed over the underlying contaminated sediment and observed mean normalized porewater concentrations were indistinguishable at the 95% confidence level with the exception of the more hydrophobic compounds at the sediment-water interface in the 2.5-cm cap. The behavior of these compounds in the 2.5-cm cap may have been the result of limited desorption due to water-side mass transfer resistances or limitations in the constant biodiffusion coefficient model. The maximum depth of bioturbation (~4.5 cm) was similar to that in the control cell and was sufficiently deep to compromise the entire cap in both cells. Relative concentrations were slightly larger in the 2.5-cm cap microcosm to those in the 4.5-cm microcosm, likely as a result of the differences in initial conditions. Given sufficient time it is expected that the control, the 2.5-cm cap, and the 4.5-cm cap would all develop profiles consistent with quasi steady-state diffusion (a linear decrease from the underlying contaminated sediment to the clean overlying water). A plot of the expected steady-state concentration and the previously developed transient depletion curve are shown along with the data in Figure 4-41.
Figure 4-41 Dimensionless PAH profiles for 2.5-cm and 4.5-cm cap microcosm and steady-state bioturbation model. Profiles in the 4.5-cm microcosm were consistent with steady-state biodiffusion between the underlying contaminated sediment and the clean overlying water. The minor differences between the microcosms and the control are attributed to dilution with the sand. Error bars represent 95% confidence intervals in the mean dimensionless porewater concentrations (n = 21).
-4-202
468
100 0.5 1 1.5
Dimensionless Concentration
Dep
th (c
m) 2.5-cm cap
4.5-cm capsteady-state modeldepletion model
overlying water
bioturbation layer
underlying sediment

97
The concentration profiles in the 10.5-cm capped microcosm showed a significant decrease from the underlying sediment to the overlying water. Because contaminant migration occurred below the zone effectively mixed by bioturbation, the migration is compound-specific and subject to sorption-related retardation. Pyrene was selected as a representative compound and further analyzed. The normalized concentration profile from pyrene in the 10.5-cm sand cap microcosm is displayed in Figure 4-42. The profile shows a sharp drop-off from the underlying contaminated sediment past the sediment-sand interface to a background level of approximately 6% of that in the underlying sediment. Because the cap depth was substantially larger than the bioturbation depth, an isolation layer of approximately 6 cm dominated by molecular diffusion prevented significant migration through the cap layer. Low concentrations of pyrene were noted throughout the cap, possibly due to a small amount of intermixing during sediment placement into the microcosms or occasional deeper penetrations of the organisms.
Figure 4-42 Laboratory microcosm pyrene profiles for 10.5-cm cap microcosm and model predictions. Model predictions (blue line) demonstrated that a molecular diffusion model with sorption onto the sand material (Kd = 2.0 L/kg) explain the observed data. Error bars represent 95% confidence intervals in the mean dimensionless porewater concentrations (n = 3).
To interpret the results of the 10.5-cm cap microcosm, a diffusion model was applied to the data. An effective diffusion coefficient Deff and retardation factor R in the isolation layer were used to characterize solute transport. Because significant migration was observed only in the first few centimeters away from cap-sediment interface, a semi-infinite diffusion model assuming a constant boundary concentration of C0 at depth h and an initial concentration Cbackground of 0.06C0 throughout the cap layer was used to predict porewater concentrations. The solution to the diffusion equation at depth z and time t under these conditions was adapted from Crank94:
0
0 0 0
( )erfc4
background background
eff
C C CC R h zC C C D t
− − = + (13)
-2
0
2
4
6
8
10
120 0.2 0.4 0.6 0.8 1 1.2
Dimensionless Concentration
Dep
th (c
m) bioturbation layer
overlying water
underlying sediment
containment layer

98
The effective diffusion coefficient represents the molecular diffusion coefficient Dw corrected for porosity,ε, and tortuosity as suggested by Millington and Quirk95:
4
3eff wD Dε= (14)
Sorption onto the cap material was assessed by a retardation factor, R, defined as the ratio of the total mass in an elementary volume to that in the porewater. The retardation factor is defined in terms of ε, the particle density, ρp, and a linear partition coefficient Kd:
(1 ) p dR Kε ε ρ= + − (15)
The value of Dw for pyrene was estimated using the method described by Hayduk and Laudie96 to be 4.9(10)-6 cm2/s, while ε and ρp were assumed to be typical sand values of 0.5 and 2.65 g/cm3. The observed concentration profiles were fit to the model using a cap depth of 10.5 cm by adjusting the value of Kd. The resulting model predictions best matched the data using a value of 2.0 L/kg for Kd. This result implies modest sorption of pyrene onto the sand, which is consistent with findings reported by Schwarzenbach et al.97 who have suggested that for highly hydrophobic compounds, mineral sorption onto the surfaces of sand can be significant when the organic carbon fraction is less than 0.1% – 0.01%. The sorption may also have been from modest intermixing of the overlying sediment into the sand layer during cap placement.
Figure 4-43 shows the dimensionless concentration profiles of pyrene in the 6.5-cm cap microcosm. As in the case of the 10.5-cm cap, the 6.5-cm cap was deeper than the nominal bioturbation depth of 4-5 cm, leaving an approximately 2-cm isolation layer between the contaminated sediment and the bioturbation depth. Bioturbation-enhanced pyrene transport in the surface layer was significantly faster than transport by molecular diffusion in the 2-cm layer below. However, the porewater concentrations in the bioturbation layer were much lower than those seen in the thinner caps and the control cell. To interpret the observed profile in the 6.5-cm capped cell, it was necessary to consider the effects of both bioturbation and molecular diffusion simultaneously.

99
Figure 4-43 Laboratory microcosm pyrene profiles for 6.5-cm cap microcosm. Blue line is the two-layer steady-state diffusion model of Lampert and Reible99 using the biodiffusion parameters determined from the control cell and the molecular diffusion parameters from the 10.5-cm cap microcosm. Error bars represent 95% confidence intervals in the mean dimensionless porewater concentrations (n = 3).
Lampert and Reible98 developed a two-layer steady-state model to predict concentrations and fluxes in a sand cap with an isolation layer of thickness heff and effective diffusion coefficient Deff and a bioturbation layer with thickness hbio and effective solute diffusion coefficient RDbio such as the 6.5-cm cap microcosm. The steady-state model for two layers with different diffusion coefficients and no other processes reduces to the following two straight lines:
0
( )
eff effbio
eff eff bio bio bio
eff eff bio bio biobio bio eff
eff eff bio bio eff eff bio bio eff
D h z z hD h RD h h
C zD h RD h z h h z h h
D h RD h D h RD h h
≤ < +=
− + ≤ ≤ + + +
(16)
The flux of pyrene in the isolation layer is due to molecular diffusion in the porewater only, while in the bioturbation layer the flux is associated with mixing of both particles and porewater and is equal to the retardation factor for pyrene in the layer R times the biodiffusion coefficient Dbio. At steady state the two fluxes are equal. The value of R for pyrene in the bioturbation layer was estimated using the weighted average of the previously estimated Kd for the sand (2.0 L/kg) and an estimated value for the Kd of the University Lake sediment. The Kd for University Lake sediment was estimated using the measured foc and an organic carbon partition coefficient Koc estimated from a correlation with log Kow
39 using a literature value for Kow99
. The estimate for Kd in the mixed 0.5-cm University Lake sediment and 4-cm sand layer was 68 L/kg and the resulting product of Dbio and R for pyrene was 2.1E-5 cm2 s-1, approximately ten times the molecular diffusion coefficient.
-4
-2
0
2
4
6
8
100 0.2 0.4 0.6 0.8 1 1.2
Dimensionless Concentration
Dep
th (c
m)
bioturbation layer
overlying water
underlying sediment
containment layer

100
Using the estimate for R, the previously determined values of Deff and Dbio and the thicknesses of the two layers (heff = 2.0 cm and hbio = 4.5 cm), the predicted two-layer steady-state profile was computed and plotted in Figure 4-43. Because the value of Kd was estimated, the model sensitivity was investigated by using Kd values three times smaller and three times larger than the estimate (shown in dashed lines in Figure 4-43). While the model profile slightly misses the observed data, it provides a reasonable interpretation since no parameter fitting was performed, the microcosm may not have completely reached steady-state in 28 days, and discrete zones of bioturbation were assumed. These effects are apparent from the larger 95% confidence limits in the data near the isolation layer-bioturbation layer interface. By using Kd values within a factor of three, model estimates captured all the observed data.
The worm tissues were analyzed for PAH levels and lipid content in each of the laboratory microcosms at the end of each experiment. Kow has been suggested as a surrogate for the lipid-water partition coefficient in biological organisms100,101. Using literature values for Kow
24 and the average porewater concentration from the upper 4.5 cm of each cell (as this was where exposure occurred), the concentration of PAHs in the tissues of the worms qlipid was predicted for each of seven PAHs and compared to the lipid-normalized organism concentration predicted by the product of the porewater concentration Cw and Kow. The results are shown in Figure 4-44.
Figure 4-44 Microcosm tissue concentrations for I. templetoni correlated well with predictions based on porewater concentrations. Bioaccumulation of the PAHs showed a strong correlation with the predictions assuming bioconcentration factor between porewater and lipids is Kow (correlation coefficient = 0.92).
The measured and predicted bioaccumulations of the (log-transformed) PAHs were highly correlated, with a coefficient of 0.92. The results imply that a thin-layer cap can be effective provided its thickness is greater than the depth of active and rapid bioturbation. It should be emphasized, however, that this conclusion is limited to systems dominated by molecular diffusion in the sediment underlying the biologically active zone and in fact suggest that if other mechanisms exist to maintain porewater concentrations high (e.g., groundwater upwelling) that the cap will not reduce organism bioaccumulation. Although contaminant profiles in the 6.5-cm cap appeared to have achieved steady conditions, organisms from the 4.5-cm cap microcosm
10
100
1000
10000
100000
1000000
10 100 1000 10000 100000 1000000
q lipid (ng/g)
q pre
dict
ed =
Cw
* K
ow (n
g/g) PHE
PYR
CHR
BAA
BBF
BKF
BAP
1:1
correlation = 0.92
1:1 line

101
were analyzed again after 56 days to ensure that the conclusions were not simply the result of the relatively short term testing. The tissue concentrations after the 56-day period actually demonstrated lower PAH concentrations were seen at 28 days, which may have been the result of organism dynamics, depletion of contaminant mass in the sediment or metabolism of the compounds.
The results of the thin-layer sand cap microcosm experiments have several significant implications. First, the consistency of the PDMS porewater measurements demonstrates the ability of the method to determine concentration profiles in caps. The technique can be used to assess the effectiveness of capping as a sediment remediation technology, even for sand caps where equilibrium solid concentrations are much less than those in the underlying sediment due to lack of sorption capacity. The consistency of the porewater profiles with model predictions provides support for the application of the models98 for multi-layer caps. The decreased concentration levels in the bioturbation zones translated into lower exposure doses and subsequently contaminant bioaccumulation. Ground water upwelling and erosion were ignored in these experiments; these processes could significantly impact the effectiveness of thin-layer caps. The results of these experiments imply that thin-layer caps can be useful as a sediment remediation technology for minimizing exposure risks provided the cap thickness exceeds the depth of rapid mixing of the organisms, contaminant migration is by molecular diffusion, and cap integrity is maintained during high flow events.
4.5. Field measurement of porewater concentration profiles in sediments The ability to measure porewater concentration profiles in sediments and to assess chemical migration or containment in capping systems was also assessed in the field. The demonstration showed that vertical profiles in hydrophobic organic contaminants could be measured in-situ assisting in the evaluation of the mechanisms and rates of transport. In general, multiple time series measurements are required to define contaminant dynamics. The approach was shown to be far more effective than bulk solid measurements at indicating contaminant migration in a cap.
Summary In this section, the long-term monitoring results from a field demonstration of capping contaminated sediments at the Anacostia River in Washington DC are presented and analyzed. In situ porewater concentrations in field-contaminated sediments were quantified using a polydimethylsiloxane (PDMS)-based passive sampling device. High resolution vertical porewater concentration profiles were measured using the device and were used to infer fate and transport of polycyclic aromatics hydrocarbons (PAHs) at the site. The derived porewater concentrations were compared with observed bioaccumulation and solid-phase concentration profiles to infer contaminant migration rates and mechanisms. Observed porewater concentrations were found to be a better predictor of bioaccumulation than solid-phase concentrations. Because of the low sorption capacity of sand, solid-phase concentrations were artificially low in cores which implied containment of contamination; however porewater profiles showed that contaminant migration had occurred in the first few years after cap placement. Because of surface re-contamination, low sorption capacity in the demonstration caps and strong tidal pumping effects, steady state contaminant profiles were reached in the caps several years after placement. Despite re-contamination at the surface, steady state concentrations in the capped areas showed decreased contamination levels relative to the control area.

102
Introduction The persistence of hydrophobic organic compounds (HOCs) such as polycyclic aromatic hydrocarbons (PAHs) in sediments often presents a residual risk to the environment many years after sources of contamination are eliminated. One of the primary alternatives for in situ treatment of contaminated sediments is capping with clean material such as sand. Sand capping creates a physical barrier between benthic receptors and the underlying contamination. Sand caps can also provide a new habitat in areas where transport of coarse-grained sediments has been reduced through reduction in high flow events (from dams and other man-made interferences).
Sand caps can reduce contaminant fluxes from sediments by acting as a diffusive barrier to transport (Thibodeaux and Bosworth 1990102, Wang et al. 199174, Thoma et al. 199373, Zeman and Patterson 199775) and providing a clean environment for benthic organisms. Due to the permeable and relatively inert nature of sand, however, sand capping alone may not achieve remedial goals in systems that are not dominated by molecular diffusion. As an alternative to sand, “active capping” with materials that strongly sorb contaminants has been proposed (Murphy et al. 2006103, Reible et al. 2006104, McDonough et al. 2007105). However, such materials may be unsuitable habitats for benthos and thus require a clean sand layer for erosion armoring and habitat restoration. To assess the effectiveness of various capping materials at retarding contaminant migration, it is necessary to quantify concentration profiles in such systems and ultimately the impact of these concentrations on bioaccumulation of contaminants.
Reible et al. (2006)104 describe an active capping demonstration at the Anacostia River in Washington D.C. Four caps, each approximately 200 by 200 feet in size, were placed in the spring of 2004 to assess the potential effectiveness of capping on a field-scale. The four capping materials used were AquaBlokTM, coke, apatite, and the traditional material, sand. AquaBlokTM is a manufactured clay-like material for permeability control. Coke is a by-product of coal manufacturing, inexpensive, and is a moderately strong sorbent of organic compounds. Apatite is used for sequestration of heavy metals. Preliminary post-cap monitoring showed no distinguishable differences between the various cap materials on the basis of solid-phase concentrations derived from sediment cores. Herein the results of the long-term monitoring of the Anacostia site area presented and analyzed.
Passive Sampling Background In situ porewater concentrations have been linked to bioaccumulation of HOCs in sediment environments5,4,86. However, direct measurement of HOC porewater concentrations is difficult due to analytical limitations and thus the bulk solid-phase concentration is often used for assessment of sediment quality despite poor observed correlations with bioavailability82,83. These observations may be the result of phenomena such as desorption resistance84,85,86.
Passive sampling devices provide a mechanism to infer porewater concentrations of HOCs in sediments. Passive sampling techniques measure the mass that is accumulated on a sorbent sampling device and then determine the porewater concentration from a pre-established partitioning relationship. Glass fibers coated with a thin layer of polydimethylsiloxane (PDMS) have been used successfully to measure porewater concentration13. The PDMS fibers are inserted, then removed after absorbing the compounds of interest, segmented to determine high precision concentration profiles, and then analyzed following solvent extraction.

103
The ability to determine high resolution vertical porewater concentration profiles provides an opportunity to infer availability, rates, and potentially mechanisms of transport that are not available from bulk solid concentration measurements. In this study the effectiveness of capping for the containment of PAHs is explored at the Anacostia demonstration site through a combined analysis of PDMS samplers, sediment cores, and caged organism bioaccumulation.
Materials and Methods PDMS Fibers Two PDMS fibers were used in these studies, one from Fiber Guide Industries (Stirling, NJ) with a 210-µm glass core with a 10-µm PDMS coating or outer diameter of 230 µm (FG 230/210) and the other from Poly Micro Industries (Phoenix, AZ) with a 110-μm core with a 30-μm PDMS coating or outer diameter of 170 μm (PM 110/170). The PDMS fibers have been tested in the laboratory to verify their ability to quantify sediment porewater concentrations as described by Lu et al. (2011)17. Partitioning of the various PAHs between the PDMS and the porewater was found to be linear and characterized by a partition coefficient of Kf. The values for Kf were estimated by the correlation of Lu et al. 201117 with the octanol-water partition coefficients (Kow), using Kow values from MacKay et al. (1992)14.
For all PDMS analyses, the fiber was cleaned prior to deployment by sonication in hexane for a minimum of half an hour, followed by a rinse with acetone and then de-ionized water. Upon removal of the fibers with the sediment, fibers were rinsed clean (to remove any particles) with deionized water and then placed into 100-µL HPLC inserts with 100 µL of acetonitrile.
PDMS Field Sampler To measure porewater concentration profiles of PAHs in sediment caps, a field-deployable PDMS profiling apparatus was developed. To protect the fibers in the sediment/cap column, fibers were placed into an approximately 2-mm wide rectangular groove in the inner rod of the piezometer. Approximately 0.5-mm thick slits were cut into the outer part of the piezometer at 6-mm spacing to allow equilibration of the fiber with the neighboring sediment. The bottom and top of the rods were sealed shut with (silicone) caulk to prevent an inflow of porewater through the system. Figure 4-45 shows a schematic of the PDMS field sampling device.

104
Figure 4-45 Field PDMS sampling device. The PDMS-coated glass fiber is placed inside the narrow slit in the stainless steel piezometer. An outer stainless steel sheath with a series of cuts protects the fiber during deployment but still enables interaction between the porewater and the fiber.
Coring Experiments Solid-phase concentration profiles in the sand and AquaBlokTM caps were quantified through the analysis of sediment cores. Undisturbed cap/sediment samples from all the caps except the coke breeze cap were collected by a vibrating coring or vibracore sampler. The vibracore sampler used was a 3.25-in diameter stainless-steel core barrel fitted with a 2-7/8 in clear plastic liner. After a core sample was retrieved, the overlying water was bled by cutting the core liner with a hacksaw. The core liner was then capped with watertight plastic caps, sealed with tape, labeled with its identification and orientation, and shipped back to the lab for processing. The cores were extruded in the lab, and samples were collected at 0.5-cm intervals. The outside edge of the samples was discarded due to concerns about edge effects during collection and extrusion. For each sample, the concentration of PAHs was determined and a sieve analysis performed to assess the percentage of the cap material and the sediment within the sample. All solid-phase concentrations were normalized on a dry weight basis using the percent moisture from the sample.
PDMS Deployments The PDMS field samplers were deployed at the Anacostia River capping demonstration in Washington DC into the sand, coke, and AquaBlokTM caps and the uncapped control area 36 months after placement. Samplers loaded with the 110/170 fiber and inserted into the surface of
PDMS Fiber placed in
Inner rod for
PDMS support
Outer tube
Place Inner Rod
narrow groove with slots
in Outer Tube
105
the caps. During this deployment, caged organisms were co-located with the samplers and surficial soil samples were taken and analyzed to measure solid-phase concentrations of PAHs and organic carbon content.
PDMS field samplers using the FG 230/210 fiber were deployed again 44 months after placement. Samplers were retrieved 28 days after deployment, and core samples of the cap/sediment were taken to compare solid phase concentrations to those observed with the porewater samplers. The PDMS profiling samplers were deployed into the coke, sand, and sediment control areas again 54 months and 66 months after placement to determine porewater concentration profiles.
PAH Analysis PAH analysis was performed using high performance liquid chromatography for separation with fluorescence detection (HPLC/FD) for quantification. All analyses were performed in accordance with EPA Method 8310: Polynuclear Aromatic Hydrocarbons using a Waters 2795 Separations Module. An isocratic flow rate of 1.0 mL/min composed of 3:7 water:acetonitrile (v:v) was used for separation of the target analytes. Detection was achieved using a Waters 2475 multi-wavelength fluorescence detector. The optimal excitation and emission wavelengths used for quantification of each of the PAHs were taken from Futoma et al. (1981)106. All analyses utilized linear calibration curves with a minimum of five points. Check standards and blanks were used with every sample set to ensure performance. Seven PAHs were analyzed in all of these studies: phenanthrene (PHE), pyrene (pyrene), benz[a]anthracene (BAA), chrysene (CHR), benzo[b]fluoranthene (BBF), benzo[k]fluoranthene (BKF), and benzo[a]pyrene (BAP).
PAH Solid Phase Extractions
PAHs were extracted from the solid phase (sediments as well as cap materials) using EPA Method 3550B: Ultrasonic Extraction. This technique is used for extracting nonvolatile and semi volatile compounds from solid matrices. Approximately two grams of sample were mixed with anhydrous sodium sulfate in thoroughly pre-cleaned glassware until a free-flowing powder was formed. Next, 60 mL of a 1:1 (v:v) hexane:acetone solution were then added to the jar. The samples were then placed into a water bath in a Branson (Danbury, CT) Model 2200 Ultrasonicator for 30 minutes to dismember the particles. Samples were equilibrated overnight, after which an aliquot of the extract was separated, blown down with nitrogen gas using a Labconco (Kansas City, MO) Model 79100 RapidVap N2 Evaporation System, and finally reconstituted with acetonitrile for final analysis. The solid-phase concentrations were determined by back-calculation using mass, which was measured at each step in the extraction. Method blanks were used to check for contamination with every set of samples. A sample was periodically spiked as a check on extraction efficiency.
Total Organic Carbon The total organic carbon (TOC) of solid-phase samples was determined by elemental analysis on a Carlo-Erba 1108 according to Hedges and Stern (1984)89 modified according to Harris et al. (2001) (i.e., overnight vapor acidification with a hydrochloric acid atmosphere to remove inorganic carbon from samples). The oxidation column was run at 1020°C, while the reduction column was run at 650°C. The oven temperature was maintained at 60°C. Each sample was measured in triplicate and the results averaged to obtain the final values used for analysis.

106
Organism Lipid Fraction Lipid content was assessed using the method first described by Herbes and Allen (1983)91 to convert wet worm tissue loadings to lipid-phase concentrations. Twenty worms (~100 mg wet weight) were transferred to pre-weighed 15 mL centrifuge tubes and then re-weighed to assess worm mass. Five mL of a 1:1 (v:v) solution of reagent grade methanol and reagent grade chloroform (Fisher Scientific, Waltham, MA) were added to each tube for lipid extraction. The samples were then sonicated for 30 seconds and allowed to equilibrate for four hours. The tubes were centrifuged, and the supernatant was transferred to a new tube. An addition five mL of the methanol-chloroform solution were added to the original tube to remove any remaining extract. The extract was then equilibrated with two mL of water to remove tissue protein. The extract was then dried at 50°C and weighed to assess the lipid mass in the original sample. Method blanks were evaluated and showed no solvent residuals.
Particle Size Measurements To quantify the effects of intermixing of underlying sediment and overlying cap material in cores, a particle size analysis of the segmented core samples was performed. The cap materials possessed larger particle diameters and hence a smaller percentage of the cap materials would pass through the sieve. The samples were dried and then sieved using a U.S. number 80 (0.18 mm) sieve and evaluated for percent passing. Approximately 20% of the sediment was retained on the sieve while essentially 90% of the sand was retained. The scale was normalized to account for the sediment retained and the sand passed to determine the percent cap material (e.g., 20% retained = 100% sediment; 55% retained = 50% sand, 50 % sediment).
High Resolution Solid-Phase Concentration Profiles Figure 4-46 shows the solid-phase concentration profiles of each of the seven PAHs at 44 months normalized by the concentration in the underlying sediment in a sand cap core. The percent native sediment in the sample is also plotted to show the effect of intermixing. The percent sediment in the sample provides a quantitative means of estimating the intermixing in the region at the interface of the sand cap and the underlying contaminated sediment. Because the normalized concentrations of all the contaminants fall essentially on top of the percent native sediment line, it appears that the observed concentration profiles can be explained completely by intermixing and that there had been no significant contaminant migration. The figure shows the concentrations near the cap-water interface to be greater than zero. In a sediment capping environment where the contamination is completely capped and sources are cut off, it is expected that new sediment would be contaminant free. The PAH levels in the newly deposited sediments indicate a failure to control all PAH sources, which severely inhibits the effectiveness of capping.

107
Figure 4-46 Sand cap dimensionless solid-phase PAH profiles and percent sediment. Normalized concentration profiles and percent native sediment were essentially identical, which implied that the observed profiles were consistent with intermixing and no migration of the contaminants had occurred.
44-Month PDMS Porewater Profiles Figure 4-47 shows the results of the PDMS porewater analysis in the sand, coke breeze, and AquaBlokTM caps during the 44 month deployment. The concentrations were non-zero throughout the caps, which is in sharp contrast to the solid phase concentration profiles displayed in Figure 4-46. The differences in partitioning between the sand and sediment phases distorted the apparent contaminant migration in the cap, since the sand has considerably less sorption capacity. Therefore while the coring profiles appeared to indicate no migration into the caps, in reality concentrations were non-zero throughout as shown by the unbiased porewater concentration profiles.
-5
0
5
10
15
20
25
300% 50% 100%
C/C0 and % Passing
Dep
th (c
m)
PHE PYRBAA CHRBBF BKFBAP % Native
mixing zone
native sediment
sand cap
overlying water
re-contamination

108
Figure 4-47. PAH porewater profiles in various caps at 44 months. Re-contamination of surficial sediment and strong tidal pumping effects resulted in contaminant migration through the caps. Each of the capping materials reduced near-surface porewater concentrations. Lighter molecular weight PAHs (PHE, pyrene) showed more uniformity presumably due to less retardation on cap material.
-10
0
10
20
30
40
50
0.00 0.50 1.00 1.50
Pore Water Concentration (ng/L)
Control Sand AquaBlok Coke Breeze
-10
0
10
20
30
40
500 50 100 150
PYRoverlying water
sediment/cap
-10
0
10
20
30
40
500 50 100 150 200 250 300
PHEoverlying water
sediment/cap
-10
0
10
20
30
40
500.0 0.2 0.4 0.6 0.8 1.0
BKFoverlying water
sediment/cap
Dep
th fr
om O
verl
ying
Wat
er (c
m) .

109
Relatively modest concentration gradients were observed within the sand cap, possibly as a result of attainment of a steady state condition. The flow of groundwater varies strongly with the tides and moves both into and out of the capping material104. As a result of the rapid mixing by tidal pumping, it is possible that steady state conditions had been attained after 44 months. The profiles show high concentrations at depth that decreased near the overlying water. These observations are consistent with the concept of mixing due to tidal effects from both an underlying and overlying contaminated layer. Despite re-contamination and tidal effects, the sand cap did demonstrate lower concentration levels than in the native sediment.
The porewater concentration profiles measured in the coke breeze and AquaBlokTM caps exhibited similar behavior to the sand cap, which is likely due to the tidal pumping of contamination from the newly deposited contaminated sediment throughout the overlying sand layer in the active caps. The concentration profiles for the lighter molecular weight compounds (PHE and pyrene) showed more uniformity than the heavier compounds (e.g., BKF). This effect is seen in Figure 4-47, where the concentration profiles of BKF in the two active materials decreased with depth from the freshly deposited contaminated sediment into the cap, then increased to the underlying sediment levels. It seems that PHE and pyrene had attained steady state at 44 months, while the heavier compounds were still in a transient state.
54-Month and 66-Month PDMS Sampling PDMS sampling deployments were conducted again at 54 months and 66 months to assess contamination levels. The transient behavior of the system (44, 54, and 66 months) is plotted in Figure 4-48. Sediment concentrations were relatively consistent over time. All three caps (sand, AquaBlokTM, and coke) showed reductions in porewater levels at each time. Sand and AquaBlokTM (not shown in figure) caps appeared to be at steady state at 44 months since concentration profiles remained consistent. The concentrations in the coke cap continued to increase after five years. This may be the result of continued surface re-contamination since the coke capped area is close to a combined sewer overflow and showed substantially greater sediment deposition than the other caps. At this point the performance of the active caps is not significantly better than the traditional sand cap. A critical component of the long-term success of active capping is elimination of pollutant sources. The re-contamination and tidal pumping effects negated any potential benefits of the improved containment of the active materials and as a result similar results were seen in each of the caps.

110
Figure 4-48 Transient PAH behavior in Caps. From left to right: PHE, pyrene, BKF. From top to bottom: control area, sand cap, coke and sand cap. Sediment concentrations were relatively consistent over time, and all caps showed reduction in porewater levels. Sand caps appeared to be at steady state at 44 months, while coke concentrations continued to increase after five years.
The relative concentrations in the sand capped area were lower than values measured from the uncapped sediment. Table 4-34 shows the average surficial (top 10 cm) porewater concentrations for each of the seven PAHs at 66 months in the control area and the sand capped area. The concentrations in the sand caps were generally about 70 to 80% lower than in the uncapped area. Greater reduction may be possible with better source control. Table 4-34 Average Surface Porewater Concentrations at 66 months (n = 4)
Compound Control Area (ng/L)
Sand Capped Area (ng/L)
Percent Reduction
PHE 1931 431 77.7% PYR 639 177 72.3% CHR 75.5 23.4 69.0% BAA 48.6 15.5 68.1% BBF 25.2 6.5 74.1% BKF 7.3 1.7 76.5% BAP 8.3 1.9 77.3%

111
Conclusions The results of the monitoring at this site have some important implications. Porewater concentrations were found to be a better predictor of bioaccumulation than solid-phase concentrations on the basis of correlation coefficient (0.81 vs 0.51) as well as absolute prediction accuracy (Average of 0.5 predictions using Kow as BCF vs a factor of about 15). On the basis of solid-phase concentration, it appeared that no significant migration had taken place in the caps. However, using the porewater profiling method, significant concentrations were measured throughout the cap due to migration from the contaminated sediment below and the re-contaminated layer above in both the sand and coke breeze caps. The observed differences between the two methods are attributable to differences in equilibrium partitioning between the various phases. The PDMS profiler was found to be capable of measuring porewater concentration profiles in the field. It appears that the Anacostia caps approached near-equilibrium levels within a few years as a result of surface re-contamination and tidal pumping forces. While the caps may have reached steady state, the observed concentrations in each of the caps were lower than those in the uncapped areas.
4.6. Field measurement of relationship between bioaccumulation in benthic organisms and measured porewater concentrations
The final focus of the demonstration program was demonstration of the relationship between bioaccumulation in benthic organisms and PDMS measured porewater concentrations under field conditions. This is inherently more difficult than in the laboratory due to variability in organisms and their behavior as well as an inability to control environmental conditions. Field measurements of bioaccumulation in various benthic organisms and sediments were shown to correlate with measured porewater concentrations in the near surface sediments. Field measurements were complicated by the dynamics of uptake onto the sorbents, the dynamics of uptake in the organisms and the presence of other stressors in the field. Measured bioaccumulation was generally 20-40% of that predicted by ow pwK C .
These studies were undertaken at four locations as part of the core program and in extensions of the core program in support of activities under SERDP project ER- 1550.
• Anacostia River, Washington, DC • Hunter’s Point, San Francisco, CA • San Diego Harbor, San Diego, CA (in cooperation with ER-1550) • Pensacola Harbor, Pensacola, FL (in cooperation with ER-1550)
Anacostia River, Washington, DC The Anacostia river studies were also used to demonstrate the ability to measure porewater concentration profiles in a sediment cap and both these and bioaccumulation results were discussed in the preceding section. Both bulk solid and measurement porewater concentration were evaluated as a predictor of bioaccumulation. Bulk solid predictions of bioaccumulation were made assuming a biota sediment accumulation factor of approximately 1108, while porewater predictions are based upon the assumption of Kow as the lipid-water partition coefficient.

112
transparent core tubing of cellulose acetate butyrate or Eastman Tenite Butyrate with a 6.67-cm inner diameter, 6.98-cm outer diameter, 0.16-cm wall thickness, and cut to a length of 12.7 cm. Polyethylene closures were used to cap each end. Two 4 X 8 cm rectangular windows were cut on each core tube opposite each other and covered with nylon mesh (usually 74–80 mm). The test organisms used in the experiments was Lumbriculus variegates, a tubificid oligochaete. These organisms are a suitable choice for accumulation experiments as they have sufficient mass for tissue analysis, demonstrate PAH accumulation without significant metabolism, and achieve a steady state concentration in a relatively rapid period of time (Reible and Lu 2000)107. The test organisms were placed into the cages by divers along with a sample of the surficial sediment/cap material at each location. The cages were allowed to equilibrate and later removed by the divers. The worm tissues were then analyzed for contaminant concentrations and lipid content.
The measured tissue concentrations at 36 months were compared to predictions of bioaccumulation based on both solid-phase and porewater concentrations. The organism recovery in the AquaBlok cap was poor and thus it was impossible to measure tissue concentrations, although organism recovery was sufficient in the sand-cap, coke-capped, and control cages. The measured solid-phase concentrations were normalized by the TOC and then plotted against observed lipid-normalized tissue concentrations to assess solid-phase concentrations as a predictor of bioaccumulation. This approach assumes a biota-sediment accumulation factor (BSAF) of unity, or that sediment organic carbon and organism lipids have the same partitioning with the neighboring porewater. Burkhard (2006)108 suggested that BSAF of 1-2 should be expected in sediments that have achieved equilibrium between sediment and organism. The best fit value for the BSAF in this case was 0.068 well below the expected value of unity, presumably due to the phenomena of desorption resistance contaminants.
To predict bioaccumulation using porewater concentrations, the measurements for each of the compounds in the cages were multiplied by the compounds’ respective octanol-water partition coefficients, which -is often used as a surrogate for the lipid-water partition coefficient 82,100. The predicted bioaccumulation values were then plotted against the observed lipid-phase concentrations. Figure 4-49 shows the predictions of bioaccumulation versus observed bioaccumulation based on solid-phase and porewater concentrations.. The bulk solid estimator significantly over-predicted the bioaccumulation in the organism, illustrating that many of the contaminants were not bioavailable. The BSAF value that would be consistent with the observed bioaccumulation would be 0.068. The porewater concentration, however, correlated well with bioaccumulation (r2=0.81 vs 0.51 for solid phase concentrations) and bioaccumulation was predicted much more accurately than by bulk solids (factor of 2 vs a factor of about 15). The average prediction assuming a lipid water partition coefficient is Kow was approximately half the observed bioaccumulation suggesting an observed water-lipid partition coefficient or water-lipid bioaccumulation factor (BCF) of ~2Kow. Lu et al. (2011) observed a lipid water partition coefficient of 1.08 Kow in laboratory studies of bioaccumulation from Anacostia river sediments with a different tubificid oligochaete. The difference may be due to experimental variability or failure to appropriately estimate equilibrium either in the fiber or organism or both.

113
Figure 4-49 Predicted versus measured bioaccumulation. Bioaccumulation predicted by porewater concentrations was within a factor of five of observed values, while predictions based on solid-phase concentrations were generally greater than a factor of five. Error bars represent sample standard deviations.
Hunter’s Point, San Francisco, CA A similar difference between observed and porewater predicted bioaccumulation was noted in the second demonstration with PCBs at Hunter’s Point, San Francisco, CA. This bioaccumulation test was conducted with Neanthes arenaceodentata in cooperation with R.G. Luthy and E.Janssen of Stanford University. The organisms were placed in an intertidal zone in cages similar to those used in the Anacostia and exposed to Hunter’s Point sediment containing total PCBs of approximately 1 mg/kg (0.966 mg/kg). Both untreated cells and cells treated with activated carbon (3.4% activated carbon by dry weight) were deployed. The organisms were exposed for 14 days and then their lipid content and PCB body burden were measured by Stanford personnel using GC-ECD. Both 230/210 and 1060/1000 PDMS was placed in the sediment populated cages for two time periods (14 or 42 days) and retrieved and analyzed at the University of Texas, also be GC-ECD. The analysis parameters were identical except that the Stanford analysis required sample extraction with solvent and cleanup with silica gel. The extraction of the PDMS fibers in the UT analysis was directly into injection solvent without further sample cleanup. Three replicates were collected of all samples. The 42 day data showed a substantial increase in coefficient of variation among replicates compared to the 14 day data (57% vs 26%). The increased variability was believed to be associated with an increased sorption of compounds that interfered with the PCB analysis since no sample cleanup was attempted. Only the 14 day PDMS data was compared to bioaccumulation data due to the larger variability of the 42 day data. Steady state uptake onto the PDMS was predicted from the 14 day measurements based upon a model assuming diffusion controlled transport in the pore space of the sediment. The corrections are shown in Figure 4-50a. The validity of the assumed diffusion was tested by comparison of the predicted equilibrium in the thin (230/210) and thick
0.1
1
10
100
0.1 1 10 100Measured Bioaccumulation (ug/g)
Pred
icte
d B
ioac
cum
ulat
ion
(ug/
g) . Sediment Organic Carbon (Coke)
Sediment Organic Carbon (Sand)
Sediment Organic Carbon (Control)
Pore Water (Coke)
Pore Water (Sand)
Pore Water (Control)
parity
parity/5
parity*5
C lipid = K ow * C w
correlation = 0.81
C lipid = C oc
correlation = 0.51

114
(1060/1000) fiber. This is shown in Figure 4-50b. The slope of near unity suggests that the steady state uptake corrections are valid.
Figure 4-50 - Hunters Point 14 day corrections for steady state PDMS uptake and comparison of correction porewater concentrations (ng/L)
The relationship between body burden (lipid normalized) and PDMS measured porewater concentration is shown in Figure 4-51 for both untreated and activated carbon treated microcosms.
Figure 4-51 - Bioaccumulation as a function of PDMS measured porewater concentration for both untreated (left) and activated carbon treated (right) microcosms
The untreated microcosms show a good agreement with measured porewater concentration although the apparent BCF is about 0.21Kow, less than the approximately unity found in laboratory studies and less than the 0.5Kow found in the Anacostia studies. The apparent BCF in activated carbon treated cells is about 0.3Kow. The scatter in the activated carbon treated cell may reflect substantial concentration uncertainty in porewater concentration due to the low concentration in the activated carbon treatment cells. The coefficient of variation of replicates in the activated carbon treated measurements was about 60% relative to the 26% in the untreated cells. The lipid-normalized bioaccumulation was reduced by 59% between untreated and activated carbon treatments while the measured porewater concentrations were reduced by 83%. The reason for the relatively low value of BCF relative to laboratory studies and the difference between reductions in porewater concentrations and reductions in bioaccumulation may be due to stressors common to both cells in the field or perhaps due to the fact that the PDMS was
y = 1.0147xR² = 0.9728
0
2000
4000
6000
8000
10000
0 2000 4000 6000 8000 10000
Cor
rect
ed C
once
ntra
tion
ng/L
-10
60/1
000
fiber
Corrected Concentration ng/L- 230/210 fiber
0
0.1
0.2
0.3
0.4
0.5
0.6
0.7
0.8
0.9
1
4.0 5.0 6.0 7.0 8.0 9.0
ss c
orre
ctio
n fa
ctor
Log Kow
230/210 PDMS
1060/1000 PDMS
14 day corrections
y = 0.2074xR² = 0.8407
10
100
1000
10000
100 1000 10000 100000Lipi
d no
rmal
ized
bio
accu
mul
atio
n, n
g/g
KowCpw, ng/g
Neanthes BioaccumulationUntreated
y = 0.3043xR² = 0.5304
10
100
1000
10000
100 1000 10000 100000
Lipi
d no
rmal
ized
bio
accu
mul
atio
n, n
g/g
KowCpw, ng/g
Neanthes Bioaccumulation Activated Carbon Treated

115
buried within the sediment layer and organisms are exposed at the sediment water interface and may reflect a more complex exposure scenario than sediment alone.
In this field demonstration, sediment concentrations also correlate with organism bioaccumulation. Figure 4-52 indicates the relationship between sediment concentration (organic carbon normalized) and organism bioaccumulation (lipid-normalized). The slope of the best-fit line is consistent with an effective BSAF of 0.757, close to the accepted equilibrium value of 1-2. This suggests that much of the PCBs may be bioavailable and reversibly sorbed if both porewater concentration and organic carbon normalized bulk solid concentration correlate with bioaccumulation.
The bulk solid concentration cannot describe changes in uptake due to the addition of activated carbon since the solid concentration does not change significantly with treatment. Although the total sediment concentration does not change with the addition of activated carbon, the carbon normalized sediment concentration does change. In this case, 3.4% of activated carbon was mixed into the sediments making a total carbon content of 3.4+1%~4.4%. Figure 4-52 also shows the carbon normalized sediment concentration in the activated carbon treated microcosms and uses that as a predictor of post-treatment bioaccumulation. The ability of carbon normalized sediment concentration to predict bioaccumulation is not general and depends on the contaminant being bioavailable and reversibly sorbed to solids.
Figure 4-52 - Relationship between lipid normalized bioaccumulation and sediment concentration
ER-1550 Field Locations (San Diego and Pennsacola Naval Bases) Two additional field demonstrations of PDMS measurement of porewater concentrations were conducted in cooperation with ER-1550, a project devoted to the development of a sediment ecotoxicity assessment ring, SEA Ring. The SEA Ring employs a variety of organism exposure modules coupled with chemical assessment modules to provide an indication of ecotoxicity of contaminated sediments. Details of the system and its deployment and interpretation can be found in the ER-1550 reports. Only a summary relevant to the PDMS samplers is included here. The PDMS samplers were deployed twice as part of regular deployments of the SEA Ring, in San Diego, CA and in Pensacola, FL.
Naval Base San Diego (NBSD) is the largest Navy base on the west coast of the United Sates, encompassing 13 different piers, and is the principal homeport of 54 ships. Located on San Diego Bay, CA, several pier areas at NBSD have been identified as potentially at risk for aquatic life impacts (SWRCB 2003109). A transect of three contaminated sites between piers at the Naval Base (5 and 6) was selected for evaluation. In addition, a reference site was selected with
y = 0.757xR² = 0.8343
0
2000
4000
6000
8000
10000
12000
0 2000 4000 6000 8000 10000 12000 14000Lipi
d N
orm
aliz
ed B
ioac
cum
ulai
ton,
ng/
g
Organic carbon normalized sediment concentration, ng/g OC
Untreated
y = 1.3552xR² = 0.837
0
1000
2000
3000
4000
5000
0 1000 2000 3000
Lipi
d N
orm
aliz
ed N
eant
hes
bioa
ccum
ulat
ion,
ng/
g
Sediment Concentration, ng/g OC
Activated Carbon Treated

116
low levels of contamination. Bioaccumulation was measured in a 21 day laboratory exposure of the mussel Muscalista. A short term (2 day exposure) in the field yielded inconsistent bioaccumulation data due to a substantial number of non-detects. Chemical measures included porewater measured by PDMS exposed for 2 and 21 days, porewater measured with centrifuged sediment, and bulk solid concentration (normalized by organic carbon). PDMS measurements were analyzed at UT. Centrifuged sediment porewater and tissue bioaccumulation was measured by USACE ERDC.
The PDMS fibers used in this study were 230/210 fibers with a 10 µm PDMS coating on a 210 µm diameter glass core. The fibers were housed in the sheath systems shown in. For the in situ assessment, they were deployed in tandem with the SEA Rings, positioned around perimeter within close (~1-2 inches) proximity to the bioaccumulation exposure chambers. SPME deployment periods were 2 and 21 days. Upon retrieval, the PDMS fibers were immediately cleaned, processed into solvent in 5-cm intervals, and analyzed for PAHs. Figure 4-53 shows the ability of the various measures of porewater concentration to predict the observed bioaccumulation. Because the indicators included in Figure 4-53 represent different exposure periods, three PAHs of similar hydrophobicity were evaluated, benzo[b]fluoranthene, benzo[k]fluoranthene, and benzo[a]pyrene. This eliminates the variability associated with different rates of uptake of compounds of different hydrophobicity.
Figure 4-53 - Correlation of bioaccumulation of BbF, BkF, and BaP with various indicators of availability
R² = 0.8723
0
5
10
15
20
25
30
35
0.0 1.0 2.0 3.0 4.0
Tiss
ue C
once
ntra
tion
(ug/
kg)
Pore Water Concentration (ng/L)
Pore Water Concentration (21 day SPME)
R² = 0.4422
0
5
10
15
20
25
30
35
0.0 100.0 200.0 300.0 400.0 500.0 600.0
Tiss
ue C
once
ntra
tion
(ug/
kg)
Pore Water Concentration (ng/L)
PAH Tissue Correlation Concentration (Centrifugation)
R² = 0.7583
0
5
10
15
20
25
30
35
0.0 0.5 1.0 1.5 2.0
Tiss
ue C
once
ntra
tion
(ug/
kg)
Pore Water Concentration (ng/L)
Pore Water Concentration (2 day SPME)
R² = 0.2703
0
5
10
15
20
25
30
35
0.0 5000.0 10000.0 15000.0 20000.0 25000.0 30000.0
Tiss
ue C
once
ntra
tion
(ug/
kg)
Sediment Concentration (ug/kg OC)
OC Normalized Sediment Concentration

117
As shown by Figure 4-53 the best correlation with tissue bioaccumulation was the in-situ measures of porewater concentration by solid phase microextraction (SPME) with PDMS. The 21 day PDMS exposure was somewhat better than 2 day exposure as a result of differences between uptake kinetics of organisms and the PDMS. Organic carbon normalized sediment concentration did not correlate with tissue bioaccumulation. Porewater concentration, as measured by centrifugation, was weakly correlated with tissue bioaccumulation. In addition, the concentration measured in centrifuged sediment porewater was a factor of 100 higher than that measured by passive sampling. This indicates that centrifugation led to resuspension of solids and colloidal material and artificially higher porewater concentrations due to colloidally bound PAHs. The results indicate again the importance of defining availability by measuring porewater concentration but doing so in a way that does not artificially distort the porewater concentration as apparently occurs by centrifugation.
The final site was the Naval Air Station Pensacola (NASP) Yacht Basin, located at the mouth of Bayou Grande, adjacent to Pensacola Bay, Pensacola, FL. The site is contaminated by a variety of contaminants including PAHs and the SEA Ring was deployed at three test locations (designated NASP 6, 11 and 25 and a reference station, NASP 9). Figure 4-54 summarizes the correlation observed between organic carbon normalized sediment concentration and PDMS measured porewater concentration in both lab and field measurements of short-term (96 hour) bioaccumulation in Leptocheirus plumulosus. The SEA Ring is designed for short deployments although this means that steady state bioaccumulation will not be achieved. Thus only a correlation with measured porewater concentration (or sediment concentration) is sought to define a site specific indicator of relative bioaccumulation. The measured fiber concentration is corrected for disequilibrium to predict the porewater concentration.
The organic carbon normalized sediment concentration provided only a weak correlation suggesting that bioavailability is limited by factors other than simply the amount of organic carbon present. Porewater concentrations, however, appeared to capture the relative bioavailability in that a good correlation was observed between bioaccumulation and that metric. The significance of the nonzero intercept in the correlation may be the presence of PAH elimination mechanisms in the Leptocheirus plumulosus or simply a reflection of detection limits in body burden measurements. Note the substantially higher bioaccumulation amounts in the laboratory studies reflecting the presence of other stressors in the field studies that limited organism uptake. This again suggests that laboratory studies will generally be conservative and often are indicators of potential uptake and bioaccumulation rather than actual bioaccumulation that would be measured in the field.

118
Figure 4-54 Uptake of PAHs from 96 h exposures with the amphipod Leptocheirus plumulosus in both lab (left) and in situ (right). Top figures show comparisons of organism uptake with organic carbon normalized sediment concentrations. Bottom figures show organism uptake relative to SPME-derived porewater concentrations. For simplicity, each data point represents the sum of pyrene, B[a]a, B[b]f, B[k], and B[a]P from each of the four stations.
y = 0.002x + 36.351R² = 0.2145
0
50
100
150
200
250
300
350
400
450
0 20000 40000 60000 80000 100000 120000Sediment Concentration (µg/kg OC)
Tiss
ue C
once
ntra
tion
(µg/
kg) Lab NASP25
NASP6B
NASP9NASP11
y = 0.0007x - 3.9421R² = 0.3085
0
20
40
60
80
100
120
0 20000 40000 60000 80000 100000 120000Sediment Concentration (µg/kg OC)
Tiss
ue C
once
ntra
tion
(µg/
kg) Field
NASP6B
NASP25
NASP9NASP11
y = 14.573x - 81.266R² = 0.9829
0
20
40
60
80
100
120
0 2 4 6 8 10 12 14
Pore water concentration (ng/L)
Tiss
ue C
once
ntra
tion
(µg/
kg)
Field NASP25
NASP6B
NASP9NASP11
y = 49.543x - 248.86R² = 0.9774
0
50
100
150
200
250
300
350
400
450
0 2 4 6 8 10 12 14Pore water concentration (ng/L)
Tiss
ue C
once
ntra
tion
(µg/
kg) Lab
NASP25
NASP6B
NASP9NASP11

119
5. PERFORMANCE ASSESSMENT
As outlined in the Section 3, the detailed performance objectives included
• High analytical accuracy and reproducibility under laboratory conditions • Low detection limits • Estimation of PDMS uptake kinetics • Indicate cap performance • Predict bioaccumulation potential in laboratory in-situ tests • Predict bioaccumulation in field in-situ tests • Ease of application to laboratory in-situ use • Ease of field use • Ease of analysis
A discussion of each of these follows
• High analytical accuracy and reproducibility under laboratory conditions
This performance objective was met by conducting a calibration of the PDMS fiber in prepared water standards using PAHs. Linearity of the resulting calibration for mid-range HOCs was very high with r2>0.99. High molecular weight compounds are also expected to meet this standard although this could not be demonstrated due to the difficulty of preparing and maintaining aqueous standards for very hydrophobic compounds. Coefficients of variation from the resulting linear curve were less than 20% for all PAH compounds except naphthalene. Naphthalene is not concentrated significantly on the PDMS fiber and losses to air are rapid, making it difficult to measure naphthalene via PDMS without increasing PDMS layer volume/thickness. Coefficients of variation by conventional extraction methods were also between 10 and 20% suggesting that the accuracy of the PDMS methods were essentially identical to that expected by conventional methods. PCBs calibrations were not attempted but instead correlations of fiber sorption with hydrophobicity defined in the literature were employed. The literature correlations for PCB sorption versus hydrophobicity as measured by Kow were consistent with extrapolations of such correlations with PAHs. All predictions of fiber-water partition coefficients were found to be within the accuracy of the estimates of Kow (typically 0.2-0.3 log units or a factor of 1.5-2). The effects of salinity and temperature (over 10-25 ºC) were also within this standard of accuracy and corrections for these effects were not attempted.
• Low detection limits
Measured detection limits were well below concentrations typically achievable by conventional analytical methods. Measured method detection limits by fluorescence HPLC ranged from 0.07 µg/L for fluorene to 0.05 ng/L (0.00005 µg/L) for benzo[a]pyrene using only 1 cm of 230/210 PDMS fiber. 1 cm of 1060/1000 fiber would yield detection limits more than 10 times lower. Reductions in detection limits could also be achieved by increasing the length of fiber employed in the measurement. Detection limits for direct injection via fluorescence HPLC ranged from 0.81 to 0.018 µg/L for the same compounds. Thus an extraction/concentration step would require a concentration enhancement of 12 to 1400 to achieve the same detection limits as the

120
PDMS. The direct extraction PDMS method as employed here also achieves detection limits well below comparative low level quality criteria (surface water quality standards).
Detection limits are not significantly lower than that achievable by conventional standards, however, for naphthalene and alkylated naphthalenes. In addition, the strong dependence of detection limit on compound hydrophobicity suggests that this in-situ method may not be appropriate for measurement of sum of PAHs or for analysis of PAH34 which includes many of the compounds that are not effectively measured by an in-situ passive sampling method.
• Estimation of PDMS uptake kinetics
A complication of the in-situ passive sampling method is the need for correction for any deviations from equilibrium. The ability to predict bioaccumulation is dependent upon a state of quasi-equilibrium between sorbent, porewater, solid and biota. The sorbent sampler should be deployed for a time sufficient to achieve equilibrium with the adjacent porewater or corrected to estimate the equilibrium uptake. For PDMS and, under most conditions, POM and PE, the achievement of equilibrium is dependent upon external mass transfer resistances or the time required to re-equilibrate the solids and porewater around the passive sampler. In this work, the use of performance reference compounds such as deuterated PAHs was demonstrated as an alternative, based upon using sorbents with two different surface area to volume ratios (and therefore two different rates of uptake). The ratio of the two was related to the external transport resistances through a simple model and used to estimate or test models of uptake kinetics. The kinetics of uptake of the PDMS is typically more rapid than either POM or PE which may provide advantages in some applications. The accuracy of the kinetic correction decreases as the magnitude of the correction increases. That is a factor of two correction, as was typically observed for a hydrophobic PAH such as benzo[a]pyrene after exposures of 1-2 weeks is potentially much more accurate than a factor of 5-10 that might be required to correct a hydrophobic PCB concentration after a similar period of exposure.
• Indicate cap performance
A major advantage of an in-situ approach is the determination of porewater concentration profiles in the in-situ sediments. Due to the low detection limits of the method, it is possible to measure porewater concentration profiles with high resolution (1 cm). This can be used to evaluate contaminant migration within a cap. In addition, since the method does not depend upon the sorption characteristics of the cap layer, the method can monitor contaminant migration in nonsorbing materials such as sand. This was demonstrated in both laboratory and field measurements at resolutions as low as 1 cm.
• Predict bioaccumulation potential in laboratory in-situ tests
The primary goal of the demonstration was to show that the measured PDMS uptake porewater concentrations can be related to bioaccumulation in benthic organisms and therefore be used as an indicator of bioavailability. In a variety of laboratory tests with different organisms, sediments and PAH and PCB contaminants, the ratio of bioaccumulation to equilibrium uptake in the PDMS was given by Kow within a factor of about 2. The use of porewater concentration to predict bioaccumulation provided a more reliable indicator than solid phase concentration even for deposit feeding organisms where the route of uptake was expected to be through sediment ingestion.

121
• Predict bioaccumulation in field in-situ tests
The use of PDMS to predict bioaccumulation was also extended to field tests. In field tests, caged organisms were used to control exposures although a variety of stressors are encountered in the field that may not be reproduced in laboratory experiments. In field tests, the ratio of bioaccumulation to PDMS measured equilibrium porewater concentration was lower than in laboratory measurements and typically of the order of 0.2-0.5Kow. Good correlations were observed between field measured porewater concentrations and bioaccumulation in caged organisms but the apparent complication of additional field stressors reduced the absolute magnitude of the bioaccumulation. The PDMS measured porewater concentration, however, is typically a better indicator of bioaccumulation than bulk solid concentration or porewater concentration by active means (e.g. centrifugation) which may be in error by orders of magnitude at some sites.
• Ease of application to laboratory in-situ use
The evaluation of the previous performance indicators suggests that PDMS measured porewater concentrations can be an effective means of indicating contaminant migration in caps and predicting potential bioaccumulation. The final qualitative performance indicators are designed to evaluate whether they can be used simply and easily.
Application in the laboratory by the developed method is easily accomplished. The PDMS fibers can be placed in-situ into sediments without shielding and withdrawn and analyzed at any time. Their size (<1 mm diameter) suggest that this can be accomplished with minimal disturbance to the surrounding sediment. Very small fibers may need to be inserted into a septum to aid location and withdrawal. The developed method of segmenting the PDMS fiber, then placing directly into an autosampling vial with insert and 100 200µL of solvent followed by direct injection into an analyzer (GC or HPLC) was demonstrated to be simple and effective. The lack of additional processing steps is a major advantage of the method, avoiding time, cost and potential contaminant losses due to sample cleanup or extraction steps.
• Ease of field use
In the field, PDMS fiber use is more complicated. Sediments can be brought from the subsurface via coring and analyzed on ship or in the laboratory. Placement in-situ in the field, however, would typically require divers and shielded fibers to protect them during placement. The developed system was found to be easy to deploy in all but the most difficult of subsurface environments (e.g. sediments armored by rock). Deployment remotely from the surface is possible but this was not fully developed or tested by the demonstration. The primary difficulty is ensuring proper vertical placement, particularly in soft sediments where the lack of resistance of the sediment makes it difficult to define the sediment-water interface. Retrieval by divers or remotely by simply withdrawing an attached line was demonstrated and proved easy to implement in all environments. Processing of PDMS fibers onshore by sectioning and placing into autosampling vials with inserts prefilled with 100-200 µL of solvent proved to be an effective processing method. These stabilized samples could then be shipped back to the laboratory for analysis without concerns for an sample degradation during transit.

122
• Ease of analysis
As indicated above, a major advantage of the PDMS passive sampling approach for measurement of porewater is the lack of additional sample processing. The sectioned PDMS fibers inserted into solvent filled autosampling vials can be analyzed directly. This was found to be sufficient at all sites except for 42 day samples deployed at Hunter’s Point. High variability in these samples may have been due to the sorption of other compounds, in this case sulfur compounds, that interfered with PCB analysis. One possible approach may have been to add a small amount of activated copper to the sample vials in this case to eliminate these compounds, but this was not attempted. In general, however, the direct extraction onto the PDMS fiber followed by extraction into injection solvent was sufficient to eliminate other interfering compounds.

123
6. COST ASSESSMENT
6.1. COST MODEL
In-situ sediment monitoring with PDMS
Cost Model (Basis 1 m of PDMS unless noted)
Cost Element Cost Items Estimated Costs
Fabrication of PDMS
Cost of third party fabrication
250 m length
500 m length
$26.80/m
$17.40/m
Fabrication of shielding system
Cost of Henry’s style probes
Machining modifications
Probe cost
Machining – 2 hrs/m
$200/m
$100/m
Predeployment processing of PDMS
PDMS length cleaning
Loading in shielded system
Shipment to site
Lab technician- 1 hr/m
Shipment
$50/m
$100
Deployment Divers and field support
Diving team – 1 day/site
Field support – 2 person-days/site
$2000
$2000
Retrieval Divers (optional)
Field support team
Autosampling vials with solvent
Field support team- 2 person-days/site
Consumables
Shipment
$2000
$100/m
$100
Lab Analysis Commercial laboratory costs
$100/sample, 10 samples/m $1000/m
Interpretation Kinetics and analysis Senior analyst, 80 hrs/site
Associate analyst 80 hrs/site
$8000
$4000
TOTAL Per site -
20 PDMS profilers deployed
10 PDMS profiles, 5 samples/m
Assume 1 m/sample
$47,736
$28,236

124
6.2. COST DRIVERS and ANALYSIS
The cost is largely driven by the costs of chemical analysis and interpretation (kinetics evaluation) of the resulting chemical data. The chemical analysis is equal to or less than the cost of conventional analysis due to the lack of requirements for sample processing during analysis. Interpretation, however, includes interpretation of the deviation from steady state and this may require some additional chemical analyses (e.g. deuterated compounds) or additional samples (to evaluate multiple sorbent fibers at a particular location). Neither requirement adds appreciably to the chemical analysis requirements per sample since performance reference compounds are chosen to avoid interference with chemical analysis (e.g. deuterated PAHs can be quantified in the same analyses as conventional PAHs).
Additional costs are associated with divers for placement of samplers. This would not be a cost associated with samples retrieved in conventional or box cores and monitored in the laboratory by PDMS. In-situ field placement, however, is best conducted using divers to ensure good control over location and depth of placement.

125
7. IMPLEMENTATION ISSUES
The primary difficulties associated with the technology are the time and cost of deployment and the complexities of interpretation of the results. Deployment may involve divers for both placement and retrieval (although alternative approaches exist with some limits in attainable objectives) and long delay times between placement and retrieval (7-28 days). Expert knowledge is required to appropriately balance considerations such as achievable detection limit and rate of attainment of equilibrium. Failure to accurately assess polymer uptake kinetics and the degree of equilibration with a given exposure can significantly limit the applicability of the results.
At the current time, fabrication of appropriate PDMS fibers (selection of PDMS layer thickness and core thickness) requires expert knowledge to optimize for detection limits and kinetics of uptake. Although commercial fabricators can manufacture the fiber, there are no off-the-shelf fibers available for typical sediment bioavailability testing. There are also no commercial laboratories or consultants that can be hired to accomplish a turnkey sampling operation.
There is, however, growing recognition of the value of the collected porewater data and there is increasing requests for such analyses. Currently such analyses are being conducted by the developers of the technology in cooperation with these groups. Although no regulatory standards currently exist for porewater information, surface water quality standards are being increasingly used as a comparative standard for the collected porewater concentration data. While conservative, the application of surface water quality standards to porewater is likely to be protective of environmental and human health. Increasing availability of both porewater data and a framework for its use and evaluation ensures that the technology will grow and that laboratories and consultants will ultimately be able to provide this service in lieu of the technology developers.

126
REFERENCE
1 Hansen, D.J., D. M. DiToro, J.A. McGrath, R.C.Swartz, D.R. Mount, R.L. Spehar, R.M. Burgess, R.J. Ozretich, H.E. bell, M.C. Reiley,T.K. Linton. 2003. Procedures for the Derivation of Equilibrium Partitioning Sediment Benchmarks (ESBs) for the Protection of Benthic Organisms:PAH Mixtures, E PA/600/R-02/013 2 Lu, X.X, D. D. Reible, J.W. Fleeger, and Y.Z. Chai. 2003. “Bioavailability of Desorption –Resistant Phenanthrene to the Oligochaete Ilyodrilus templetoni” Environmental Toxicology and Chemistry, 22, 153-160. 3 Lu, X.X., D. D. Reible, J. W. Fleeger. 2004. Relative Importance of Ingested Sediment Versus Pore Water Uptake Routes for PAHs to the Deposit-Feeding Oligochaete Ilyodrilus templetoni, Archives of Environmental Contamination and Toxicology, 47(2) 207-214. 4 Lu, X., D.D. Reible, J.W. Fleeger. 2006. Bioavailability of Polycyclic Aromatic Hydrocarbons in Field-Contaminated Anacostia River (Washington, DC) Sediment, Environmental Toxicology and Chemistry, 25, 11, 2869-2874. 5 Kraaij R, Mayer P, Busser FJM, Bolscher MVH, Seinen W, Tolls J. 2003. Measured pore-water concentrations make equilibrium partitioning work-a data analysis. Environ Sci Technol 37:268-274. 6 Vinturella, A.E., R.M. Burgess, B.A. Coull, K.M. Thompson and J.P. Shine. 2004. Use of passive samplers to mimic uptake of polycyclic aromatic hydrocarbons by benthic polychaetes, Environ. Sci. Technol., 38(4) 1154-1160. 7 Zimmerman, J.R., Ghosh, U., Millward, R.N., Bridges, T.S., Luthy, R.G. 2004. “Addition of Carbon Sorbents to Reduce PCB and PAH Bioavailability in Marine Sediments: Physicochemical Tests,” Environmental Science & Technology, 38(20):5458-5464. 8 Carr S, and M Nipper, eds. 2003. Porewater Toxicity Testing: Biological, Chemical, and Ecological Considerations. Pensacola, FL: Society for Environmental Toxicology and Chemistry. 9 Hawthorne SB, CB Grabanski, DJ Miller, and JP Kreitinger. 2005. “Solid-Phase Microextraction Measurement of Parent and Alkyl Polycyclic Aromatic Hydrocarbons in Milliliter Sediment Pore Water Samples and Determination of KDOC Values.” Environmental Science and Technology. 39: 2795-2803. 10 Mayer PW, Vaes WHJ, Wijnker F, Legierse KCH, Kraaij R, Tolls J, Hermens JLM. 2000. Sensing dissolved sediment pore water concentrations of persistent and bioaccumulative pollutants using disposable solid-phase microextraction fibers. Environ Sci Technol 34:5177-5183. 11 Conder, J.M, T. W. LaPoint, G.R. Lotufo, J.A. Steevens, (2003) Nondestructive, minimal-distubance, direct-burial solid-phase microextraction fiber technique for measuring TNT in sediment, Environ. Sci. and Technol. 37, 1625-1632. 12 Long, E.R., D.D. MacDonald, S.L. Smith, F.D. Calder. 1995. Incidence of Adverse Biological Effects Within Ranges of Chemical Concentrations in Marine and Estuarine Sediments, Environmental Management 19, No. 1, 81-97 13 Mayer P, Vaes WHJ, Hermens JLM. 2000. Absorption of hydrophobic compounds into the poly(dimethylsiloxane) coating of solid-phase microextraction fibers: high partition coefficients and fluorescence microscopy images. Anal Chem 72: 459-464. 14 Mackay D, Shiu WY, Ma KC. 1992. Illustrated Handbook of Physical-Chemical Properties and Environmental Fate for Organic Chemicals. Lewis, Boca Raton, FL, USA. 15 Hawker DW, Connell DW. 1988. Octanol-water partition coefficients of polychlorinated biphenyl congeners. Environ Sci Technol 22: 382-387. 16 Gschwend, P.M, J. K. MacFarlane, D.D. Reible, X. Lu, S.B. Hawthorne, D. V. Nakles, and T. Thompson. 2011.
Comparison of PDMS-, POM- and LDPE-based polymeric samplers for accurately assessing PCBs in sediment pore waters , Environ. Toxicology and Chemistry, 30, 6,1288–1296,

127
17 Lu, X., B. Drake, A. Skwarski, D. Reible, Predicting bioavailability of PAHs and PCBs with pore water concentrations measured by disposable solid-phase micro-extraction fibers, Environ. Toxicology and Chemistry, 30, Issue 5, May 2011, Pages: 1109–1116 (2011). 18 Huckins, J. N.; Petty, J. D.; Lebo, J. A.; Almeida, F. V.; Booij, K., Alvarez, D. A., Cranor, W. L., Clark, R. C., and Mogensen, B. B. 2002. “Development of the permeability/performance reference compound approach for in situ calibration of semipermeable membrane devices,” Environmental Science & Technology, 36(1):85-91. 19 Lampert, D.J., W.V. Sarchet, D.D. Reible. 2011. Assessing the Effectiveness of Thin-Layer Sand Caps for Contaminated Sediment Management through Passive Sampling, in press, Environ. Sci Technol. 20 Reible, D.D., D. Lampert, W. D. Constant, R.D. Mutch, and Y. Zhu. 2006. Active Capping Demonstration in the Anacostia River, Washington, DC, Remediation: The Journal of Environmental Cleanup Costs, Technologies and Techniques, 17, 1 21 McDonough, K.M., P. Murphy, J. Olsta, Y. Zhu, D. Reible, G. Lowry. 2007. Development and Placement of a Sorbent-amended Thin Layer Sediment Cap in the Anacostia River, Journal of Soil and Sediment Remediation 16:3, 313-322 22 Barth, E., D. Reible and A. Bullard. 2008. Evaluation of the physical stability, groundwater seepage control, and faunal changes associated with an AquaBlok® sediment cap, Remediation: The Journal of Environmental Cleanup Costs, Technologies and Techniques, 18, 4, Fall, 63-70. 23 Burton, G.A., Greenberg, M.S., Rowland, C.D., Irvine, C.A., Lavoie, D.R., Brooker, J.A., Moore, L., Raymer, D.F.N., McWilliam, R.A. 2005. “In situ exposures using caged organisms: a multi-compartment approach to detect aquatic toxicity and bioaccumulation,” Environmental Pollution, 134:133-144. 24 Mackay D, Shiu WY, Ma KC. 1992. Illustrated Handbook of Physical-Chemical Properties and Environmental Fate for Organic Chemicals. Lewis, Boca Raton, FL, USA. 25 Hawker DW, Connell DW. 1988. Octanol-water partition coefficients of polychlorinated biphenyl congeners. Environ Sci Technol 22: 382-387. 26 Reible, D.D., G. Lotufo, Lab Demonstration Plan-Summary and Results, ER-0624- Demonstration and Evaluation of Solid Phase Microextraction for the Assessment of Bioavailability and Contaminant Mobility, Report to ESTCP. 27 Lampert, DJ. 2010. An assessment of the design of in situ management approaches for contaminated sediments, PhD thesis. University of Texas at Austin, Austin, TX, USA 28 Millington, R.J., and Quirk, J.M. 1961. Permeability of Porous Solids. Trans. Far. Soc., 57, 1200-1207. 29 Boudreau, B. 1997. Diagenetic Models and Their Implementation: Modeling Transport Reactions in Aquatic Sediments. Springer-Verlag, New York. 30 Baker J R, Mihelcic JR, Luehrs DC, Hickey JP. 1996. Evaluation of estimation methods for organic carbon normalized sorption coefficients. Water Environ Res 69: 136-145. 31 Paine MD, Charman PM, Allard PJ, Murdoch MH, Minifie David. 1996. Limited bioavailability of sediment PAH near an aluminum smelter: contamination does not equal effects. Environ Toxicol Chem 15:2003-2018. 32 Di Toro DM, Zarba CS, Hansen DJ, Berry WJ, Swartz RC, Cowan CE, Pavlou SP, Allen HE,Thomas NA, Paquin PR, Zarba, CS, Hansen DJ, Berry WJ, Swartz RC. 1991. Technique basis for establishing sediment quality criteria for nonionic organic chemicals using equilibrium partitioning. Environ Toxicol Chem 10: 1541-1583 33 Kraaij R, Mayer P, Busser FJM, Bolscher MVH, Seinen W, Tolls J. 2003.
Kraaij R, Mayer P, Busser FJM, Bolscher MVH, Seinen W, Tolls J. 2003. Measured pore-water concentrations make equilibrium partitioning work-a data analysis. Environ Sci Technol 37:268-274. 34 Lu XX, Reible DD, Fleeger JW. 2006. Bioavailability of polycyclic aromatic hydrocarbons in field-contaminated Anacostia river (Washington DC) sediment. Environ Toxicol Chem 25:2869-2874.

128
35 You J, Landrum PF, Lydy MJ. 2006. Comparison of chemical approaches for assessing bioavailability of sediment-associated contaminants. Environ Sci Technol 40:6348-6353. 36 U.S. Environmental Protection Agency. 2004. Methods for the derivation of site-specific equilibrium partitioning sediment guidelines (ESGs) for the protection of benthic organisms: nonionic organics. EPA/822/R/02/042. Office of Science and Technology, Washington, DC. 37 U.S. Environmental Protection Agency. 2000. Technical Basis for the Derivation of Equilibrium Partitioning Sediment Quality Guidelines (ESGs) for the Protection of Benthic Organisms. EPA-822-R-00-001. Office of Science and Technology, Washington, DC. 38 Carr RS, Chapman DC. 1995. Comparison of Methods for Conducting Marine and Estuarine Sediment Porewater Toxicity Tests: Extraction, Storage, and Handling Techniques. Arch Environ Contam Toxicol 28: 69-77 39 Baker JE, Capel PD, Elsenrelch SJ. 1996. Influence of colloids on sediment-water partition coefficients of polychlorobiphenyl congeners in natural waters. Environ Sci Technol 20:1136-1143. 40 McCarty JF, Jimenez BD. 1985. Interactions between polycyclic aromatic hydrocarbons and dissolved humic material: binding and dissociation. Environ Sci Technol 19: 1072-1076. 41 Resendes J, Shiu WY, Mackay D. 1992. Sensing the fugacity of hydrophobic organic chemicals in aqueous systems. Environ Sci Technol 26:2381-2387. 42 Ghosh U, Weber AS, Jensen JN, Smith JR. 2000. Relationship between PCB desorption equilibrium, kinetics, and availability during land biotreatment. Environ Sci Technol 34:2542-2548. 43 Huckins JN, Tubergen MW, Manuweera GK. 1990. Semipermeable membrane devices containing model lipid: a new approach to monitoring the bioavailability of lipophilic contaminants and estimating their bioconcentration potential. Chemosphere 20:533-552. 44 Verhaar HJM, Busser FJM, Hermens JLM. 1995. Surrogate parameter for the baseline toxicity content of contaminated water: simulating the bioconcentration of mixtures of pollutants and counting molecules. Environ Sci Technol 29:726-734. 45 Jonker MTO, Koelmans AA. 2001. Polymethylene solid-phase extraction as a partitioning method for hydrophobic organic chemicals in sediment and soot. Environ Sci Technol 35:3742-3749. 46 Fernandez LA, MacFarlane JK, Tcaciuc AP, Gschwend PM. 2009. Measurement of freely dissolved PAH concentrations in sediment beds using passive sampling with low density polyethylene strips. Environ Sci Technol 43:1430-1436. 47 Maruya KA, Zeng EY, Tsukada D, Bay SM. 2009. A passive sampler based on solid-phase microextraction for quantifying hydrophobic organic contaminants in sediment pore water. Environ Toxicol Chem 28:733-740. 48 Ter Laak TL, Barendregt A, Hermens JLP. 2006. Freely dissolved pore water concentrations and sorption coefficients of PAHs in spiked, aged and field-contaminated soils. Environ Sci Technol 40:2184-2190. 49 van der War L, Jager T, Fleuren RHLJ, Barendregt A, Sinnige TL, van Gestel CAM, Hermens JLM. 2004. Solid phase microextraction as a tool to predict internal concentrations of soil contaminants in terrestrial organisms after exposure to a field-contaminated soil. Environ Sci Technol 38: 4842-4848. 50 Conder JM, Point TWL. 2005. Solid-phase microphase extraction for predicting the bioavailability of 2,4,6-trinitrotoluene and its primary transformation products in sediment and water. Environ Toxicol Chem 24:1059-1066. 51 Arthur CL, Pawliszyn J. 1990. Solid phase microextraction with thermal desorption using fused silica optical fibers. J Anal Chem 62:2145-2148. 52 Fernandez LA, Harvey CF, Gschwend PM. 2009b. Using performance reference compounds in polyethylene passive samplers to deduce sediment pore water concentrations for numerous target chemicals. Environ Sci Technol 43: 8888-8894 53 U.S. Environmental Protection Agency. 1986. Test methods for evaluating solid waste physical/chemical methods, 3rd ed. Method 8082. SW-846. Office of Solid Waste and Emergency Response, Washington, DC.

129
54 Froese KL, Verbrugge DA, Ankley GT, Niemi GJ, Larsen CP, Giesy JP. 1998. Bioaccumulation of polychlorinated biphenyls from sediments to aquatic insects and tree swallow eggs and nestlings in Saginaw bay, Michigan, USA. Environ Toxicol Chem 17: 484-492. 55 American Society for Testing and Materials. 1997. Standard guide of the bioaccumulation of sediment-associated contaminants by benthic invertebrates. E 1688-97a. In Annual Book of ASTM Standards, Vol 11.05. Philadelphia, PA, pp 1075-1124. 56 Lampert, DJ. 2010. An assessment of the design of in situ management approaches for contaminated sediments, PhD thesis. University of Texas at Austin, Austin, TX, USA 57 Fernandez LA, Harvey CF, Gschwend PM. 2009b. Using performance reference compounds in polyethylene passive samplers to deduce sediment pore water concentrations for numerous target chemicals. Environ Sci Technol 43: 8888-8894 58 Mackay D. 1982. Correlation of Bioconcentration Factors. Environ Sci Technol 16: 274-278. 59 Lu XX. 2003. Bioavailability and bioaccumulation of sediment-associated desorption-resistant fraction of polycyclic aromatic hydrocarbon contaminants, PhD thesis. Louisiana State University, Baton Rouge, LA, USA. 60ARP HPH, Breedveld GD, Cornelissen G. 2009. Estimating the in situ sediment-porewater distribution of PAHs and chlorinated Aromatic hydrocarbons in anthropogenic impacted sediments. Environ Sci Technol 43:5576-5585. 61 McGroddy SE, Farrington JW, Gschwend PM. 1996. Comparison of the in-situ and desorption sediment-water partitioning of polycyclic aromatic hydrocarbons and polychlorinated biphenyls. Environ Sci Technol 30:172-177 62 Gustafsson Ö, Haghseta F, Chan C, Macfarlane J, Gschwend PM. 1997. Quantification of the dilute sedimentary soot phase: implications for PAH speciation and bioavailability. Environ Sci Technol 31: 203-209. 63 Lu XX, Reible D D, Fleeger JW. 2004. Relative Importance of Ingested Sediment Versus Pore Water Uptake Routes for PAHs to the Deposit-Feeding Oligochaete Ilyodrilus templetoni. Arch Environ Contam Toxicol 47: 207-214. 64 U.S. Environmental Protection Agency. 1994. Methods for measuring the toxicity of sediment-associated contaminants with estuarine and marine amphipods. EPA-600/R-94/025. Narragansett, RI. 65 U.S. Environmental Protection Agency. 2000. Methods for measuring the toxicity and bioaccumulation of sediment-associated contaminants with freshwater invertebrates. Second edition. EPA-600/R-99/064. Duluth, MN. 66 Millward RN, Bridges TS, Ghosh U, Zimmerman JR, Luthy RG. 2005. Addition of activated carbon to sediments to reduce PCB bioaccumulation by a polychaete (Neanthes arenaceodentata) and an amphipod (Leptocheirus plumulosus). Environ Sci Technol 39:2880-2887. 67 Lawrence AL, Mason RP. 2001. Factors Controlling the Bioaccumulation of Mercury and Methylmercury by the Estuarine Amphipod Leptocheirus plumulosus. Environ Pollut 111:217-231. 68 ASTM. 2007. Standard Guide For Conducting Sediment Toxicity Tests With Marine And Estuarine Polychaetous Annelids. E 1611 - 00. ASTM International, West Conshohocken, PA. 69 Lee JS, Lee JH. 2005. Influence of acid volatile sulfides and simultaneously extracted metals on the bioavailability and toxicity of a mixture of sediment-associated Cd, Ni, and Zn to polychaetes Neanthes arenaceodentata. Sci Total Environ 338:229-241. 70 ASTM. 2010. Standard Guide for Determination of the Bioaccumulation of Sediment Associated Contaminants by Benthic Invertebrates. E 1688-10. ASTM International, West Conshohocken, PA, pp. 1-57. 71 Hylleberg J, Gallucci VV. 1975. Selectivity in Feeding by the Deposit-Feeding Bivalve Macoma nasuta. Mar Biol 32:167-178. 72 Mount DR, Dawson TD, Burkhard LP. 1999. Implications of Gut Purging for Tissue Residues Determined in Bioaccumulation Testing of Sediment With Lumbriculus variegatus. Environ Toxicol Chem 18:1244-1249.

130
73 Thoma, G.J.; Reible, D.D.; Valsaraj, K.T.; and Thibodeaux, L.J. Efficiency of Capping Contaminated Bed Sediments In Situ. 2. Mathematics of Diffusion-Adsorption in the Capping Layer. Environ. Sci. Technol., 1993, 27:2412-2419. 74 Wang, X.Q.; Thibodeaux, L.J.; Valsaraj, J.T.; and Reible, D.D. Efficiency of Capping Contaminated Bed Sediments In Situ. 1. Laboratory-Scale Experiments on Diffusion-Adsorption in the Capping Layer. Environ. Sci. Technol., 1981, 18:395-403. 75 Zeman, A.J. and Patterson, T.S. Preliminary Results of Demonstration Capping Project in Hamilton Harbour. Water Qual. Res. J. Can., 1997, 32(2):439-452. 76 Reible, D.D.; Lampert, D.J.; Constant, D.; Mutch, R.; and Zhu, Y. Active capping demonstration in the Anacostia River in Washington DC. Remediation, 2006, 17:39-53. 77 Sediment Dredging at Superfund Megasites: Assessing the Effectiveness, United States National Research Council: Washington, DC, 2007. 78 Boudreau, B. Diagenetic Models and Their Implementation: Modeling Transport Reactions in Aquatic Sediments; Springer-Verlag, New York, 1997. 79 Boudreau, B. Mean mixed depth of sediments: the wherefore and why. Limnol Oceanogr., 1998, 43:524-526. 80 Rhoads, D.C. and Germano, J.D., Characterization of organism-sediment relations using sediment profile imaging: an efficient method of remote ecological monitoring of the seafloor (RemotsTM System). Mar. Ecol., 1982, 8:115-128. 81 Reible, D.D.; Popov, V.; Valsaraj, K.T.; Thibodeaux, L.J.; Lin, F.; Dikshit, M.; Todaro, M.A.; and J.W. Fleeger. Contaminant Fluxes from Sediment Due to Tubificid Oligachaete Bioturbation. Water Res., 1996, 30:704-714. 82 Doucette, W.J. Quantitative structure-activity relationships for predicting soil-sediment sorption coefficients for organic chemicals. Envir. Toxicol. Chem., 2003, 22:1771–1788. 83 Burton, G.A. Assessing the toxicity of freshwater sediments. Envir. Toxicol. Chem., 1991, 10:1585-1627. 84 Accardi-Dey, A. and Gschwend, P.M. Assessing the combined roles of natural organic matter and black carbon as sorbents in sediments. Environ. Sci. Technol., 2002, 36:21-29. 85 Kan, A.T.; Fu, G.; Hunter, M.A.; Tomson, M.B. Irreversible sorption of naphthalene and tetrachlorobiphenyl to Lula and surrogate sediments. Environ. Sci. Technol., 1997, 31:2176-2185. 86 Meloche, L.M; deBruyn; A.M.H.; Otton, S.V.; Ikonomou, M.G.; and Gobas, F.A.P.C. Assessing exposure of sediment biota to organic contaminants by thin-film solid phase microextraction. Envir. Toxicol. Chem., 2009, 28:247–253. 87 Schaffner, L.C.; Dickhut, R.M.; Mitra, S.; Lay, P.W.; and Brouwer-Riel, C. Effects of Physical Chemistry and Bioturbation by Estuarine Macrofauna on the Transport of Hydrophobic Organic Contaminants in the Benthos. Environ. Sci. Technol., 1997, 31:3120-3125. 88 Valsaraj, K. and Sojitra, I. Transport of hydrophobic organic compounds by colloids through porous media 3. Diffusion from sediment pore water to overlying water in laboratory microcosms. Colloids and Surfaces A: Physicochemical and Engineering Aspects, 1997, 2:125-133. 89 Hedges, J.L. and Stern, J.H. Carbon and Nitrogen Determination of Carbonate-Containing Solids. Limnol. Oceanogr., 1984, 29:657–663. 90 Harris D.; Horwath, W.; and van Kessel, C. Acid Fumigation of Soils to Remove Carbonates Prior to Total Organic Carbon or CARBON-13 Isotopic Analysis. Soil Sci. Soc. Am. J., 2001, 65:1853–1856. 91 Herbes, S.E. and Allen, C.P. Lipid Quantification of Freshwater Invertebrates: Method Modification for Microquantification. Can. J. Fish. Aquat. Sci., 1983, 40:1315-1317.

131
92 Reible, D., Lutofo, G., Skwarski, A., Lampert, D., Lu, X. Demonstration and Evaluation of Solid Phase Microextraction for Assessment of Bioavailability and Contaminant Mobility, Environmental Security Technology Certification Program Project ER-0624 Lab Demonstration Final Report, June 2008. 93 Mohanty, S., Reible, D.D., Valsaraj, K.T., and Thibodeaux, L.J. A physical model for the simulation of bioturbation and its comparison to experiments for oligochaetes. Estuaries, 1998, 21:255-262. 94 Crank J. The Mathematics of Diffusion; Oxford University Press, London, 1975. 95 Millington, R.J. and Quirk, J.M. Permeability of Porous Solids. T. Faraday Soc., 1961, 57:1200-1207. 96 Hayduk, W. and Laudie, H. Predicting diffusion coefficients for nonelectrolytes in dilute aqueous solutions. AIChE J., 1974, 20:611. 97 Schwarzenbach, R.P.; Gshwend, P.M.; and Imboden, D.M. Environmental Organic Chemistry, 2nd Edition; Wiley & Sons, Hoboken, New Jersey, 2003. 98 Lampert, D.J. and Reible, D.D. An Analytical Modeling Approach for Evaluation of Capping of Contaminated Sediments. Soil Sediment Contam., 2009, 18(4):470-488. 99 Curtis, G.; Reinhard, M.; and Roberts, P. Sorption of Hydrophobic Organic Compounds by Sediments. In Geochemical Processes at Mineral Surfaces; American Chemical Society, Washington DC, 1986. 100 Chiou, C.T.; Freed, V.H.; Schmedding, D.W.; and Kohnert, R.L. Partition Coefficient and Bioaccumulation of Selected Organic Chemicals. Environ. Sci. Technol., 1977, 11(5):475-478. 101 MacKay, D. Correlation of bioconcentration factors. Environ. Sci. Technol., 16:274–278, 1982. 102 Thibodeaux, L.J. and Bosworth, W.S. 1990. “A Theoretical Evaluation of the Effectiveness of Capping PCB Contaminated New Bedford Harbor Bed Sediment, Final Report,” Hazardous Waste Research Center, Louisiana State University, Baton Rouge, LA. 103 Murphy, P., Marquette, A., Reible, D., and Lowry G.V. 2006. “Predicting the Performance of Activated Carbon-, Coke-, and Soil-Amended Thin Layer Sediment Caps,” Journal of Environmental Engineering, 132(7):787-794. 104 Reible, D.D., Lampert, D.J., Constant, D., Mutch, R., Zhu, Y. 2006. “Active capping demonstration in the Anacostia River in Washington DC,” Remediation Journal, 17:39-53. 105 McDonough, K., Murphy, P., Olsta, J. Zhu, Y., Reible, D., Lowry, G. 2007. “Development of a Sorbent-Amended Thin Layer Sediment Cap in the Anacostia River,” Soil & Sediment Contamination, 16(3):313-322. 106Futoma, D.J, Smith, S.R., Smith, T.E., and Tanaka, J. 1981. Polycyclic Aromatic Hydrocarbons in Water Systems. CRC Press, Boca Raton, FL, USA. 107 Reible, D.D. and Lu, X. 2000. “Desorption, Accumulation, and Elimination of Sediment Associated Phenanthrene and Benzo[a]Pyrene to a freshwater oligochaete,” Ecotoxicology, 2nd International Symposium on Contaminated Sediments, 319-324. 108 Burkhard, L 2006. Estimation of biota sediment accumulation factor (bsaf) from paired observations of chemical concentrations in biota and sediment, EPA/600/R-06/047. 109 SCCWRP and SSC San Diego 2005. Sediment Assessment Study for the Mouths of Chollas and Paleta Creek, San Diego. Phase 1 Final Report. Prepared by the Southern California Coastal Water Research Project and Space and Naval Warfare Systems Center (SSC) San Diego. For San Diego Regional Water Quality Control Board and Commander Navy Region Southwest. May 2005. 200 pp.