demography dynamics: factors affecting number of...
TRANSCRIPT

Journal of Family Medicine and Health Care 2016; 2(4): 119-131
http://www.sciencepublishinggroup.com/j/jfmhc
doi: 10.11648/j.jfmhc.20160204.25
ISSN: 2469-8326 (Print); ISSN: 2469-8342 (Online)
Demography Dynamics: Factors Affecting Number of Offspring and Male to Female Ratio in Greece
George I. Lambrou1, *
, Maria Braoudaki1, 2
, Eleni Papanikolaou3, Anna Tagka
4
1First Department of Pediatrics, Choremeio Research Laboratory, National and Kapodistrian University of Athens, Athens-Goudi, Greece 2University Research Institute for the Study and Treatment of Childhood Genetic and Malignant Diseases, National and Kapodistrian
University of Athens, «Aghia Sophia» Children’s Hospital, Athens, Greece 3Division of Endocrinology, Metabolism and Diabetes, University of Athens Medical School, “Eugenideion” Hospital, Athens, Greece 4Department of Dermatology, University of Athens Medical School, Andreas Syggros Hospital, Athens, Greece
Email address: [email protected] (G. I. Lambrou), [email protected] (M. Braoudaki), [email protected] (E. Papanikolaou),
[email protected] (A. Tagka) *Corresponding author
To cite this article: George I. Lambrou, Maria Braoudaki, Eleni Papanikolaou, Anna Tagka. Demography Dynamics: Factors Affecting Number of Offspring and
Male to Female Ratio in Greece. Journal of Family Medicine and Health Care. Vol. 2, No. 4, 2016, pp. 119-131.
doi: 10.11648/j.jfmhc.20160204.25
Received: August 23, 2016; Accepted: November 30, 2016; Published: December 30, 2016
Abstract: Background: Population models assume that parents make investment decisions that maximize reproductive
success in the face of limited resources. Aim: The aim of the current study was to investigate the dynamics of offspring and the
patterns of male to female ratio in the urban area of Athens. In addition, the role of socioeconomic factors to their dynamics
was examined. The study was conducted in the urban area of Athens. The target group consisted of children in the area’s
kindergartens. A total of 435 single parents or parent couples were investigated with respect to their socioeconomic background
and the number of children. Result: The main factors affecting the number of children included the income which was
influenced by both education and nationality. At the same time, nationality appeared to play a significant role in the male to
female ratio with mixed couples manifesting the largest ratio. Conclusions: To the best of our knowledge, this is the first work
in the literature examining the dynamics of offspring by calculating the effects of socioeconomic factors such as education,
income and nationality. At the same time, such works are extremely important both towards the understanding of population
dynamics but also towards policy making, which includes both demographical and fiscal policies.
Keywords: Demography, Greece, Socioeconomics, Number of Offspring, Male to Female Ratio
1. Introduction
Population models assume that parents make investment
decisions that maximize reproductive success in the face of
limited resources [1]. In other words, when certain
constraints are met such as energy, effort or time invested in
the provisioning of offspring, then it is difficult to invest in
the production of additional offspring [2]. As a consequence,
one of the life's most fundamental trade-offs is between the
number and the size of offspring [3]. In order to put it more
simply, parents produce offspring based on certain criteria,
which probably vary on current socioeconomic conditions.
During the time period of 2004-2006, a study was
conducted in the urban area of Athens and in particular in the
area’s kindergartens. The purpose of this study was to
investigate the pediculosis rates among children living in that
area. As a consequence, the data collected from this study
produced information for another report, which included the
investigation of patterns in offspring numbers. In other
words, it led to an investigation focusing on socioeconomic
factors influencing the number of children per family [4].
In the area of population dynamics, there are two main
categories to could potentially be investigated. The first is the
population growth or decline per se and the second is the male
to female ratio. In particular, this affords the secondary ratio
since the primary one consists of the child’s gender at

120 George I. Lambrou et al.: Demography Dynamics: Factors Affecting Number of Offspring and
Male to Female Ratio in Greece
conception [5]. Both phenomena, despite the simplicity of their
nature, can manifest very complicated dynamics, since
population growth is tightly linked not only to the availability
of resources but also to other social and economic factors. For
example, it is of interest that Greece has gone through several
recession periods during its history, as well as periods of
expansionary fiscal policies, which have influenced the birth
rate. At the same time, the mean age of the Greek population
tends to rise, indicating a decline in the rate of births, attributed
to several socioeconomic factors [6]. It is noteworthy, that the
actual numbers, presented further on, are somehow frightening
since they manifest a rapid population aging.
2. Materials and Methods
2.1. Study Location
The study has been conducted in the urban area of Athens
during the period of 2004-2006. Specifically, the study has been
conducted in the kindergartens of the Municipality of Athens,
where admittance is free of charge and thus eliminates the bias
of income as far as the choice of the kindergarten is concerned
(i.e. kindergartens with tuition fees would attract parents with
higher incomes and vice versa). First, confirm that you have the
correct template for your paper size. This template has been
tailored for output on the A4 paper size.
2.2. Sample Collection
The target group consisted of families from the area’s
kindergartens. A total of 435 single parents or parent couples
were investigated with respect to their socioeconomic
background and the number of offspring. The children’s age
ranged from 2-6 years. All children were included following
written consent from the child’s guardian. All kindergartens
visited, cooperated and provided access to their sample size
of pupils. The sample along with its basic demographic data
is presented in summarized in Table 1.
2.3. Data Collection and Ethics
Questionnaires were filled out by a trained health
professional. For this purpose, we asked the assistance of the
teachers from the kindergartens and primary schools. The
study was conducted following special license from the
Municipality of Athens conformed to the standards set by the
Declaration of Helsinki. Reporting of the study conforms to
STROBE statement along with references to STROBE and
the broader EQUATOR guidelines [7]. All questionnaires
were anonymous and no superfluous personal data were
collected ensuring no possibilities for someone to trace back
the identity of examined individuals. More specifically, the
data collected included gender, age, education of both
parents, family yearly income, parents’ nationality, and if
children were raised in a single parent family.
2.4. External Data
Demographic data were collected from additional sources
[5, 8-13]. In addition, data were collected from Eurostat and
in particular from the Population section
(http://ec.europa.eu/eurostat/web/population-demography-
migration-projections/statistics-illustrated) (From
“Population Data” Table demo_pjangroup, from “Births and
Fertility Data” Tables demo_fmonth, demo_frate and
demo_fasec).
2.5. Statistics, Data Analysis and Bias
Data analysis was performed using the non-parametric
Kruskal-Wallis statistical method, along with chi-square test.
In addition, n-way ANOVA was carried out, in order to
examine the effect of categorical data to the number of
children per family. In particular, two- and three-way
ANOVA was performed including all possible combinations
of categorical data (e.g. family income, education etc.).
Regression analysis, was performed using linear and second
degree polynomial functions of the form y=ax+b and
y=ax2+bx+c respectively. Correlation analysis was
performed using Pearson’s correlation coefficient
calculations, which investigates for linear correlations among
datasets. Data and statistical analysis were performed with
the MATLAB simulation environment (The Mathworks, Inc.
Natick MA). Possible bias in the present investigation would
be the misinterpretation of the questionnaire. Yet, the
questionnaire was self-explanatory and the health
professional was trained to overcome any obstacles. Further
on, a possible bias would have been the presence of tuition
fees in the kindergartens, which was not the case in the
present study.
3. Results
3.1. General Remarks on the Demography of Greece
Before examining the particulars of offspring dynamics in
Greece during the period of study, it would be interesting to
mention some elements of demographic data. The first
interesting, but alarming at the same time, fact was that Greek
women choose to bear children at a higher age with respect to
time. In particular, it appears that the mean mother age has
risen exponentially with time and this pattern seems to be
irrespective of economic or social factors (Figure 1A). Further
on, when examining the number of births in absolute numbers,
there was a constant fall, starting from 1960, which is reversed
from 2000 to 2008, as a rapid rise in births was observed
(Figure 1B). Yet, a sudden drop was observed from 2008 and
on, a time that coincides with the fiscal recession and
memorandum austerity policies (Figure 1B). Similarly, the
same result appears in the fertility factors, measured as number
of children per mother (Figure 1C). Interestingly, total births
and children per mother follows the pattern of Gross Domestic
Product (GDP) per capita (Figure 1D). Further on, it is
noteworthy that the male/female ratio manifested a decline
during austerity years (Figure 1E). In addition, the effect of
population aging is confirmed by the population pyramids
from 1961 to 2014. This is presented in Figure A1.

Journal of Family Medicine and Health Care 2016; 2(4): 119-131 121
Figure 1. Elements of demographic and economic statistics of Greece. In particular, following variables are presented: Mean mother age, which states the age
of a mother at the time of birth of her first child. Linear (black dashed line) and polynomial (red dotted line) regressions have been performed, in order to
investigate the dynamic pattern (A), total births in absolute numbers. Linear (black dashed line) and polynomial (red dotted line) regressions have been
performed, in order to investigate the dynamic pattern (B), fertility numbers, expressed as children per mother. Linear (black dashed line) and polynomial (red
dotted line) regressions have been performed, in order to investigate the dynamic pattern (C), the Gross Domestic Product (GDP) per capita expressed in
thousand dollars. Linear (black dashed line) and polynomial (red dotted line) regressions have been performed, in order to investigate the dynamic pattern (D)
and the Male/Female ratio. Linear regression is presented (black dashed line) (E). Analyzing the GDP and total birth data in a common diagram, it appears
that indeed they follow similar dynamics. In particular, the rise and fall in GDP and Total Births respectively is similar from 2005 to 2013. This is shown by
using second degree polynomial regression, where the blue-dotted line represents the number of births and the red-dotted line represents the GDP per Capita.
In the same diagram, calculating the Pearson’s correlation coefficient it has been found to be ρ=0.85 (pρ<0.05) (F). To analyze this behavior in detail, we
present the total curve (from 2005 to 2013 in (F)) from 2005 to 2009 (G) and from 2010 to 2013 (H). The Pearson’s correlation coefficient from 2005 to 2009
for GDP and Total Births was found to be ρ=0.91 (H) and from 2010 to 2013 was found to be ρ=0.95 (G). Both variables (GDP and total births) were found to
be highly correlated. This does not necessarily implies causality, yet it hints toward such an assumption.

122 George I. Lambrou et al.: Demography Dynamics: Factors Affecting Number of Offspring and
Male to Female Ratio in Greece
Table 1. Demographic and socioeconomic data of sample under investigation.
TOTAL CHILDREN POPULATION
Population (N) Age (years) Number of Children
CHILDREN
Mean±StDev Mean±StDev
Total (children) 434 4.24±0.91 1.81±0.85
GENDER Males 219 4.28±0.91 1.76±0.78
Females 215 4.21±0.91 1.86±0.91
PARENTS
MOTHERS EDUCATION MORE THAN 12 YEARS 342 4.26±0.90 1.84±0.86
BETWEEN 7 AND 12 YEARS 92 4.18±0.95 1.70±0.81
FATHERS EDUCATION MORE THAN 12 YEARS 360 4.25±0.91 1.84±0.84
BETWEEN 7 AND 12 YEARS 74 4.22±0.89 1.66±0.86
INCOME
UP TO 10K 96 4.28±0.78 1.79±1.03
BETWEEN 10K AND 30K 250 4.25±0.96 1.73±0.73
MORE THAN 30K 88 4.18±0.89 2.06±0.90
FATHER NATIONALITY GREEK 276 4.32±0.85 1.91±0.89
OTHER 156 4.11±0.98 1.64±0.73
MOTHER NATIONALITY GREEK 278 4.32±0.84 1.90±0.90
OTHER 156 4.10±1.01 1.64±0.73
COUPLE NATIONALITY
GREEK 268 4.33±0.84 1.91±0.90
OTHER 148 4.11±1.00 1.64±0.74
MIXED 18 4.02±0.95 1.61±0.61
Table 1. Continued.
MALES FEMALES
Age (years)
Number of
Children Age (years)
Number of
Children
Male/Female
Ratio
CHILDREN Mean±StDev Mean±StDev Mean±StDev Mean±StDev
Total (children)
1.018
GENDER Males
Females
PARENTS
MOTHERS EDUCATION MORE THAN 12 YEARS 4.25±0.91 1.74±0.76 4.28±0.88 1.94±0.94 1.047
BETWEEN 7 AND 12 YEARS 4.40±0.88 1.82±0.87 3.97±0.97 1.58±0.74 0.917
FATHERS EDUCATION MORE THAN 12 YEARS 4.26±0.92 1.74±0.74 4.24±0.91 1.94±0.93 1.046
BETWEEN 7 AND 12 YEARS 4.39±0.86 1.86±0.97 4.08±0.90 1.49±0.72 0.897
INCOME
UP TO 10K 4.31±0.84 1.76±0.92 4.26±0.73 1.82±1.12 0.920
BETWEEN 10K AND 30K 4.22±0.96 1.70±0.77 4.29±0.97 1.76±0.70 1.066
MORE THAN 30K 4.42±0.81 1.93±0.62 3.94±0.90 2.18±1.11 1.000
FATHER NATIONALITY GREEK 4.36±0.87 1.79±0.79 4.27±0.83 2.04±0.99 1.173
OTHER 4.10±0.96 1.69±0.75 4.12±1.01 1.60±0.72 0.795
MOTHER
NATIONALITY
GREEK 4.37±0.86 1.79±0.81 4.27±0.82 2.02±0.97 1.091
OTHER 4.10±0.98 1.69±0.72 4.10±1.04 1.60±0.73 0.902
COUPLE NATIONALITY
GREEK 4.38±0.85 1.80±0.80 4.27±0.83 2.04±0.99 1.110
OTHER 4.12±0.95 1.70±0.74 4.10±1.04 1.60±0.73 0.805
MIXED 3.88±0.95 1.58±0.74 4.31±1.04 1.67±0.73 2.000
3.2. A Short Analysis of Demography Dynamics
Analyzing the GDP and total birth data, presented in
Figures 1B and 1D, in a common diagram, it appeared that
indeed they follow similar dynamics. In particular, the rise
and fall in GDP and Total Births, respectively was similar
from 2005 to 2013. This is shown by using second degree
polynomial regression, where the blue-dotted line represents
the number of births and the red-dotted line represents the
GDP per Capita. In the same diagram, the Pearson’s
correlation coefficient was found to be ρ=0.85 (pρ<0.05)
(Figure 1F). To analyze this patterns in detail, we presented
the total curve (from 2005 to 2013 in (Figure 1F)) from 2005
to 2009 (Figure 1G) and from 2010 to 2013 (Figure 1H). The
Pearson’s correlation coefficient from 2005 to 2009 for GDP
and Total Births was found to be ρ=0.91 (Figure 1H) and
from 2010 to 2013 was found to be ρ=0.95 (Figure 1G). Both
variables (GDP and total births) were found to be highly
correlated. This did not necessarily imply causality, yet it
hinted toward such an assumption.

Journal of Family Medicine and Health Care 2016; 2(4): 119-131 123
3.3. The Effects of Education, Income and Nationality on
the Number of Children
We found differences in the characteristics of the
population with respect to each family’s number of children.
First of all, it was found that the number of children per
family was related to the education of the mother (Figure
2A), with mothers with more than 12 years education having
more children (median 2). At the same time, fathers’
nationality, mothers’ nationality and couples’ nationality
played a significant role, with Greek mothers, fathers and
couples (median 2) having more children than other
nationalities (median 1) (Figure 2B-2D) (the couples’
nationality was defined as follows: Greek couples were
considered those with both spouses of Greek citizenship,
Other couples were considered those with both spouses of
other citizenship than Greek and Mixed couples were
considered those that the spouses were of Greek citizenship
and the other of another citizenship). Results are summarized
in Table 2.
3.4. The Effect of Income Sub-populations and Nationality
on the Number of Children
Isolating the sub-population of families with income
between 10K and 30K euros per annum, it was found that the
number of children was related to fathers’, mothers’ and
couples’ nationality, in all cases being higher in Greek
families (Figure 3A-3C). Results are also summarized in
Table 2.
3.5. The Effect of the Sub-population of Mothers with
Education More Than 12 Years and Nationality on the
Number of Children
Examining the subpopulations of our sample it appeared
that mother’s education played a significant role in the
number of offspring. Investigating the sub-population of
mothers with education more than 12 years it was observed
that Greek fathers had more children (median 2) as compared
to fathers from other nationalities (median 1) (Figure 4A).
Similarly, the same effect was observed in Greek mothers
when compared to mothers from other nationality (Figure
4B). Finally, Greek couples also manifested similar pattern
with Greek couples having more children when compared to
other and mixed couples (Figure 4C). Results are
summarized in Table 2.
3.6. The Effect of Education and Nationality on Familial
Status (Single Parent Families) and the Number of
Children
Examining the individual sub-populations of education it
was found that within the sub-population of mothers with
education between 7 and 12 years there was a significant
difference in the number of children with single mothers
manifesting higher levels of children (median 2) when
compared to two-parent families (median 1) (Figure 5A). This
pattern was reversed in the sub-population of mothers with
education more than 12 years where single parent families
manifested lower number of children (median 1) when
compared to two-parent families (median 2) (Figure 5B). The
same effect was observed in the case of the father sub-
population with education more than 12 years (Figure 5C). In
particular, single parent families had less children (median 1)
when compared to two-parent families (median 2). The same
effect was also observed in the case of Greek mothers (Figure
5D) and fathers (Figure 5E), where both mothers and fathers
manifested higher number of children in two-couple families
(median 1) when compared to single parent families (median
2). Results are summarized in Table 2.
Table 2. Univariate (Kruskal-Wallis) analysis of grouping variables with respect to number of children per family. Populations include the total population, the
sub-population of mothers with education (E) between 7 and 12 years, mothers with education (E) more than 12 years, fathers with education (E) more than
12 years and finally family income (I) between 10 thousand (10K) euros per annum and 30 thousand (30K) euros per annum. Average values correspond to
average number of children for the respective population and it is presented as Mean±Stdev.
Group Average1 Median Group Average StDev
Total Population
Mother's Education 7<E<12 1.70±0.81 2.00 E>12 1.84±0.86 0.86
Father's Nationality Greek 1.91±0.89 2.00 Other 1.64±0.73 0.73
Mother's Nationality Greek 1.90±0.90 2.00 Other 1.64±0.73 0.73
Couple Nationality Greek 1.91±0.90 2.00 Other 1.64±0.74 0.74
Mothers with 7<E<12 Single Parent Families Yes 1.41±0.62 1.00 No 1.90±0.87 0.87
Mothers with E>12
Father's Nationality Greek 1.91±0.88 2.00 Other 1.62±0.73 0.73
Mother's Nationality Greek 1.91±0.89 2.00 Other 1.62±0.71 0.71
Single Parent Families Yes 1.41±0.62 1.00 No 1.90±0.87 0.87
Income I<10K 1.78±1.08 2.00 10K<I<30K 1.76±0.75 0.75
Couple Nationality Greek 1.92±0.89 2.00 Other 1.61±0.73 0.73
Fathers with E>12 Father's Nationality Greek 1.90±0.88 2.00 Other 1.69±0.71 0.71
Single Parent Families Yes 1.40±0.63 1.00 No 1.90±0.85 0.85
Income 10K<I<30K
Father's Nationality Greek 1.83±0.77 2.00 Other 1.56±0.63 0.63
Mother's Nationality Greek 1.83±0.78 2.00 Other 1.56±0.62 0.62
Couple Nationality Greek 1.83±0.78 2.00 Other 1.55±0.62 0.62

124 George I. Lambrou et al.: Demography Dynamics: Factors Affecting Number of Offspring and
Male to Female Ratio in Greece
Table 2. Continued.
Median p Group Average StDev Median p
Total Population
Mother's Education 2.00 0.0230
Father's Nationality 2.00 0.0018
Mother's Nationality 2.00 0.0016
Couple Nationality 2.00
Mixed 1.61 0.61 2.00 0.0036
Mothers with 7<E<12 Single Parent Families 2.00 0.0066
Mothers with E>12
Father's Nationality 1.00 0.0035
Mother's Nationality 1.00 0.0054
Single Parent Families 2.00 0.0000
Income 2.00
I>30K 2.08 0.89 2.00 0.0034
Couple Nationality 1.00
Mixed 1.69 2.00 0.73 0.013
Fathers with E>12 Father's Nationality 2.00 0.0420
Single Parent Families 2.00 0.0000
Income 10K<I<30K
Father's Nationality 1.00 0.0082
Mother's Nationality 1.00 0.0082
Couple Nationality 1.00
Mixed 1.69 0.62 2.00 0.0243
Figure 2. The effect of mothers’ education, fathers’, mothers’ and couples’ nationality on children population. In particular, there was a significant difference
between mothers’ education (E: Education) and the number of children being higher in mothers with more than 12 years of education (A), there was a
significant difference between fathers’ nationality and the number of children being higher in Greek fathers (B), there was a significant difference between
mothers’ nationality and the number of children being higher in Greek mothers (C), there was a significant difference between couples’ nationality and the
number of children being higher in Greek and mixed couples (D) (In sub-figure D, the couples’ nationality is defined as follows: Greek couples are considered
those with both spouses of Greek citizenship, Other couples are considered those with both spouses of other citizenship than Greek and Mixed couples are
considered those that one of the spouses is of Greek citizenship and the other of an other citizenship). Asterisks depict a difference at the p<0.05 significance
level.
Journal of Family Medicine and Health Care 2016; 2(4): 119-131 125
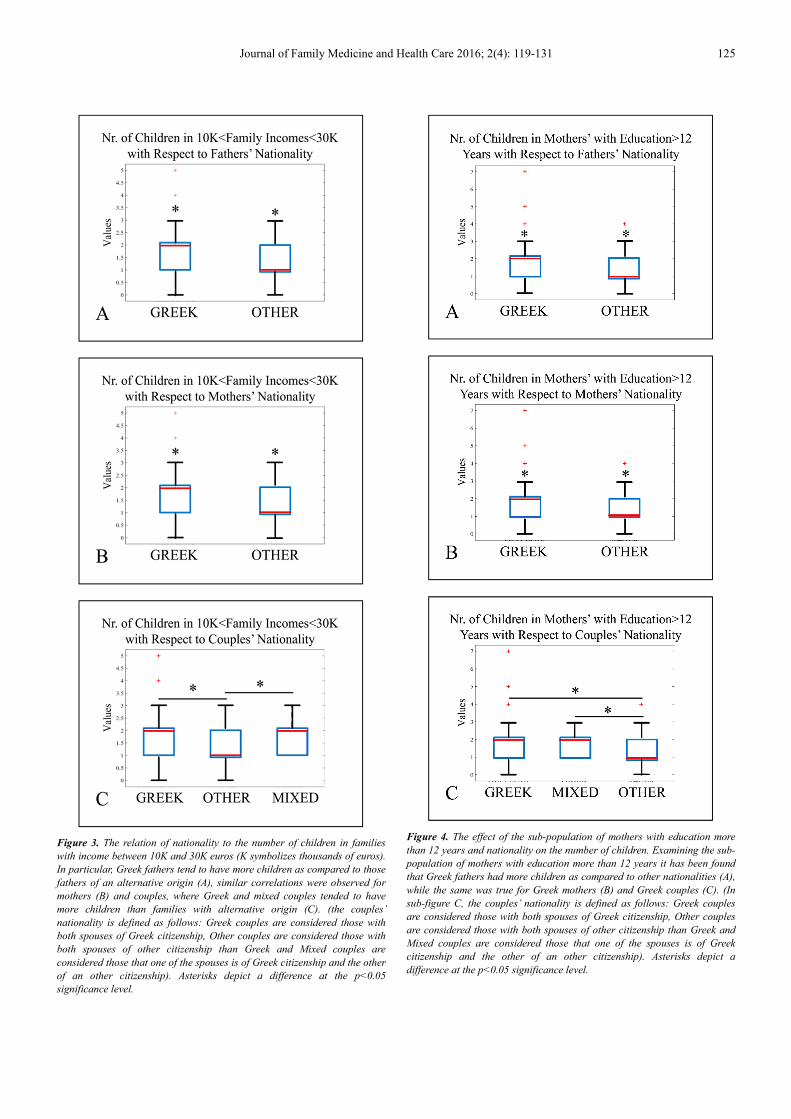
Figure 3. The relation of nationality to the number of children in families
with income between 10K and 30K euros (K symbolizes thousands of euros).
In particular, Greek fathers tend to have more children as compared to those
fathers of an alternative origin (A), similar correlations were observed for
mothers (B) and couples, where Greek and mixed couples tended to have
more children than families with alternative origin (C). (the couples’
nationality is defined as follows: Greek couples are considered those with
both spouses of Greek citizenship, Other couples are considered those with
both spouses of other citizenship than Greek and Mixed couples are
considered those that one of the spouses is of Greek citizenship and the other
of an other citizenship). Asterisks depict a difference at the p<0.05
significance level.
Figure 4. The effect of the sub-population of mothers with education more
than 12 years and nationality on the number of children. Examining the sub-
population of mothers with education more than 12 years it has been found
that Greek fathers had more children as compared to other nationalities (A),
while the same was true for Greek mothers (B) and Greek couples (C). (In
sub-figure C, the couples’ nationality is defined as follows: Greek couples
are considered those with both spouses of Greek citizenship, Other couples
are considered those with both spouses of other citizenship than Greek and
Mixed couples are considered those that one of the spouses is of Greek
citizenship and the other of an other citizenship). Asterisks depict a
difference at the p<0.05 significance level.
126 George I. Lambrou et al.: Demography Dynamics: Factors Affecting Number of Offspring and
Male to Female Ratio in Greece
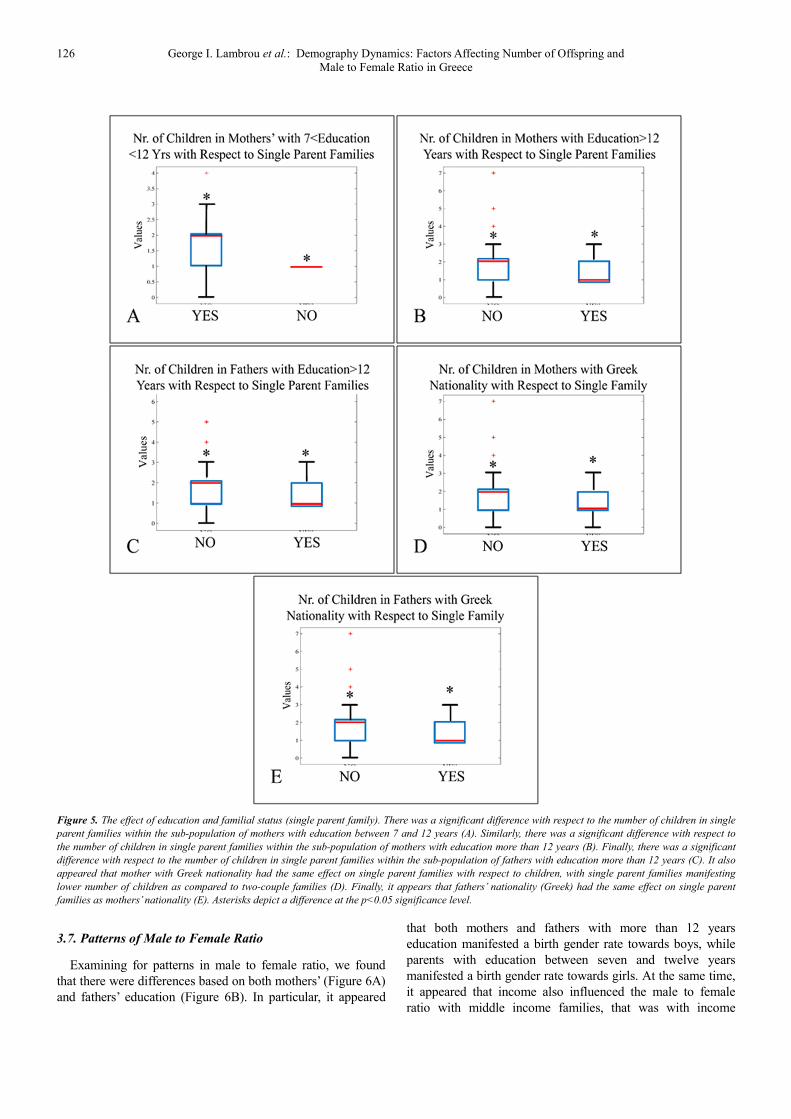
Figure 5. The effect of education and familial status (single parent family). There was a significant difference with respect to the number of children in single
parent families within the sub-population of mothers with education between 7 and 12 years (A). Similarly, there was a significant difference with respect to
the number of children in single parent families within the sub-population of mothers with education more than 12 years (B). Finally, there was a significant
difference with respect to the number of children in single parent families within the sub-population of fathers with education more than 12 years (C). It also
appeared that mother with Greek nationality had the same effect on single parent families with respect to children, with single parent families manifesting
lower number of children as compared to two-couple families (D). Finally, it appears that fathers’ nationality (Greek) had the same effect on single parent
families as mothers’ nationality (E). Asterisks depict a difference at the p<0.05 significance level.
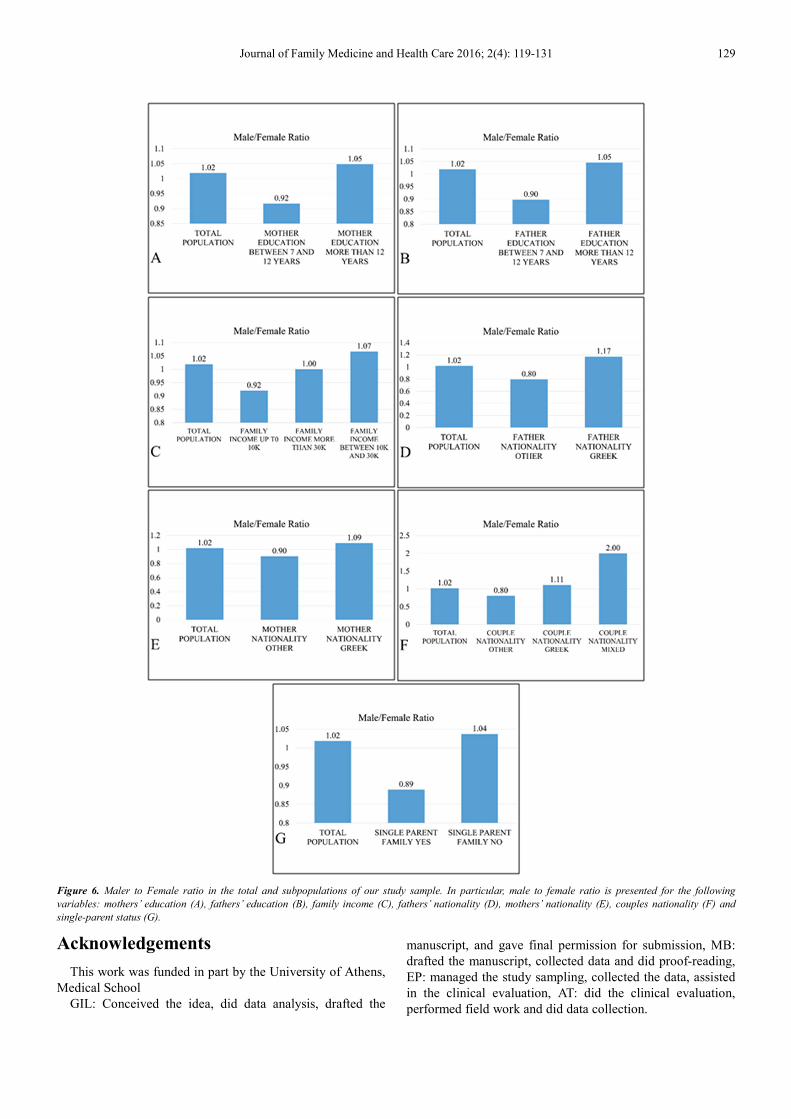
3.7. Patterns of Male to Female Ratio
Examining for patterns in male to female ratio, we found
that there were differences based on both mothers’ (Figure 6A)
and fathers’ education (Figure 6B). In particular, it appeared
that both mothers and fathers with more than 12 years
education manifested a birth gender rate towards boys, while
parents with education between seven and twelve years
manifested a birth gender rate towards girls. At the same time,
it appeared that income also influenced the male to female
ratio with middle income families, that was with income

Journal of Family Medicine and Health Care 2016; 2(4): 119-131 127
between 10K and 30K had more boys than girls and lower
income families have more girls (Figure 6C). Another
interesting observation was that both fathers (Figure 6D) and
mothers (Figure 6E) from Greek origin had more boys than
girls, as compared to parents from other origin (Figure 6D,
6E). Further on, when accounting for couple nationality, a very
interesting observation was that mixed couples had an above
the average male to female ratio equal to two, followed by
Greek couples and couples from other nationalities (Figure
6F). Finally, it appeared that family status, that is whether there
was a single-parent family or not, influenced the male to
female ratio with single-parent families having more girls
when compared to non-single-parent families (Figure 6G).
Results are summarized in Table 2.
3.8. Bivariate Analysis of Variables Under Investigation
It was apparent that the studied variables were affecting
the number of offspring, which led to the question whether
those variables could influence the number of children in a
combinatorial way. Bivariate analysis revealed that there was
significant difference in the number of children with respect
to gender and fathers’ education (p=0.04) (Table 3), gender
and fathers’ nationality (p=0.03) (Table 3) and gender and
couple nationality (p=0.03) (Table 3). Similarly, as observed
in the univariate analysis mothers’ education and fathers’
education significantly influenced the number of children
(p=0.03) (Table 3). Family income and single parent status
also manifested significant differences with respect to the
number of children (p=0.03) (Table 3).
4. Discussion
In the present work, we investigated the dynamics of
offspring in resident families in Athens and combined it with
other socioeconomic factors such as origin of the parents,
marital status, income and education. To the best of our
knowledge, there are not many works available in the
literature focusing on this topic especially for the Greek area.
In addition, this must be the first study that combines all
aforementioned variables together and in that extent.
In general, as numbers indicated, Greece’s population
shrinks with time, a phenomenon apparently irrelevant to
economic growth, up to 2008. In other words, we saw that
from 1980 and on, birth rate fell, with a reversal in that pattern
from 2000 and on. Yet, austerity led births almost at the 2000
levels, which signified that birth rate dynamics followed fiscal
dynamics. This is in line with other reports, where it was
shown that austerity literally “kills” births [6, 14]. The same
pattern was followed by fertility indexes, where the mean
offspring number per mother started recovering from year
2000 and suddenly dropped at the beginning of austerity. It is
also noteworthy that during the 60s’ and up to the early 80s’,
birth rate remained constant, whilst 60s’ were marked by great
poverty of the general population. Before that time point, the
rate of population change was always positive and for the first
time since the demographic recordings in history of Greece
obtained a negative growth rate of approximately -1.3% in
2011. Exception was noted between 1821 and 1828, where
Greece had a decline to its population of -30%, due to the
ongoing liberation war with the Turks [12]. It is interesting to
mention that based on population data, this austerity
devastating effect on births was not even succeeded by the
series of wars that Greece has gone through from 1897 to 1944
[12]. There are many responses on the question, regarding the
reasons that this austerity affects so much the birth rate in
Greece. For certain, it is not a matter of health care issue, or
conditions of hospitalization, since infant and mother
mortalities are at the lowest levels in Europe. A possible
hypothesis, would be that the austerity shock was too big for
couples in Greece and at the same time, and most importantly,
fear was the greatest enemy. In other words, people on one
hand have too much to lose, since almost everybody is
indebted to a bank, and thus couples would apply their
household cut-offs by avoiding having children.
An additional surprising notification was that the male to
female ratio slightly, but markedly, followed the birth dynamics
during austerity years. In particular, it appeared that there was a
decrease in the number of boys when compared to the number
of girls from 2004 up to date. To the best of our knowledge, this
is the first time that this ‘phenomenon’ is presented.
Examining the offspring dynamics of the era under
investigation, it appeared that mothers’ education influenced
positively the number of children. In other words, mothers with
education more than 12 years tended to have more children.
Similarly, nationality appeared to influence number of offspring
with Greek single parents and couples manifesting higher birth
rates. Further on, in the sub-population of couples with income
between 10K and 30K euros per annum, Greek single parents
and couples manifested higher numbers of offspring when
compared to other nationalities. Similarly, in the sub-population
of mothers’ with education more than 12 years, Greek single
parents and couples manifested higher numbers of offspring
when compared to other nationalities. Finally, single parent
families manifested lower numbers of offspring in several sub-
populations such as mothers education, mothers’ and fathers’
nationality. These findings could be interpreted by the fact that
during that era, fiscal conditions regulated positively the number
of offspring. At the same time, Greek couples tended to have
more children than families with other nationality, probably also
to better financial position, an observation also verified by the
effect of mothers’ nationality. Further on, it appeared that this
finding was factual also for the number of children in Greek as
well as mixed families, where one of the spouses was of Greek
origin. Probably, this observation was due to the better financial
position of Greek couples or single parents. Worth mentioning is
the fact that the examined era is characterized by the entrance of
Greece into the Eurozone and the rapid fall in bank loan interest
rates.
Although, it is possible that the beneficiary financial
condition was not due to the increase of production in
Greece, but due to the increase of consumption it had, what
so ever, a positive effect on birth rates, a fact that the policy
makers should use to the benefit of the Greek society (which
they eventually did not).

128 George I. Lambrou et al.: Demography Dynamics: Factors Affecting Number of Offspring and
Male to Female Ratio in Greece
At this point, we should mention that it is generally
believed that couples with other nationalities tend to bear
more children, which according to these observations it is not
true, at least for those couples whose children attend the
kindergartens and primary schools in Athens. This leaves us
with the following: Greek parents and mothers tend to have
more children, send them in an educational infrastructure on
older age, when compared to parents and couples with other
nationalities. It also appeared that medium incomes are more
influenced with respect to number of offspring, since in
lower and higher incomes there was no significant difference
observed in the number of offspring.
As it has been already stated, nationality and education had
a positive effect on offspring numbers, yet both probably
closely linked to financial prosperity. Therefore, it is
probable that economics played a positive role in the number
of children since we had the first pattern reversal (birth rates
kept falling from 1970 and on) since the late 60s’.
In a very interesting work by Veropoulou et al (2010), which
investigated the patterns of sex ratio in Greece, data from 2006
have been reported [5]. Interestingly, our calculation coincided
for the male to female ratio in Greek couples and/or single
parents, where we estimated an average of 1.11 for parents of
Greek origin in a sample size of 435 couples, while in their
report the sex ratio was estimated at the 1.06 level on a sample
size of 53 thousand couples [5]. At the same time, our estimation
for couples with other nationalities disagrees, as we have an
estimation of 0.8 and their report manifested an average of 1.1
[5]. Probable reasons for that difference might be the small
sample size of our study or the bias inherently obtained, since
we examined families that sent their children to the kindergarten.
As a matter of fact, based on our findings, the education and
income had an increasing effect on the ratio. At the same time,
when accounting for the effect of nationality, we found that
mixed couples manifested a high male to female ratio of 2.
To the best of our knowledge, this is the first work in the
literature examining the dynamics of offspring by calculating
the effects of socioeconomic factors such as education,
income and nationality. At the same time, such works are
extremely important both towards the understanding of
population dynamics but also towards policy making, which
includes both the demographical as well as fiscal policies.
Table 3. Bivariate analysis of variables under investigation. Two- and three-way ANOVA was performed in order to test for the combinatorial effect of
socioeconomic variables with respect to the number of children.
Father Education
7<E<12 Years E>12 Years
Mean StDev Median Mean StDev Median
Gender Males 1.82 0.87 2.00 1.74 0.76 2.00
Females 1.49 0.72 1.00 1.94 0.93 2.00
p-values Father Education 0.01
Gender × Father Education 0.04
Father Nationality
Greek Other
Mean StDev Median Mean StDev Median
Gender Males 1.79 0.79 2.00 1.69 0.75 2.00
Females 2.04 0.99 2.00 1.60 0.72 1.00
p-values Father Nationality 0.00
Gender × Father Nationality 0.03
Father Education
7<E<12 Years E>12 Years
Mean StDev Median Mean StDev Median
Mother Education 7<E<12 Years 1.64 0.89 1.00 1.79 0.65 2.00
E>12 Years 1.73 0.80 2.00 1.84 0.86 2.00
p-value Mother Education × Father Education 0.03
Couple Nationality
Greek Other Mixed
Mean StDev Median Mean StDev Median Mean StDev Median
Gender Males 1.80 0.80 2.00 1.70 0.74 2.00 1.58 0.74 1.00
Females 2.04 0.99 2.00 1.60 0.73 1.00 1.67 0.73 2.00
p-value Gender × Couple Nationality 0.03
Family Income
Up to 10K Between 10K and 30K More than 30K
Mean StDev Median Mean StDev Median Mean StDev Median
Single Parent YES 1.28 0.45 1.00 1.15 0.38 1.00 1.89 0.93 2.00
NO 2.01 1.12 2.00 1.76 0.73 2.00 2.08 0.90 2.00
p-value Income 0.01
Family Income × Single Parent 0.03
Journal of Family Medicine and Health Care 2016; 2(4): 119-131 129
Figure 6. Maler to Female ratio in the total and subpopulations of our study sample. In particular, male to female ratio is presented for the following
variables: mothers’ education (A), fathers’ education (B), family income (C), fathers’ nationality (D), mothers’ nationality (E), couples nationality (F) and
single-parent status (G).
Acknowledgements
This work was funded in part by the University of Athens,
Medical School
GIL: Conceived the idea, did data analysis, drafted the
manuscript, and gave final permission for submission, MB:
drafted the manuscript, collected data and did proof-reading,
EP: managed the study sampling, collected the data, assisted
in the clinical evaluation, AT: did the clinical evaluation,
performed field work and did data collection.

130 George I. Lambrou et al.: Demography Dynamics: Factors Affecting Number of Offspring and
Male to Female Ratio in Greece
Disclosures and Conflict of Interest
The authors have nothing to disclose and no conflict of interest.
Appendix
Figure A1. Population pyramids of Greece from 1961 to 2014. Since 1961 there is a decreasing trend in children less than a year old.

Journal of Family Medicine and Health Care 2016; 2(4): 119-131 131
References
[1] Walker, R. S., et al., The trade-off between number and size of offspring in humans and other primates. Proc Biol Sci, 2008. 275 (1636): p. 827-33.
[2] Charlesworth, B., Evolution in Age-Structured Populations. 1994: Cambridge University Press.
[3] Roff, D. A., Evolution Of Life Histories: Theory and Analysis. 1992: Springer.
[4] Tagka, A., et al., Socioeconomical Factors Associated With Pediculosis (Phthiraptera: Pediculidae) in Athens, Greece. J Med Entomol, 2016.
[5] Verropoulou, G. and C. Tsimbos, Differentials in sex ratio at birth among natives and immigrants in Greece: an analysis employing nationwide micro-data. J Biosoc Sci, 2010. 42 (3): p. 425-30.
[6] Michas, G., S. Papadopoulos, and R. Micha, Austerity in Greece not only kills but also curtails births and marriages. BMJ, 2013. 347: p. f6639.
[7] Simera, I., et al., A catalogue of reporting guidelines for health research. Eur J Clin Invest, 2010. 40 (1): p. 35-53.
[8] Athanassenas, G. A., Seasonal variation of births in Greece. Temporal changes and regional differences over a 24-year period. Chronobiologia, 1985. 12 (4): p. 351-7.
[9] Demoliates, Y. D. and V. C. Katsouyiannopoulos, Seasonality of births: changing pattern correlated with the seasonality of marriage. J Epidemiol Community Health, 1995. 49 (1): p. 110-1.
[10] Dimitrakakis, C., et al., Maternal mortality in Greece (1980-1996). Eur J Obstet Gynecol Reprod Biol, 2001. 99 (1): p. 6-13.
[11] Doulgeraki, A. and M. Valari, Parental attitudes towards head lice infestation in Greece. Int J Dermatol, 2011. 50 (6): p. 689-92.
[12] Kotzamanis, V. and E. Androulaki, Demographic development in Greece 1830-2007. 2010, Laboratory of Demographic and Social Analysis: Athens. p. 87-120.
[13] Mousiolis, A., et al., Maternal age demographic trends in Greece from 1980 to 2008. J Reprod Med, 2013. 58 (5-6): p. 246-55.
[14] Vrachnis, N., et al., Greece's birth rates and the economic crisis. Lancet, 2014. 383 (9918): p. 692-3.