demographics: the most predictable of trends the easiest of opportunities? lecture 6: u09069...
Post on 22-Dec-2015
221 views
TRANSCRIPT

Demographics: The most predictable of trends the
easiest of opportunities?Lecture 6:
U09069 Management Futures Zoë Dann

Learning outcomes
• To take a global and UK perspective– Interrelate trends of demography and extrapolate
them into the future– Discuss some of the difficulties of measurement– Relate this to impacts on organisations either as
opportunities and threats– Define some of the responses by organisations

Global demography
World population change

World population
• Do you know how many people live of the planet?
• How will the population change over the time of this lecture…have a guess
Population clocks: Let’s look at some estimates…– US Government census bureau– Berkeley University

Population density
Source: NRCS, 1994

Size of country based on population
http://www.xist.org/earth/gen_popsize.aspx

The future of population growth
Natural resources will not be sufficient to support population
growth…?

Why do we need to know?• Governments, international agencies, private
sector• Strategic planning and long term investment• Pensions and health costs, labour force size,
health strategies• Future consumers (e.g. the emerging global
middle class) and future workforce• Identifying needs for ‘bulges’ through following
progression of cohortsWalker (2008,
2009)
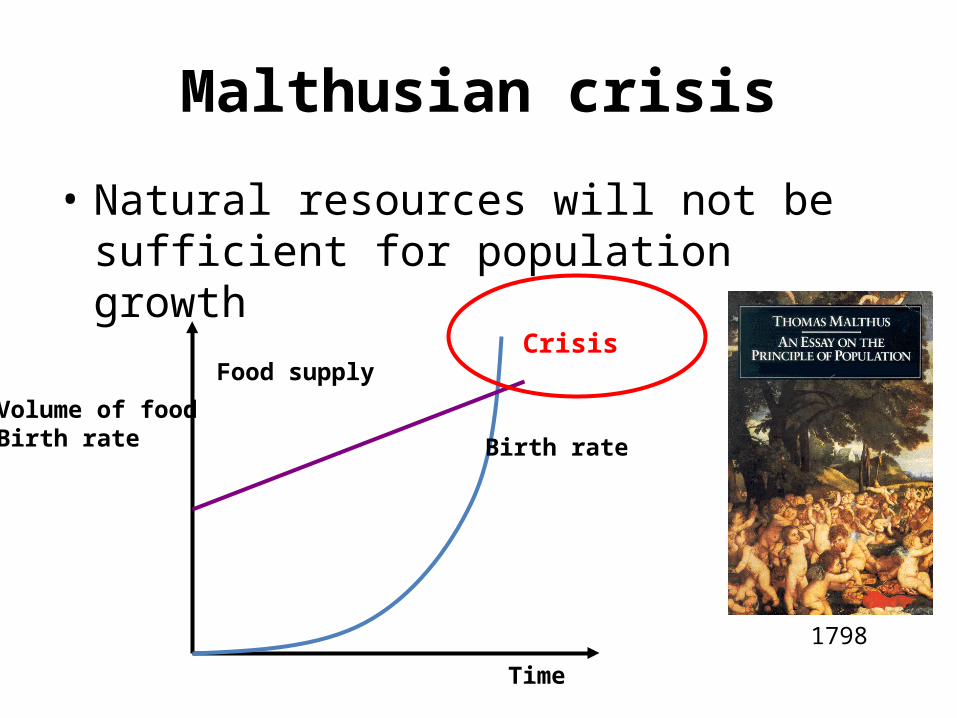
Malthusian crisis
• Natural resources will not be sufficient for population growth
Food supply
Birth rate
Time
Volume of foodBirth rate
Crisis
1798

World population projection
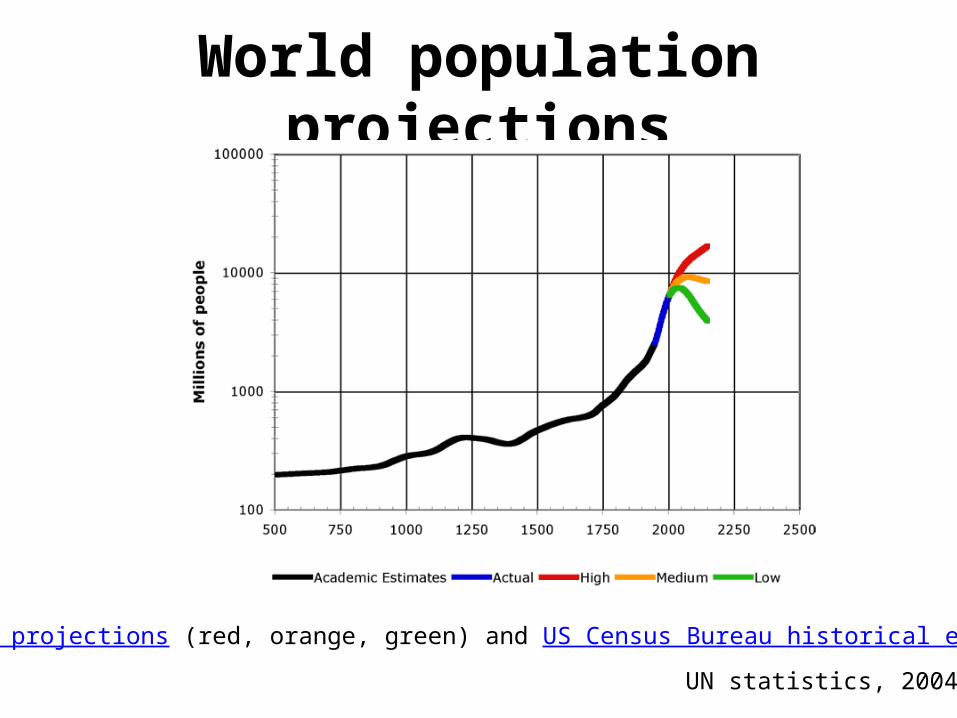
World population projections
UN statistics, 2004
UN 2004 projections (red, orange, green) and US Census Bureau historical estimates

Growth rate projections
Why the fall?
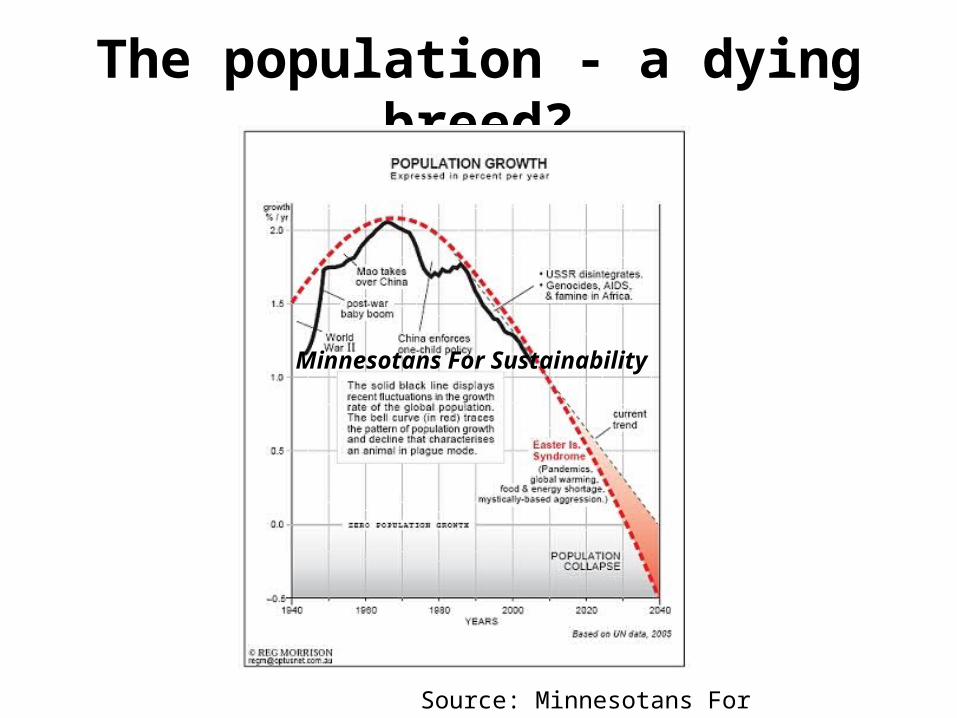
The population - a dying breed?
Minnesotans For Sustainability
Source: Minnesotans For Sustainability, 2006

What actually happens…
Time
PopulationGrowth
births
mortality
Births andMortalityrates
Notestein's Demographic Transition Model, 1945

E.g.Tanzania
NBS, 2002

E.g. Japan
Statistics Bureau, MIC2003

Demographic Transition
Notestein's Demographic Transition Model, 1945

Ageing population
Source: Government Actuary's Department (GAD), 2003 principal projections and Office for National Statistics (ONS)

India v China
Source: UN Population Division (1997): World Population Prospects, 1950-2050. The 1996 Edition. (Annex I and II)Chart: G.K. Heilig, 1996, IIASA-LUC
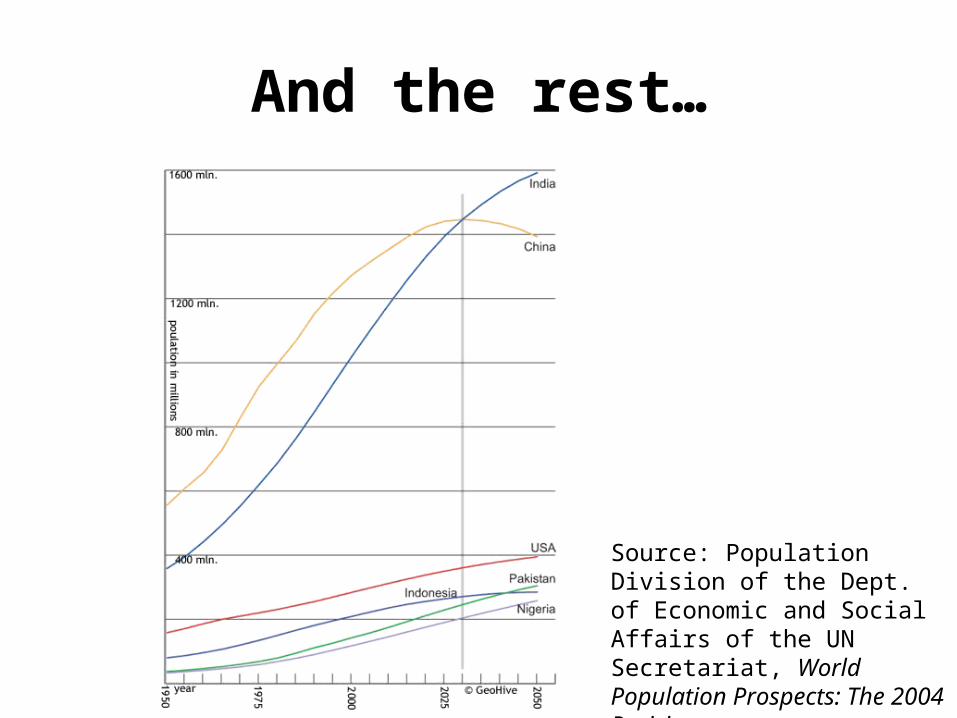
And the rest…
Source: Population Division of the Dept. of Economic and Social Affairs of the UN Secretariat, World Population Prospects: The 2004 Revision.

Losses and gains
• Interactive map

Population growth and composition• Population growing more rapidly in countries
with fewest resources– Lower growth in Europe, North America, Oceania
and Asia (av. 1.7% growth)– Higher in Latin America (av. 1.9%) and Africa (av.
2.8%) (UN, 2007)• Male/Female ratio usually favours women• Eastern European contracting
e.g. Ukraine TFR 1.15, Czech Republic 1.25• ‘Hypermortality’ of Russia ‘normally
associated with effects of major war’ (Walker, 2008)

Urbansiation

Urbanisation – ‘The second wave’

Urbanisation• In 1950, New York was the largest city with 12.3m people (London, 8.7m
people)• By 2007, there were an estimated 26 mega-cities, with 16 in the
developing world1. Tokyo, Japan 33,6M2. Seoul, South Korea 23,4M3. Ciudad de México 22,4M4. New York, USA 21,9M5. Mumbai, India 21,6M6. Dehli, India 21,5M7. São Paulo, Brazil 20,6M8. Los Angeles, USA 18,0M9. Shanghai, China 17,5M10. Osaka, Japan 16,7M
• Interactive maphttp://www.unfpa.org/pds/images/Trend_Graphic.swf

Urban Growth

Demography
A UK perspective: opportunities and threats
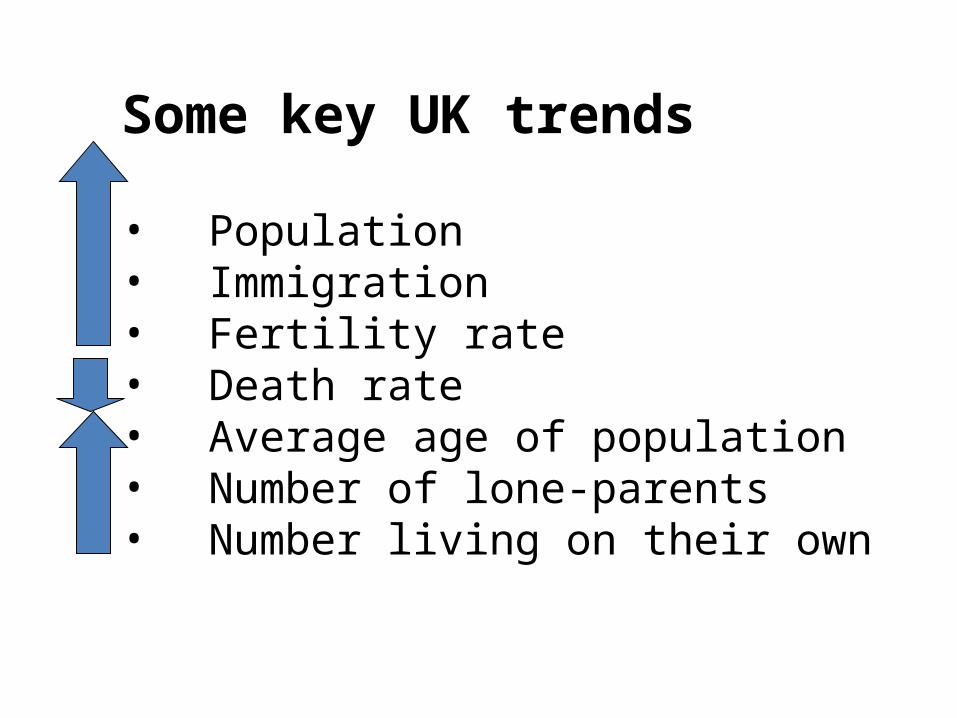
Some key UK trends
• Population• Immigration• Fertility rate • Death rate• Average age of population• Number of lone-parents• Number living on their own

Implication of trends
Opportunities and threats

Urbanisation, migration and population growth
• Feeding the world• Providing water• Temperature• Air pollution• Destruction of habitat• Urban and rural population needs
– Jobs– Health services– Education– Transport– Police– Housing
http://www.mfa.fi/uvvwork?id=1884507
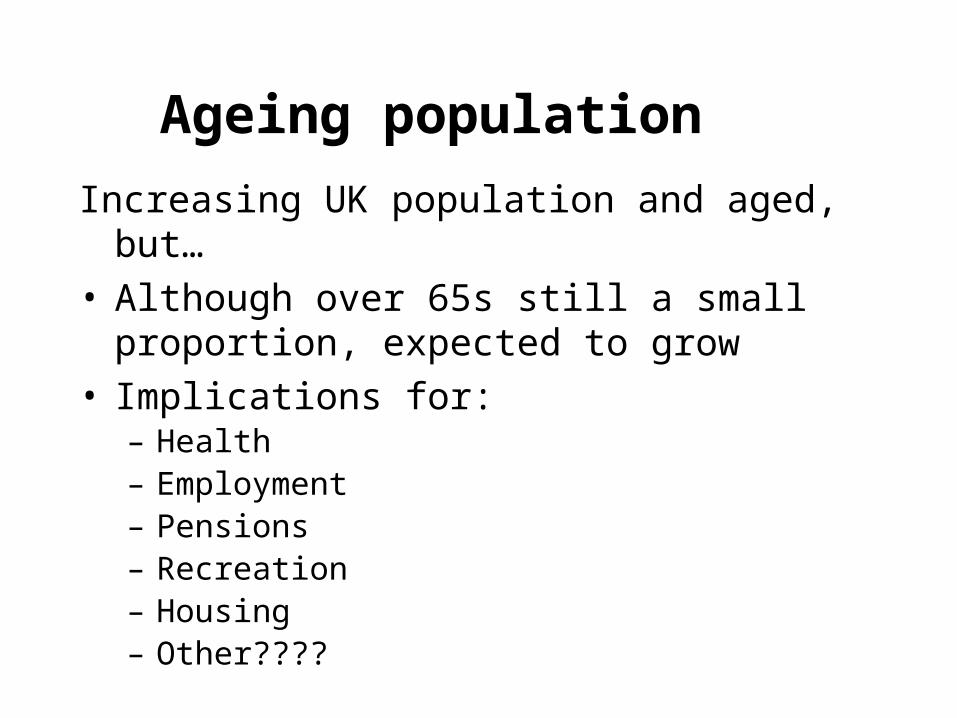
Ageing populationIncreasing UK population and aged, but…• Although over 65s still a small proportion, expected to
grow• Implications for:
– Health– Employment– Pensions– Recreation– Housing– Other????

The grey market• Some companies have identified the
market, e.g. Saga– Magazines – Health plans– Holidays– Insurance and Finance– Medication
• Employment opportunities e.g. B&Q• Property market movement

Shrinking households• Serial co-habitation, lone-parenthood and people living
alone are expected to increase• If true, then…companies that might benefit:
– Law firms– Property developers– Child care providers– Dating agencies– Beauty Salons– Home carers for the elderly living alone– Others???

Implications of demographic changes
• Emergence of new markets and the decline of others e.g. Lone-parenthood childcare provision
• Need for different products and servicese.g. Ageing population (are their needs all the same?),
migrant new-mothers
• Need for organisations to either adapt or proactively modify their employment policies e.g. Need to accommodate increasing number of people
living alone

But remember…
After all this analysis…

Limitation of statistics
• Some data is from small samples • Poor records in developing countries • Lack of standard definitions e.g. education• Country’s boundaries for areas measured variable• Births, deaths, easy to estimate of migration much
more difficult to evaluate• There is no single ‘right’ way to make assumptions
about population
UN, 1996, 2000

Future population change“Little about population change is inevitable.”
US Census, 2000“Demography is a science that is seldom kind to projection
of current trends into the future”Walker, 2008
• Changes affecting life and death and.. .................!
– Government policy– Weather– Happiness– Contraception– Resources – food, water, shelter– Technological advances …..

So shall we look at the population clock?
US Government census bureau

Further Reading• Kew, J and Stredwick, J, (2006), ‘Business Environment, managing in
a strategic context’, Chapter 6, Demographic trends, CIPD• Walker, M, (2008),’The New Demography of the 21st Century: Part
1 The birth rate surprise’, Strategy and Leadership, Emerald, Vol 36 No 6, pp 42 - 48
• Walker, M, (2009),’The New Demography of the 21st Century: Part 2 Gender gaps and Population Bulges – what demography means to the corporate planner’, Strategy and Leadership, Emerald, Vol 31 No 1, pp 31- 34
• Wetherley, P (2008), ‘The Business Environment: Themes and Issues, Chapter 5: Social Demographics’, Oxford University Press
• Discussion on how population statistics are estimated: http://www.census.gov/ipc/www/idb/estandproj.html

Appendix 1:Global Demography
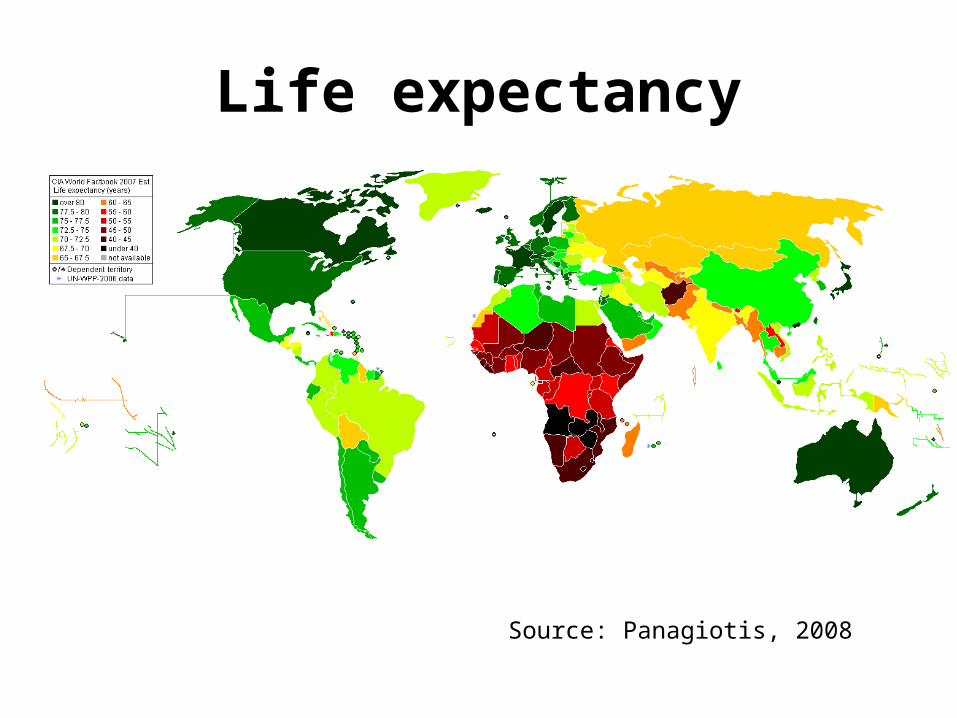
Life expectancy
Source: Panagiotis, 2008

Appendix: 2
Demographic TrendsUK

UK projections on population growth
National Statistics Online: www.statistics.gov.uk
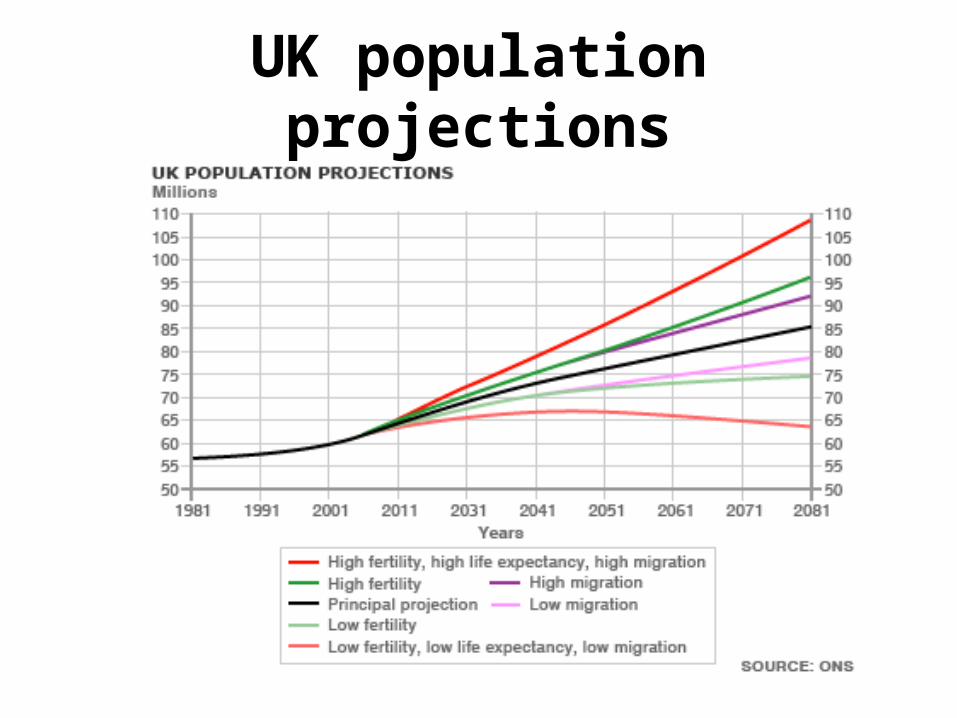
UK population projections

Fertility UK
National Statistics Online: www.statistics.gov.uk

Registered deaths UK
National Statistics Online: www.statistics.gov.uk

Net migration
National Statistics Online: www.statistics.gov.uk

Gender and age UK
National Statistics Online: www.statistics.gov.uk

Divorce
National Statistics Online: www.statistics.gov.uk

Ff Divorces
020,000
40,00060,00080,000
100,000
120,000140,000160,000
180,000200,000
1961
1965
1969
1973
1977
1981
1985
1989
1993
1997
2001
Divorces
National Statistics Online: www.statistics.gov.uk
Divorce Reform Act 1969 came into
effect 1971

Increasing lone parents

Increasing one person house holds
National Statistics Online: www.statistics.gov.uk