demographics, redistribution, and optimal inflation · demographics, redistribution, and optimal...
TRANSCRIPT

Demographics, Redistribution, and Optimal Inflation
James Bullard, Carlos Garriga, and Christopher J. Waller
The authors study the interaction among population demographics, the desire for intergenerationalredistribution of resources in the economy, and the optimal inflation rate in a deterministic life cycleeconomy with capital. Young cohorts initially have no assets and wages are the main source of income;these cohorts prefer relatively low real interest rates, relatively high wages, and relatively high rates ofinflation. Older cohorts work less and prefer higher rates of return from their savings, relatively lowwages, and relatively low inflation. In the absence of intergenerational redistribution through lump-sumtaxes and transfers, the constrained efficient competitive equilibrium requires optimal distortions onrelative prices. The authors’ model allows the social planner to use inflation/deflation to try to achievethe optimal distortions. In the model economy, changes in the population structure are interpreted asthe ability of a particular cohort to influence the redistributive policy. When older cohorts have moreinfluence on the redistributive policy, the economy has a relatively low steady-state level of capital and arelatively low steady-state rate of inflation. The opposite happens when young cohorts have more con-trol of policy. These results suggest that aging population structures, such as those in Japan, may con-tribute to observed low rates of inflation or even deflation. (JEL E4, E5, D7)
Federal Reserve Bank of St. Louis Review, November/December 2012, 94(6), pp. 419-39.
OVERVIEWCan observed low inflation outcomes be related to demographic factors such as an aging
population? A calculation that we label as “back of the envelope” (BOTE) based on some basiceconomic theory might suggest that the answer is no. Suppose we think of the net real interestrate r in a model with capital. We might guess that in steady state r = d + n, where d is the netdepreciation rate and n is the net population growth rate. Suppose we also assume that (i) moneyand capital pay either the same real rate of return or closely related real rates of return1 and (ii)the real return on money is the negative of the net inflation rate p. Now suppose the rate of pop-
James Bullard is president and CEO of the Federal Reserve Bank of St. Louis. Carlos Garriga is a research officer and Christopher J. Waller is seniorvice president and director of research at the Federal Reserve Bank of St. Louis. This paper was presented at the conference “DemographicChanges and Macroeconomic Performance,” sponsored by the Bank of Japan and the Institute for Monetary and Economic Studies, May 30-31,2012. The authors appreciate the useful comments received from the conference participants, particularly the discussants, Hiroshi Fujiki andPhilipp Hartmann.
© 2012, The Federal Reserve Bank of St. Louis. The views expressed in this article are those of the author(s) and do not necessarily reflect theviews of the Federal Reserve System, the Board of Governors, or the regional Federal Reserve Banks. Articles may be reprinted, reproduced,published, distributed, displayed, and transmitted in their entirety if copyright notice, author name(s), and full citation are included. Abstracts,synopses, and other derivative works may be made only with prior written permission of the Federal Reserve Bank of St. Louis.
Federal Reserve Bank of St. Louis REVIEW November/December 2012 419

ulation growth increases to n¢, creating a new steady state with a more youthful population. Byitself, this must mean that the real return to capital increases to r¢ and that the inflation ratedecreases to p¢. This fact would seem to suggest that, all else equal, countries with relativelyyoung populations would have relatively low inflation rates and, conversely, countries with rela-tively old populations would have relatively high inflation rates.
However, the BOTE calculation does not seem to square with some of the facts. Figures 1and 2 show two time series for two countries, the United States and Japan, respectively, for 1960to 2010. A moving average (MA) of the consumer price index (CPI) inflation rate is plotted onthe left scale. A measure of the youthfulness of the population—the percentage of the population15 to 40 years of age—is plotted on the right scale. In each case, roughly speaking, economieswith a higher share of a younger population are associated with higher inflation, whereas econ -omies with a higher share of an older population are associated with lower inflation.2 This evi-dence, while far from definitive, is at least suggestive and does run counter to the BOTE standardtheory calculation.
In this article, we provide one reconciliation of the BOTE calculation with the suggestionthat aging populations are associated with lower levels of inflation (see Figures 1 and 2). Thetheory we study has all the elements of the BOTE calculation but also considers the desire forredistribution of resources within society. We model this desire as a social planner’s problem inwhich the planner has access to only inflation or deflation as tools to achieve redistribution. Weshow that the solution to the social planner’s problem associates relatively older populationswith relatively low inflation.
Redistributional Tension
In canonical macroeconomic models, the representative agent assumption is used to capturethe average behavior of key variables, including inflation. When the representative householdapproach is used, policy implicitly ignores the redistributive effects of fiscal and monetary inter-ventions. While it is possible to incorporate various forms of heterogeneity into canonical models,attempting to understand redistribution policies for demographic reasons forces us to abandonthe representative agent framework and move to a general equilibrium life cycle framework.
Accordingly, in this article we use an overlapping-generations model with capital to studythe redistributional tensions associated with monetary and fiscal policy. As in Bullard and Waller(2004), inflation dictates the real rate of return on money and thus the portfolio choices of eachgeneration. By means of a standard Tobin effect, higher inflation can induce a substitution frommoney to capital. But why does this create a tension across generations? The tension can beunderstood by considering the decisionmaking of a given individual at time t. A high wage rateat time t, which we can represent as fl(kt), increases the lifetime income of the young cohort.Inflation reduces the rate of return on money balances and individuals shift portfolio decisionstoward capital. The increasing capital accumulation increases wages of young workers butreduces the rate of return on capital, fk(kt+1), for the older cohort of savers. Consequently, workerslike inflation when they are young but dislike it when they are old. Thus, if a single generationcould choose the inflation rate at each point in their lives, they would choose relatively highinflation when they were young and relatively low inflation (or deflation) when old. Clearly, thegenerations existing side by side with this one generation would not appreciate such a policy
Bullard, Garriga, Waller
420 November/December 2012 Federal Reserve Bank of St. Louis REVIEW

Bullard, Garriga, Waller
Federal Reserve Bank of St. Louis REVIEW November/December 2012 421
1960 1965 1970 1975 1980 1985 1990 1995 2000 2005−3.75
0
3.75
7.50
11.25
15.00
Year-on-Year Percent Change, MA(6)
201032
34
36
38
40
42
Percentage of Population 15-40 Years of Age
Youthful Population Share (right scale)
CPI Inflation (left scale)
Figure 1
Inflation and Demographics: United States (1960-2010)
−5.0
−2.5
0
2.5
5.0
7.5
10.0
30
33
36
39
42
45
48
1960 1965 1970 1975 1980 1985 1990 1995 2000 2005
Year-on-Year Percent Change, MA(6)
2010
Percentage of Population 15-40 Years of Age
Youthful Population Share (right scale)
CPI Inflation (left scale)
Figure 2
Inflation and Demographics: Japan (1960-2010)

and would oppose it. Consequently, how agents resolve this conflict between generations isimportant for understanding policy choices and the institutional design of the central bank.
Bullard and Waller (2004) consider three institutional arrangements for resolving this con-flict; among them is a policy committee that allows older and younger cohorts to solve a Nashbargaining problem.3 Their main finding is that the behavior of inflation hinges critically onkey details of the institutional design.
The objective of this article is to understand the determination of central bank objectiveswhen population aging shifts the social preferences for redistribution and its implications forinflation. Our starting point builds on Bullard and Waller (2004) but, unfortunately, it is difficultto follow their approach since it is not possible to specify the entire spectrum of institutionalarrangements that could be implemented. We take a different approach here. Rather than speci-fying particular political decisionmaking rules, we use a direct mechanism to decide the alloca-tions. This means we solve a social planner’s problem in which the weights assigned to eachgeneration are population weights. Thus, a baby boom corresponds to assigning more weight tothe young of a particular generation relative to past and future generations. This mechanismcan replicate any steady-state allocation arising from a political economy model with populationgrowth or decline.
An optimal level of capital exists for every level of social redistribution. When the younghave more influence in the planner’s optimization problem, wages are high and the return fromcapital is low; and when the old have more influence in the planner’s optimization problem,wages are low and the return from capital is high. A critical feature of the planning problem westudy is whether the planner can redistribute resources by means of lump-sum taxes or transfers.In the absence of lump-sum redistribution, we show that the planner might wish to use inflationor deflation to change the relative price of capital to induce young households to hold the rightamount of capital. In general, the constrained redistributive solution is not fully efficient. Thatis, the implied level of savings is either too low or too high compared with the unconstrainedefficient solution. In this sense, inflation or deflation will turn out to be an imperfect substitutefor a full system of lump-sum taxes and transfers.
We emphasize that, in contrast with Bullard and Waller (2004), the unconstrained sociallyefficient level of savings is always dynamically efficient. This is because in the unconstrainedcase the social planner has access to a full system of lump-sum taxes and transfers. However,the constraints on redistribution—when the planner has access to only inflation/deflation asredistribution tools—behave as binding participation constraints that cause the efficient level ofcapital to deviate from the socially efficient one. These deviations are due to the relative impor-tance of each group and the underlying distribution of resources.4
The mechanism in this article follows the work of Garriga and Sánchez-Losada (2009), whoconsider the implementation of constrained efficient solutions in economies with warm-glowor joy-of-giving preferences. The rationale for intergenerational redistribution is always presentin a life cycle model that abstracts from lump-sum taxes and transfers. Garriga (2001) shows that,depending on the relative importance of present versus future generations, it is optimal to tax/subsidize capital. Dávila (2012) uses a similar approach in a steady-state analysis to show thatcapital taxation can still be optimal even in the absence of government expenditure. This mech-
Bullard, Garriga, Waller
422 November/December 2012 Federal Reserve Bank of St. Louis REVIEW

Bullard, Garriga, Waller
anism is usually absent in economies with dynastic agents. Dávila et al. (forthcoming) also use asimilar setup in an economy with incomplete markets and uninsurable income risk.
ECONOMYEnvironment
Consider a standard two-period overlapping-generations growth model with capital. Timeis discrete and double infinity t = …,–2,–1,0,1,2,…. In each period a number of identical house-holds are born, and the population grows at an exogenous rate Nt = (1 + n)Nt–1, where N0 = 1.Each cohort lives for two periods and has perfect foresight. Young individuals are endowed withone unit of time that can be devoted to market work. Bundles of consumption goods today,c1,t , and tomorrow, c2,t+1, are compared using a standard utility function U(c1,t,c2,t+1) = u(c1,t) +bu(c2,t+1), where the utility function satisfies standard properties, and the term b representsintertemporal discounting. There is an initial old cohort that consumes at t = 0.
This economy produces consumption and investment goods with a standard neoclassicaltechnology F(Kt,Nt) that uses capital and labor as inputs. The production function has constantreturns to scale and satisfies standard properties. Capital depreciates at the rate d. Output perworker can be written as f(kt), where kt = Kt/Nt. The economy aggregate resource constraint isgiven by
(1)
or, in per capita terms,
(2)
The Efficient Allocation of Resources
Consider the allocation of resources determined by a social planner. The objective functionweights current and future generations according to
(3)
The term lt can be interpreted as the social discount rate and represents the relative weightplaced between present and future cohorts. Note that it is possible for lt > 1 for some arbitrarygeneration t, but for exposition it is convenient to assume that discounting is geometric—thatis, lt = l ≤ 1. The socially efficient allocation of resources is then the solution to a standard opti-mization problem:
(4)
subject to
δ( ) ( )+ + = + −− − + 11 1 1 1 1N c N c K F K ,N Kt ,t t ,t t t t t
δ( )( ) ( )++
+ + = + −− +1
11 11 1 1 1c
nc n k f k k .,t ,t t t t
1 2 00
1 2 1∑βλ λ β( ) ( ) ( )= + + −=
∞
+V u c u c u c .,t
t ,t ,t
max00
11
2∑λ βλ( ) ( )( ) = + =
∞−V k u c u c
t
t,t ,t
Federal Reserve Bank of St. Louis REVIEW November/December 2012 423
(5)
The objective function has been rewritten to illustrate the redistributive trade-offs betweenexisting old cohorts and the new young cohort. A higher value of l assigns more weight to thenewborn and future generations and less to the current individuals. The first-order conditionsof the optimization program imply
(6)
and
(7)
Both conditions are standard. Equation (6) equates the marginal rate of substitution of theyoung and the old at a given point in time. When l = b , both individuals receive the sameamount of per capita consumption. When the weight on the young cohort is larger, c1,t > c2,t.Equation (7) is the standard Euler equation but compares the marginal rate of substitutionbetween a newborn in period t and t +1 with the marginal rate of transformation. Combiningboth expressions, the model implies the standard Euler equation from the two-period overlapping-generations model as follows:
(8)
In steady state, the allocation of resources perfectly separates the production process (deter-mination of the capital stock and employment) since the steady-state stock of capital ks is deter-mined solely from equation (7),
(9)
while steady-state consumption c1s and c2
s solve
(10)
(11)
Since l > 1, the economy always satisfies the condition for dynamic efficiency. Note that for theextreme case of l = 1, the economy satisfies the golden rule f ¢(k*) = n + d. Many analyses of thismodel ignore the role of social discounting, implicitly setting l = 1, and maximize the savingsrate subject to the steady-state resource constraint. However, this particular case of the Paretofrontier is not useful for the study of intergenerational redistribution when the relative impor-tance of one group increases.
If the analysis is restrained to only steady-state allocations, then equations (9) through (11)yield a unique solution for any value of l . It is clear from equation (9) that for l > 1, ks > k* andthe economy has more capital than prescribed by the golden rule. This is the case studied by
11 11
21 δ( )( ) ( )+
++ + = + −+c
cn
n k f k k .,t,t
t t t
11 2λ β( ) ( )( )′ = + ′u c n u c,t ,t
1 11 1 1 1λ δ( ) ( ) ( )( )+ ′ = ′ − + ′ + +n u c u c f k .,t ,t t
!u c1,t( )=! !u c2,t+1( ) 1"!+ !f kt+1( )#$ %&.
1 11λ δ( ) ( )′ = + + −−f k n ,s
λ β( ) ( )( )′ = + ′11 2u c n u cs s
112 δ ( )( )+
++ + =c c
nn k f k .s
ss s
Bullard, Garriga, Waller
424 November/December 2012 Federal Reserve Bank of St. Louis REVIEW

Bullard and Waller (2004), who looked at only political economy allocations rather than a plan-ner allocation. In this sense, any political economy allocation occurring in the steady state oftheir model can be replicated by an appropriate choice of l confronting a social planner. How -ever, since we want to study the dynamic behavior of inflation following a baby boom and bust,we cannot constrain our analysis to steady states. This forces us to study allocations for which l ≤ 1.
Implementation of the Efficient Problem: Lump-Sum Transfers
Markets can achieve the same allocation as the social planner. However, doing so requires atransfer of resources across cohorts using lump-sum taxation. The optimization problem of therepresentative newborn is given by
(12)
subject to
(13)
and
(14)
The term Ti,t represents intergenerational transfers across cohorts at time t. The term rt is themarket interest rate earned from capital, and wtlt represents labor income. The optimality con-ditions imply
The optimal interest rate determined by the intergenerational discount rate can be implementedby shifting resources across cohorts at a given period t; this ensures that the young cohort savesthe right amount, implementing the fully efficient solution. The market clearing condition forcapital implies (1 + n)kt+1 = st. The government budget constraint implies
(15)
This economy is not particularly useful because neither fiscal nor monetary policy is usedto implement the efficient solution. This is no longer true in the absence of redistributional policy.In this case, the direct mechanism needs to respect the distributional restrictions implied by themarket. However, a constrained planner can internalize the impact of the decisions on factorprices. This solution should be superior to the one in which the direct mechanism does not con-sider the effect of aggregates on factor prices. The constrained efficient solution implies a wedgein market decisions (for instance, inflation or capital taxation). The optimal wedge (positive ornegative) is determined by the social desirability of redistributing resources across cohorts.
max 1 2 1β( ) ( )+ +u c u c,t ,t
1 1+ = +c s w l T ,,t t t t ,t
12 1 1 2 1δ( )= − + ++ + +c r s T .,t t t ,t
β δ( ) ( ) ( )′ − + = ′ − + + ++ + +1 11 1 2 1 1u w l s T u r s T r .t t t ,t t t ,t t
101
2++
=TTn
.,t,t
Bullard, Garriga, Waller
Federal Reserve Bank of St. Louis REVIEW November/December 2012 425
Constrained Efficient Allocations: Ramsey
In the efficient allocation, the social planner has access to lump-sum taxes and transfers.Since lump-sum taxes and transfers are rarely used in practice, we follow the traditional Ramseyapproach of public finance and assume that the social planner (i) does not have access to lump-sum taxes and transfers and (ii) faces the same market prices as agents. These assumptions implythat the only way to increase consumption for a given cohort is to manipulate the incentives tosave and the implied relative prices. By taking into account the effects on relative prices, theplanner does not need to manipulate the allocations that much. Consider
(16)
subject to
(17)
and
(18)
where (1 + n)kt+1 = st. This optimization problem is equivalent to (i) the Ramsey problemsdescribed in Garriga (2001) when the government expenditure is set equal to zero or (ii) thesteady-state analysis when the planner faces no intergenerational conflict, l = 1, as in Dávila(2012).
Let g1,t and g2,t represent the Lagrange multipliers of the distributional constraints (17) and(18), respectively. It is important to stress that each resource constraint effectively provides anentitlement for each individual, and thus g1,t and g2,t are endogenous weights affecting the distri-bution of resources. The first-order conditions of this problem for every period t yield
(19)
The endogenous weights are the same, g1,t = g2,t, only if the planner does not have redistributionalconflicts. When a particular cohort controls more resources, its endogenous weight is lower,thereby making it easier to transfer resources from that cohort to the other. In short, intergener-ational redistribution trades off the relative importance of each cohort, l , with the cohort’sownership of resources, g.
The intergenerational decision on savings (capital) is more complicated:
(20)
An increase in savings reduces consumption of the current generation, c1,t. The additional sav-ings (i) increases future consumption of the generation that saves the resources by the marginal
max00
11
2∑λ βλ( ) ( )( ) = + =
∞−V k u c u c
t
t,t ,t
111=
+
−−c f s
nl s ,,t l
tt
112
11δ= − +
+
−−c f s
ns ,,t k
tt
11
2
1
2
βλ
γγ
( )( )
( )′
′=
+u c
u cn
.,t
,t
,t
,t
1 11
1 1 11 1 11
2 11 1γ γ γ δ=
+
++ − +
+
+
+
+
+
−+
− −f sn
ln
f sn
f sn
sn
.,t ,t l ,kt
,t kt
k ,kt t
Bullard, Garriga, Waller
426 November/December 2012 Federal Reserve Bank of St. Louis REVIEW

product of capital, (ii) increases the wages of future newborn cohorts at t+1, and (iii) reducesthe future rate of return of all savings. Replacing the multipliers implies
(21)
As l increases, the relative importance of the young cohort increases, the effect of saving onfuture wages is more important, and the economy accumulates more capital. In the absence ofintergenerational redistribution, the only way to induce additional savings is to subsidize capital.This expression can be rewritten in wedge form as
(22)
where fk,kk = –fl,kl. The constrained efficient solution is fully efficient only when fk,k = 0. Other -wise, the efficient solution implies an optimal wedge (positive or negative) in savings decisions.The magnitude of the wedge depends on the relative influence of each generation in the planner’sobjective function. Let
(23)
be the elasticity of marginal product to changes in the capital stock. If the production functionis linear or has a constant marginal product, the social planner cannot manipulate prices. Theother wedge is determined by
(24) .
Replacing the definition of the wedges in the optimality condition implies
(25)
To simplify, assume that the depreciation rate d = 1:
(26)
In this case, it is clear that the relative strength of each wedge determines the magnitude of thewedge (larger or smaller than 1). The wedge jk is determined by the income distribution in theconstraints in the economy, whereas jl is also determined by the relative importance of theyoung cohorts versus the older ones.
1 1
11 1 1
1 1 11
2 11 1
λ
β δ
( ) ( )
( )
′ = ′+
+
+ ′ − ++
+
+
+
+−
+− −
u c u c f sn
ln
u c f sn
f sn
sn
.
,t ,t l ,kt
,t kt
k ,kt t
1
11
2 1
1 1 1
1 1
1 1
1 1
1
1β
δ
λ
( )( )
( ) ( )( )
′
′=
− + +
+ ( )( )+
+ + +
′
′ + +
− −
+ −
u c
u c
f f
f,,t
,t
ksn k ,k
sn
sn
u c
u c k ,ksn
ln
t t t
,t
,t
t
1ϕ ( ) ( )= <f k k
f kk
k ,kk
1 111
1 1
1
1ϕ λ ( )( )=
′
′ +
+<λ
++ −
u c
u cf s
nlnt
,t
,tk ,k
t
1 1
11
2 1
1 1
1
1
β
δ ϕ
ϕ( )( )
( )( )( )
′
′=
− + + + λ
+
+ +
+
−u c
u c
f.,t
,t
ksn t
k
t
t
u c
u cf s
n.,t
,tk
t tk
t111
1
2 1
1 1
1βϕϕ
( )( )
( )( )
′
′=
+
++ λ
+
− +
+
Bullard, Garriga, Waller
Federal Reserve Bank of St. Louis REVIEW November/December 2012 427

Implementation by Means of Optimal Wedges
The implementation of the constrained problem requires wedges and transfers within agiven cohort. The optimization problem of the representative newborn is given by
(27)
subject to
(28)
and
(29)
This formulation does not allow for intergenerational redistribution—all resources are trans-ferred within the same cohort. The optimality condition of the consumer problem implies
(30)
This formulation is silent about the tax instrument used to implement these wedges. Severalinstruments (e.g., inflation or capital taxation) can manipulate the relative rate of return of sav-ings. To illustrate the importance of these wedges, we compute some numerical examples thatshow findings comparable to those of Bullard and Waller (2004).
MONEY AND CAPITALPricing an Additional Asset
Since the optimal intergenerational redistribution determines the equilibrium interest rate,we can also think about these parameters as the determining factors in an economy in whichcapital and money are perfect substitutes. Thus, the equilibrium return on capital pins down thereal rate of return on money and thus the inflation rate. In this economy, one can imagine theper capita money growth rate evolving according to Mt+1(1 + n) = (1 + zt)Mt. The real rate ofreturn on money is given by (1 + pt)–1, where pt is the net inflation rate in period t. Arbitragethen implies that
(31)
We do not explicitly model the reason agents hold money in this economy. Rather, we think ofthis exercise as being able to price an asset that is held in zero net supply. This is similar in spiritto Woodford’s (2003) “cashless” economy.
Since the rate of return from capital is the same as money, it is possible to write the consumer’sbudget constraint as
max 1 2 1β( ) ( )+ +u c u c,t ,t
1 + =c s w l ,,t t t t
1 112 1
1 1
11
δ ϕϕ( )
=− + +
++λ+
+ +
++c
rs T .,t
t tk
tt t
1 111 1
1 1
1 1
11 1
1β
δ ϕϕ( )( )′ −
′
+
=− + +
+δ ϕ
ϕ
λ( )− + +
+ +
+ +
+λ
+ +
+
u w l s
u s T
r.t t t
rt t
t tk
tt tk
t
11
11π
( ) =+
= ++
f k nz.k t
t t
Bullard, Garriga, Waller
428 November/December 2012 Federal Reserve Bank of St. Louis REVIEW

(32)
where vt+1/vt = (1 +n)/(1 + zt) = 1/(1 + tt). The term vt+1/vt is the rate of return from holdingmoney, n is the population growth rate, and z is the rate of money growth. These terms shouldbe equal to the optimal wedge t. Replacing the expression in the budget constraint implies
(33)
The optimal wedge takes a different form, but it affects the relative price of consumption.Arbitrage between money and capital ensures that the economy implements the constrainedefficient stock of capital. This model ties the constrained efficient level of capital to the impliedinflation rate that would have to prevail to equate rates of return on assets.
It is important to emphasize that the optimal rate of inflation is derived from the primitivesof redistribution and not the other way around. If we impose the arbitrage condition into theplanner’s problem, the optimal capital stock would be determined by z. In this case, the effectsof savings in the stock of capital become irrelevant because the exogenous arbitrage conditionwould determine the efficient stock of capital, and the level would not necessarily be consistentwith the intergenerational discount factor l .
Numerical Example
Functional Forms and Optimality. The numerical example compares the solution of theunconstrained efficient problem with the constrained one. The objective is to illustrate the dif-ferences in capital stocks achieved by these economies and the implied redistributional policies.We consider individual preferences of the form
(34)
where s represents the curvature of the utility function. The production technology is Cobb-Douglas f(k) = Aka. The term A represents the productivity level and a the curvature parameter.For this functional form, the unconstrained efficient problem has a closed-form solution. Theoptimal level of capital depends on the intergenerational parameter l . A larger weight on futuregenerations implies a higher capital stock and higher wages for the young cohort:
(35)
Given the level of capital, the distribution of consumption depends on l :
(36)
whereby higher values of l imply lower relative consumption for the current old cohort. Finally,the level of consumption for each cohort is determined by net output:
2 11
1=++
+c vv
s ,,tt
tt
τ( )+ =+ +1 2 1 1c s .t ,t t
1 11 2 111
2 11
σβ
σ( ) =−
+−
σ σ
+
−+
−
U c ,cc c
,,t ,t,t ,t
1 1.
11
λ α λλ δ
( )( )
=+ − −
∗
α−
k An
12 1
1
βλ
( )=+
σ
cn
c ,
Bullard, Garriga, Waller
Federal Reserve Bank of St. Louis REVIEW November/December 2012 429
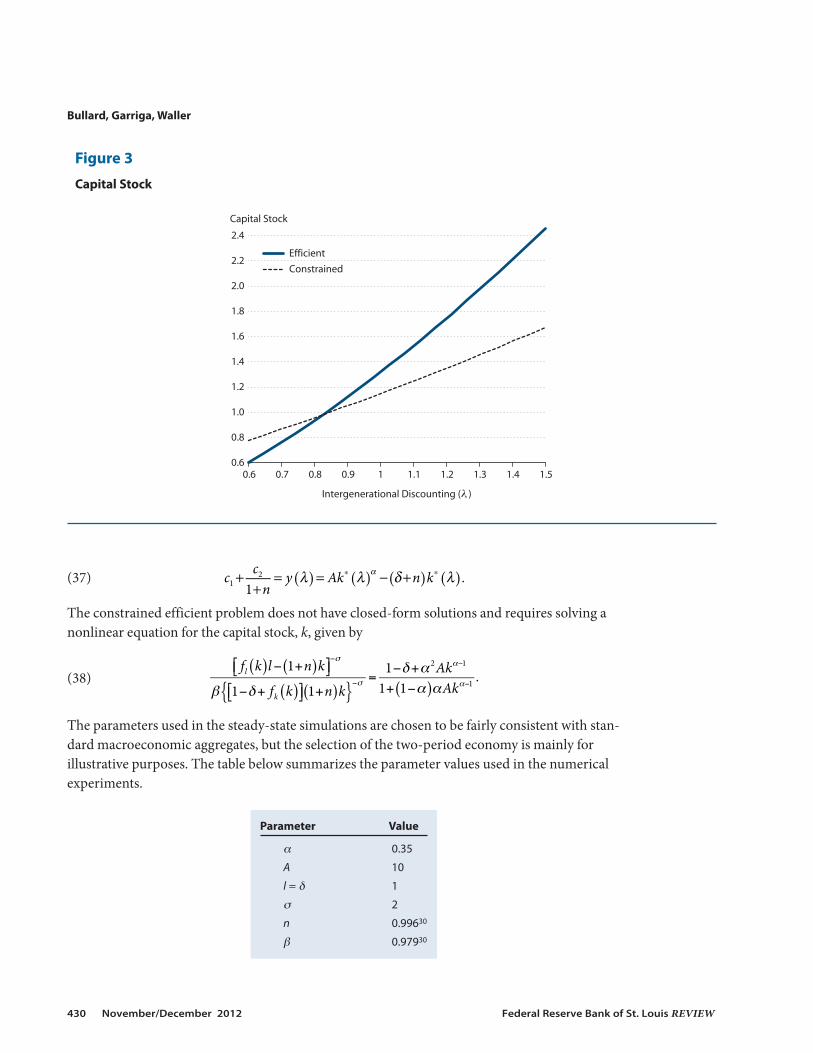
(37)
The constrained efficient problem does not have closed-form solutions and requires solving anonlinear equation for the capital stock, k, given by
(38)
The parameters used in the steady-state simulations are chosen to be fairly consistent with stan-dard macroeconomic aggregates, but the selection of the two-period economy is mainly forillustrative purposes. The table below summarizes the parameter values used in the numericalexperiments.
112 λ λ δ λ( ) ( ) ( ) ( )+
+= = − +α∗ ∗c c
ny Ak n k .
fl k( )l! 1+n( )k!" #$%!
" 1!!+ fk k( )!" #$ 1+n( )k{ }!! =
1!!+! 2Ak!!1
1+ 1!!( )!Ak!!1.
Bullard, Garriga, Waller
430 November/December 2012 Federal Reserve Bank of St. Louis REVIEW
0.6 0.7 0.8 0.9 1 1.1 1.2 1.3 1.4 1.50.6
0.8
1.0
1.2
1.4
1.6
1.8
2.0
2.2
2.4
Intergenerational Discounting (λ )
Capital Stock
Efficient
Constrained
Figure 3
Capital Stock
Parameter Value
a 0.35
A 10
l = d 1
s 2
n 0.99630
b 0.97930
Steady-State Comparisons. Given this parameterization, Figure 3 summarizes the optimalcapital stock for both constrained and unconstrained economies as a function of the parameterl . The capital stock is plotted as deviations from the efficient level. There exists a parameter lfor which the constrained efficient solution is optimal.
Higher values of l imply that the constrained solution has an insufficient level of capitalcompared with the efficient solution. The reason is that as more weight is placed on the futureyoung, the current cohort must save more and reduce its consumption. This increases theendogenous component g2 and prevents the economy from achieving the efficient solution. Themodel predicts the opposite effect for low values of l. The economy is not dynamically inefficientin the classical sense, r < n + d , but the market solution can have too much or too little capitalrelative to the efficient (dynamically efficient) level.
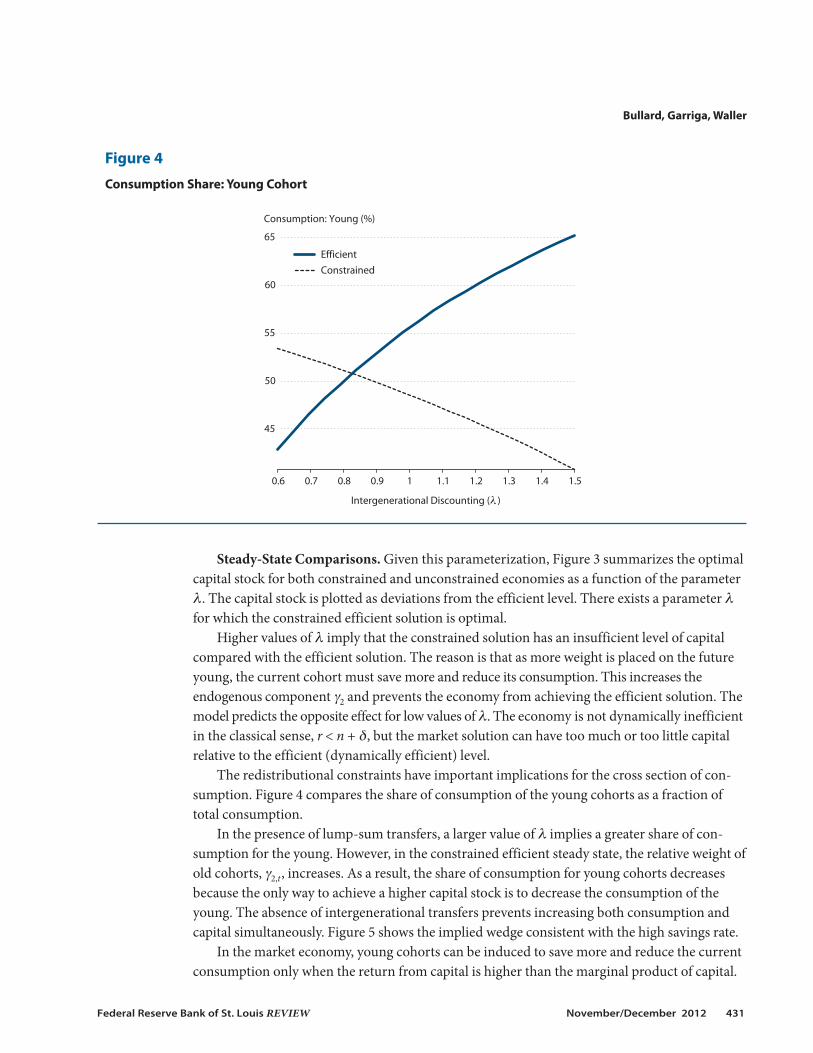
The redistributional constraints have important implications for the cross section of con-sumption. Figure 4 compares the share of consumption of the young cohorts as a fraction oftotal consumption.
In the presence of lump-sum transfers, a larger value of l implies a greater share of con-sumption for the young. However, in the constrained efficient steady state, the relative weight ofold cohorts, g2,t, increases. As a result, the share of consumption for young cohorts decreasesbecause the only way to achieve a higher capital stock is to decrease the consumption of theyoung. The absence of intergenerational transfers prevents increasing both consumption andcapital simultaneously. Figure 5 shows the implied wedge consistent with the high savings rate.
In the market economy, young cohorts can be induced to save more and reduce the currentconsumption only when the return from capital is higher than the marginal product of capital.
Bullard, Garriga, Waller
Federal Reserve Bank of St. Louis REVIEW November/December 2012 431
45
50
55
60
65
Consumption: Young (%)
0.6 0.7 0.8 0.9 1 1.1 1.2 1.3 1.4 1.5
Intergenerational Discounting (λ )
Efficient
Constrained
Figure 4
Consumption Share: Young Cohort

When the economy has too much capital relative to the efficient level, the optimal strategy is toreduce the return on savings of the old cohorts.
The notion of inflation or deflation should be viewed relative to the efficient magnitude, p *.It is possible to construct examples where the constrained efficient inflation rate is negative, p < 0, or positive, p > 0. The role of redistributional policy implies that p (l < l*) < p (l*) < p (l > l*) for different ranges of l . When population growth is positive, the equilibrium interestrate is always positive, r = n, and the redistribution is accomplished by changing the optimalrate of deflation, z* < 0. When the size of the population shrinks (i.e., after a baby boom), then r = n < 1 and the efficient rate of inflation can be positive or negative depending on the distribu-tional factor l . Figure 6 summarizes the annualized inflation rate implied by the model.
In this economy, the monetary equilibrium implies r < 1, and as a result the crossing linebetween efficient and constrained solutions implies p > 0. The relevant result is not the level ofinflation but the relative preference for different individuals in the population. This economyillustrates the basic trade-off between the young and old cohorts: The young cohorts prefer higherinflation (or less deflation) and the old cohorts prefer the opposite. This trade-off is clear in theefficient economy and the constrained efficient economy, but the relative difference in botheconomies is due to the absence of intergenerational transfers. When the old cohorts are rela-tively more important, the optimal inflation rate is determined by the size of the capital stock.Ideally, it would be optimal to have more capital, but the young are the ones who need to giveup consumption to achieve the needed level of savings. Since this would violate their budgetconstraint, the resulting policy implies deflation (redistribution toward the old), but the magni-tude is not as large as in the efficient case because of the binding role of the redistributionalconstraints.
Bullard, Garriga, Waller
432 November/December 2012 Federal Reserve Bank of St. Louis REVIEW
0.8
1.0
1.2
1.4
1.6
1.8
2.0
Wedge (<1= Tax | >1= Subsidy)
0.6 0.7 0.8 0.9 1 1.1 1.2 1.3 1.4 1.5
Intergenerational Discounting (λ )
Efficient
Constrained
Figure 5
Optimal Wedge

Bullard, Garriga, Waller
Federal Reserve Bank of St. Louis REVIEW November/December 2012 433
−0.5
0
0.5
1.0
1.5
2.0
Percent
0.6 0.7 0.8 0.9 1 1.1 1.2 1.3 1.4 1.5
Intergenerational Discounting (λ )
Efficient
Constrained
Figure 6
Annualized Inflation (n < 0)
−1.5
−1.0
−0.5
0
0.5
1.0
0.6 0.7 0.8 0.9 1 1.1 1.2 1.3 1.4 1.5
Intergenerational Discounting (λ )
Efficient
Constrained
Percent
Figure 7
Annualized Inflation (n = 0)

The level of inflation depends on the growth rate of the population. With stationary popu-lation growth, n = 0, the interest rate is always above 1 percent and the optimal inflation isalways negative (Figure 7).
The model also predicts that the young cohorts prefer a lower negative growth of money,whereas the old cohorts prefer a higher rate of deflation. The quantitative magnitudes dependon the parameterization, but the qualitative tension between young and old cohorts is consis-tent with the political economy equilibrium of Bullard and Waller (2004).
The revenue/loss raised by the optimal wedge is rebated to the old cohort. Figure 8 comparesthe tax/transfers paid by the old cohort for both economies.
For a given value of l , the efficient economy always has more redistribution than the con-strained efficient one. When both economies achieve similar capital stock levels, the role ofredistribution becomes less important and the consumption shares of each cohort are nearly thesame.
TRANSITIONAL DYNAMICSThe steady-state calculations are useful only to illustrate the static trade-off. By definition,
the young and the old cohorts must face the same prices. The current young cohort might earna high wage today but will be an old cohort tomorrow, earning a low rate of return. In the tran-sition path, the stock of capital changes; therefore, the prices faced by a given generation at timet will differ from those faced by the next generation at t+1.
Bullard, Garriga, Waller
434 November/December 2012 Federal Reserve Bank of St. Louis REVIEW
−7
−6
−5
−4
−3
−2
−1
0
1
Taxation
0.6 0.7 0.8 0.9 1 1.1 1.2 1.3 1.4 1.5
Intergenerational Discounting (λ )
Efficient
Constrained
Figure 8
Taxes and Transfers

The intuition is clear from the Euler equation of the constrained efficient problem:
(39)
An increase in savings reduces the consumption of the current young, c1,t; increases the com-pensation of the future young cohort, c1,t+1, through wages; and decreases the return from sav-ings of the young cohort next period, c2,t+1. Because the current young and the future old are thesame individuals, the relative weight l t cancels.
The Euler equation of the efficient solution is very different but has the same economicinterpretation. The intergenerational redistribution is done directly; as a result, market pricesare not distorted:
(40)
It is clear from the expression that an increase of the relative weight of future cohorts,l t+1/l t > 1, will reduce consumption of the current generation (increase in savings) relative tofuture generations. The increased savings are sustained by intergenerational transfers.
A simple way to capture the effects of demographic changes is to adjust the relative impor-tance of a given cohort in the social welfare function. When current generations become rela-tively more important than future generations, the capital stock will increase. A higher capitalstock reduces the return on savings and increases workers’ compensation.
In the experiment we adjust the initial discount rate l so both economies start with thesame stock of capital. Therefore, the constrained economy is efficient with an optimal wedgeequal to zero. The implied inflation is determined by the arbitrage condition between capitaland money. We consider two different sequences of intergenerational weights {l t}. In case 1,the relative importance of young cohorts increases during a small number of periods. In case 2,the high l is maintained during a larger number of periods. The difference sequences illustratedin Figure 9 summarize the behavior of the model in these two cases.
Our desired interpretation is that the young cohorts become temporarily more importantin the determination of the optimal policy. The change is transitory and eventually reverts tothe initial level. The change in the social discount rate has implications for savings and con-sumption. The initial steady state is no longer optimal at the new discount rates {l t}. The implicitbaby boom generates a change in policy. To incentivize savings the rate of return on moneymust decrease (this is the standard Tobin effect in this model). The implied policy generates ahump-shaped response from inflation.
Figure 10 summarizes the evolution of annualized inflation along the transition path. Botheconomies increase the inflation rate relative to the initial steady state. The persistence of infla-tion is entirely determined by l.5 Along the transition path the rise in savings increases thecompensation of working generations and reduces the return from savings for the existing oldcohort. In the efficient economy, the optimal inflation rate can be sustained by intergenerationalpolicy. The constrained economy has more limitations regarding the transfer of resources acrossgenerations. Market prices are the only mechanism young individuals can use to save the rightamount. As a result, the constrained inflation rate is lower during the boom but higher during
1 111
1 1 11
2 12
11λ
λα α β δ α( )= − + − +
σ σ α σ α− ++
−+−
+−
+−c c Ak c Ak .,t
t
t,t t ,t t
111
1 1 11λ
λδ α= − +
σ σ α− ++
−+−c c Ak .,t
t
t,t t
Bullard, Garriga, Waller
Federal Reserve Bank of St. Louis REVIEW November/December 2012 435

Bullard, Garriga, Waller
436 November/December 2012 Federal Reserve Bank of St. Louis REVIEW
0 10 20 30 40 50 60 70 80 900.4
0.6
0.8
1.0
1.2
1.4
1.6
0 10 20 30 40 50 60 70 80 900.4
0.6
0.8
1.0
1.2
1.4
1.6
Intergenerational Discounting (λ ) Intergenerational Discounting (λ )
Transitory Persistent
Periods (t) Periods (t)
Figure 9
Intergenerational Discount Rate
10 20 30 40 50 60 70 80 90
−1.0
−0.5
0
0.5
1.0
1.5
10 20 30 40 50 60 70 80 90
−0.6
−0.4
−0.2
0
0.2
0.4
0.6
0.8
1.0
1.2
1.4
Efficient
Constrained
Annualized Inflation (percent) Annualized Inflation (percent)
Transitory Persistent
Periods (t) Periods (t)
Figure 10
Annualized Inflation

the bust. The underlying income distribution between wage earners and the asset-holding gen-eration places bounds on the optimal policy.
The increase in the savings rate reduces the return from capital and increases the workers’compensation. Figure 11 summarizes the evolution of real interest rates as a percentage changeof the initial steady state. The path of interest rates is entirely driven by the sequence of {l t}. Inthe constrained efficient economy, the optimal inflation rate is not sufficiently high to encouragea higher savings rate. As a result, the interest rate does not fall as much during the boom andworkers’ compensation cannot increase to the efficient levels.
CONCLUSIONWe study the interaction among population demographics, the desire for redistribution of
resources in the economy, and the optimal inflation rate in a deterministic economy with capi-tal. In the economy we study, changes in the population structure are interpreted as the abilityof a particular cohort to influence redistributive policy. The intergenerational redistributionaltension is intrinsic in life cycle models. Young cohorts have few assets and wages are the mainsource of income. Old generations work less and prefer a high rate of return from their savings.When the government has access to lump-sum taxes and transfers, redistributive policy neednot resort to distortionary measures (such as capital taxes or inflation). When lump-sum trans-fers are not possible but the planner is allowed to use inflation or deflation to achieve as muchof the redistribution as possible, there exists a competitive equilibrium with a constrained effi-cient redistributive policy. The equilibrium requires optimal distortions on relative prices that
Bullard, Garriga, Waller
Federal Reserve Bank of St. Louis REVIEW November/December 2012 437
0 10 20 30 40 50 60 70 80 90 100−50
−40
−30
−20
−10
0
10
20
0 10 20 30 40 50 60 70 80 90 100−50
−40
−30
−20
−10
0
10
20
Percent Change Percent ChangeTransitory Persistent
Efficient
Constrained
Periods (t) Periods (t)
Figure 11
Interest Rates

are necessary to achieve the constrained efficient allocation. When the old have more influenceover this redistributive policy, the economy has a lower steady-state level of capital, a highersteady-state real rate of return, and a lower or negative rate of inflation. By contrast, when theyoung have more influence, the economy has more capital than the efficient level, wages are rela-tively high, and the market solution requires a low rate of return from money holdings—that is,a relatively high inflation rate.
When demographics are changing, the constrained efficient solution requires an entiretransition path that alters capital stocks, inflation, real wages, consumption, and other keymacroeconomic variables. In particular, a baby boom can generate temporarily higher inflation,and aging population dynamics will put downward pressure on inflation or even lead to deflation.This scenario seems broadly consistent with the rough evidence presented in Figures 1 and 2.
In this article, we have allowed a planning problem to substitute for the political processesused by society to make decisions concerning redistributional policy. More concrete examplesof political processes, including a policy committee that uses Nash bargaining to reach a socialdecision, are studied in Bullard and Waller (2004). By contrast, in this article the planner opti-mally chooses inflation or deflation to achieve as much of the desirable redistribution as possiblegiven that the choice of inflation or deflation provides only a partial substitute for a fully opera-tional lump-sum tax and transfer scheme. The society could use other types of distortionarytaxes to achieve similar goals, so we interpret our findings as providing an assessment of themarginal contribution of inflation or deflation in this process, taking the existing distortionarytax system as fixed and immutable.
At face value, the results in this article contribute to the debate concerning the observationof mild deflation in Japan with its aging population structure. The results suggest that the agingpopulation may be optimally associated with lower inflation as part of the constrained efficientequilibrium. We think it will be interesting to study this hypothesis further in models that canmore realistically quantify these effects. For example, the presumption that the young preferhigh wages and the old prefer high returns on wealth could be tested using cross-country data.The model needs further development in terms of the role of monetary policy because monetarypolicy plays no role in determining inflation rates in an economy where capital and money havethe same rate of return.
NOTES1 “Closely related” would apply to cases where the return on capital and the return on money were not exactly equalbut differed only by a constant, so that the two rates still moved in tandem.
2 The moving average inflation rate in Japan during the mid-1970s is truncated at 10 percent to allow a better view ofthe two data series.
3 Bullard and Waller did not focus directly on demographic effects.
4 Judd (1985) considers a redistributional trade-off between wage earners and capital earners. In that economy, theoptimal redistribution is independent of the relative weight of each group in the social welfare function. In terms ofmonetary policy, in that economy the central bank should set the nominal interest rate to zero.
5 The nature of the two-period problem requires an assumption of a high depreciation rate; we used d = 1. Given thatall capital depreciates from one period to the next, the dynamics in terms of quantities per period are very fast. Webelieve the same dynamics would hold in more elaborate general equilibrium life cycle settings, but the computa-tional cost would be higher.
Bullard, Garriga, Waller
438 November/December 2012 Federal Reserve Bank of St. Louis REVIEW
REFERENCESBullard, James and Waller, Christopher J. “Central Bank Design in General Equilibrium.” Journal of Money, Credit, and
Banking, February 2004, 36(1), pp. 95-113.
Dávila, Julio. “The Taxation of Capital Returns in Overlapping Generations Models.” Journal of Macroeconomics, June2012, 34(2), pp. 441-53.
Dávila, Julio; Hong, Jay H.; Krusell, Per and Ríos-Rull, Jóse-Victor. “Constrained Efficiency in the Neoclassical GrowthModel with Uninsurable Idiosyncratic Shocks.” Econometrica (forthcoming).
Garriga, Carlos. “Optimal Fiscal Policy in Overlapping Generations Models.” CREB Working Paper No. 0105, Center forResearch in Welfare Economics, January 2001.
Garriga, Carlos and Sánchez-Losada, Fernando. “Estate Taxation with Warm-Glow Altruism.” Portuguese EconomicJournal, August 2009, 8(2), pp. 99-118.
Judd, Kenneth L. “Redistributive Taxation in a Simple Perfect Foresight Model.” Journal of Public Economics, October1985, 28(1), pp. 59-83.
Woodford, Michael. Interest and Prices: Foundations of a Theory of Monetary Policy. Princeton, NJ: Princeton UniversityPress, 2003.
Bullard, Garriga, Waller
Federal Reserve Bank of St. Louis REVIEW November/December 2012 439

440 November/December 2012 Federal Reserve Bank of St. Louis REVIEW

Close
Research FocusCarlos Garriga’s recent research has focused on house price movements, mortgage finance, and the macroeco-nomic implications of housing. Past research has analyzed the issues of optimal fiscal policy, the design of socialsecurity reforms, and the financing of education.
Carlos GarrigaResearch officer and economist, Federal Reserve Bank of St. Louis
http://research.stlouisfed.org/econ/garriga/
Christopher J. WallerSenior vice president and director of research, Federal Reserve Bank of St. Louis
http://research.stlouisfed.org/econ/waller/
Research FocusChris Waller’s areas of interest are monetary theory, political economy, and macroeconomic theory.
James BullardPresident and CEO, Federal Reserve Bank of St. Louis
http://research.stlouisfed.org/econ/bullard/