demographic processes in bulgaria in 2012 demographic processes in bulgaria in 2012 population...
TRANSCRIPT

1
DEMOGRAPHIC PROCESSES IN BULGARIA IN 2012 Population number and structures The dynamics of demographic processes and changes in the population structures during the last decades strongly influence the basic systems of society: economic, education, health insurance and social protection.
The current demographic situation in Bulgaria is characterised by the continuing population decrease and ageing, decreasing crude birth rate and high level of mortality. As positive tendencies in 2012 could be mentioned the decreasing infant and premature mortality and increasing life expectancy at birth.
As of 31 December 2012 the population of Bulgaria is 7 282 041 persons or 1.5% of the EU population1 thus ranking the country at the 16th place immediately after Austria (8 443 thousand persons) and before Denmark (5 581 thousand persons). Compared to 2011, the country population decreases by 45 183 persons, or by 0.6%.
Male population is 3 543 606 (48.7%) and female - 3 738 435 (51.3%) or to 1 000 males correspond 1 055 females. Males prevail among the population aged up to 52 years. The number and share of females into the total population increase among the elderly.
Ageing of population continue. At the end of 2012 the persons aged 65 and over are 1 395 078 or 19.2% of the country population. Compared to 2011, the share of population aged 65 and over increases by 0.4 percentage points and compared to 2005 - by 2.0 percentage points. The aging of population is more intensive among females than among males. The share of females aged 65 and over is 22.2%, compared to 16.0% - males. The difference is due to the higher mortality among males and as a consequence – lower life expectancy.
The share of persons aged 65 and over is highest in districts Vidin (26.4%), Gabrovo (25.1%) and Lovech (24.3%). In 15 districts, people aged 65 and over are more than 20% of the district population. Lowest is the share of elderly population in districts Sofia (stolitsa) – 16.1% and Blagoevgrad (16.6%), Varna and Burgas - 16.8% and 16.7% respectively (Figure 1).
1 In the international comparisons, data on EU countries refer to 2011, source: Eurostat web site – http://epp.eurostat.ec.europa.eu/ .

2
Figure 1. Population aged 65 and over as of 31.12.2012 by districts
Ageing of population is observed in the most of EU member states. At the beginning of 2012, the share of population aged 65 and more for EU (27) is 17.8%. Highest is the share of elderly population in Germany and Italy - 20.6%, followed by Greece (19.7%), Portugal (19.4%) and Bulgaria (19.2%). Lowest is the share of elderly population in Ireland - 11.9%. As of 31.12.2012, children up to 15 years of age are 989 786 or 13.6% of the total population number. The share of children up to 15 years increases by 0.2 percentage points compared to 2011. The share of population under 15 years of age is highest in districts Sliven - 17.6% and Burgas - 15.0% of the district population. There are 15 districts, where the share of children up to 15 years is lower that the country one. Lowest is the share registered in district Gabrovo - 11.3%. Share of the youngest EU (27) population is 15.6%. In Germany, Bulgaria and Italy the share of population under 15 years is below 14.0%. Highest share is observed in Ireland (21.6%) and France (18.6%). As of 31.12.2012 the age dependency ratio2 is 48.7%, or to each persons in “dependent” ages correspond nearly two persons in “independent” ages. Compared to 2005 and 2011 the ratio is 44.5 and 47.5% respectively. The ratio is more favourable in urban areas – 43.5% than in rural – 64.7%.
In 15 districts the age dependency ratio is over 50.0%. Most unfavourable is the ratio in districts Vidin (62.5%), Lovech (60.4%) and Montana (59.3%) and most favourable are the values in Sofia (stolitsa) - 41.0% and Smolyan - 43.4%.
The ageing of population leads to increase of the population mean age. It increases from 40.4 years in 2001 to 41.2 years in 2005 and 42.8 years at the end of 2012.
2 Number of persons in “dependent” ages (persons under 15 years of age and 65 and more) per 100 persons in “independent” ages (persons aged 15 to 64 years) calculated in percentage.

3
Ageing of population is observed both in urban and rural areas. In urban areas the mean age of population is 41.7 years, compared to 45.8 years - in rural areas.
Figure 2. Mean age of population
39.940.4 40.6 40.8 41.0 41.2 41.4 41.5 41.7 41.8 41.9
42.7 42.8
38,038,539,039,540,040,541,041,542,042,543,043,5
2000 2001 2002 2003 2004 2005 2006 2007 2008 2009 2010 2011 2012
Years
The tendency of population ageing influences also the distribution of population under, at and over working age. The last are influenced not only by population aging, but also by legislative changes3 concerning the retirement age. According to the legislation, in 2012 at working age are women up to completion of 60 years and 4 months and men up to completion of 63 years and 4 months.
The number of population at working age as of 31.12. 2012 is 4 503 thousand persons or 61.8% of the total population (Table 1). There are 2 363 thousand male at working age and 2 140 thousand female. Despite the increasing retirement age, the population at working age decreases by nearly 20 thousand or 0.4% compared to the previous year.
The number of population over working age is 1 731 thousand persons or 23.8% and under working age are 1 048 thousand persons or 14.4% of the country population.
3 Age limits used for distribution of population under, at and over working age are defined according to Ordinance on pensions and length of insurance, adopted by the Decree of the Council of Ministers N 30 (SG 21/17.03.2000). According to the last Ordinance amendments, the upper age limit for population at working age is to be increased by 4 months up to completion of 65 years for male and 63 years for female.

4
Table 1. Population under, at and over working age as of 31.12. (%)
Year Age groups Under
working age At working age Over working
age
1990 21.6 55.5 22.9 1995 19.1 56.6 24.3 2001 16.3 59.2 24.5 2005 14.8 62.4 22.8 2006 14.6 62.8 22.6 2007 14.5 63.0 22.5 2008 14.5 63.2 22.3 2009 14.5 63.1 22.4 2010 14.6 62.7 22.7 2011 14.3 61.7 24.0 2012 14.4 61.8 23.8
The reproduction of population at working age is characterized by the coefficient of demographic replacement, showing the ratio between the number of persons entering working age (15-19 years) and number of persons exiting it (60-64 years). As of 31.12.2012 the ratio is 64. For comparison, in 2001 each 100 persons exiting working age are replaced by 124 young persons.
Most favourable is the ratio in districts Sliven (79), Kardzhali and Blagoevgrad - 76 and Targovishte (74). Lowest is the ratio in districts Gabrovo and Vidin where 100 persons exiting working age are replaced respectively by 47 and 50 persons entering it.
Territorial distribution of population As of 31.12.2012 in urban areas live 5 306 233 or 72.9% of the total country population and in rural - 1 975 808 or 27.1%. For the first time the rural population is below 2 million persons. There are 5 278 settlements in Bulgaria at the end of 2012, of which 257 are towns and 5 021- villages. The distribution of urban and rural population at the end of year is a result not only of the natural increase and migration, but also of administrative changes. Based on the Council of Ministers decisions, 24 settlements are closed in 2012 and 20 of them are annexed to another ones.
There are 172 settlements without population in 2012. Highest is the number of settlements without population in districts Gabrovo, Veliko Tarnovo and Kardzhali.
The population number is between 1 and 49 persons in 1 130 or 21.4% of the settlements.
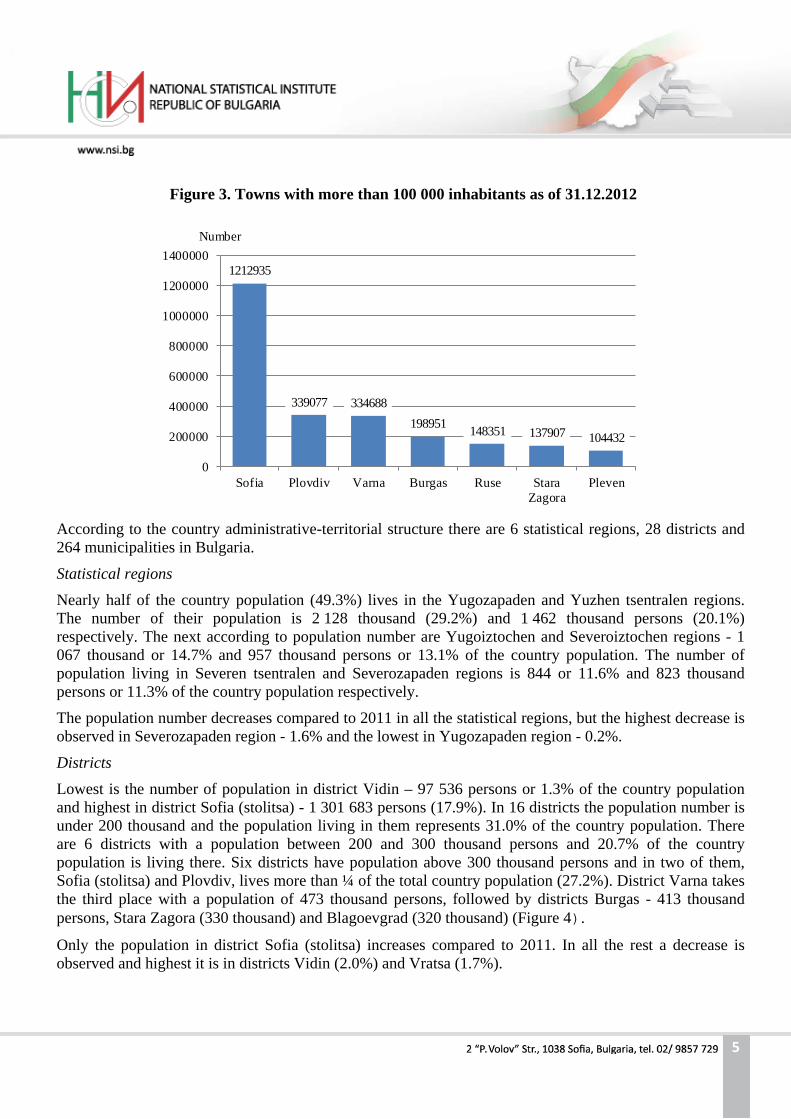
There are seven towns, with a population above 100 thousand persons and 34.0% of the country population lives there.
5
Figure 3. Towns with more than 100 000 inhabitants as of 31.12.2012
1212935
339077 334688198951 148351 137907 104432
0
200000
400000
600000
800000
1000000
1200000
1400000
Sofia Plovdiv Varna Burgas Ruse StaraZagora
Pleven
Number
According to the country administrative-territorial structure there are 6 statistical regions, 28 districts and 264 municipalities in Bulgaria.
Statistical regions Nearly half of the country population (49.3%) lives in the Yugozapaden and Yuzhen tsentralen regions. The number of their population is 2 128 thousand (29.2%) and 1 462 thousand persons (20.1%) respectively. The next according to population number are Yugoiztochen and Severoiztochen regions - 1 067 thousand or 14.7% and 957 thousand persons or 13.1% of the country population. The number of population living in Severen tsentralen and Severozapaden regions is 844 or 11.6% and 823 thousand persons or 11.3% of the country population respectively.
The population number decreases compared to 2011 in all the statistical regions, but the highest decrease is observed in Severozapaden region - 1.6% and the lowest in Yugozapaden region - 0.2%.
Districts Lowest is the number of population in district Vidin – 97 536 persons or 1.3% of the country population and highest in district Sofia (stolitsa) - 1 301 683 persons (17.9%). In 16 districts the population number is under 200 thousand and the population living in them represents 31.0% of the country population. There are 6 districts with a population between 200 and 300 thousand persons and 20.7% of the country population is living there. Six districts have population above 300 thousand persons and in two of them, Sofia (stolitsa) and Plovdiv, lives more than ¼ of the total country population (27.2%). District Varna takes the third place with a population of 473 thousand persons, followed by districts Burgas - 413 thousand persons, Stara Zagora (330 thousand) and Blagoevgrad (320 thousand) (Figure 4).
Only the population in district Sofia (stolitsa) increases compared to 2011. In all the rest a decrease is observed and highest it is in districts Vidin (2.0%) and Vratsa (1.7%).

6
Figure 4. Population as of 31.12.2011 by districts
Municipalities
The distribution of population by municipalities is not uniform. There are 62 municipalities with population below 6 000 and 3.3% of the country population lives there. At the same time, the population is over 200 000 persons in 4 municipalities - Stolichna, Varna, Plovdiv and Burgas and 30.2% of the country population lives there (Table 2).
Table 2. Size of municipalities according to the population number as of 31.12.2012
Size of municipality Municipalities Population
Number % Number %
Total 264 100.0 7282041 100.0
Up to 5999 62 23.5 237688 3.3
6000 - 19999 123 46.6 1352843 18.6
20000 - 49999 50 18.9 1422513 19.5
50000 - 99999 20 7.6 1382264 19.0
100000 and more 9 3.4 2886733 39.6

7
Basic factors influencing the changes of population number and structures are the demographic processes - fertility, mortality and migration.
Fertility There are 69 678 children born in 2012, of which 69 121 (99.2%) - live born. The number of live births decreases by 1 725 children or 2.4% compared to the previous year.
Figure 5. Live born children within the period 1990 - 2012
The crude birth rate4 in 2012 is 9.5‰, compared to 9.6‰ and 10.0‰ in 2011 and 2010.
The number of live born males (35 662) is by 2 203 higher compared to the live born females (33 459), or 938 females correspond to 1 000 males. The number of live born children in urban areas is 51 658 and in rural - 17 463. Crude birth rate in urban areas is 9.7‰ and in rural - 8.8‰. The respective figures for 2011 are 10.0 and 8.7‰.
Highest is the crude birth rate in districts Sliven - 12.0‰, Sofia (stolitsa) - 10.5‰ and Targovishte - 10.2‰. The crude birth rate is higher than the country average in ten districts. Lowest crude birth rate in 2012 is registered in districts Vidin and Smolyan - 7.2 and 6.6‰ respectively (Figure 6).
4 Number of live born children per 1 000 persons of the average annual population during the year.

8
Figure 6. Crude birth rate in 2012 by districts
Crude birth rate for the EU (27) is 10.4‰ according to the Eurostat data. Highest crude birth rate is observed in Ireland - 16.3‰, followed by Great Britain (12.9‰) and France (12.6‰). The crude birth rate in Bulgaria is at the level observed in Greece (9.4‰) and Austria (9.3‰). Lowest crude birth rate within the EU is registered in Hungary (8.8‰), Italy (9.0‰) and Latvia (9.1‰).
The number of women in fertile age (15 - 49 completed years) or the size and fertility of fertile contingents are crucial for the level of crude birth rate and the character of population reproduction. The number of women in fertile age as of 31.12.2012 is 1 625 thousand. It decreases by almost 26 thousand compared to the previous year and by 283 thousand compared to 2001.
The changes in age structure of fertile contingents contribute considerably to decrease of crude birth rate. It has to be taken into consideration that nearly 90% of births are realised by women aged 15 to 34 years. Their number in 2012 is 864 thousand and a decrease is registered compared to 2011 by 3.0% and by 19.2% - compared to 2005. The number of women in mentioned age group decreases mainly due to lower number of female, entering fertile age and the emigration processes.
Number of children born by mothers aged below 15 years decreases - from 335 in 2011 to 246 in 2012. At the same time, the number of children born by mothers aged 40 and more increases from 1 190 in 2011 to 1 208 in 2012.
Total fertility rate (TFR)5 is one of the basic indicators characterising fertility. The average number of live born children per women in 2012 is 1.50. TFR in 2001 is 1.24 children and in 2011 - 1.51 children (Figure 7).
5 Average number of live born children, whom a mother would give birth to during her entire fertile period according to the age specific fertility rates during the reporting year.

9
Figure 7. Marriages and live born children; TFR
The TFR for the EU (27) is 1.57 children in 2011. The mean age of women at first birth and at first marriage in 2012 remain at the 2011 levels - 26.3 and 27.0 years respectively. Comparing both indicators, a tendency is observed the birth of first child to precede the marriage.
There are 1 138 multi-foetal births registered in 2012. In 1 116 of the cases, there are two children born and in 22 - three children. Compared to 2011, an increase is observed by 19 multi-foetal births.
Stable tendency of increase of extramarital births has been observed since 1991. The share of extramarital births increases from 18.5% in 1992 to 42.0% in 2001 and 56.1% in 2011. The number of children born outside marriage in 2012 is 39 695 or 57.4% of the total number of live born.
The high extramarital fertility is due to considerable increase of the number of cohabiting without legal marriage young people.
In 69.8% of the cases of extramarital birth, data on the father is available, which means that most probably these children are grow up in families, by parents living in consensual union, without marriage.
Highest share of extramarital births is registered in districts Lovech (76.2%), Vidin (73.9%) and Sliven (73.0%) and lowest - in Kardzhali (41.5%), Blagoevgrad (41.9%) and Sofia (stolitsa) (48.0%).
The increase of extramarital births is observed in most of the EU countries. Highest is the share of extramarital births in Estonia - 59.7%, Slovenia - 56.8% and France - 55.8%, and lowest in Greece - 7.4%.

10
Mortality The mortality remains high in 2012. The number of dead persons is 109 281 and the crude mortality rate6 - 15.0‰. Compared to the previous year the number of dead people increases by 1 023 or 0.9%.
Figure 8. Deaths during the 1950 - 2012 period
Mortality among male (15.9‰) is higher compared to female (14.0‰). In 2012 there are 1078 deaths of male per 1 000 deaths of female. The considerable differences in mortality in urban and rural areas also remain. Mortality rate in rural areas (21.6‰) is higher than in urban ones (12.5‰).
Highest is the mortality in districts Vidin (23.2‰), Montana (21.4‰) and Kyustendil (19.1‰). These are the districts with the highest levels of the population ageing. The districts having a younger age structure have quite lower mortality rate. There are nine districts, which mortality rate is lower than the country average as lowest is the mortality in districts Kardzhali - 11.6‰ and Sofia (stolitsa) - 11.9‰, followed by Blagoevgrad and Varna - 12.1‰ (Figure 9).
6 Number of dead persons per 1 000 persons of the average annual population during the year.

11
Figure 9. Mortality rate in 2012 by districts
The mortality rate for the EU (27) in 2011 is 9.6‰. Compared to the other EU Member States the mortality rate in Bulgaria is rather higher (15.0‰). Lowest is the mortality in Ireland - 6.3‰ and Cyprus - 6.5‰. The mortality rate in Luxembourg, Malta, Netherlands, France, Spain and the United Kingdom is below 9.0‰. Higher is the mortality in Latvia - 13.9‰, Lithuania - 13.5‰ and Hungary - 12.9‰.
The premature mortality7 in 2012 is 22.3%, or a decrease by 1.0 percentage point is registered compared to 2011. Decreasing premature mortality shows that the high mortality level is mainly due to deaths in upper age groups. There are considerable differences in the premature mortality for males and females. The dead females aged up to 64 represent 14.2% of all dead females while among the males the same share is twice higher – 29.8%.
There are 536 children who die up to 1 year of age in 2012 and the infant mortality rate8 is 7.8‰ (Figure 10). The infant mortality rate has decreased steadily after 1997 when the highest value - 17.5‰ is registered (since 1990). The infant mortality in 2001 is 14.4‰, in 2005 – 10.4‰ and in 2011 – 8.5‰. The infant mortality observed in 2012 is the lowest registered in the country demographic development.
7 Share of deaths of persons below 65 years of age of the total number of deaths. 8 Number of children who die up to 1 year of age per 1 000 live born.

12
Figure 10. Mortality and infant mortality
12.513.6
14.7 14.2 14.6 14.7 14.8 14.5 14.2 14.6 14.7 15.0
14.8 14.8
17.5
14.4
10.4 9.7 9.2 8.6 9.0 9.48.5
7.8
0
2
4
6
8
10
12
14
16
18
20
1990 1995 1997 2001 2005 2006 2007 2008 2009 2010 2011 2012
‰
Mortality Infant mortality
The infant mortality rate for 2012 is lower than the country average in 10 districts. Lowest is it in districts Blagoevgrad - 2.3‰, Smolyan - 2.6‰ and Sofia (stolitsa) - 4.4‰. The highest infant mortality is registered in district Sliven (16.6‰). Rather higher than the country average is the infant mortality in districts Montana (14.4‰), Razgrad (13.1‰) and Yambol (11.9‰).
No matter the positive tendency of decrease, the infant mortality in Bulgaria is still higher compared to the other EU Member States. The only EU Member State in which the registered infant mortality is higher than in Bulgaria is Romania (9.4‰). In most of the EU Member States the infant mortality rate is below 5.0‰ and the lowest ones are observed in Sweden - 2.1‰, Finland - 2.4‰, Estonia - 2.5‰ and Czech Republic - 2.7‰.
The infant mortality for the EU (27) in 2011 is 3.9‰. The different mortality rates among male and female population, as well as among urban and rural population determine the difference in the life expectancy for the different population groups.
Life expectancy for the country calculated for the period 2010 - 2012 is 74.0 years. Within the period 2000 - 2002 the life expectancy is 71.9 years or within 10 years it increases by 2.1 years (Figure 11).
The life expectancy of males is 70.6 years, whereas of females it is 7 years higher or 77.6 years. The life expectancy of urban population (74.9 years) is higher than of rural (72.0 years).

13
Figure 11. Life expectancy by sex and periods
70.971.9
72.673.4 73.6 73.8 74.0
67.668.5 69.1
69.9 70.0 70.4 70.6
74.475.4
76.377.1 77.2 77.4 77.6
62
64
66
68
70
72
74
76
78
80
1990-1992 2000-2002 2004-2006 2007-2009 2008-2010 2009-2011 2010-2012
Age
Total Male Female
In 2011, total for the EU (27) the life expectancy is 80.4 years – 77.4 years for male and 83.2 years for female population. The life expectancy is highest in Italy - 82.8, Spain - 82.4 and France - 82.3 years. In these countries the life expectancy for female population is over 85 years. In 19 EU member states the life expectancy is over 80 years. Lowest life expectancy is registered in Lithuania (73.8), Latvia (73.9) and Bulgaria (74.0).
Marriages and divorces
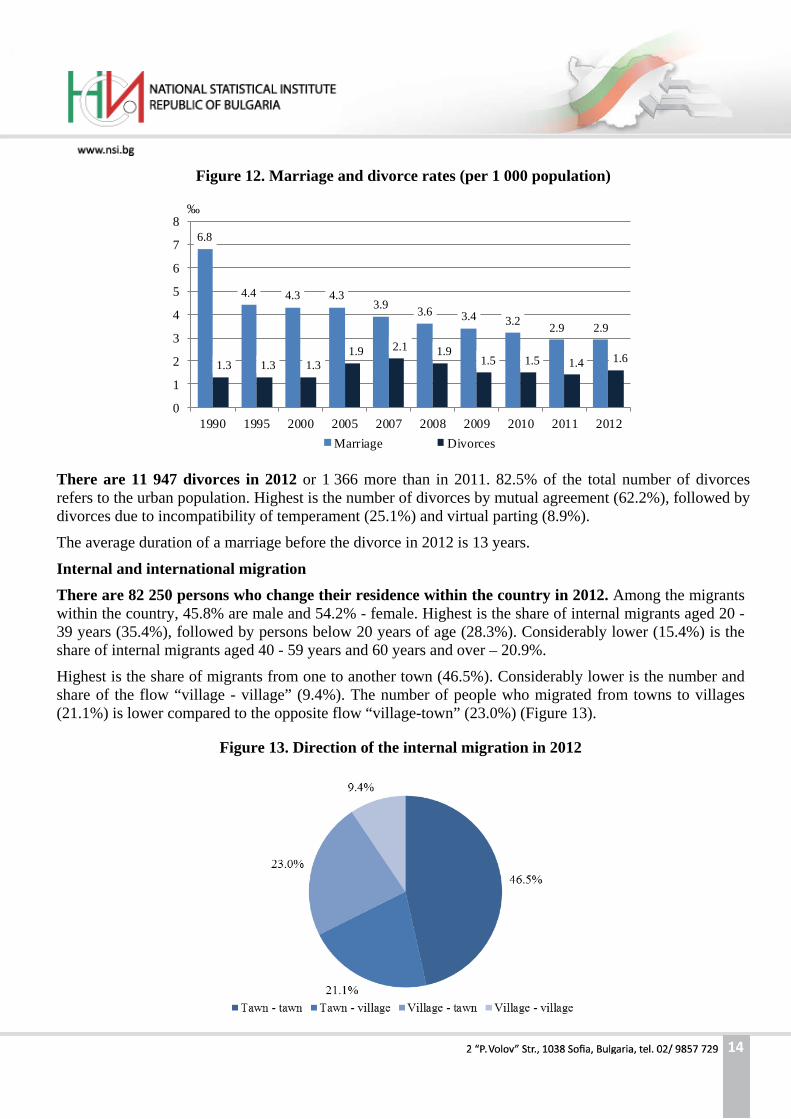
The number of marriages continues to decrease in 2012. There are 21 167 juridical marriages registered or 281 less than the previous year. 77.3% (16 357) of the marriages are registered among urban population and 4 810 - among rural. The decrease of the number of marriages leads to decrease of the marriage rate9. The marriage rate in 2001 is 4.0‰, in 2010 - 3.2‰ and drops to 2.9‰ in 2012 (Figure 12).
The decrease of juridical marriages is due to the increase of so called de facto marriages. Young people more and more prefer cohabiting, without marriage.
The mean age at first marriage in 2012 is 30.2 years for males and 27.0 - for females. It remains the same for both sexes compared to the previous year and increases by 2.1 years for males and 2.2 years for females compared to 2001.
Highest is the marriage rate in district Kardzhali (4.0‰), followed by districts Razgrad (3.7‰) and Sofia (stolitsa) - 3.6‰ and lowest in districts Lovech and Vidin - 1.6‰.
9 Number of marriages per 1 000 population.
14
Figure 12. Marriage and divorce rates (per 1 000 population)
6.8
4.4 4.3 4.33.9 3.6 3.4 3.2 2.9 2.9
1.3 1.3 1.31.9 2.1 1.9
1.5 1.5 1.4 1.6
0
1
2
3
4
5
6
7
8
1990 1995 2000 2005 2007 2008 2009 2010 2011 2012
‰
Marriage Divorces
There are 11 947 divorces in 2012 or 1 366 more than in 2011. 82.5% of the total number of divorces refers to the urban population. Highest is the number of divorces by mutual agreement (62.2%), followed by divorces due to incompatibility of temperament (25.1%) and virtual parting (8.9%).
The average duration of a marriage before the divorce in 2012 is 13 years.
Internal and international migration There are 82 250 persons who change their residence within the country in 2012. Among the migrants within the country, 45.8% are male and 54.2% - female. Highest is the share of internal migrants aged 20 - 39 years (35.4%), followed by persons below 20 years of age (28.3%). Considerably lower (15.4%) is the share of internal migrants aged 40 - 59 years and 60 years and over – 20.9%.
Highest is the share of migrants from one to another town (46.5%). Considerably lower is the number and share of the flow “village - village” (9.4%). The number of people who migrated from towns to villages (21.1%) is lower compared to the opposite flow “village-town” (23.0%) (Figure 13).
Figure 13. Direction of the internal migration in 2012

15
As a result of migration between towns and villages, the rural population decreased by 1 628 persons and the urban one increased with the same number of people.
Among the internal migrants, highest is the number of persons who migrated to district Sofia (stolitsa). The highest number of migrants to district Sofia (stolitsa) is registered in districts Sofia - 8.6%, Blagoevgrad - 7.3%, Plovdiv - 5.9% and Pleven - 4.8% and lowest in districts Razgrad (0.7%) and Silistra (0.8%).
12 147 persons declare change of their current address in Bulgaria with an address abroad in 2012 - 47.3% are male and 52.7% - female. Nearly 51% of the emigrants are aged 20 to 39 years. Emigrants aged 40 - 59 years are 26%. The youngest emigrants (under 20 years) are 15.0% and the emigrants aged 60 years and more - 8.5%.
Persons who change their address abroad with an address in Bulgaria or the immigration flow includes Bulgarian citizens who return in the country and citizens of other countries granted permission for permanent stay in Bulgaria. There are 7 124 persons who change their address abroad with an address in Bulgaria in 2012. Male represent 51.0% of the total number of immigrants and female - 49.0%.
34.3% of the immigrants are aged 20 - 39 years and 30.1% - 40 - 59 years. The youngest immigrants (under 20 years) are 18.1% and the oldest, 60 years and more - 17.6%.
Natural and migration growth of population The population number and structures are defined by the size and intensity of the natural and migration movement.
The difference between births and deaths represents the natural increase of population. The demographic development of the country after 1990 is characterised by negative natural increase. The country population decreased by 40 160 persons in 2012 due to the negative natural increase or 2 748 persons more compared to 2011.
The population decreases by minus 5.5‰10. The natural increase rate in urban areas is minus 2.8‰, compared to minus 12.8‰ in rural areas, which means that the decrease of country population is mainly due to the negative demographic tendencies in rural areas.
The natural increase in all country districts is negative in 2012.
Lowest is the negative growth in districts Sofia (stolitsa) (-1.4‰), Varna and Kardzhali (-2.1‰). Highest is the population decrease due to the high negative growth in districts Vidin, Montana and Pernik and the respective values are minus 16.0, minus 12.8 and minus 11.7‰ (Figure 14).
10 Difference between the number of live births and number of deaths per 1 000 of the average annual population

16
Figure 14. Natural growth in 2012 by districts (per 1 000 population)
Natural increase rate for the EU (27) in 2011 is 0.8‰. There are 11 EU Member States, where the natural increase is positive and highest is it in Ireland (10.0‰) and in Cyprus (4.8‰). Except in Bulgaria, the natural increase is negative in Latvia, Hungary, Romania, Germany, Lithuania, Portugal, Italy, Estonia and Greece - but the values are lower compared to Bulgaria.
Net migration (growth due to international migration) influences considerably the population number and structures. The net migration in 2012 is also negative - minus 5 023 persons. The last is the difference between the number of persons who reside in the country and those who leave it. The population decrease due to the international migration measured through the coefficient of net migration is 0.7‰11.
There are four districts with a positive migration growth in 2012: Sofia (stolitsa) (5.4‰), Stara Zagora (1.9‰), Plovdiv (1.4‰) and Shumen (0.4‰). With the highest population decrease due to the negative migration growth are the following districts: Smolyan (-7.3‰), Vratsa (-5.8‰) and Razgrad (-5.4‰).
11 Ratio of the net migration to the average annual population.

17
Methodological notes The population number and structures at the end of each year are calculated on the basis of the population data for the preceding year and the data for natural and mechanical movement of the population during the current year.
Source of data on population number and structures is the Information System Demography of the NSI.
Data source of natural and mechanic movement of population (births, deaths, marriages, divorces, migration) is the Unified System for Civil Registration and Administrative Service of Population (Bulgarian acronym ESGRAON). Demographic events are registered through the standard documents ESGRAON-CDS (Current Demographic Statistics): notification for birth, notification for marriage, notification for divorce, notification for death and address card for change of a present (current) address.
Data on population number and demographic events are distributed according to the administrative-territorial division of the country as of 31.12 of the respective year (settlements, municipalities, districts and statistical regions) according to the “present address”. The last is the address corresponding to the documentary declared residence of a person.
The age of population at the end of year is calculated as of 31.12. in completed years.
The persons’ age at occurrence of a demographic event is calculated in completed years based on the date of birth and the date of respective event, i.e. the age completed at the time of event.
Demographic indicators are calculated based on the average annual population. The last is an arithmetical average of the population number at the end of previous and the end of reference year.