demographic drivers of successional changes in …swensonn/nordenetal_2012_ecology.pdfecology, 93(8)...
TRANSCRIPT
Ecology, 93(8) Supplement, 2012, pp. S70–S82� 2012 by the Ecological Society of America
Demographic drivers of successional changes in phylogeneticstructure across life-history stages in plant communities
NATALIA NORDEN,1,2,5 SUSAN G. LETCHER,3 VANESSA BOUKILI,2 NATHAN G. SWENSON,4 AND ROBIN CHAZDON2
1Departamento de Ciencias Biologicas, Universidad de los Andes, Carrera 1 numero 18A-10, Bogota, D.C., Colombia2Department of Ecology and Evolutionary Biology, University of Connecticut, Storrs, Connecticut 06269-3043 USA
3Organization for Tropical Studies, Apartado Postal 676 2050, San Pedro de Montes de Oca, Costa Rica4Department of Plant Biology, Michigan State University, East Lansing, Michigan 48824 USA
Abstract. To gain insight into the ecological processes driving community reassembly indisturbed ecosystems, we assessed the phylogenetic dispersion of early- and late-successionaltree species occurring in lowland forests of northeastern Costa Rica. Early-successional specieswere more closely related than expected by chance, whereas late-successional species tended tobe less closely related than expected by chance. Then, we evaluated temporal changes in thephylogenetic structure of seedling and tree assemblages in four 1-ha plots of secondary forestsin this region. We found an increase in the phylogenetic evenness among tree individuals overtime in all secondary tree assemblages, indicating that relatedness among tree individualsdecreases as succession unfolds. This pattern was jointly promoted by recruitment andmortality processes, suggesting that increasing evenness was caused by the replacement ofindividuals of early-successional species from closely related lineages by late-successionalspecies belonging to a wider diversity of lineages. Based on species occurrence, however, treecommunity reassembly did not show any significant phylogenetic trend over time. Theseresults suggest that shifts in species abundance over succession have a greater impact on thephylogenetic structure of the community than the turnover of species. Seedling assemblagesshowed higher phylogenetic evenness than tree assemblages, suggesting that propagulecolonization is an important process driving phylogenetic changes in species compositionthroughout succession. Overall, our findings showed that the phylogenetic structure of thesesuccessional communities varies at two temporal scales. At short timescales, decreaseddominance by early-successional species over succession leads to increased evenness amongtree individuals. At longer timescales, colonization processes result in increased phylogeneticevenness in seedling communities compared to tree communities, forecasting increasingphylogenetic evenness among adult individuals at late-successional stages.
Key words: community assembly; Costa Rica; life-history stages of plants; mortality; phylogeneticstructure; recruitment; succession; vegetation dynamics.
INTRODUCTION
Disturbed ecosystems are increasing in extent across
the landscape, to the degree that successional forest
cover exceeds mature forest cover in many regions
(ITTO 2002, FAO 2005). Despite the growing role of
these successional communities in the conservation of
biodiversity, climate change mitigation, and many
ecosystem services (Chazdon et al. 2009), recent
theoretical developments in plant ecology have focused
on species-rich, mature plant communities, rather than
on less diverse secondary forests (Webb 2000, Hubbell
2001, Muller-Landau et al. 2006, Jabot and Chave 2009,
Kraft and Ackerley 2010, Swenson et al. 2012).
Secondary forests, however, provide an ideal laboratory
for testing ecological theories, as they reflect community
assembly in action. So far, successional models have
been based on the premise that species turnover through
time is dictated by differences in growth rates and life
span (Finegan 1996, Rees et al. 2001). These attributes
define species’ ecological syndromes (Westoby et al.
2002) and underpin most explanations of temporal
changes in the community during secondary succession
(Rees et al. 2001). Yet, these theoretical approaches do
not consider the phylogenetic background of co-
occurring species. Linking observed patterns of commu-
nity structure to processes occurring over evolutionary
timescales offers a compelling framework for the
development of a synthetic ecological theory (Webb et
al. 2002, Cavender-Bares et al. 2009, Vamosi et al. 2009).
Moreover, it provides valuable information for the
assessment of species conservation status and anthro-
pogenic impacts (Warwick and Clarke 1998, Helmus et
al. 2010).
Manuscript received 13 November 2010; revised 22 March2011; accepted 4 April 2011. Corresponding Editor: J.Cavender-Bares. For reprints of this Special Issue, seefootnote 1, p. S1.
5 Present address: Departamento de Ecologıa y Territorio,Pontificia Universidad Javeriana, Transversal 4 number 42-00, Bogota, D.C., Colombia.E-mail: [email protected]
S70
Recent studies have shown that disturbed ecosystems
contain more closely related species than non-perturbed
ones (Verdu and Pausas 2007, Knapp et al. 2008,
Helmus et al. 2010, Cavender-Bares and Reich 2012),
suggesting that species’ response to disturbance has a
phylogenetic component. If so, the phylogenetic relat-
edness exhibited by early-successional species should
translate into a temporal change in the phylogenetic
structure of the community as succession unfolds. Yet
uncertainty persists regarding this issue, since the few
studies evaluating the effect of disturbance on the
relatedness of co-occurring species are limited to the
comparison of perturbed and non-perturbed communi-
ties (Verdu and Pausas 2007, Knapp et al. 2008, Helmus
et al. 2010). These single-time investigations represent a
snapshot of species composition in time and space,
ignoring the fact that succession is a continuous and
dynamic process. Integrating a temporal dimension into
studies of phylogenetic community structure should add
critical elements to disentangle the different mechanisms
driving community reassembly after disturbance.
In the most comprehensive study addressing this issue,
Letcher (2010) evaluated changes in the phylogenetic
structure of successional tropical forests in a replicated
chronosequence of 30 sites in northeastern Costa Rica.
By dividing tree plots into five stand age categories, she
found increased phylogenetic evenness (i.e., overdisper-
sion sensu Webb et al. 2002) over succession. Further,
Letcher (2010) found that small stems were less closely
related than large stems, suggesting that the increased
phylogenetic evenness observed over succession was
related to the recruitment of late-successional species.
These findings concur with previous studies (Verdu and
Pausas 2007, Knapp et al. 2008, Helmus et al. 2010), and
suggest that communities at the onset of succession are
mainly comprised of closely related species, whereas late
stages of succession contain species belonging to a wide
array of lineages. Indeed, pioneer species in the
neotropics typically belong to the genus Cecropia
(Urticaceae) or to the family Malvaceae sensu lato
(both groups belonging to the Rosid clade). Contrast-
ingly, since the most common environmental condition
in tropical forests’ understory is shade, functional
convergence on traits giving adaptive value for regener-
ation under low light availability (Hubbell 2005) would
lead to phylogenetic evenness among late-successional
species. So far, the degree of relatedness among early- or
late-successional species has never been evaluated
quantitatively, partly because classifying species into
these ecological syndromes is a challenging task (Wright
et al. 2003).
In this study, we assessed the phylogenetic relatedness
of early- and late-successional species, and tracked
temporal changes in phylogenetic community structure
within secondary forest plots and between seedling and
tree stages, in a lowland Neotropical rainforest. By
integrating the current knowledge in successional
ecology (Finegan 1996, Chazdon 2008) and prior
information from studies evaluating community phylo-
genetic structure in disturbed systems (Verdu andPausas 2007, Knapp et al. 2008, Helmus et al. 2010,
Letcher 2010), we propose a likely scenario for thetemporal changes in the phylogenetic structure of
successional communities. Assuming that early-succes-sional species are clustered within the angiospermphylogeny and that late-successional species show a
more even phylogenetic distribution, we expect phylo-genetic evenness to increase over succession. Such a
pattern can be the result of two simultaneous processes:the recruitment of distantly related late-successional
species/individuals, and the death of closely relatedearly-successional species/individuals. As part of the
same process, small size classes, which represent futuretree recruits, and thus reflect the species composition of
more advanced successional stages (Norden et al. 2009),should also show higher phylogenetic evenness than the
standing tree community. How recruitment and mortal-ity affect the phylogenetic structure of the community
not only depends upon relatedness among species/individuals entering or leaving the community, but also
on the relatedness among these groups and the group ofsurvivors. For instance, we expect increasing evennessover succession to be partially associated with the
recruitment of distantly related species/individuals.However, increased evenness can also be the outcome
of the recruitment of species/individuals that are closelyrelated to one another, but distantly related to the pool
of survivors.We tested these different scenarios using robust
successional data on seedling and tree dynamics fromlowland forest plots in northeastern Costa Rica (see
Plate 1). Specifically, we quantified the phylogeneticrelatedness of early- and late-successional species using
static data from several studies conducted in bothsecond- and old-growth forests in this area. This
information provided us with an appropriate frameworkto interpret temporal changes in the phylogenetic
structure of secondary forest communities. We usedlong-term data on recruitment and mortality of trees (12
years) and seedlings (5 years) in four secondary-forestpermanent plots in this same region to assess changes inphylogenetic structure over time. We compared the
temporal trends in tree assemblages with those observedin mature forests to evaluate whether phylogenetic
structure in secondary forests approaches that of matureforest as succession unfolds. Then, we evaluated how
recruitment and mortality contribute to the temporalchanges observed in the phylogenetic structure of the
plant community over succession.
MATERIALS AND METHODS
Study site
The study was conducted at La Selva BiologicalStation and surrounding areas of northeastern Costa
Rica. This region is classified as tropical lowland wetforest, with an annual precipitation of ;3900 mm and
August 2012 S71PHYLOGENETIC STRUCTURE OVER SUCCESSION
an average annual temperature of 26.58C (McDade et al.
1994). The landscape matrix is composed of old-growth
and second-growth forest patches surrounded by agri-
cultural lands, pastures, and cash crops. Site elevations
range from 40 to 200 m above sea level. Land-use
history was similar within all secondary sites.
Phylogenetic dispersion in ecological syndromes
We tested the assumptions that early-successional
species are phylogenetically clustered within the regional
flora and that late-successional species are phylogeneti-
cally even by evaluating the phylogenetic dispersion in a
categorical variable defining species as second-growth
specialists or old-growth specialists. To do so, we assessed
whether early-successional species tended to be more
closely related than expected by chance, and late-
successional species more distantly related than expected
by chance. Because the pioneer vs. non-pioneer catego-
rization is seen as false dichotomy (Wright et al. 2003), we
defined a third category, the generalists, for which we did
not have any particular expectation regarding its
phylogenetic dispersion. To assign species to one of these
three categories, we used data on species abundance in
mature and secondary stands throughout the study area
from various sources (Chazdon et al. 2011). This data set
was composed of trees � 10 cm diameter at breast height
(dbh) sampled in 18.3 ha of old-growth forest and 11.3 ha
of secondary forest. Secondary forests ranged from 5 to
45 years since abandonment and included forests
regenerating on abandoned pastures and in cleared areas
that were never grazed. Second-growth and old-growth
sites were interspersed across a broad landscape, thereby
avoiding the pitfalls of confounding habitat differences
with spatial variables (Chazdon et al. 2011). A previous
study using part of the data used here showed that
patterns of floristic similarity among tree plots were
independent of spatial distance (Norden et al. 2009).
Thus, the potential biasing effect of spatial autocorrela-
tion seems to be minimal.
Our statistical approach classified each species into
one of each of the three categories based on its
abundance in secondary and mature stands (Chazdon
et al. 2011). If a species is a second-growth specialist,
then we would expect that pi, the relative abundance of
this species in second-growth forests, is sufficiently
higher than pi, the relative abundance in this species in
old-growth forests; or equivalently, the ratio pi/( piþ pi )is sufficiently higher than a constant k. Using a
multinomial model, this statistical test procedure deter-
mines for each species whether the observed data
provide sufficient evidence that their ratio is statistically
higher than this pre-specified constant k. Here, k was
designated as 0.5, a liberal threshold based on a ‘‘simple
majority’’ rule, which allowed us to classify most species
into one of these categories (Chazdon et al. 2011). Old-
growth forest specialists are similarly classified as species
with a statistically higher ratio of individuals in old-
growth than in second-growth forest stands, and
generalists are classified as those that have statistically
indistinguishable relative abundance in old-growth and
second-growth stands.
Among the 359 species occurring in these plots, 203
could be assigned with certainty to one of these
categories using this statistical procedure, and the
remaining species were too rare to classify. We
constructed the phylogenetic supertree of these 203
species using the database Phylomatic (Webb and
Donoghue 2005). Phylomatic starts with the family-
level tree of angiosperms and considers genera as
polytomies within families and species as polytomies
within genera. The latest Angiosperm Phylogeny
Group (APG) classification (Phylomatic tree version
R20080417; P. F. Stevens, available online)6 was used for
the supertree backbone. The BLADJ algorithm was
implemented in the community phylogenetic software
Phylocom (v. 4.0.b; Webb et al. 2008) to calibrate the
species pool supertree by applying known molecular and
fossil dates (Wikstrom et al. 2001) to nodes in the
supertree, and to reduce variance among branch lengths
by evenly spacing nodes of unknown ages. The same
procedure was used in the subsequent analyses.
The degree of phylogenetic dispersion in each of the
three ecological syndromes defined was assessed by
measuring the mean phylogenetic distance (MPD)
among the 58 species classified as second-growth
specialists, among the 107 species classified as old-
growth specialists, and among the 38 species classified as
generalists. We assessed significance for each category
by comparing the observed value of MPDs to the null
distribution of MPD values obtained by shuffling the
species names across the tips of the phylogeny 999 times
(Chazdon et al. 2003). Early-successional species were
considered significantly clustered within the regional
species pool of 203 species if the observed MPD of the
58 second-growth specialists was in the lower 5% of the
null distribution (one-tailed test). Likewise, late-succes-
sional species were considered significantly even within
the regional species pool if the observed MPD of the 107
old-growth specialists was in the higher 5% of the null
distribution. Because we did not have any particular
expectation for generalists, these species were considered
significantly clustered or even within the regional species
pool if the observed MPD of the 38 generalists was in
the lower or higher 2.5% of the null distribution (two-
tailed test). Although there are numerous analytical
methods to measure phylogenetic dispersion in a trait
(Blomberg et al. 2003, Webb et al. 2008, Fritz and Purvis
2010), we believe this method to be the most appropriate
considering the presence of polytomies in our tree, and
the fact that we are analyzing a categorical variable.
Calculations were performed with the R statistical
software (v. 2.11.1; R Development Core Team 2010).
6 http://www.mobot.org/MOBOT/research/APweb/
NATALIA NORDEN ET AL.S72 Ecology Special Issue
Temporal changes in phylogenetic community structure
To evaluate temporal changes in phylogenetic struc-
ture within sites and between life stages, we used long-
term data on seedling and tree dynamics. Permanent
plots of 1 ha were established in 1997 in four secondary
forest sites, and two additional 1-ha plots were
established in 2005 within mature forest patches (Table
1). In each plot, all trees with dbh of �5 cm were tagged,
mapped, and measured for diameter at 1.3 m height.
Thereafter, censuses were completed annually. In each
census, new recruits into the �5 cm diameter class were
tagged, mapped, and measured; and stems were
recorded as dead if no living tissues could be observed.
The final tree census of all plots was completed in 2008.
In each of the secondary forest sites, 144 seedling plots
of 1 3 5 m were created in 1998 (Capers et al. 2005). In
each plot, all woody stems �20 cm in height and ,1 cm
dbh were tagged and identified. Subsequently, seedling
censuses were conducted every 8 months. During each
census, newly recruited seedlings were tagged and
identified, and missing seedlings were recorded as dead.
Individuals that moved into the next size class (.1 cm
dbh) during the census period were considered as
survivors. The final seedling census was completed in
August 2003 (Capers et al. 2005). We did not include
seedling data from mature forest plots since these data
are not available. Trees and seedlings were identified by
experienced field assistants, and vouchers were collected
to compare with botanical specimens at the La Selva
Herbarium and the Instituto Nacional de Biodiversidad
in Costa Rica (INBio). Although seedlings of all life
forms were censused, here we consider only the canopy
and subcanopy trees and palms, as well as treelet species
reaching the .5 cm dbh size class, to be consistent with
tree censuses.
We constructed an appropriate regional species pool
including all the canopy tree, palm, and treelet species
that reach dbh �5 cm and that could potentially colonize
the plots based on a database of vascular plants occurring
in the Sarapiquı region (Proyecto Flora Digital de La
Selva 2009). We excluded non-angiosperm taxa because
they are rare in the region and could contribute
disproportionally to phylogenetic structure owing to their
low relatedness with most of the species. The final list for
the community species pool included a total of 603
species. The total number of species used for this
phylogenetic supertree was higher than the one used in
the previous analysis, which only included species for
which we had information about their life-history status.
A phylogenetic tree for those species was constructed
using Phylomatic (Webb and Donoghue 2005) according
to the methods described in the section Phylogenetic
dispersion of ecological syndromes. Because the Phylo-
matic algorithm maps unknown relationships as polyto-
mies on the supertree, measures of phylogenetic structure
using these phylogenies may have potential biases and
loss of statistical power (Swenson 2009). Letcher (2010)
tested for this issue using a very similar species regional
pool to ours, and found that the phylogenetic measures
calculated using the Phylomatic tree were highly corre-
lated to those obtained using a tree where all families
were collapsed into polytomies. Indeed, loss of phyloge-
netic resolution generally causes false negative results,
rather than false positives (Swenson 2009), which would
underestimate the strength of our results.
We evaluated temporal changes in the phylogenetic
structure of tree and seedling assemblages in each plot
by calculating the net relatedness index (NRI; Webb
2000) using the package ‘‘picante’’ (Kembel et al. 2010)
in the R statistical software (v. 2.11.1; R Development
Core Team 2010). Similar results were obtained using
the nearest taxon index, and are not reported here. Over
the timescale of our study, floristic changes during
succession might reflect changes in species’ relative
abundance more than the gain and/or loss of species.
We thus performed this analysis using both abundance-
and incidence-based data. NRI for each local assem-
TABLE 1. Site descriptions of 1-ha monitoring plots in northeastern Costa Rica.
Plot name andabbreviation Location
Age in 1997(yr) Previous land use Landscape matrix
Lindero Sur, LSUR La Selva BiologicalStation
12 cattle pasture for 5–6 yr adjacent to large tractof old-growth forest
Tirimbina, TIR Finca de ArturoSalazar, adjacentto TirimbinaResearch Center
15 cattle pasture for .6 years;may have been cut twice
surrounded by matrixof pasture andsecond-growth forest
Lindero El Peje, LEPS La Selva BiologicalStation
20 cattle pasture for 5–6 yr adjacent to large tractof old-growth forest
Cuatro Rios, CR La Virgen deSarapiquı
25 cleared for cattle pasture,little or no grazing(,3 yr)
surrounded by matrixof pasture andsecond-growth forest
Selva Verde, SV Chilamate mature forest no history of logging, butarea has been subject tohunting
surrounded by pastureand second-growthforest
LEP primary, LEPP La Selva BiologicalStation
mature forest no history of logging,protected from hunting
surrounded by old-growth forest onthree sides
August 2012 S73PHYLOGENETIC STRUCTURE OVER SUCCESSION
blage was calculated using the following formula (Webb
et al. 2002):
NRI ¼ �MPD�MPDrnd
sdMPDrnd
where MPD is the mean phylogenetic distance of co-
occurring taxa in local assemblages, MPDrnd is the mean
and sdMPDrnd the standard deviation of 999 MPDs
obtained from randomly generated local assemblages.
We used the Phylogeny Tip Shuffle null model in
Phylocom, which shuffles species labels across the entire
phylogeny. Although permuting elements within the
community data matrix is a more conservative method
for avoiding Type I error (Hardy 2008), randomizing
relatedness among species and/or individuals is a more
appropriate null model in temporal analyses. Random-
izing elements within the community data matrix
changes the identity of surviving stems between consec-
utive censuses, inflating the temporal turnover in the null
model, and biasing the observed result toward a lower
than expected turnover. Randomizing species labels
across the phylogeny avoids this problem and has the
additional benefit of maintaining the observed occupan-
cy rates, the plot abundance distribution and plot
species richness. Thus, if individuals within a species
are dispersal limited or have spatial contagion in their
observed distribution, this observed pattern will be
maintained in all null communities generated. Alterna-
tive null models, such as a swap algorithm, maintain
occupancy rates, species richness, and abundances, but
they do not necessarily conserve patterns of spatial
contagion of species.
Negative values of NRI indicate higher MPD than
expected, and are indicative of phylogenetic evenness,
whereas positive values of NRI indicate phylogenetic
clustering (Webb 2000). To test for significant deviations
of NRI from a null expectation, we calculated a P value
by dividing the number of null communities with MPD
values that were lower than or greater than the observed
by the number of runs þ1. For each plot and each
census, we used this metric to evaluate phylogenetic
structure for tree and seedling assemblages.
Relative contribution of recruited and dead individuals
To assess the relative contribution of recruitment and
mortality to the dynamics of phylogenetic structure over
succession, we calculated NRI for the subset of
survivors, recruited, and dead trees and seedlings at
each census. The reference species pool was the same
regional pool used in the previous analysis. Although
the most logical species pool for measuring phylogenetic
relatedness among dead trees in a particular plot is
arguably the pool of species occurring in that plot, we
used the same species pool across all analyses to obtain
comparable NRI values across all analyses. Based on the
predicted scenario described in the Introduction, we
expected recruited individuals to be more phylogeneti-
cally even than the pool of survivors and dead
individuals to show the opposite pattern. We tested for
the significance of this pattern using a one-tailed, paired
t test for each life stage.
To have a deeper understanding of how tree
recruitment and mortality, as well as future seedling-
to-tree transitions, potentially alter the phylogenetic
composition of the community, we assessed phylogenet-
ic similarity among recruited, dead, and surviving trees
and seedlings within plots, over time. To do so, we
performed an ordination analysis based on the MPD
between all pairs of possible combinations of recruited,
dead, and surviving trees and species across censuses.
We standardized the observed matrix of MPD scores
between pairwise samples by generating 999 random
phylogenetic distance matrices using a randomization
equivalent to the Phylogeny Tip Shuffle null model. For
each null model iteration, we calculated the MPD of all
possible pairs of taxa in one sample to the taxa in the
other to generate a null distribution. This null distribu-
tion was used to calculate a pairwise distance matrix
based on a standardized MPD:
MPDstd ¼ �MPD�MPDrnd
sdMPDrnd
:
We then performed a nonmetric multidimensional
scaling analysis (NMDS) based on these values to
illustrate phylogenetic similarity among all possible
combinations. When compared to an ordination anal-
ysis based on species composition, this analysis reflects
the shared evolutionary history among sites, rather than
the shared presence or absence of species, therefore
emphasizing the similarity in deep phylogenetic struc-
ture, even when no species are shared.
RESULTS
Phylogenetic dispersion in ecological syndromes
As expected, species classified as second-growth
specialists were significantly clustered within the 203-
species phylogeny (MPDsec ¼ 227.92) when compared
with a null model distribution based on species names
shuffling (95% confidence interval ¼ 230.5–258.6).
Species classified as old-growth specialists showed
tendency to evenness within the same phylogeny
(MPDold ¼ 242.97) when compared with the same type
of null model (95% confidence interval¼225.47–244.90).
Finally, species distribution of generalists within this
phylogeny was within the null expectation (MPDgen ¼229.22, 95% confidence interval ¼ 224.17–254.37).
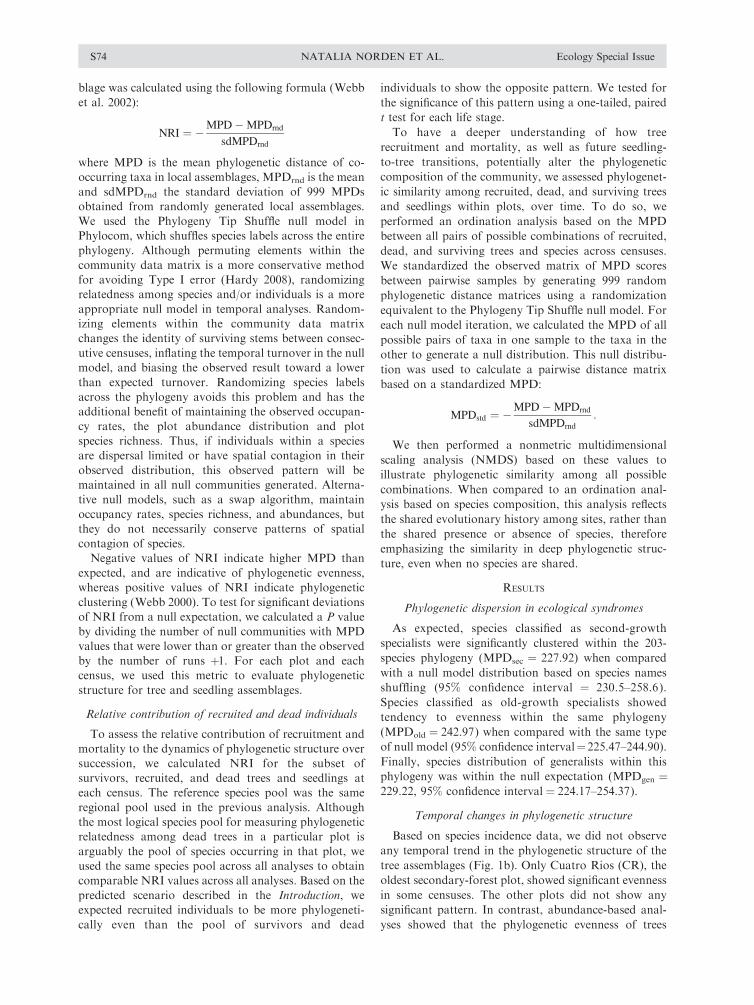
Temporal changes in phylogenetic structure
Based on species incidence data, we did not observe
any temporal trend in the phylogenetic structure of the
tree assemblages (Fig. 1b). Only Cuatro Rios (CR), the
oldest secondary-forest plot, showed significant evenness
in some censuses. The other plots did not show any
significant pattern. In contrast, abundance-based anal-
yses showed that the phylogenetic evenness of trees
NATALIA NORDEN ET AL.S74 Ecology Special Issue
increased over time in all the secondary sites (Fig. 1a). In
the youngest plot, Lindero Sur (LSUR), the abundance-
based NRI indicated that the tree assemblage was
initially phylogenetically clustered, although nonsignif-
icantly, and then became significantly even over time.
The two oldest plots (Lindero El Peje [LEPS] and CR)
were phylogenetically even throughout the whole
monitoring period and showed a decreasing pattern in
NRI until reaching the phylogenetic evenness level of
old-growth forest plots (Fig. 1a). Tirimbina (TIR) was
the only plot with significant phylogenetic clustering of
trees throughout the census period.
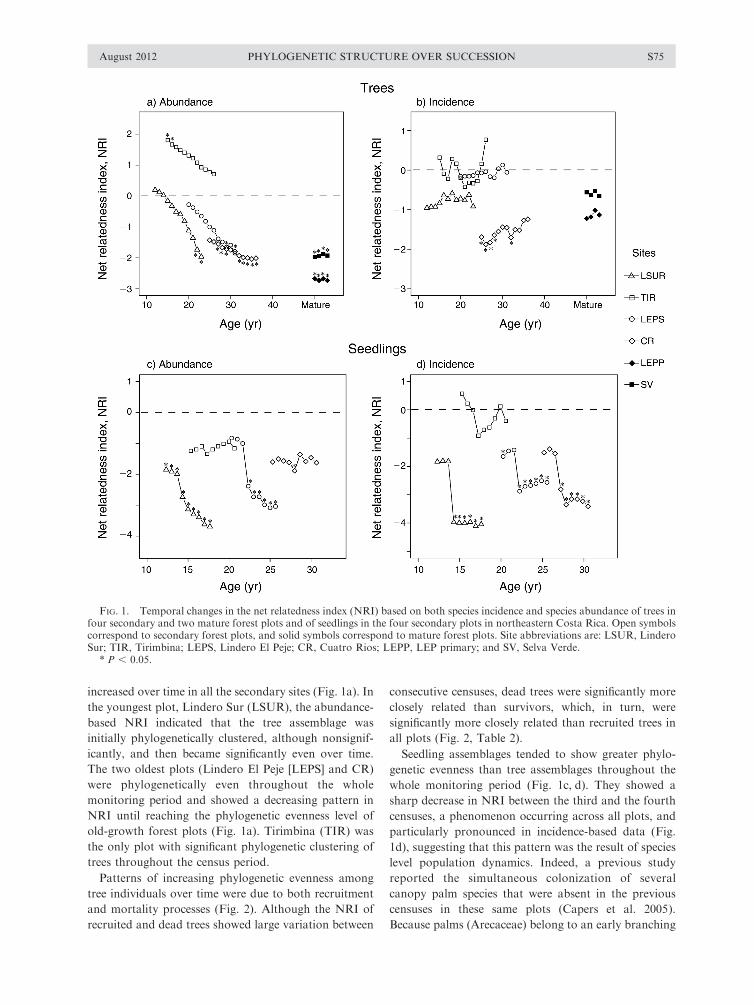
Patterns of increasing phylogenetic evenness among
tree individuals over time were due to both recruitment
and mortality processes (Fig. 2). Although the NRI of
recruited and dead trees showed large variation between
consecutive censuses, dead trees were significantly more
closely related than survivors, which, in turn, were
significantly more closely related than recruited trees in
all plots (Fig. 2, Table 2).
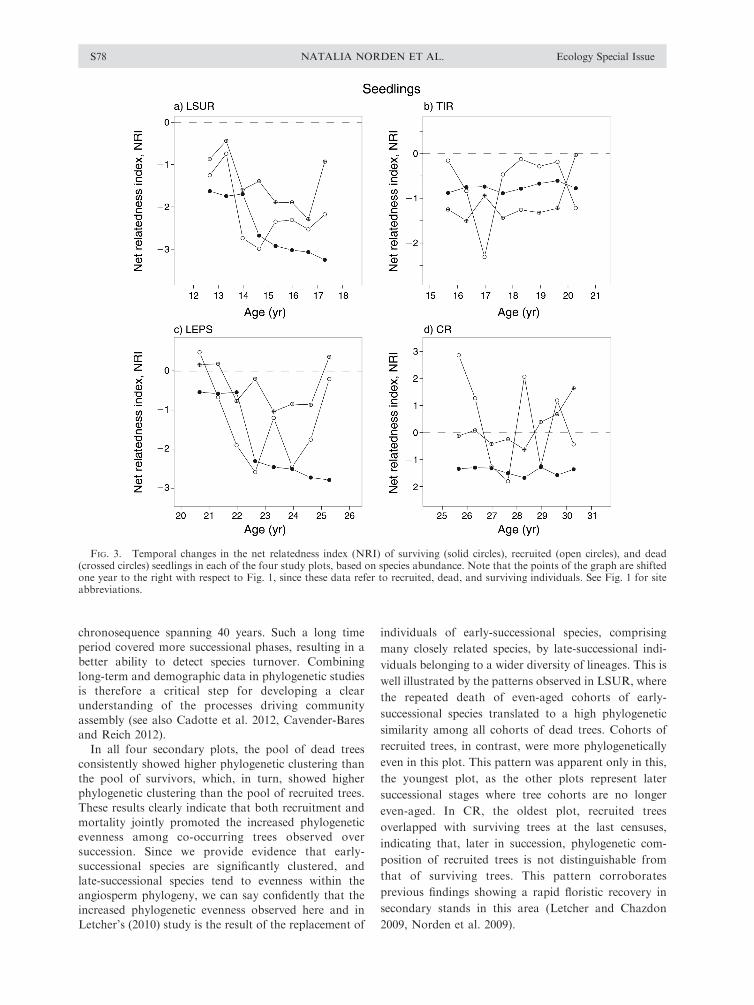
Seedling assemblages tended to show greater phylo-
genetic evenness than tree assemblages throughout the
whole monitoring period (Fig. 1c, d). They showed a
sharp decrease in NRI between the third and the fourth
censuses, a phenomenon occurring across all plots, and
particularly pronounced in incidence-based data (Fig.
1d), suggesting that this pattern was the result of species
level population dynamics. Indeed, a previous study
reported the simultaneous colonization of several
canopy palm species that were absent in the previous
censuses in these same plots (Capers et al. 2005).
Because palms (Arecaceae) belong to an early branching
FIG. 1. Temporal changes in the net relatedness index (NRI) based on both species incidence and species abundance of trees infour secondary and two mature forest plots and of seedlings in the four secondary plots in northeastern Costa Rica. Open symbolscorrespond to secondary forest plots, and solid symbols correspond to mature forest plots. Site abbreviations are: LSUR, LinderoSur; TIR, Tirimbina; LEPS, Lindero El Peje; CR, Cuatro Rios; LEPP, LEP primary; and SV, Selva Verde.
* P , 0.05.
August 2012 S75PHYLOGENETIC STRUCTURE OVER SUCCESSION
angiosperm clade, the arrival of these species into the
community has a large effect on the calculation of
phylogenetic structure. If palms are taken out of the
analysis, the phylogenetic structure of seedling assem-
blages within each plot was stable over time (data not
shown).
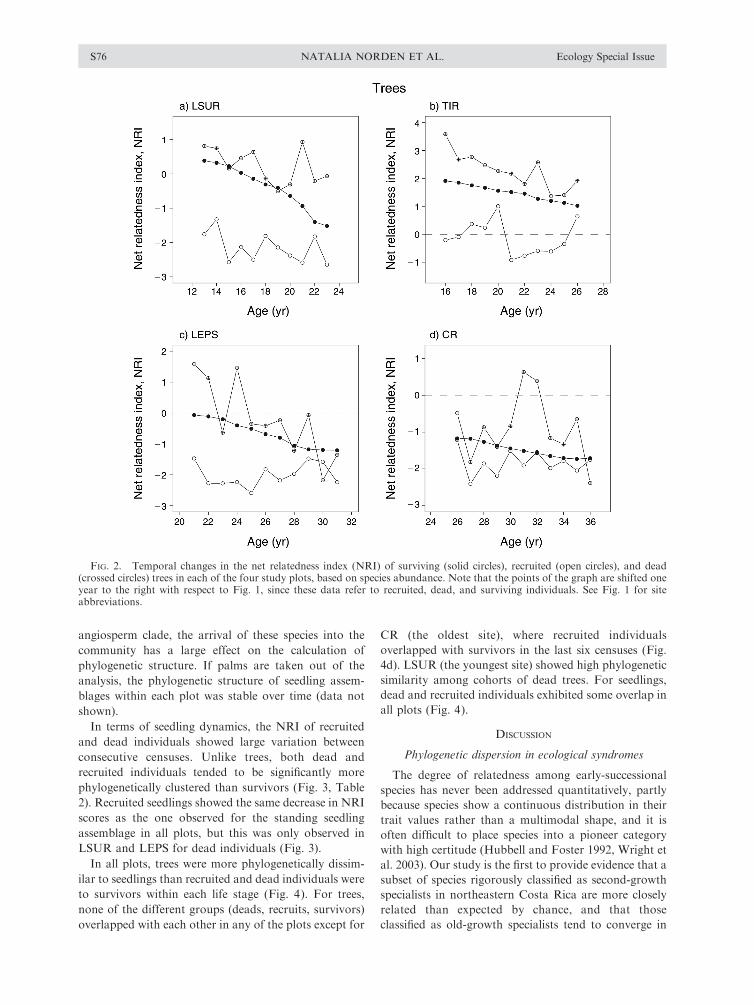
In terms of seedling dynamics, the NRI of recruited
and dead individuals showed large variation between
consecutive censuses. Unlike trees, both dead and
recruited individuals tended to be significantly more
phylogenetically clustered than survivors (Fig. 3, Table
2). Recruited seedlings showed the same decrease in NRI
scores as the one observed for the standing seedling
assemblage in all plots, but this was only observed in
LSUR and LEPS for dead individuals (Fig. 3).
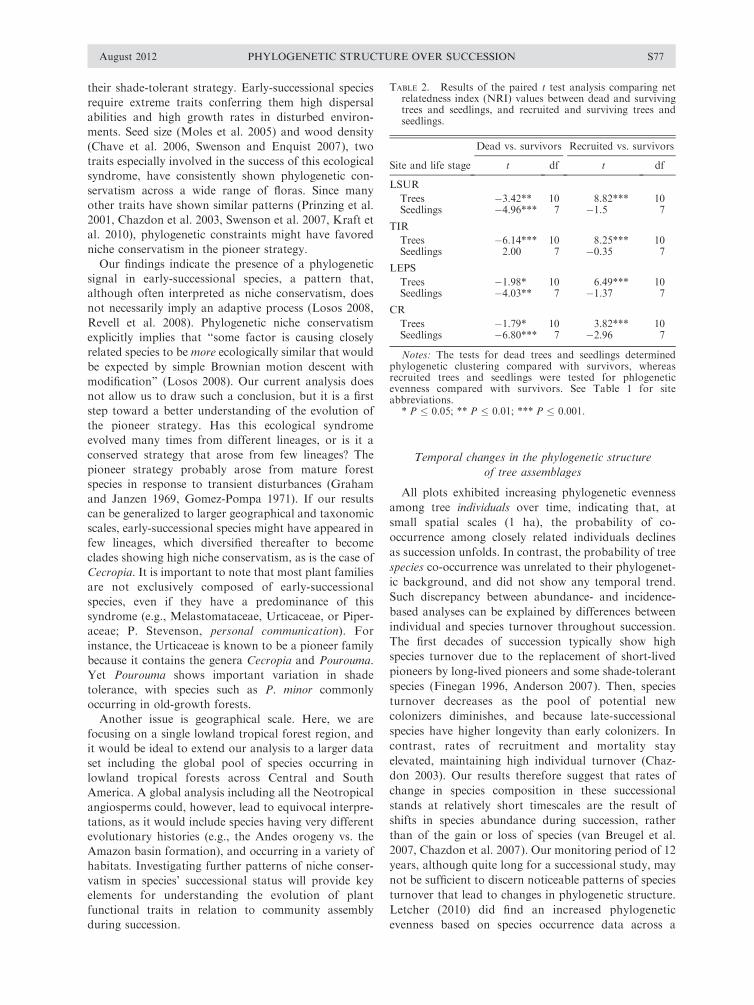
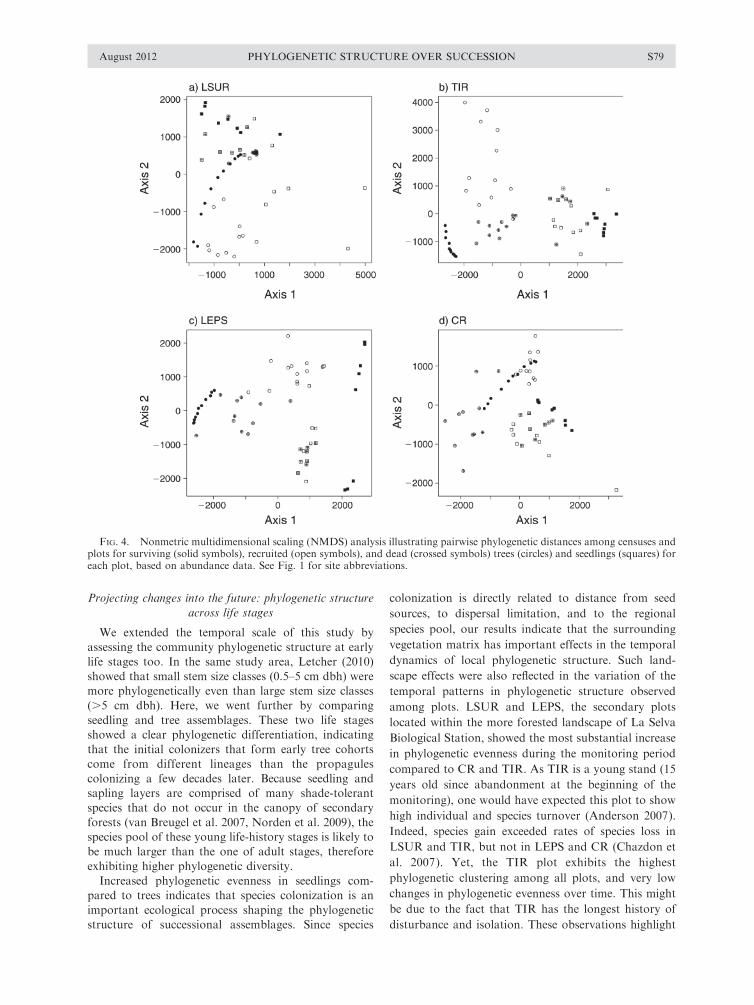
In all plots, trees were more phylogenetically dissim-
ilar to seedlings than recruited and dead individuals were
to survivors within each life stage (Fig. 4). For trees,
none of the different groups (deads, recruits, survivors)
overlapped with each other in any of the plots except for
CR (the oldest site), where recruited individuals
overlapped with survivors in the last six censuses (Fig.
4d). LSUR (the youngest site) showed high phylogenetic
similarity among cohorts of dead trees. For seedlings,
dead and recruited individuals exhibited some overlap in
all plots (Fig. 4).
DISCUSSION
Phylogenetic dispersion in ecological syndromes
The degree of relatedness among early-successional
species has never been addressed quantitatively, partly
because species show a continuous distribution in their
trait values rather than a multimodal shape, and it is
often difficult to place species into a pioneer category
with high certitude (Hubbell and Foster 1992, Wright et
al. 2003). Our study is the first to provide evidence that a
subset of species rigorously classified as second-growth
specialists in northeastern Costa Rica are more closely
related than expected by chance, and that those
classified as old-growth specialists tend to converge in
FIG. 2. Temporal changes in the net relatedness index (NRI) of surviving (solid circles), recruited (open circles), and dead(crossed circles) trees in each of the four study plots, based on species abundance. Note that the points of the graph are shifted oneyear to the right with respect to Fig. 1, since these data refer to recruited, dead, and surviving individuals. See Fig. 1 for siteabbreviations.
NATALIA NORDEN ET AL.S76 Ecology Special Issue
their shade-tolerant strategy. Early-successional species
require extreme traits conferring them high dispersal
abilities and high growth rates in disturbed environ-
ments. Seed size (Moles et al. 2005) and wood density
(Chave et al. 2006, Swenson and Enquist 2007), two
traits especially involved in the success of this ecological
syndrome, have consistently shown phylogenetic con-
servatism across a wide range of floras. Since many
other traits have shown similar patterns (Prinzing et al.
2001, Chazdon et al. 2003, Swenson et al. 2007, Kraft et
al. 2010), phylogenetic constraints might have favored
niche conservatism in the pioneer strategy.
Our findings indicate the presence of a phylogenetic
signal in early-successional species, a pattern that,
although often interpreted as niche conservatism, does
not necessarily imply an adaptive process (Losos 2008,
Revell et al. 2008). Phylogenetic niche conservatism
explicitly implies that ‘‘some factor is causing closely
related species to be more ecologically similar that would
be expected by simple Brownian motion descent with
modification’’ (Losos 2008). Our current analysis does
not allow us to draw such a conclusion, but it is a first
step toward a better understanding of the evolution of
the pioneer strategy. Has this ecological syndrome
evolved many times from different lineages, or is it a
conserved strategy that arose from few lineages? The
pioneer strategy probably arose from mature forest
species in response to transient disturbances (Graham
and Janzen 1969, Gomez-Pompa 1971). If our results
can be generalized to larger geographical and taxonomic
scales, early-successional species might have appeared in
few lineages, which diversified thereafter to become
clades showing high niche conservatism, as is the case of
Cecropia. It is important to note that most plant families
are not exclusively composed of early-successional
species, even if they have a predominance of this
syndrome (e.g., Melastomataceae, Urticaceae, or Piper-
aceae; P. Stevenson, personal communication). For
instance, the Urticaceae is known to be a pioneer family
because it contains the genera Cecropia and Pourouma.
Yet Pourouma shows important variation in shade
tolerance, with species such as P. minor commonly
occurring in old-growth forests.
Another issue is geographical scale. Here, we are
focusing on a single lowland tropical forest region, and
it would be ideal to extend our analysis to a larger data
set including the global pool of species occurring in
lowland tropical forests across Central and South
America. A global analysis including all the Neotropical
angiosperms could, however, lead to equivocal interpre-
tations, as it would include species having very different
evolutionary histories (e.g., the Andes orogeny vs. the
Amazon basin formation), and occurring in a variety of
habitats. Investigating further patterns of niche conser-
vatism in species’ successional status will provide key
elements for understanding the evolution of plant
functional traits in relation to community assembly
during succession.
Temporal changes in the phylogenetic structure
of tree assemblages
All plots exhibited increasing phylogenetic evenness
among tree individuals over time, indicating that, at
small spatial scales (1 ha), the probability of co-
occurrence among closely related individuals declines
as succession unfolds. In contrast, the probability of tree
species co-occurrence was unrelated to their phylogenet-
ic background, and did not show any temporal trend.
Such discrepancy between abundance- and incidence-
based analyses can be explained by differences between
individual and species turnover throughout succession.
The first decades of succession typically show high
species turnover due to the replacement of short-lived
pioneers by long-lived pioneers and some shade-tolerant
species (Finegan 1996, Anderson 2007). Then, species
turnover decreases as the pool of potential new
colonizers diminishes, and because late-successional
species have higher longevity than early colonizers. In
contrast, rates of recruitment and mortality stay
elevated, maintaining high individual turnover (Chaz-
don 2003). Our results therefore suggest that rates of
change in species composition in these successional
stands at relatively short timescales are the result of
shifts in species abundance during succession, rather
than of the gain or loss of species (van Breugel et al.
2007, Chazdon et al. 2007). Our monitoring period of 12
years, although quite long for a successional study, may
not be sufficient to discern noticeable patterns of species
turnover that lead to changes in phylogenetic structure.
Letcher (2010) did find an increased phylogenetic
evenness based on species occurrence data across a
TABLE 2. Results of the paired t test analysis comparing netrelatedness index (NRI) values between dead and survivingtrees and seedlings, and recruited and surviving trees andseedlings.
Site and life stage
Dead vs. survivors Recruited vs. survivors
t df t df
LSUR
Trees �3.42** 10 8.82*** 10Seedlings �4.96*** 7 �1.5 7
TIR
Trees �6.14*** 10 8.25*** 10Seedlings 2.00 7 �0.35 7
LEPS
Trees �1.98* 10 6.49*** 10Seedlings �4.03** 7 �1.37 7
CR
Trees �1.79* 10 3.82*** 10Seedlings �6.80*** 7 �2.96 7
Notes: The tests for dead trees and seedlings determinedphylogenetic clustering compared with survivors, whereasrecruited trees and seedlings were tested for phlogeneticevenness compared with survivors. See Table 1 for siteabbreviations.
* P � 0.05; ** P � 0.01; *** P � 0.001.
August 2012 S77PHYLOGENETIC STRUCTURE OVER SUCCESSION
chronosequence spanning 40 years. Such a long timeperiod covered more successional phases, resulting in a
better ability to detect species turnover. Combining
long-term and demographic data in phylogenetic studiesis therefore a critical step for developing a clear
understanding of the processes driving community
assembly (see also Cadotte et al. 2012, Cavender-Baresand Reich 2012).
In all four secondary plots, the pool of dead trees
consistently showed higher phylogenetic clustering than
the pool of survivors, which, in turn, showed higherphylogenetic clustering than the pool of recruited trees.
These results clearly indicate that both recruitment and
mortality jointly promoted the increased phylogeneticevenness among co-occurring trees observed over
succession. Since we provide evidence that early-
successional species are significantly clustered, and
late-successional species tend to evenness within theangiosperm phylogeny, we can say confidently that the
increased phylogenetic evenness observed here and in
Letcher’s (2010) study is the result of the replacement of
individuals of early-successional species, comprising
many closely related species, by late-successional indi-
viduals belonging to a wider diversity of lineages. This is
well illustrated by the patterns observed in LSUR, where
the repeated death of even-aged cohorts of early-
successional species translated to a high phylogenetic
similarity among all cohorts of dead trees. Cohorts of
recruited trees, in contrast, were more phylogenetically
even in this plot. This pattern was apparent only in this,
the youngest plot, as the other plots represent later
successional stages where tree cohorts are no longer
even-aged. In CR, the oldest plot, recruited trees
overlapped with surviving trees at the last censuses,
indicating that, later in succession, phylogenetic com-
position of recruited trees is not distinguishable from
that of surviving trees. This pattern corroborates
previous findings showing a rapid floristic recovery in
secondary stands in this area (Letcher and Chazdon
2009, Norden et al. 2009).
FIG. 3. Temporal changes in the net relatedness index (NRI) of surviving (solid circles), recruited (open circles), and dead(crossed circles) seedlings in each of the four study plots, based on species abundance. Note that the points of the graph are shiftedone year to the right with respect to Fig. 1, since these data refer to recruited, dead, and surviving individuals. See Fig. 1 for siteabbreviations.
NATALIA NORDEN ET AL.S78 Ecology Special Issue
Projecting changes into the future: phylogenetic structure
across life stages
We extended the temporal scale of this study byassessing the community phylogenetic structure at early
life stages too. In the same study area, Letcher (2010)
showed that small stem size classes (0.5–5 cm dbh) weremore phylogenetically even than large stem size classes
(.5 cm dbh). Here, we went further by comparing
seedling and tree assemblages. These two life stagesshowed a clear phylogenetic differentiation, indicating
that the initial colonizers that form early tree cohorts
come from different lineages than the propagules
colonizing a few decades later. Because seedling andsapling layers are comprised of many shade-tolerant
species that do not occur in the canopy of secondary
forests (van Breugel et al. 2007, Norden et al. 2009), thespecies pool of these young life-history stages is likely to
be much larger than the one of adult stages, therefore
exhibiting higher phylogenetic diversity.
Increased phylogenetic evenness in seedlings com-pared to trees indicates that species colonization is an
important ecological process shaping the phylogenetic
structure of successional assemblages. Since species
colonization is directly related to distance from seed
sources, to dispersal limitation, and to the regional
species pool, our results indicate that the surrounding
vegetation matrix has important effects in the temporal
dynamics of local phylogenetic structure. Such land-
scape effects were also reflected in the variation of the
temporal patterns in phylogenetic structure observed
among plots. LSUR and LEPS, the secondary plots
located within the more forested landscape of La Selva
Biological Station, showed the most substantial increase
in phylogenetic evenness during the monitoring period
compared to CR and TIR. As TIR is a young stand (15
years old since abandonment at the beginning of the
monitoring), one would have expected this plot to show
high individual and species turnover (Anderson 2007).
Indeed, species gain exceeded rates of species loss in
LSUR and TIR, but not in LEPS and CR (Chazdon et
al. 2007). Yet, the TIR plot exhibits the highest
phylogenetic clustering among all plots, and very low
changes in phylogenetic evenness over time. This might
be due to the fact that TIR has the longest history of
disturbance and isolation. These observations highlight
FIG. 4. Nonmetric multidimensional scaling (NMDS) analysis illustrating pairwise phylogenetic distances among censuses andplots for surviving (solid symbols), recruited (open symbols), and dead (crossed symbols) trees (circles) and seedlings (squares) foreach plot, based on abundance data. See Fig. 1 for site abbreviations.
August 2012 S79PHYLOGENETIC STRUCTURE OVER SUCCESSION
the importance of the presence of mature forests within
agricultural matrices.
Temporal variation in seed production also appeared
to promote phylogenetic evenness at the seedling stage.
For instance, the sharp decline in the NRI scores
observed in all seedling assemblages occurred in a short
time frame corresponding to the simultaneous arrival of
palm propagules at the four secondary sites (Capers et
al. 2005). Interannual fluctuations in seed production
typically result in temporal pulses in recruitment,
causing important changes in species richness (Norden
et al. 2007), and thus in the phylogenetic structure of the
seedling community. Moreover, even at late stages of
succession, tree mortality can open new opportunities
for the successful establishment of early-successional
species (van Breugel et al. 2007). These processes
underlie a certain level of unpredictability in the
colonization process, resulting in a complex pattern.
For instance, dead, recruited, and surviving seedlings
did not show any phylogenetic differentiation. It is
important to note that our study focused on recruitment
of individuals into the �20 cm height class. Since early
stages are extremely vulnerable (Harms et al. 2000,
Muller-Landau et al. 2002), nonrandom patterns of
mortality in early establishment could have also
contributed to the observed changes in phylogenetic
structure. Indeed, a recent study shows that phyloge-
netic relatedness decreases among seedlings after the first
year of survival due to negative density dependence
(Metz et al. 2010). Together, these processes lead to
greater temporal fluctuations in phylogenetic structure
in seedling than in tree assemblages.
CONCLUSIONS
To our knowledge, this is the first study to determine
how demographic processes of mortality and recruit-
ment drive changes in the phylogenetic structure of plant
communities. Our results are supported by other
successional studies in ruderal (Knapp et al. 2008) and
zooplankton communities (Helmus et al. 2010), where
species adapted to disturbance were more closely related
than species occurring in non-perturbed ecosystems. We
further show that the phylogenetic structure of second-
ary stands varies at two temporal scales. At short
temporal scales, decreasing relatedness among tree
individuals over succession is the joint result of the
death of closely related early-successional individuals,
and of the recruitment of distantly related late-succes-
sional individuals. At longer temporal scales, the
colonization of propagules belonging to a wide array
of lineages increases phylogenetic evenness in seedlings
compared to trees at any one moment in succession. As
these small stems grow, future tree assemblages are
expected to exhibit higher species richness and phyloge-
netic evenness.
Temporal fluctuation in seed production and species
colonization are key elements contributing to increased
phylogenetic evenness in these reassembling communi-
ties. Under the niche conservatism scenario, studies of
community phylogenetics typically explain phylogenetic
evenness as a consequence of biotic filtering mediated by
competition or by shared pests among closely related
species, and phylogenetic clustering as the result of
environmental filtering (Webb et al. 2002, Kraft et al.
2010). These studies mostly rely on static data from
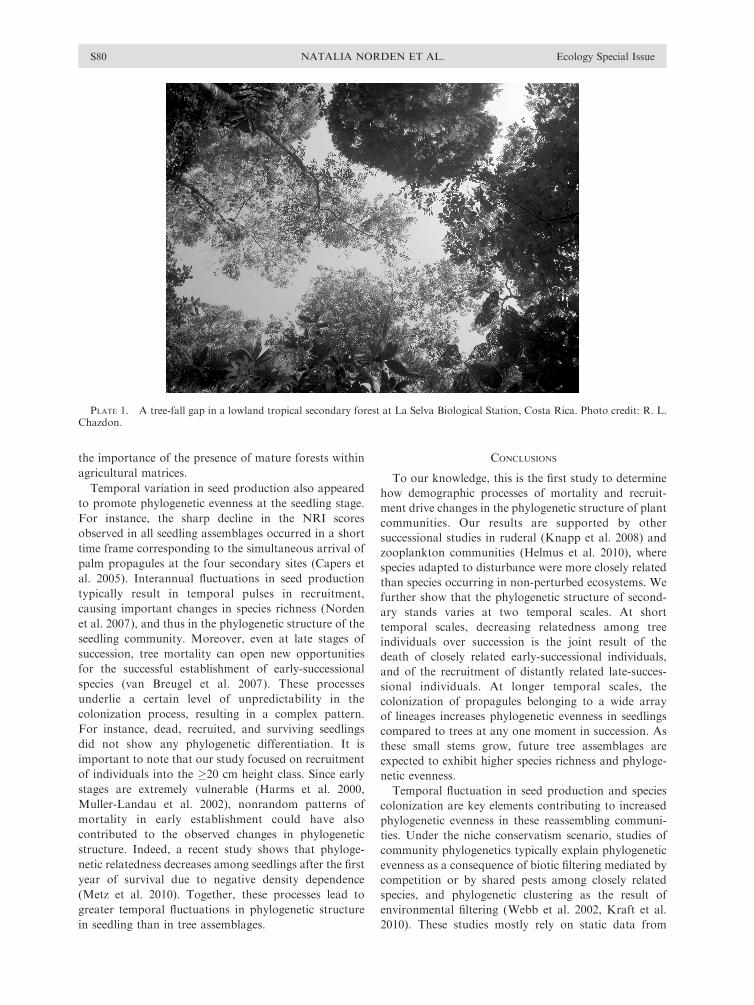
PLATE 1. A tree-fall gap in a lowland tropical secondary forest at La Selva Biological Station, Costa Rica. Photo credit: R. L.Chazdon.
NATALIA NORDEN ET AL.S80 Ecology Special Issue
mature tree communities where some assembly processes
may not be as important as in more dynamic systems.
Recent studies have shown that many processes can
affect phylogenetic structure (Cavender-Bares et al.
2009). For instance, facilitation among distantly related
species appeared to be an important driver of phyloge-
netic diversity in arid plant communities in Central
Mexico (Valiente-Banuet and Verdu 2007) and in
Mediterranean successional communities (Verdu et al.
2009). Here, we further show that other ecological
processes, occurring during the regeneration stage, also
drive successional changes in phylogenetic structure.
Abundance data showed a much stronger signal than
incidence data, suggesting that shifts in species abun-
dance due to recruitment and mortality may show a
concerted pattern of phylogenetic structure long before
the loss and gain of species shows a signal. This finding
is of critical importance, as many community phyloge-
netics studies have drawn conclusions about community
assembly processes based solely upon species occurrence
data. The field of community phylogenetics is a
promising avenue for gaining insight into community
reassembly. Future studies integrating well-resolved
phylogenies (Kress et al. 2009, Gonzalez et al. 2010),
demographic data and long-term monitoring will
provide increased sensitivity for unraveling the mecha-
nisms that determine community assembly in succes-
sional forests.
ACKNOWLEDGMENTS
We thank Sebastian Gonzalez for insightful discussionsabout community phylogenetics. David Ackerly, Daniel Cade-na, and two anonymous reviewers provided helpful commentsthat improved earlier versions of the manuscript. This researchwas supported by grants from the Andrew W. MellonFoundation, NSF DEB-0424767, NSF DEB-0639393, and theUniversity of Connecticut Research Foundation.
LITERATURE CITED
Anderson, K. J. 2007. Temporal patterns in rates of communitychange during succession. American Naturalist 169:780–793.
Blomberg, S. P., T. Garland, and A. R. Ives. 2003. Testing forphylogenetic signal in comparative data: behavioral traits aremore labile. Evolution 57:717–745.
Cadotte, M. W., R. Dinnage, and D. Tilman. 2012. Phyloge-netic diversity promotes ecosystem stability. Ecology93(Supplement):S223–S233.
Capers, R. S., R. L. Chazdon, A. R. Brenes, and B. V.Alvarado. 2005. Successional dynamics of woody seedlingcommunities in wet tropical secondary forests. Journal ofEcology 93:1071–1084.
Cavender-Bares, J., K. H. Kozak, P. V. A. Fine, and S. W.Kembel. 2009. The merging of community ecology andphylogenetic biology. Ecology Letters 12:693–715.
Cavender-Barres, J., and P. B. Reich. 2012. Shocks to thesystem: community assembly of the oak savanna in a 40-yearfire frequency experiment. Ecology 93(Supplement):S52–S69.
Chave, J., H. C. Muller-Landau, T. R. Baker, T. A. Easdale, H.Ter Steege, and C. O. Webb. 2006. Regional and phyloge-netic variation of wood density across 2456 Neotropical treespecies. Ecological Applications 16:2356–2367.
Chazdon, R. L. 2003. Tropical forest recovery: legacies ofhuman impact and natural disturbances. Perspectives inPlant Ecology, Evolution and Systematics 6:51–71.
Chazdon, R. L. 2008. Chance and determinism in tropicalforest succession. Pages 384–408 in W. P. Carson and S. A.Schnitzer, editors. Tropical forest community ecology.Blackwell, Malden, Massachusetts, USA.
Chazdon, R. L., S. Careaga, C. O. Webb, and O. Vargas. 2003.Community and phylogenetic structure or reproductive traitsof woody species in wet tropical forests. Ecology 73:331–348.
Chazdon, R. L., A. Chao, R. K. Colwell, S.-Y. Lin, N. Norden,S. G. Letcher, D. B. Clark, B. Finegan, and J.-P. Arroyo.2011. A novel statistical method for classifying habitatgeneralists and specialists. Ecology 92:1332–1343.
Chazdon, R. L., S. G. Letcher, M. van Breugel, M. Martinez-Ramos, F. Bongers, and B. Finegan. 2007. Rates of change intree communities of secondary Neotropical forests followingmajor disturbances. Philosophical Transactions of the RoyalSociety of London B 362:273–289.
Chazdon, R. L., C. A. Peres, D. Dent, D. Sheil, A. E. Lugo, D.Lamb, N. E. Stork, and S. E. Miller. 2009. The potential forspecies conservation in tropical secondary forests. Conserva-tion Biology 6:1406–417.
FAO [Food and Agriculture Organization]. 2005. The state ofthe world’s forests. FAO, Rome, Italy.
Finegan, B. 1996. Pattern and process in neotropical secondaryrain forests: the first 100 years of succession. Trends inEcology and Evolution 11:119–124.
Fritz, S. A., and A. Purvis. 2010. Selectivity in mammalianextinction risk and threat types: a new measure ofphylogenetic signal strength in binary traits. ConservationBiology 24:1042–1051.
Gomez-Pompa, A. 1971. Posible papel de la vegetacionsecundaria en la evolucion de la flora tropical. Biotropica3:125–135.
Gonzalez, M. A., A. Roger, E. A. Courtois, F. Jabot, N.Norden, C. E. T. Paine, C. Baraloto, C. Thebaud, and J.Chave. 2010. Shifts in species and phylogenetic diversitybetween sapling and tree communities indicate negativedensity dependence in a lowland rain forest. Journal ofEcology 98:137–146.
Graham, A., and D. M. Janzen. 1969. Studies in Neotropicalpaleobotany: I. The Oligocene communities of Puerto Rico.Annals of the Missouri Botanical Garden 56:308–357.
Hardy, O. J. 2008. Testing the spatial phylogenetic structure oflocal communities: statistical performances of different nullmodels and test statistics on a locally neutral community.Journal of Ecology 96:914–926.
Harms, K. E., R. Condit, S. P. Hubbell, and R. B. Foster. 2001Habitat associations of trees and shrubs in a 50-haneotropical forest plot. Journal of Ecology 89:947–959.
Helmus, M. R., W. Keller, M. J. Paterson, N. D. Yan, C. H.Cannon, and J. A. Rusak. 2010. Communities contain closelyrelated species during ecosystem perturbance. EcologyLetters 13:162–174.
Hubbell, S. P. 2001. The unified neutral theory of biodiversityand biogeography. Princeton University Press, Princeton,New Jersey, USA.
Hubbell S. P. 2005. Neutral theory in community ecology andthe hypothesis of functional equivalence. Functional Ecology19:166–172.
Hubbell, S. P., and R. B. Foster. 1992. Short-term dynamics ofa neotropical forest: why ecological research matters totropical conservation and management. Oikos 63:48–61.
ITTO [International Tropical Timber Organization]. 2002.ITTO guidelines for the restoration, management andrehabilitation of degraded and secondary forests. ITTOPolicy Development Series Number 13. ITTO, Yokohama,Japan.
Jabot, F., and J. Chave. 2009. Inferring the parameters of theneutral theory of biodiversity using phylogenetic informa-tion, and implications for tropical forests. Ecology Letters12:239–248.
Kembel, S. W., P. D. Cowan, M. R. Helmus, W. K. Cornwell,H. Morlon, D. D. Ackerly, S. P. Blomberg, and C. O. Webb.
August 2012 S81PHYLOGENETIC STRUCTURE OVER SUCCESSION
2010. Picante: R tools for integrating phylogenies andecology. Bioinformatics 26:1463–1464.
Knapp, S., I. Kuhn, O. Schweiger, and S. Klotz. 2008.Challenging urban species diversity: contrasting phylogeneticpatterns across plant functional groups in Germany. EcologyLetters 11:1054–1064.
Kraft, N. J. B., and D. D. Ackerly. 2010. Functional trait andphylogenetic tests of community assembly across spatialscales in an Amazonian forest. Ecological Monographs80:401–422.
Kress, W. J., D. L. Erickson, F. A. Jones, N. G. Swenson, R.Perez, O. Sanjur, and E. Bermingham. 2009. Plant DNAbarcodes and a community phylogeny of a tropical forestdynamic plot in Panama. Proceedings of the NationalAcademy of Science USA 106:18621–18626.
Letcher, S. G. 2010. Phylogenetic structure of angiospermcommunities during tropical forest succession. Proceedings ofthe Royal Society B 277:97–104.
Letcher, S. G., and R. L. Chazdon. 2009. Rapid recovery ofbiomass, species richness and species composition in a forestchronosequence in northeastern Costa Rica. Biotropica41:608–617.
Losos, J. B. 2008. Phylogenetic niche conservatism, phyloge-netic signal and the relationship between phylogeneticrelatedness and ecological similarity among species. EcologyLetters 11:995–1007.
McDade, L., K. S. Bawa, H. Hespenheide, and G. S.Hartshorn. 1994. La Selva: ecology and natural history of aNeotropical rain forest. University of Chicago Press,Chicago, Illinois, USA.
Metz, M. R., W. P. Sousa, and R. Valencia. 2010. Widespreaddensity-dependent seedling mortality promotes species coex-istence in a highly diverse Amazonian rainforest. Ecology91:3675–3685.
Moles, A. T., D. D. Ackerly, C. O. Webb, J. C. Tweddle, J. B.Dickie, and M. Westoby. 2005. A brief history of seed size.Science 307:576–580.
Muller-Landau, H. C., et al. 2006. Testing metabolic ecologytheory for allometric scaling of tree size, growth andmortality in tropical forests. Ecology Letters 9:575–588.
Muller-Landau, H. C, S. J. Wright, O. Calderon, S. P. Hubbell,and R. B. Foster. 2002. Assessing recruitment limitation:concepts, methods and case-studies from a topical forest.Pages 35–53 in D. J. Levey, W. R. Silva, and M. Galetti,editors. Seed dispersal and frugivory. CAB International,Wallingford, UK.
Norden, N., J. Chave, A. Caubere, P. Chatelet, N. Ferroni,P.-M. Forget, and C. Thebaud. 2007. Is temporal variation ofseedling communities determined by environment or by seedarrival? A test in a neotropical forest. Journal of Ecology95:507–516.
Norden, N., R. L. Chazdon, A. Chao, Y. H. Jiang, and B.Vilchez-Alvarado. 2009. Resilience of tropical rain forests:tree community reassembly in secondary forests. EcologyLetters 12:385–394.
Prinzing, A., W. Durka, S. Klotz, and R. Brandl. 2001. Theniche of higher plants: evidence for phylogenetic conserva-tism. Proceedings of the Royal Society B 268:2383–2389.
Proyecto Flora Digital de La Selva. 2009. Lista de plantasvasculares. Estacion Biologica La Selva. Organizacion deEstudios Tropicales (OET), Sarapiquı, Costa Rica: www.ots.ac.cr/local/florula
R Development Core Team. 2010. R: A language andenvironment for statistical computing. Version 2.11.1. RFoundation for Statistical Computing, Vienna, Austria.http://www.R-project.org
Rees, M., R. Condit, M. Crawley, S. Pacala, and D. Tilman.2001. Long-term studies of vegetation dynamics. Science293:650–654.
Revell, L. M., L. J. Harmon, and D. C. Collar. 2008.Phylogenetic signal, evolutionary process, and rate. System-atic Biology 57:591–601.
Swenson, N. G. 2009. Phylogenetic resolution and quantifyingthe phylogenetic diversity and dispersion of communities.PLoS ONE 4(2):e4390.
Swenson, N. G., and B. J. Enquist. 2007. Ecological andevolutionary determinants of a key plant functional trait:wood density and its community-wide variation acrosslatitude and elevation. American Journal of Botany91:451–459.
Swenson, N. G., B. J. Enquist, J. Thompson, and J. K.Zimmerman. 2007. The influence of spatial and size scale onphylogenetic relatedness in tropical forest communities.Ecology 88:1770–1780.
Swenson, N. G., et al. 2012. Phylogenetic and functional alphaand beta diversity in temperate and tropical tree communi-ties. Ecology 93(Supplement):S112–S125.
Valiente-Banuet, A., and M. Verdu. 2007. Facilitation canincrease the phylogenetic diversity of plant communities.Ecology Letters 10:1029–1036.
Vamosi, S. M., S. B. Heard, C. Vamosi, and C. O. Webb. 2009.Emerging patterns in the comparative analysis of phyloge-netic community structure. Molecular Ecology 18:572–592.
van Breugel, M., F. Bongers, and M. Martınez-Ramos. 2007.Species dynamics during early secondary forest succession:recruitment, mortality and species turnover Biotropica35:610–619.
Verdu, M., and J. G. Pausas. 2007. Fire drives phylogeneticclustering in Mediterranean Basin woody plant communities.Journal of Ecology 95:1316–1323.
Verdu, M., P. J. Rey, J. M. Alcantara, G. Siles, and A.Valiente-Banuet. 2009. Phylogenetic signatures of faciliationand competition in successional communites. Journal ofEcology 97:1171–1180.
Warwick, R. M., and K. R. Clarke. 1998. Taxonomicdistinctness and environmental assessment. Journal ofApplied Ecology 35:532–543.
Webb, C. O. 2000. Exploring the phylogenetic structure ofecological communities: an example for rain forest trees.American Naturalist 156:145–155.
Webb, C. O., D. D. Ackerly, and S. W. Kembel. 2008.Phylocom: software for the analysis of phylogenetic commu-nity structure and trait evolution. Bioinformatics 24:2098–2100.
Webb, C. O., D. D. Ackerly, M. A. McPeek, and M. J.Donoghue. 2002. Phylogenies and community ecology.Annual Review of Ecology and Systematics 33:475–505.
Webb, C. O., and M. J. Donoghue. 2005. Phylomatic: treeassembly for applied phylogenetics. Molecular EcologyNotes 5:181–183.
Westoby, M., D. S. Falster, A. T. Moles, P. A. Vesk, and I. J.Wright. 2002. Plant ecological strategies: some leadingdimensions of variation between species. Annual Review ofEcology and Systematics 33:125–159.
Wikstrom, N., V. Savolainen, and M. W. Chase. 2001.Evolution of the angiosperms; calibrating the family tree.Proceedings of the Royal Society B 268:2211–2220.
Wright, S. J., H. C. Muller-Landau, R. Condit, and S. P.Hubbell. 2003. Gap dependent recruitment, realized vitalrates, and size distributions of tropical trees. Ecology84:3174–3185.
NATALIA NORDEN ET AL.S82 Ecology Special Issue