demographic change and expenditure pressures in ireland
TRANSCRIPT

Demographic Change and Projections for the Public Finances over the Medium Term
Thomas Conefrey NERI Economics Seminar, 13 January 2016
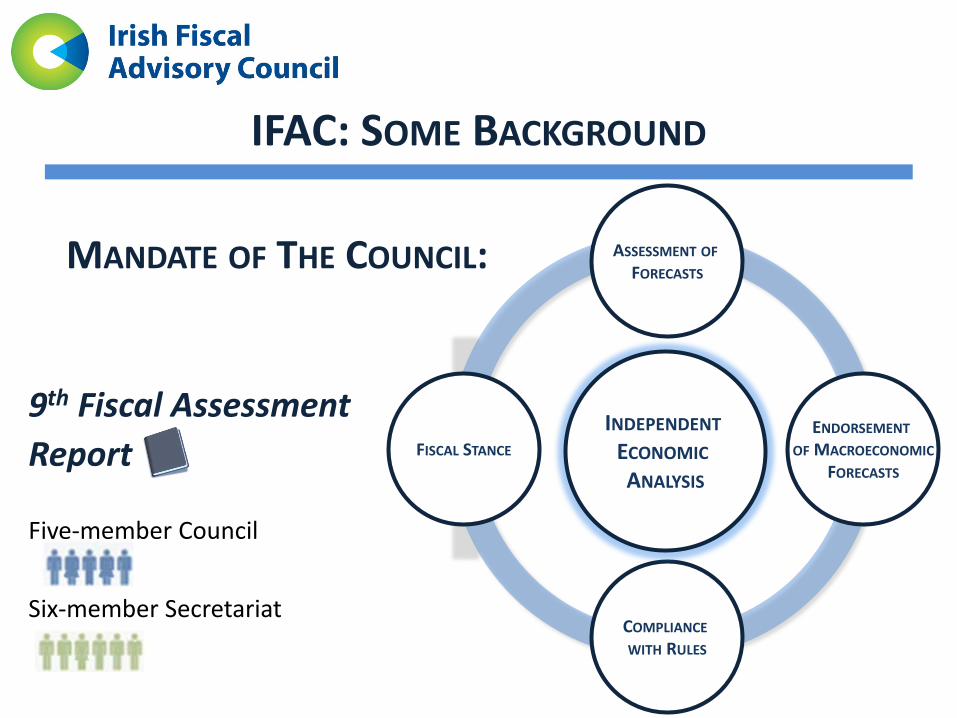
IFAC: SOME BACKGROUND
MANDATE OF THE COUNCIL:
9th Fiscal Assessment Report
Five-member Council
Six-member Secretariat
ASSESSMENT OF FORECASTS
COMPLIANCE WITH RULES
FISCAL STANCE ENDORSEMENT
OF MACROECONOMIC FORECASTS
INDEPENDENT ECONOMIC ANALYSIS

Outline • Review of recent macroeconomic and fiscal
performance (IFAC Fiscal Assessment Report, November 2015).
• Rationale for medium-term fiscal forecasts. • Estimating medium-term demographic change
and implications for public spending. • Assessment of medium-term budgetary
forecasts.

European/Domestic fiscal rules
Domestic
European
Corrective Arm of SGP
Preventive Arm of SGP
3% Deficit Rule
1/20th Debt Rule
MTO / Adjustment path to MTO
Expenditure benchmark
Domestic Budgetary
Rule
Domestic Expenditure
Ceilings
Domestic Budgetary Rule Consistent with Preventive
Arm of SGP
Domestic Expenditure Ceilings Consistent with Expenditure Benchmark
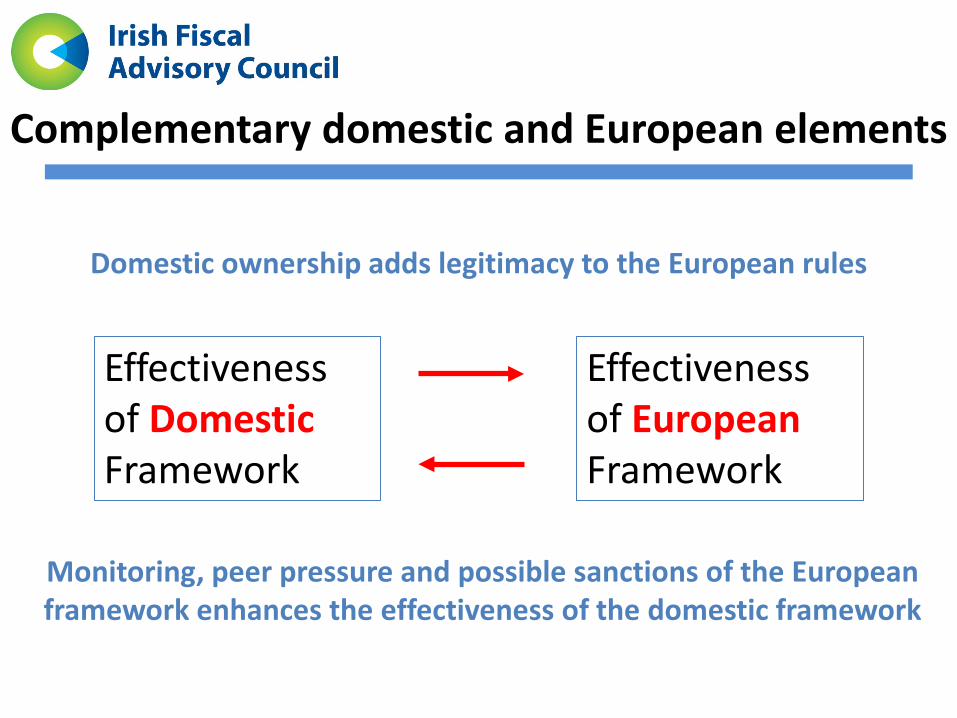
Complementary domestic and European elements
Effectiveness of Domestic Framework
Effectiveness of European Framework
Monitoring, peer pressure and possible sanctions of the European framework enhances the effectiveness of the domestic framework
Domestic ownership adds legitimacy to the European rules

REAL GDP, REAL GNP AND EMPLOYMENT GROWTH (% CHANGE Y-Y)
STRONG RECOVERY AND CENTRAL GROWTH FORECASTS
-10
-8
-6
-4
-2
0
2
4
6
8
10
12
2000 2001 2002 2003 2004 2005 2006 2007 2008 2009 2010 2011 2012 2013 2014 2015 2016 2017 2018 2019 2020 2021
% C
hang
e Y-
Y
Real GDP
Real GNP
Employment
Sources: Department of Finance (Budget 2016); CSO.

Increasing contribution of domestic demand to recovery
Source: CSO.
9.4
8.8
18.2
-10
-5
0
5
10
15
20
2010 2011 2012 2013 2014 2015
% G
row
th S
ince
Tro
ugh
in Q
2 20
09
CUMULATIVE CONTRIBUTION TO REAL GDP GROWTH SINCE TROUGH
Residual Domestic Demand
Net Exports Real GDP

Evidence of rebalancing
0%
5%
10%
15%
20%
25%
30%
35%
1998 1999 2000 2001 2002 2003 2004 2005 2006 2007 2008 2009 2010 2011 2012 2013 2014 2015
% OF NOMINAL GDP
Investment
Net Exports
Source: CSO.

Current account near balance excluding re-domiciled PLCs
-0.4 -0.6 -1.0
0.5 -0.1
-3.3
-4.9
-6.1 -5.8
-4.1
-0.8 -1.2
-1.5
3.1 3.6
-5.1
-3.9 -4.5
-5.7
-0.2
-8
-6
-4
-2
0
2
4
6
2000 2001 2002 2003 2004 2005 2006 2007 2008 2009 2010 2011 2012 2013 2014
% G
DP
Current Account Balance
Adjusted for Re-domiciled PLCs

National Income and Consumption per Head
10
15
20
25
30
35
40
45
50
55
€ ,0
00
Macro indicators per head, real
Consumption GDP GNP
Sources: CSO and Department of finance forecasts.

Sharper downturn + recovery than trading partners
60
65
70
75
80
85
90
95
100
105
110
1998 1999 2000 2001 2002 2003 2004 2005 2006 2007 2008 2009 2010 2011 2012 2013 2014 2015 2016
Inde
x: 2
007
= 10
0
REAL GDP PER CAPITA
IE UK
US EA
Sources: CSO; IMF and internal calculations.

Employment Rate
40
45
50
55
60
65
70
75
80
1992
1993
1994
1995
1996
1997
1998
1999
2000
2001
2002
2003
2004
2005
2006
2007
2008
2009
2010
2011
2012
2013
2014
2015
(lat
est)
%of
15-
64 p
opul
atio
n
Employment rate, % of 15-64 population
Ireland United Kingdom
Source: CSO and Eurostat.
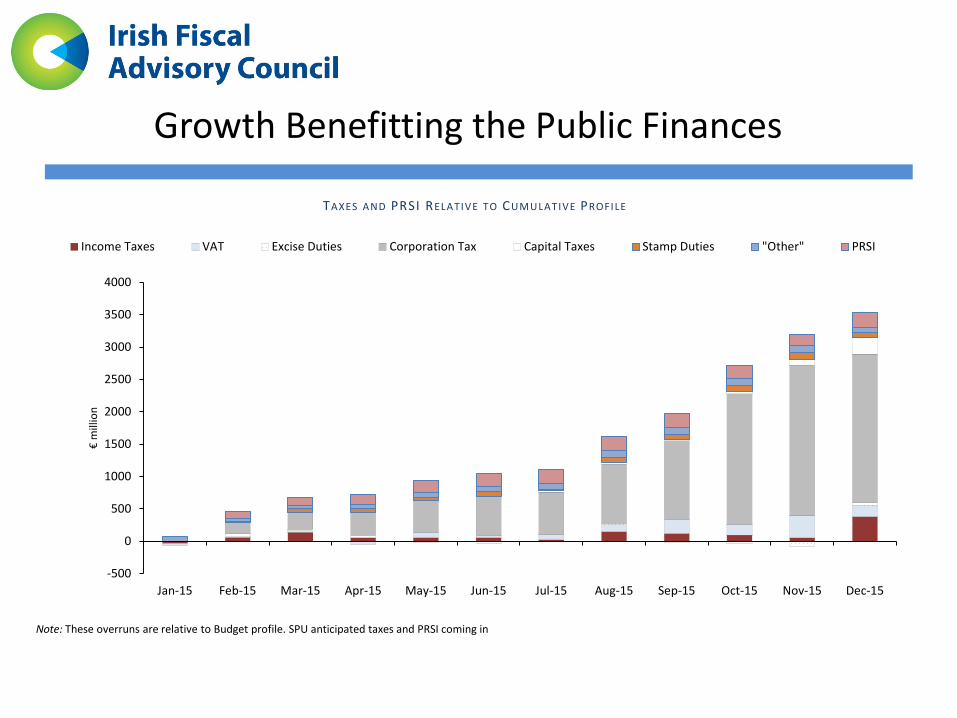
Growth Benefitting the Public Finances
-500
0
500
1000
1500
2000
2500
3000
3500
4000
Jan-15 Feb-15 Mar-15 Apr-15 May-15 Jun-15 Jul-15 Aug-15 Sep-15 Oct-15 Nov-15 Dec-15
€ m
illio
n
TAXES AND PRSI RELATIVE TO CUMULATIVE PROFILE
Income Taxes VAT Excise Duties Corporation Tax Capital Taxes Stamp Duties "Other" PRSI
Note: These overruns are relative to Budget profile. SPU anticipated taxes and PRSI coming in

Exchequer Tax Revenue
- 5
10 15 20 25 30 35 40 45 50
Jan-
95N
ov-9
5Se
p-96
Jul-9
7M
ay-9
8M
ar-9
9Ja
n-00
Nov
-00
Sep-
01Ju
l-02
May
-03
Mar
-04
Jan-
05N
ov-0
5Se
p-06
Jul-0
7M
ay-0
8M
ar-0
9Ja
n-10
Nov
-10
Sep-
11Ju
l-12
May
-13
Mar
-14
Jan-
15N
ov-1
5
€ bi
llion
ANNUALISED EXCHEQUER TAX RECEIPTS 1995-2015
Source: Department of Finance.

EXCESSIVE DEFICIT CLOSED IN 2015
0.3
-7.0
-11.5 -11.0
-8.4 -7.9
-5.7
-3.9
-2.1 -1.2
-14
-12
-10
-8
-6
-4
-2
0
2
4
2007 2008 2009 2010 2011 2012 2013 2014 2015 2016
% o
f GDP
Primary Balance
Interest
General Government Balance
EDP Ceiling
Source: CSO; Budget 2016.
GENERAL GOVERNMENT BALANCE (% GDP)

REAL GDP FAN CHART BASED ON BUDGET 2016 PROJECTIONS (TO 2016)
BUT SIGNIFICANT RISKS AROUND CENTRAL FORECASTS
-6
-4
-2
0
2
4
6
8
2008 2009 2010 2011 2012 2013 2014 2015 2016
% C
hang
e Y-
Y
80% likelihood range60% likelihood range40% likelihood range20% likelihood rangeOfficial Outturns / Central Forecasts
Sources: CSO; Department of Finance; internal IFAC calculations. Note: Distributions or 'fans' around historical growth estimates are based on previous revisions to real GDP data. Both forecast errors and revisions are based on 1999-05 sample.

CRISIS LEGACY OF HIGH DEBT AND ASSOCIATED RISKS
76.0
84.2
62.5
69.3
0
20
40
60
80
100
120
140
160
2000 2001 2002 2003 2004 2005 2006 2007 2008 2009 2010 2011 2012 2013 2014 2015 2016 2017 2018 2019 2020 2021
Gross Debt (% GDP)Gross Debt (% Hybrid)Net Debt (% GDP)Net Debt (% Hybrid)
Sources: Department of Finance; internal IFAC calculations. Note: Changes in EDP debt instrument assets for forecast years are assumed to be in line with Budget 2016 projected changes in cash balances.
GENERAL GOVERNMENT DEBT

Outlook
Short Term • Policy vigilance and economic growth have helped to improve
the public finances – But significant risks surround the forecasts.
– Importance of prudence to ensure sustainable growth.
Medium Term • Key weakness remains the absence of realistic medium-term
projections for the public finances. • Projections for expenditure, tax revenue, deficit and debt based
largely on technical assumptions. • With period of crisis management and repair coming to an end,
opportunity to re-focus on medium term.

Why are Medium-Term Budgetary Plans Important?
• Budgetary process has focussed attention excessively on one-year ahead.
• This has contributed to pattern of procyclicality in Irish fiscal policy.
• Medium-term fiscal plans are required in order to: – Provide a medium-term anchor for the public finances and
avoid the risk that incoming cyclical revenues are spent. – Increase the predictability of the budgetary planning
process. – Provide a link between resource allocation and
Government policy and priorities. • Key theme of recent Fiscal Assessment Reports

Deviations from Expenditure Plans
-10%
-5%
0%
5%
10%
15%
20%
25%
30%
2000 2001 2002 2003 2004 2005 2006 2007 2008 2009 2009* 2010 2011 2012 2013 2014 2015
% d
evia
tion
GROSS CURRENT EXPENDITURE, % DEVIATION FROM FORECAST
Yr1 % Deviation Yr2 % Deviation
Yr3 %Deviation Real GDP growth
Budget Year
Source: Department of Finance Note: * denotes the Supplementary budget in 2009. Bars show the forecast error for 1 year ahead, 2 years ahead and 3 years ahead. Latest figures for 2016 to 2018 (used in calculation the latest deviation from Budget 2015 years 2 and 3) are adjusted by €1 billion to reflect the change in the treatment of the HSE from 2015. This adjustment is made for comparison purposes.
44
45
46
47
48
49
50
51
52
53
54
2013 2014 2015 2016 2017 2018
€ bi
llion
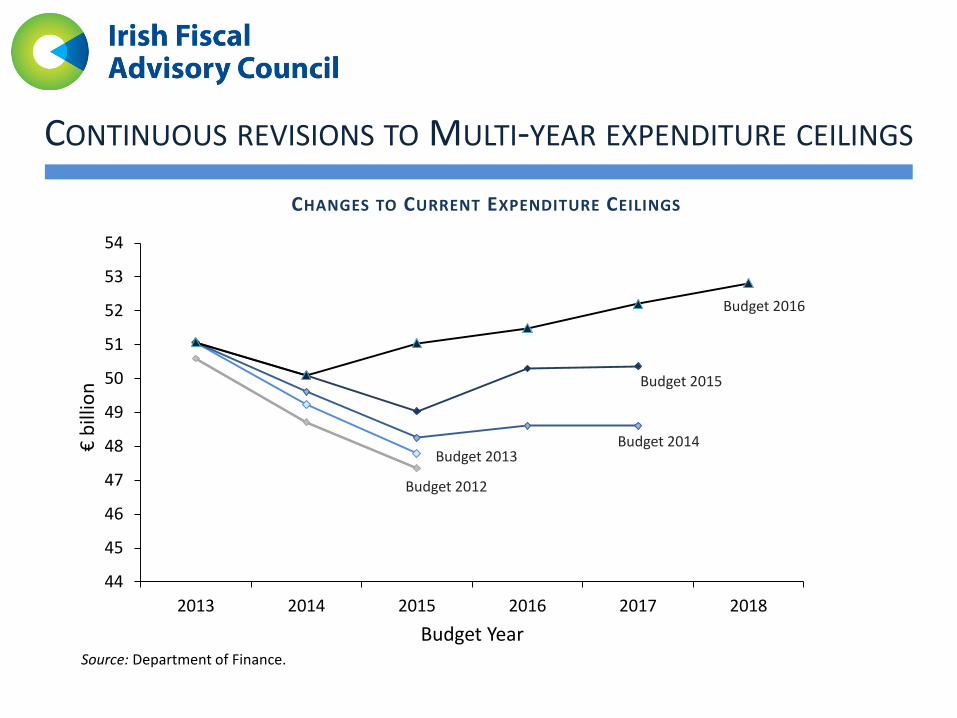
Budget Year Source: Department of Finance.
Budget 2012
CONTINUOUS REVISIONS TO MULTI-YEAR EXPENDITURE CEILINGS
CHANGES TO CURRENT EXPENDITURE CEILINGS
Budget 2013 Budget 2014
Budget 2015
Budget 2016

Medium-Term Fiscal Plan in Budget 2016
• Budget 2016 medium-term fiscal projections include: – €0.4 billion per annum for demographic pressures – Cost of Lansdowne Road Agreement until 2018
• Tax forecasts allow for indexation but assume no change in policy, despite stated commitments to reduce taxes.
• Medium-term plans imply over-compliance with fiscal rules although stated policy is for minimum compliance.
• Develop an alternative medium-term expenditure scenario for 2015-2021
• Scenario takes into account estimated demographic changes and assumptions on the cost of providing public services based on Budget 2016 macro projections.

Budget 2016 Projections imply Steep Fall in Primary Spending
20
25
30
35
40
45
1996 1997 1998 1999 2000 2001 2002 2003 2004 2005 2006 2007 2008 2009 2010 2011 2012 2013 2014 2015 2016 2017 2018 2019 2020 2021
% o
f GDP
Government Revenue and Primary Expenditure, % of GDP
Primary expenditure/GDP Revenue/GDP
Note: Chart shows Exchequer revenue and primary expenditure as a share of GDP. Source: Budget 2016 and internal IFAC calculations.

Methodology: Steps
1. Produce baseline demographic projections using Cohort Component Method.
2. Demographic scenario with projections of population by age used as input into long-term fiscal model.
3. Volume of public expenditure linked to demographics, price indexed to relevant deflators.
4. Compare resulting scenario to Budget 2016 projections and estimates of fiscal space.

Medium-Term Demographic Projections
• First step in producing alternative expenditure scenario is to develop baseline population projections.
• Cohort Component Method used to build basic demographic model.
• Most frequently used methodology for projections. • UK Office for National Statistics, AWG, CSO, Smith (2013). • Provides projections not only of total population but also of
demographic composition and individual components of growth by age and gender
• The cohort component equation describes population at time
t+1 as today’s population varied with changes in births, deaths, and net migration:

Overview of the Cohort Component Method
Launch Year Population (CSO 2015)
Survived Population
Projected Migration
Budget 2016, Dept. Finance.
Survival Rates (CSO 2015)
Child-bearing Population (Females, 15 – 54)
Survived Births
Projected Population
Survival Rates for Under 1 year old
(CSO, 2015)
Fertility Rates (EUROPOP, 2013)

Steps 1. Calculate the number of people in the base
population that survive to the next age interval. 2. Project migration flows for each year and add
them to the survived population. 3. Project the number of births occurring during
the projection interval. 4. Add the number of births to the rest of the
population to get a projection of the total population by gender and age for each projection 1 year interval.

Assumptions • Projections for the population structure involve assumptions about
mortality, migration, and fertility. For our basic projections we assume :
1. Mortality: estimated by applying the survival rates from recently released CSO Irish Life Tables (CSO, 2015).
2. Fertility: ASFR used to calculate births. Fertility assumptions in line with EC AWG (2015) and imply slight decrease in fertility rate to 1.98 by 2065. Immigrants face same age-specific fertility rate (CSO, 2013).
3. Migration: most difficult component to estimate. Number of options for migration projections:
• Use CSO (2013) judgemental projections • Model migration (ESRI) • Use Department of Finance projections
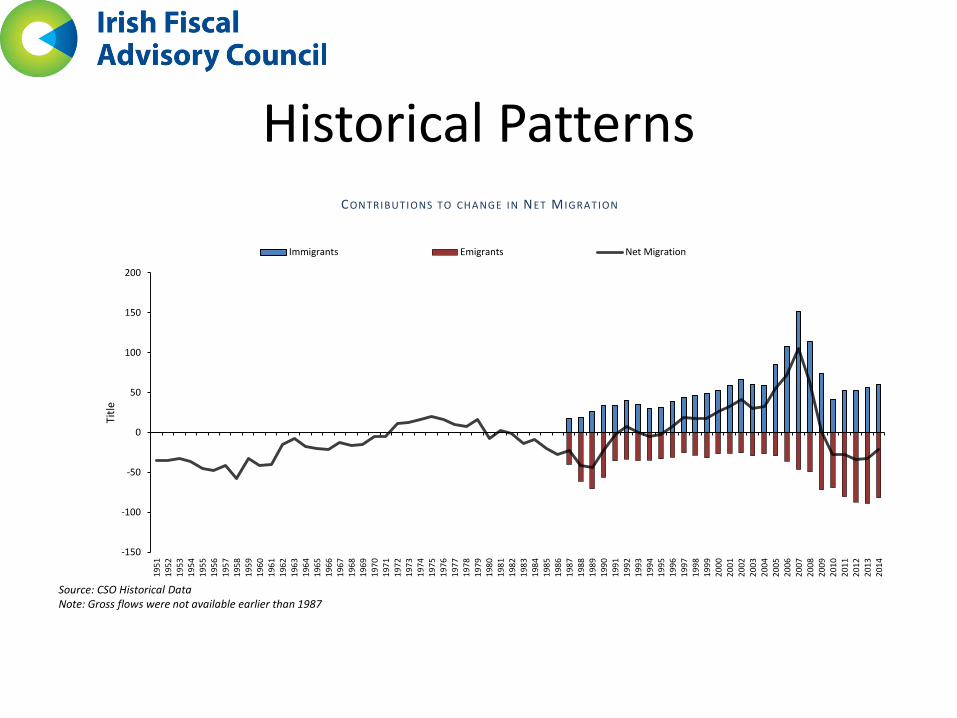
Historical Patterns
-150
-100
-50
0
50
100
150
200
1951
1952
1953
1954
1955
1956
1957
1958
1959
1960
1961
1962
1963
1964
1965
1966
1967
1968
1969
1970
1971
1972
1973
1974
1975
1976
1977
1978
1979
1980
1981
1982
1983
1984
1985
1986
1987
1988
1989
1990
1991
1992
1993
1994
1995
1996
1997
1998
1999
2000
2001
2002
2003
2004
2005
2006
2007
2008
2009
2010
2011
2012
2013
2014
Title
CONTRIBUTIONS TO CHANGE IN NET MIGRATION
Immigrants Emigrants Net Migration
Source: CSO Historical Data Note: Gross flows were not available earlier than 1987
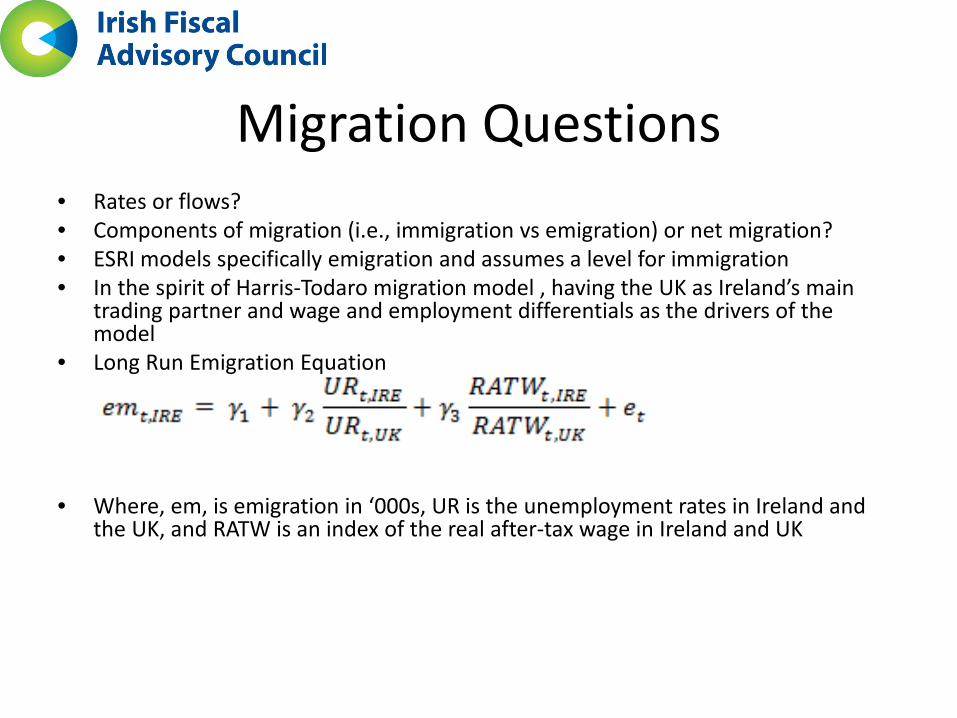
Migration Questions • Rates or flows? • Components of migration (i.e., immigration vs emigration) or net migration? • ESRI models specifically emigration and assumes a level for immigration • In the spirit of Harris-Todaro migration model , having the UK as Ireland’s main
trading partner and wage and employment differentials as the drivers of the model
• Long Run Emigration Equation
• Where, em, is emigration in ‘000s, UR is the unemployment rates in Ireland and the UK, and RATW is an index of the real after-tax wage in Ireland and UK

Baseline Demographic Scenario
-1.5%
-1.0%
-0.5%
0.0%
0.5%
1.0%
1.5%
2.0%
2.5%
3.0%
3.5%
4.0%
-60
-40
-20
0
20
40
60
80
100
120
140
160
1951
1953
1955
1957
1959
1961
1963
1965
1967
1969
1971
1973
1975
1977
1979
1981
1983
1985
1987
1989
1991
1993
1995
1997
1999
2001
2003
2005
2007
2009
2011
2013
2015
2017
2019
2021
2023
2025
2027
2029
2031
2033
2035
2037
2039
2041
2043
2045
2047
2049
'000
Annual Population change
growth in '000 % growth (rhs)

Dependency Ratios
0.0%
10.0%
20.0%
30.0%
40.0%
50.0%
60.0%
70.0%
80.0%
90.0%
% o
f wor
king
age
pop
ulat
ion
Year
Dependency Ratios
Very Old age dependency ratio (80+)
Old age dependency ratio (65+)
Youth dependency ratio (0-14)
Total dependency ratio
Share of People 65+
Note: The dependency ratio is an age-population ratio of those typically not in the labor force (the dependent part) and those typically in the labor force (the productive part). It shows the pressure on the productive part of the population. For the estimation of the “Total Dependency Ratio” we took into account the share of the population over 65 and under 14 divided by the rest of the population. Source: CSO, EUROSTAT, Author’s own Estimations
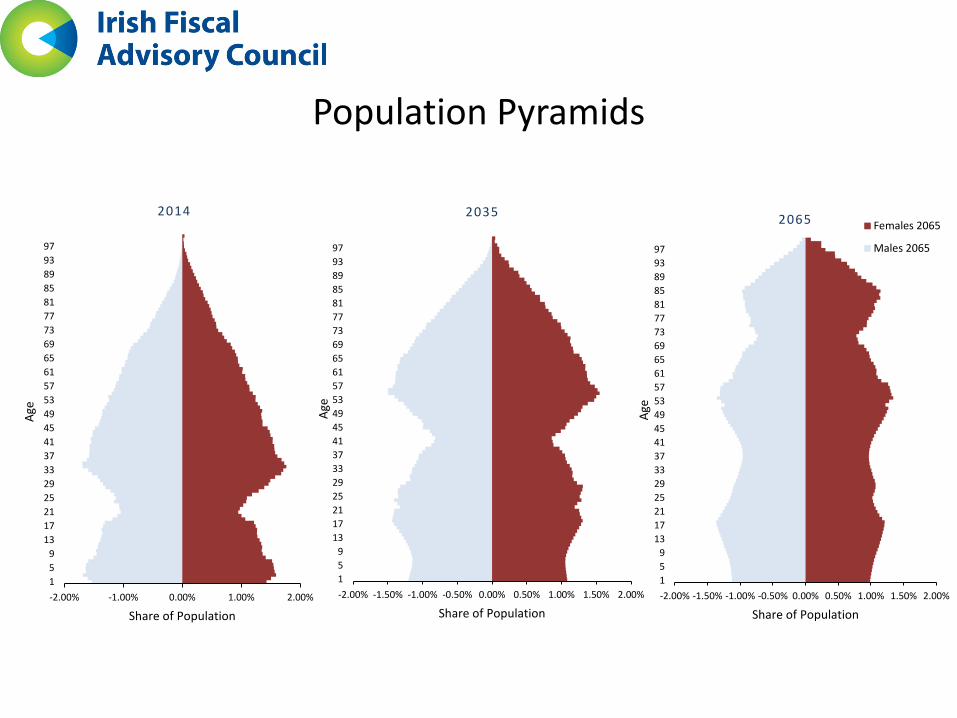
Population Pyramids
-2.00% -1.00% 0.00% 1.00% 2.00%159
13172125293337414549535761656973778185899397
Share of Population
Age
2014
-2.00% -1.50% -1.00% -0.50% 0.00% 0.50% 1.00% 1.50% 2.00%159
13172125293337414549535761656973778185899397
Share of Population
Age
2035
-2.00% -1.50% -1.00% -0.50% 0.00% 0.50% 1.00% 1.50% 2.00%159
13172125293337414549535761656973778185899397
Share of Population
Age
2065 Females 2065
Males 2065

Medium-Term Expenditure Scenario
• Baseline demographic projections used to construct expenditure scenario. • Macroeconomic assumptions from Budget 2016. • Government expenditure split into five components: Health, Education,
Social Payments, Capital Expenditure, National Debt Interest. • Pay: LRA until 2018, thereafter public sector pay grows in line with non-ag
wages and expected service demand. • Non-pay: in health, education grow in line with expected demand linked to
demographics. • Social Protection: split into four broad components: old age, child related
payments, unemployment and other. • Capital expenditure: projections based on Infrastructure and Capital
Investment Plan 2016-2021. • Debt interest: average interest rate from Budget 2016 applied to
difference between Exchequer balance projections.

Capital Expenditure
0.0%
1.0%
2.0%
3.0%
4.0%
5.0%
6.0%
7.0%
1983
1984
1985
1986
1987
1988
1989
1990
1991
1992
1993
1994
1995
1996
1997
1998
1999
2000
2001
2002
2003
2004
2005
2006
2007
2008
2009
2010
2011
2012
2013
2014
2015
2016
f20
17f
2018
f20
19f
2020
f20
21f
grow
th in
spen
ding
Departmental Capital Expenditure, % of GDP
Capital spending, % of GDP
Average 1983-2015
Source: Budget 2016, Budget and Economic Statistics (Department of Finance).

Comparison of Expenditure Scenarios
20%
22%
24%
26%
28%
30%
32%
2015 2016 2017 2018 2019 2020 2021
% o
f GDP
Primary expenditure, % of GDP - Budget 2016 Primary expenditure, % of GDP - IFAC Scenario 1
Primary expenditure, % of GDP - IFAC Scenario 2
Note: Scenario 1 allows for demographic change with no indexation. Scenario 2 allows for demographic change plus indexation. Source: Internal IFAC calculations.
COMPARISON OF PRIMARY EXPENDITURE UNDER ALTERNATIVE SCENARIOS

Budget Projections imply Steep Fall in Primary Spending
20
25
30
35
40
45
1996 1997 1998 1999 2000 2001 2002 2003 2004 2005 2006 2007 2008 2009 2010 2011 2012 2013 2014 2015 2016 2017 2018 2019 2020 2021
% o
f GDP
Government Revenue and Primary Expenditure, % of GDP
Primary expenditure/GDP
Revenue/GDP
Primary expenditure/GDP, IFAC Scenario
Note: Chart shows Exchequer revenue and primary expenditure as a share of GDP. Source: Budget 2016 and internal IFAC calculations.

Expenditure Scenario and Estimated Fiscal Space
0.0%
0.5%
1.0%
1.5%
2.0%
2.5%
3.0%
3.5%
4.0%
4.5%
2017 2018 2019 2020 2021
grow
th in
spen
ding
Estimated Expenditure Pressures Compared With Allowable Expenditure Growth
Allowable Expenditure Growth Expenditure Pressures
Source: Internal IFAC calculations. Note: Expenditure pressures are estimated under the assumptions outline in Box E. Allowable expenditure refers to expenditure growth that would be compliant with the Expenditure Benchmark. The calculation of allowable expenditure growth assumes indexation of the income tax system. If the Government decides not to fully index income tax bands, this would create additional fiscal space.

Conclusion • Significant progress made in resolving Ireland’s fiscal crisis. • Encouraging central scenario for projected growth. • But significant risks around that scenario in environment of
elevated uncertainty. • Realistic medium-term fiscal plans needed to avoid repeat of past
mistakes. • Need for comprehensive bottom-up medium-term expenditure
projections and comparison to likely fiscal space. • Ongoing work:
– Impact of demographics on long-run growth. – Link demographics and macro scenario with the fiscal model. – Incorporate results of research on pensions, health projections from
ESRI, IGEES.