democracy and violent crime - brookings - quality ... working paper on democracy and violent crime...
TRANSCRIPT

1
Working Paper on
Democracy and Violent Crime
By Ted Piccone1
1 Introduction
In preparation for the Community of Democracies’ Democracy and Security Dialogue,
Brookings Institution researchers analyzed the relationship between democracy and violent crime
from 2000-14. Without controlling for other variables, we found that countries with low
homicide rates tend to be strong autocracies and strong democracies, whereas democratically
weaker regimes are more likely to have higher levels of homicide.
This paper is organized as follows. First, we outline the extant literature on democracy and crime
before detailing how we conceptualize and measure these two variables. Second, we analyze the
relationship between these two variables. We conclude with a discussion of our results.
2 Variables of Interest
This paper conducts a bivariate analysis of the relationship between democracy and crime,
specifically homicide rates.2 The following analysis compares levels of democracy and homicide
rates in 83 countries during the years 2000 through 2014.3 These 83 countries were chosen
because they were the only ones with sufficient reliable data available, as discussed below.
Overall, Europe, North America, Latin America, and parts of Asia are well represented in our
sample and the rest of the world is underrepresented.
2.1 Literature Review
A 2011 review of 54 studies found that the most robustly supported predictors of murder were
levels of income inequality, location in Latin America, divorce rates, location in Asia, and “the
Decommodification Index,” which is the measure of social welfare expenditure and worker
protection. The first three of these predictors were positively correlated with homicide rates,
whereas the last two were negatively correlated with homicide rates. Conversely, population
density and size, unemployment levels, economic development, and democracy indices were
1 This paper was prepared with major research contributions from Julian Duggan, and research support by
Christopher Meserole and Matthew Koo. 2 Most academic research has focused on homicide rates because they are by far the most reliable and widely
available crime statistic, including for countries outside Europe and North America. 3 See Supplement 5.1 for complete list of included countries.
Democracy and Security Dialogue Working Paper Series

2
among the weakest predictors of homicide rates.4 In light of this, we must be cautious in our
interpretation of our results so far. Established democracies do in fact experience lower homicide
rates, it seems, but it is unclear that democratization per se produces this effect.
In the figure below, Gary LaFree and Andromachi Tseloni succinctly summarize the four main
hypotheses concerning the relationship between democracy levels and homicide rates5:
H1: “Null”—There is no relationship between increasing levels of democracy and
homicide rates.
H2: “Civilization”—Democracy is negatively correlated with homicide rates.
Higher levels of democracy are associated with lower levels of homicide.
H3: “Conflict”—Democracy is positively correlated with homicide rates. Higher
levels of democracy are associated with higher levels of homicide.
H4: “Modernization”—A curvilinear relationship between democracy and
homicide rates, where crime rates are highest in transitional democracies.
In their own research, LaFree and Tseloni find evidence for the Modernization Hypothesis, which
maintains that homicide rates are lower in stable regimes (be they democratic or autocratic), and
higher in “transitional democracies,” defined as a diverse mix of political systems in between fully
4Amy Nivette, "Cross-National Predictors of Crime: A Meta-Analysis." Homicide Studies 15, no. 2 (2011): 103-31. 5 Gary Lafree and Andromachi Tseloni, “Democracy and Crime: A Multilevel Analysis of Homicide Trends in
Forty-Four Countries, 1950-2000,” The Annals of the American Academy of Political and Social Science 605
(2006): 26-49.
3
competitive and factional ones (polities with parochial or ethnic-based political factions). Yet,
other articles by other academics have come out in favor of the other positions.6
Though not explored in this working paper, proponents of these different theses offer a set of
causal mechanisms to explain the relationship (or lack thereof) between democracy and homicide
rates. For example, modernization theorists point to the political and economic instability inherent
to “transitional” societies and governments as the cause for the increase in homicides. Other
popular explanations for why murder rates are generally lower in full-fledged democracies include
the following:
1. Democracies enjoy higher levels of legitimacy in the eyes of their citizens, thus the rule
of law is more highly respected.7
2. Democracies punish serious crimes more severely and petty crimes less severely,
meaning that they deter murder more effectively than non-democracies.8
3. The cultural values espoused by the citizens of democracies are more peaceful and
egalitarian than those of non-democracies, resulting in lower murder rates.9
2.2 Homicide Rates
We use the World Bank’s data on homicide rates for our analysis.10 This data, the World Bank
acknowledges, are subject to several biases, including underrepresentation of the developing
world, asymmetries in reporting countries’ definitions of homicide, and those imposed by
difficulties in collecting and compiling reliable data in nations with limited statistical capacity.
Therefore, democracies outnumber non-democracies in our own analysis.11 It bears mention that
Latin America, which has 14 out of the 15 countries with the highest homicide rates in our
6 See e.g., Theresa P. R. Caldeira, and James Holston, “Democracy and Violence in Brazil,” Comparative Studies in
Society and History 41, no 4 (1999): 691–729; Manuel Eisner, “Modernization, Self-Control, and Lethal Violence:
The Long-term Dynamics of European Homicide Rates in Theoretical Perspective,” The British Journal of
Criminology 41, no 4: 618-638; Nivette, "Cross-National Predictors of Crime,” 103-31. 7 Amy Nivette, “Legitimacy and Crime: Theorizing the Role of the State in Cross-National Criminological Theory,”
Theoretical Criminology 18, no 1 (2014): 93-111. 8 Ming-Jen Lin, “Does Democracy Increase Crime? The Evidence from International Data,” Journal of Comparative
Economics 35, no 3 (2007): 467-83. 9 Janet Stamatel, “Democratic Cultural Values as Predictors of Cross-National Homicide Variation in Europe,”
Homicide Studies 20, no 3 (2016): 239-256. 10 The World Bank gathers its data solely from the United Nations Office on Drugs and Crime (UNODC), which in
turn collects its information from the World Health Organization (WHO), the Pan American Health Organization
(PAHO), and the United Nations Survey of Crime Trends and Operations of Criminal Justice Systems, among other
sources. Academic researchers generally regard the WHO data as the most trustworthy, but as Marshall and Block
argue, “In view of the importance of retaining as many countries as possible in a multinational analysis, limiting
cross-national analysis of homicide to countries with data available from a single data source appears unwarranted.
Even if one data source, such as WHO data, were considered more valid or reliable than others, it would be a
potential waste of scarce data to completely dismiss other data, such as Interpol or UN homicide statistics, as
useless.” 11 Depending upon the measure of democracy used, there are 2 to 3.5 times as many democracies in our sample as
non-democracies. See Supplement 5.2 for exact figures.

4
sample, may play a role in dragging up the average homicide rates we find among weak
democracies and non-democracies.12
Throughout this report, national homicide rates are given in terms relative to 100,000 citizens per
year. For example, a statement “Spain has an average homicide rate of one” means that in an
average year, Spain has one person murdered for every 100,000 in its population. Our analysis
included only those countries that had homicide data available for 11 or more of the 15 years
between and including 2000 and 2014, a list of which can be found in Supplement 5.1.
2.3 Democracy
Our data on democracy are drawn from the Varieties of Democracy (V-Dem) Project, Freedom
House, and Polity. Throughout this report, we will use three types of democracy variables. The
first type is the raw democracy score assigned to each country in each year by the three
democracy databases. Each country has annual V-Dem scores, annual Freedom House scores,
and annual Polity Scores for all (or almost all) years between and including 2000 and 2014.
The second type of democracy variable is what we call a “democracy level.” We create each
democracy level in the following way: for all of the years between and including 2000 and 2014,
we average each country’s V-Dem score. Next, we group countries with similar average scores
together into the 10 V-Dem levels, which run from 0 to 9. We repeat this same process using
each country’s annual Freedom House scores and annual Polity scores. Thus, each country has a
V-Dem level, a Freedom House level, and a Polity level. We should note that, as demonstrated in
Supplement 5.2, some democracy levels include significantly more countries than others do, and
this is a direct result of the aforementioned homicide data limitations.
The third type of democracy variable is what we call “democracy quartiles.” We create each
democracy quartile in the following way: for all the years between 2000 and 2014, we average a
country’s V-Dem score. Then, we split the countries into two groups—democracies and
autocracies—by designating all countries with an average V-Dem score of less than .4 as
autocracies and all countries with an average V-Dem score of .4 or greater as democracies.
Within the autocracy group, we find the country with the median average V-Dem score. Then,
we call all countries with average scores less than the median “Strong Autocracies” and all
countries with average scores greater than or equal to the median “Weak Autocracies.” Similarly,
in the group of democratic countries, we find the country with the median average score. Then,
we call all countries with average scores less than the median “Weak Democracies” and all
countries with average scores greater than or equal to the median “Strong Democracies.” Each
country falls into exactly one of these four categories. We repeat this process using each
country’s annual Freedom House scores, where all countries with an average score below 4 are
autocracies and the rest are democracies. Finally, we repeat this process one more time using
each country’s annual Polity scores, where all countries with an average score below 6 are
autocracies and the rest are democracies. Recall that we chose the cutoff points for V-Dem
democracies (i.e., .4 and higher) and Freedom House democracies (i.e., 4 and higher) based on
our own best judgement, whereas the cutoff for Polity democracies (i.e., 6 and higher) is a
12 Again depending upon the measure of democracy used, Latin America has either 3 or 4 strong democracies, and
between 8 and 10 weak democracies (in our sample).

5
convention in academic literature. As with the democracy levels, Supplement 5.2 demonstrates
that the democracy quartiles are of unequal sizes, which is a result of our data limitations.
3 Empirical Strategy
This section of our paper has three components: mean analysis, standard deviation analysis, and
regression analysis.
3.1 Mean Analysis
Through mean analysis we seek to compare the homicide rates of countries with different levels
of democratic development. We repeat this analysis using the V-Dem, Freedom House, and
Polity scores. To begin with the mean analysis, we first group countries by their democracy
levels, and then within each democracy level, we average the mean homicide rates to find the
average for that democracy level. In general, the bar graphs below support the Modernization
Hypothesis, thereby suggesting that homicide rates are higher at intermediate levels of
democracy.
Democracy Level Graphs
Average Annual Homicides per 100,000 by V-Dem Level

6
The aforementioned trend is also apparent in the “democracy quartiles” graphs below. In the
second iteration of this mean analysis, we group countries by their democracy quartiles, rather
than their democracy levels. Interestingly, two out of the three quartiles graphs show that weak
democracies have meaningfully higher average homicide rates than weak autocracies do. Further
analysis revealed that this fact remains true even when all Latin American countries are removed
from the calculations, demonstrating that this trend is not just an accident of where the high-
homicide-rate Latin American countries tend to fall. On the other hand, this finding is heavily
dependent on where we decide to place the line between “democracies” and “autocracies.”13
13 In the V-Dem and Freedom House models, we cautiously decided to call every country with average scores
greater than or equal to .4 (for V-Dem) and 4 (for Freedom House) “democracies.” See Supplement 5.3.

7
Finally, it is worth noting that the highest level democracies uniformly have the lowest average
rates of homicide.
Democracy Quartile Graphs
Average Annual Homicides per 100,000 by V-Dem Quartile

8
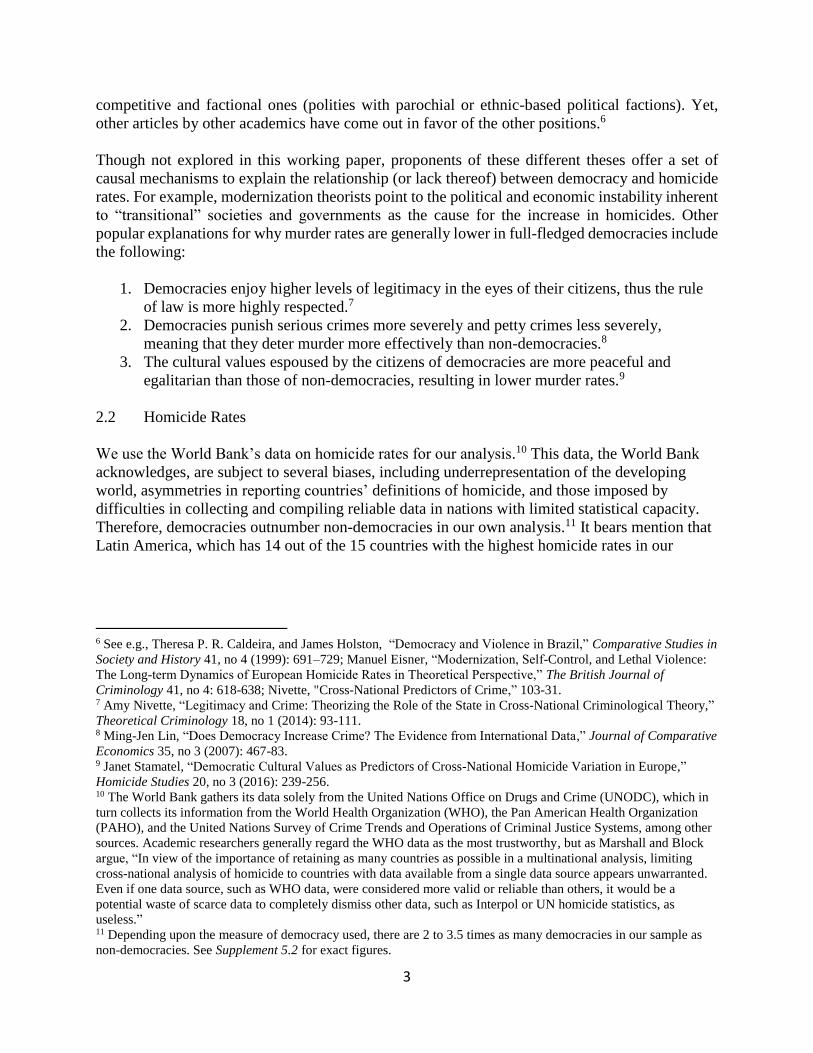
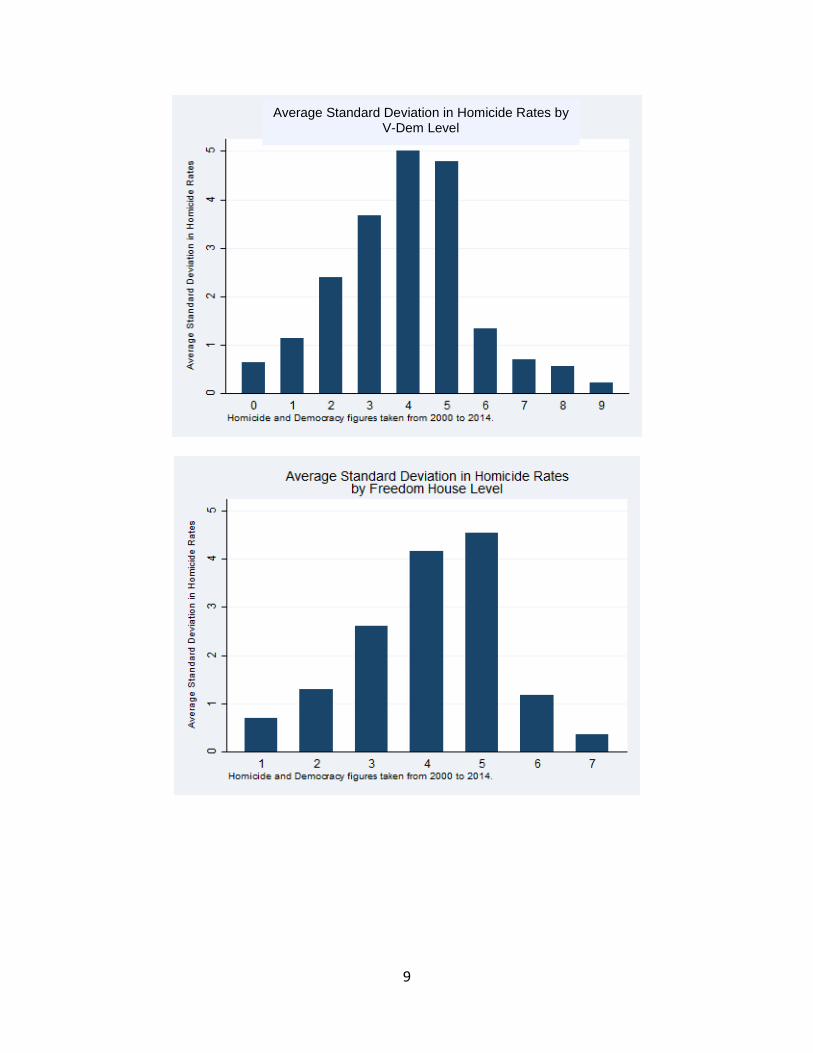
3.2 Standard Deviation Analysis
For standard deviation analysis, we first identify the standard deviation of each country’s annual
homicide rate between 2000 and 2014. Taking the standard deviation of each country’s homicide
rates gives us a sense of how frequently that rate fluctuates up and down from year to year (i.e.
how “volatile” the country’s homicide rate is). Having found the standard deviation for each
country’s homicide rate, we then group countries into democracy levels, and take the average
standard deviation for each level, creating a bar graph to display the results. Finally, utilizing
data from V-Dem, Freedom House, and Polity, we compare the volatility of homicide rates in
countries at different levels of democracy.
The following graphs suggest that hybrid regimes have a higher volatility in homicide rates than
strong democracies and autocracies. This trend remains consistent even when Latin American
countries, which have 12 out of the 13 most volatile homicide rates,14 are excluded from our
analysis.15
14 South Africa joins this group with the eighth most volatile homicide rate. 15 See Supplement 5.4 for an ordering of countries by homicide rate volatility.
9
Average Standard Deviation in Homicide Rates by V-Dem Level

10
3.3 Regression Analysis
Regression analysis involves us plotting all 86 countries on one chart. The y-axis measures their
average annual homicide rates and the x-axis measures their average level of democracy. We
then run a bivariate quadratic regression to probe whether the Modernization Hypothesis holds
when studying the relationship between average homicide rates and average democracy levels. In
addition, we test the Null, Conflict, and Civilization Hypotheses. Our analysis uses V-Dem,
Freedom House, and Polity scores.
In general, the following scatter plots and quadratic regressions are evidence for the
Modernization Hypothesis described above. Homicide rates are uniformly lower in countries at
both extremes of the democracy range. Though many hybrid regimes have low average homicide
rates, a sizable proportion of them still have average homicide rates that are greater than
countries at the extremes. The quadratic regressions and their confidence intervals testify to this
trend, since they look like an inverted “U.” This trend is fairly consistent across all three methods
of measuring democracy.16
16 Note that in the Polity graph, the conventional cutoff for a “democracy” is at a 6, so the lopsidedness of the scatter
plot to the right is a product of this fact. This shift right may also be a result of our sample, which, as we said above,
favored moderately to highly developed democracies.

11
Quadratic Regressions
Liberal Democracy Level by V-Dem
Liberal Democracy Level by Freedom House
Average Annual Homicides Per 100,000
by V-Dem Level

12
When we run the linear regressions below, however, the results are more mixed. Models running
on data from V-Dem and Freedom House support the Civilization Hypothesis, while Polity
appears to support the Null Hypothesis.
Liberal Democracy Level by Polity

13
Linear Regressions
Liberal Democracy Level by V-Dem
-
Average Annual Homicides Per 100,000
by V-Dem Level
Liberal Democracy Level by Freedom House

14
4 Conclusion
Broadly speaking, our results suggest that homicide rates are lower in strong autocracies and
full-fledged democracies, and higher in weak autocracies and weak democracies. Additionally,
our analysis finds that homicide rates may fluctuate more from year to year in hybrid regimes.
We also find that weak democracies and weak autocracies have roughly equal levels of violence.
To strengthen our confidence in these tentative insights further, more research needs to be done
to control for confounding variables and preclude endogeneity.
Liberal Democracy Level by Polity

15
5 Supplement
5.1 Countries, V-Dem Levels, and Average Homicide Rates
The following table orders countries by their V-Dem level and then by their average homicide
rate.
Country V-Dem
Level
Average Homicide
Rate
Country V-Dem Level Average
Homicide Rate
Switzerland 9 0.83 Peru 5 8.05
Costa Rica 8 8.67 India 5 3.63
Lithuania 8 8.05 Serbia 5 1.75
Estonia 8 6.87 El Salvador 4 53.32
Uruguay 8 6.52 Colombia 4 42.45
United States 8 5.31
Dominican
Republic 4 21.21
Chile 8 3.42 Paraguay 4 15.83
Finland 8 2.26 Ecuador 4 14.91
Belgium 8 2.10 Mexico 4 13.55
Canada 8 1.63 Philippines 4 7.97
France 8 1.50 Moldova 4 6.75
United
Kingdom 8 1.39 Romania 4 2.13
Poland 8 1.39 Macedonia 4 2.09
Australia 8 1.37 Honduras 3 65.39
Portugal 8 1.25 Guatemala 3 35.84
New Zealand 8 1.17 Guyana 3 17.96
Ireland 8 1.11 Nicaragua 3 12.31
Czech
Republic 8 1.05
Papua New
Guinea 3 8.95
Spain 8 1.05 Thailand 3 6.39
Netherlands 8 1.00 Sri Lanka 3 6.19
Denmark 8 0.88 Georgia 3 6.00
Norway 8 0.86 Kenya 3 4.99
Sweden 8 0.79 Malawi 3 4.08
Austria 8 0.73 Nepal 3 3.18
Japan 8 0.43 Venezuela 2 44.49
Latvia 7 5.97 Uganda 2 9.68
Hungary 7 1.73 Kyrgyzstan 2 8.18
Greece 7 1.09 Pakistan 2 6.94
Italy 7 1.03 Bangladesh 2 2.67
Slovenia 7 0.99 Morocco 2 1.49
Germany 7 0.82 Kazakhstan 1 11.49
Panama 6 14.64 Yemen 1 4.60
Mongolia 6 10.33 Cambodia 1 3.05
Israel 6 2.45 Algeria 1 1.08
Bulgaria 6 2.23 Belarus 0 6.73
Ghana 6 1.92 Cuba 0 5.26
Slovakia 6 1.91 Syria 0 2.36
Croatia 6 1.46 Azerbaijan 0 2.28
Cyprus 6 1.20 Burma_Myanmar 0 1.83
Jamaica 5 46.59 China 0 1.35

16
5.2 Democracy Level and Quartile Sample Sizes
The following tables describe how many countries are in each democracy level and each quartile
across the three democracy databases. As is immediately evident, many of the democracy levels
and quartiles have very different numbers of countries included in them, with a heavy bias
toward higher democracy levels. Some of the Polity levels have no countries in them altogether,
which explains the absence of those levels in the Polity graphs throughout the report.
These asymmetries are a source of potential bias because they leave open the possibility that a
selection effect is distorting our results. For example, perhaps the least developed, least
democratic countries, which are notably absent from the U.N. Office on Drugs and Crime
(UNODC) data that we rely upon, happen to have lower homicide rates than the handful of Latin
American autocracies (e.g., Honduras, Guatemala, Nicaragua) included in our sample. Given the
modest size of our autocracy groups, the small number of Latin American non-democracies in
our sample could skew the homicide statistics upward for all autocracies.17 Admittedly, this
could bias our results in favor of democracies.
Democracy Level Sample Sizes
17 However, at the key points in our analysis, we excluded Latin American countries and repeated the calculations in
order to account for this potential bias. This process always produced the same general result, suggesting that this
bias does not invalidate our results.
South Africa 5 37.59 Vietnam 0 1.336364
Trinidad and
Tobago 5 25.83
V-Dem Level No. of
Countries
Level 0 7
Level 1 4
Level 2 6
Level 3 11
Level 4 10
Level 5 6
Level 6 8
Level 7 6
Level 8 24
Level 9 1
Freedom House Level No. of
Countries
Level 1 6
Level 2 7
Level 3 4
Level 4 14
Level 5 12
Level 6 25
Level 7 15
Polity Level No. of Countries Polity Level No. of Countries
Level -10 0 Level 2 4
Level -8 6 Level 4 5
Level -6 3 Level 6 9
Level -4 0 Level 8 24
Level -2 2 Level 10 27
Level 0 3

17
Democracy Quartile Sample Sizes
V-Dem Quartile No. of
Countries
Strong Autocracy 14
Weak Autocracy 14
Weak Democracy 27
Strong Democracy 28
5.3 Weak Democracy vs. Weak Autocracy
The following bar graphs demonstrate that whether “weak democracies” have higher average
homicide rates than “weak autocracies” depends heavily on how one distinguishes between the
two groups. The first bar graph below shows what happens to this trend if you change the cutoff
point in the V-Dem model from an average score of .4 to an average score of .5. The second bar
graph below shows what happens in the Freedom House model if you change the cutoff from an
average score of 4 to an average score of 5.18 Since the cutoff point between democracies and
autocracies in the Polity model is fixed at 6 by the academic literature, we never had any qualms
making that our cutoff as well.
After these adjustments, both the V-Dem graph and the Freedom House graph show weak
autocracies as substantially more violent than before. Conversely, both graphs also show weak
democracies as substantially less violent than before. This tells us that many of the most violent
countries—almost certainly Latin American—fall between an average score of .4 and a .5 in the
V-Dem Index and between an average score of 4 and a 5 in the Freedom House index.
18 The average scores of .5 and 5 are where we initially drew the lines before deciding that they were too exclusive.
Freedom House
Democracy Quartile
No. of
Countries
Strong Autocracy 10
Weak Autocracy 7
Weak Democracy 33
Strong Democracy 33
Polity Democracy
Quartile
No. of
Countries
Strong Autocracy 12
Weak Autocracy 11
Weak Democracy 30
Strong Democracy 30

18
Average Annual Homicides Per 100,000
by V-Dem Quartile
19
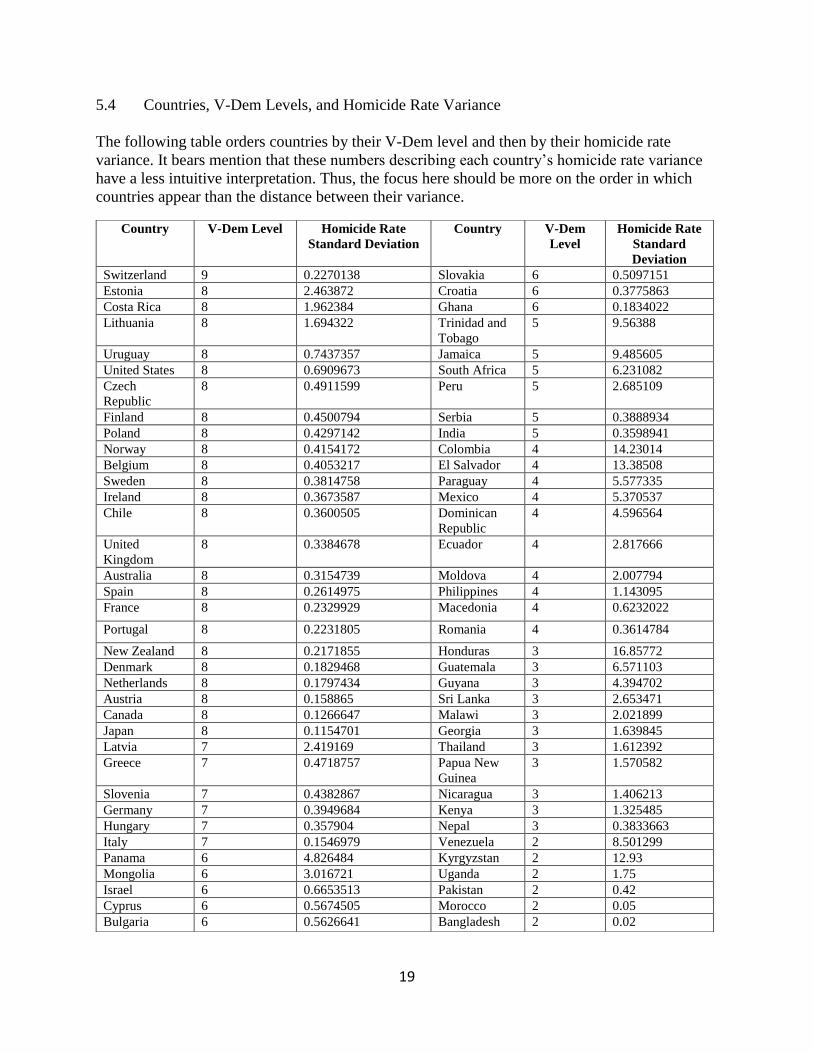
5.4 Countries, V-Dem Levels, and Homicide Rate Variance
The following table orders countries by their V-Dem level and then by their homicide rate
variance. It bears mention that these numbers describing each country’s homicide rate variance
have a less intuitive interpretation. Thus, the focus here should be more on the order in which
countries appear than the distance between their variance.
Country V-Dem Level Homicide Rate
Standard Deviation
Country V-Dem
Level
Homicide Rate
Standard
Deviation
Switzerland 9 0.2270138 Slovakia 6 0.5097151
Estonia 8 2.463872 Croatia 6 0.3775863
Costa Rica 8 1.962384 Ghana 6 0.1834022
Lithuania 8 1.694322 Trinidad and
Tobago
5 9.56388
Uruguay 8 0.7437357 Jamaica 5 9.485605
United States 8 0.6909673 South Africa 5 6.231082
Czech
Republic
8 0.4911599 Peru 5 2.685109
Finland 8 0.4500794 Serbia 5 0.3888934
Poland 8 0.4297142 India 5 0.3598941
Norway 8 0.4154172 Colombia 4 14.23014
Belgium 8 0.4053217 El Salvador 4 13.38508
Sweden 8 0.3814758 Paraguay 4 5.577335
Ireland 8 0.3673587 Mexico 4 5.370537
Chile 8 0.3600505 Dominican
Republic
4 4.596564
United
Kingdom
8 0.3384678 Ecuador 4 2.817666
Australia 8 0.3154739 Moldova 4 2.007794
Spain 8 0.2614975 Philippines 4 1.143095
France 8 0.2329929 Macedonia 4 0.6232022
Portugal 8 0.2231805 Romania 4 0.3614784
New Zealand 8 0.2171855 Honduras 3 16.85772
Denmark 8 0.1829468 Guatemala 3 6.571103
Netherlands 8 0.1797434 Guyana 3 4.394702
Austria 8 0.158865 Sri Lanka 3 2.653471
Canada 8 0.1266647 Malawi 3 2.021899
Japan 8 0.1154701 Georgia 3 1.639845
Latvia 7 2.419169 Thailand 3 1.612392
Greece 7 0.4718757 Papua New
Guinea
3 1.570582
Slovenia 7 0.4382867 Nicaragua 3 1.406213
Germany 7 0.3949684 Kenya 3 1.325485
Hungary 7 0.357904 Nepal 3 0.3833663
Italy 7 0.1546979 Venezuela 2 8.501299
Panama 6 4.826484 Kyrgyzstan 2 12.93
Mongolia 6 3.016721 Uganda 2 1.75
Israel 6 0.6653513 Pakistan 2 0.42
Cyprus 6 0.5674505 Morocco 2 0.05
Bulgaria 6 0.5626641 Bangladesh 2 0.02

20
Country V-Dem Level Homicide Rate
Standard Deviation
Country V-Dem
Level
Homicide Rate
Standard
Deviation
Kazakhstan 1 2.303998 China 0 0.4321195
Yemen 1 1.124924 Burma_Myanmar 0 0.3278719
Cambodia 1 0.678769 Azerbaijan 0 0.2939874
Algeria 1 0.41524 Syria 0 0.1629277
Belarus 0 2.534805 Vietnam 0 0.1026911
Cuba 0 0.5679309