democracy and trade: an empirical study - jamus lim · democracy and trade: an empirical study...
TRANSCRIPT

Democracy and Trade: An Empirical Study
Jessica Henson Decker & Jamus Jerome Lim ∗
October 11, 2007
Abstract
The theoretical discussion on globalization has suggested that there arelinkages between democracy and trade, although the direction of influ-ence is less certain. Formal empirical studies remain scarce, and haveoften focused on the question of whether democratic regimes influencetrade policy, as opposed to the actual relationship between democracyand trade. This paper seeks to answer the question, “Do democraciestrade more?” by applying the gravity equation to a large dataset of bi-lateral trade data for the period 1948-1999, while taking into account therole of democracy. It finds that democracy has a positive effect on tradeflows, but only after controlling for trade pair heterogeneity. In addition,it makes the case for studies of this nature to draw a distinction betweentrade flows in the pre- and post-1990s period of rapid democratization aswell as between developed and developing countries.
Keywords: Democracy, trade, gravity modelJEL Classification: F13, P51
∗Centre College. Emails: [email protected] and [email protected] (corre-sponding author). We thank Eileen Brooks, Solange Gouvea, Kay Pommerenke, and twoanonymous referees for very helpful tips and suggestions; naturally, we absolve them from anyerrors and omissions. We have benefited from financial support from Faculty DevelopmentCommittee, Centre College (Decker) and the Graduate Division, University of California,Santa Cruz (Lim).

The crossroads oif trade are the meeting place of ideas, the attri-tion ground of rival customs and beliefs; diversities beget conflict,comparison, thought; superstitions cancel one anogther, and reasonbegins.
The Life of Greece (Will Durant)
1 Introduction
The ongoing debate on globalization has often centered around one of its pur-ported benefits: that it fosters a greater degree of involvement by individualcitizens in the political process. In other words, it is a question of how glob-alization promotes democracy. Insofar as international trade is a significantindicator of the phenomenon of globalization, this suggests that there shouldexist a relationship between the extent to which a country trades and its level ofdemocratic participation. Indeed, declarations of such linkages are widely pro-claimed. On one hand, Bonanno (1997, p. 2) states that “[s]trengthening theworld’s trading system is one of the major keys to fostering democracy aroundthe world”; on the other, Engler (2003, p. 1) argues that “[free trade] willerode key democratic norms such as workers’ rights and the ability to legislateenvironmental protections.”
Yet despite the maelstrom generated in the popular press on this topic,academic research on the links between democracy and trade remains somewhatlimited. While the empirical literature on the effects of both democracy oneconomic growth as well as trade on economic growth is large and flourishing,1
relative little has been done in studying how democracy affects trade, or viceversa.
This is not for lack of a theoretical basis, however. The literature on en-dogenous tariff formation (Mayer 1984) predicts that trade policy formulatedunder the environment of direct democracy follows the preferences of the medianvoter; while extending this to a representative democracy yields an equilibriumtariff that is a weighted mean of voters’ individually optimal tariffs (Yang 1995).In either case, research anticipates that politically-influenced governments will,as democracy advances, increasingly respond to the desired tariff rates of theelectorate. Consider, in a Heckscher-Ohlin world, a relatively labor (capital)abundant country for which the initial selectorate consists of a large fractionof capital (labor) owners. Suppose that this body is then gradually erodedas democratization expands the proportional weight of the relatively abundantnon-capital (non-labor) owning class. Vote-maximizing governments will findthat high tariff rates—even when fully redistributed back to voters—no longercompensate the income loss due to protection. The result is an increasing biastoward a trade policy that maximizes electorate welfare, and hence one thatmaximizes the gains from trade. In this case, democracy unambiguously spurstrade.
1See Tavares & Wacziarg (2001) and Frankel & Romer (1999) for recent examples of each.
2

More recent work on the political economy of protection (Grossman & Help-man 1994) tells a somewhat different story. If rational policymakers maximizea weighted sum of campaign contributions and general welfare, the equilibriumtariff depends on the relative weights placed on each in the government’s ob-jective function. To the extent that special interest groups are more active in ademocracy (Olson 1982), they might constitute a greater weight, and thereforea greater level of democracy would lead to higher trade barriers. Conversely,political competition generated in an active democracy might imply that pol-icymakers weight more heavily general versus special interest welfare. Thesemodels are silent as to which influence might dominate; however, empirical worktesting the protection for sale model has yielded results that are supportive of apositive linkage between democracy and trade (Mitra, Thomakos & Ulubasoglu2002).
Nonetheless, the discussion above overlooks the actual relationship betweendemocracy and trade flows. Needless to say, trade policy need not translatedirectly to actual trade volumes, since the former is primarily a government-induced policy decision while the latter, a private one. While one would expecta high correlation between trade policy and actual trade outcomes, it is nonethe-less interesting to examine the actual real value of trade between states, and tosee if democracy plays a role there.2
This paper seeks to answer the basic question, “Do democracies trade more?”This research direction allows us to abstract from the interesting, but morecomplex, endogeneity and causality issues that arise when attempting to studythe effects of democracy on trade. Instead, the analysis allows for an accountingof whether the debates surrounding free trade and democracy are even justified,and if so, whether these arguments have taken into account empirical realitiespertaining to the issue. As a result, the paper will also be able to inform theexisting policy debate.
The few empirical papers that have studied this direct effect include the workof Dixon & Moon (1993), who analyze the effect of joint democracy on U.S.exports; Morrow, Siverson & Tabares (1998), who, using data for major powersover 1907–1990, test three competing arguments of the effects of internationalpolitics on trade flows, one of which is a joint democracy hypothesis; Mansfield,Milner & Rosendorff (2000), who analyze the effects of alternative democraticregime characteristics on trade flows for members of the interstate system (asclassified by Singer & Small (1994)) for five-year periods between 1960 to 1990;and Bliss & Russett (1998), who assess trade in a yearly fashion for 1962 through1989, using bilateral dyads for the world’s top 14 exporters, each with differingdegrees of democratic political institutionalism. All find that democracy has a
2Some recent papers that have examined the indirect channel of democracy on trade policyare Adsera & Boix (2002), who study the effects of democracy on both trade policy as wellas the size of the public sector; Mansfield, Milner & Rosendorff (2002), who present a modelthat relates PTA formation with democracy; Polachek (1997), who considers the mitigatingeffect of democracies on conflict via trade, and the papers by Eichengreen & Leblang (2006),Milner & Kubota (2005), and O’Rourke & Taylor (2006), all of which directly test the linkagesbetween democracy and trade policy via measures such as trade openness or the level of tariffprotection.
3

positive effect on trade.This research paper contributes to the existing literature on trade policy in
three ways. First, it utilizes a very large set of trade data that is not restrictedto U.S. trade with other countries, but bilateral trade between these countriesas well. Second, the dataset employed is also very long: Observations begin in1948 and conclude with data up to (and including) the year 1999. In addition, itconsiders both binary as well as quantitative measures of democracy, as adaptedfrom the Polity IV dataset (Marshall & Jaggers 2003). Third, it exploits panelregression techniques to estimate the full regression, and hence provide a richeranalysis that also takes into account country heterogeneity.
The remainder of this paper is organized as follows. Section 2 describesthe econometric model used for the present study, as well as the dataset. Thissection is followed by estimation results (Section 3) and a range of extensions androbustness checks (Section 4). A final section concludes and provides suggestionsfor future research.
2 Econometric Model and Data Description
The workhorse econometric model used for this paper is the gravity model. Thegravity model is a natural candidate for examining trade flows and how thesemight be affected by democracy. The basic prediction of the gravity model—that trade between two nations varies proportionally to the (economic) size ofthese countries and inversely to their distance—is one of the most enduringrelationships in empirical economics. As a result, it has been used to explorea range of phenomena. These include the extent to which national bordersmatter in trade (McCallum 1995), the effects of a common currency on trade(Rose 2000), the role of international institutions in promoting trade flows (Rose2005), the differences between competing theories of international trade (Feen-stra, Markusen & Rose 2001), and the patterns of sovereign debt and lending(Rose & Spiegel 2004). In this respect, the present paper does not depart toofar from the existing empirical literature on the determinants of trade flows.
The benchmark gravity model used was of the following form:
ln (Tijt) = α+ β1 ln (YiYj)t + β2 ln(Yi
Ni· Yj
Nj
)t
+ β3 lnDij
+ DEMOCijtθ + ln Xijδ + ln Yijtγ + εijt,
(1)
where Tijt denotes the mean real value of bilateral trade between state i andstate j at time t, Yi is real GDP of state i, Ni is its population size (andhence Yi
Niis a measure of state i real GDP per capita), Dij is the great circle
distance between i and j, and Xij and Y ijt are vectors of time invariant andtime dependent controls that influence bilateral trade, respectively.3 The error
3The controls employed in this study include: Time variant binary dummy variables for freetrade agreements, currency union, and current colony status; time invariant binary dummiesfor contiguity, common language, landlocked countries, island nations, land masses, common
4

terms εijt are assumed to be distributed i.i.d. N(0, σ2
ε
), and the key variable
of interest, DEMOCijt, is variously taken to be:
DEMOCijt =
ONEDEMOCijt +BOTHDEMOCijt
ln (DEMi ·DEMj)t
, (2)
where ONEDEMOCijt (BOTHDEMOCijt) is an indicator variable that takeon unity when one country (both countries) of the two-country pair i and j isa democracy at time t, and zero otherwise, and DEMi is a continuous variablefor the level of democracy prevailing in country i, and DEM ∈ [0, 10]. Notethat since the data are for country pair observations, we restrict the coefficientsof either permutation (i’s trade with j or j’s trade with i) to be equivalent.
The trade data are drawn from the International Monetary Fund Directionof Trade statistics. The data cover bilateral trade between 217 IMF countrycodes between 1948 and 1999.4 Controls were obtained from the World BankWorld Development Indicators, the CIA World Factbook, the World Trade Orga-nization Annual Reports, the Penn World Tables, and the IMF Annual Report ofExchange Rate Arrangement and Exchange Restrictions. Missing observations,where possible, were substituted with comparable equivalents from either thePenn World Tables, the IMF International Financial Statistics, or the States-man’s Yearbook. The democracy variable is adapted from the Polity IV dataset(Marshall & Jaggers 2003).
3 Data Estimation and Results
We begin with a statistical description of the data. We first consider the casewhere democracy is treated as a binary yes/no variable. The sample sizes forwhen both countries are democracies versus when both are not are roughly com-parable (44,912 to 45,984). The means for some key variables are summarizedin Table 1.
Interestingly, country pairs in which both countries are democratic display alarger mean value for the logarithm of real trade, as compared to country pairsin which both countries are non-democratic. However, due to the relativelylarge standard deviations, these are unlikely to be statistically distinct. Indeed,this result might entirely be driven by the relatively higher wealth levels indemocratic nations (compare the means of log GDP per capita in the two cases).
Further insight into this relationship can be seen by comparing cross correla-tions (Table 2). Evidently, the correlation between economic size and trade flowsis stronger for democratic trading pairs compared to nondemocratic pairs—more
colonial occupier, common colonial history, and common nation status; and a continuous time-variant variable for trade openness. The control variables as well as data sources are discussedin fuller detail in the appendix.
4Note that IMF country codes may not refer to the typical Westphalian sovereign state:Other than the usual suspects, these codes also include independent territories, colonies,overseas departments, and newly-independent states of former countries.
5

Table 1: Descriptive statistics†
Both democratic Both nondemocratic
Log real trade 11.724 9.257(3.24) (3.06)
Log real GDP 49.432 47.356(2.52) (2.21)
Log real GDP/capita 16.946 15.025(1.38) (1.42)
Log distance 8.208 7.920(0.88) (0.88)
N 44,912 45,984
†Notes: Standard errors are reported in parentheses.
than one and a half times stronger. However, these simple correlations masktime-series effects; after all, trade exploded worldwide after the second WorldWar.
For instance, consider the trading relationship between the United Statesand Canada, two countries with a long history of strong democratic rule, andsharing geographical proximity. Over the postwar period, the most distinctfeature concerning average trade flows between the pair is the clear rising trend:Average trade flows were $74.46 million in 1948 (in constant 1984 U.S. dollars),and this peaked at $1.1 billion in 1999 (Figure 1(a)).
Next, consider the trading relationship between the following two nondemo-cratic countries—China and Myanmar—similarly located in geographical prox-imity to each other. Average merchandise trade between the pair exhibit con-siderably more variation: Trade plunged following Mao’s Cultural Revolutionin 1967 (finding its nadir at $0.1 billion in 1969), before rising through most ofthe 1980s and 90s. By the end of the 1990s, trade had reached new highs ofmore than $2 million a year (Figure 1(b)).
We now move on to examine the descriptive statistics for the case wheredemocracy is treated as a continuous term. Simple scatter plots of the datareveal no distinct patterns. The graphs of the value of bilateral trade againstthe continuous democracy variable for the years 1965 and 1995 are shown inFigure 2 below. This preliminary analysis thus hints to the possibility that,contrary to the existing empirical literature, there seems to be no relationshipbetween democracy and trade.
This conclusion may be premature, however. In particular, the graphs onlydisplay a snapshot of patterns in the data. In order to yield more meaningfulconclusions, as well as exploit the richness of the panel dataset, we proceed tomore rigorous empirical analysis.
Table 3 presents the benchmark regressions for the pooled dataset underseveral alternative specifications. These are: (B1 ) The regression in (1) with
6

Tab
le2:
Cro
ssco
rrel
atio
nsof
key
vari
able
s†
Log
real
trad
eL
ogre
alG
DP
Log
real
GD
P/c
apit
aL
ogdi
stan
ce
Bot
hd
emocr
atic
Log
real
trad
e1.
000
Log
real
GD
P0.
767
1.00
0L
ogre
alG
DP
/cap
ita
0.54
80.
480
1.00
0L
ogdi
stan
ce-0
.355
-0.0
28-0
.144
1.00
0
Bot
hn
ond
emocr
atic
Log
real
trad
e1.
000
Log
real
GD
P0.
470
1.00
0L
ogre
alG
DP
/cap
ita
0.33
30.
413
1.00
0L
ogdi
stan
ce-0
.148
-0.3
63-0
.136
1.00
0
†N
ote
s:Sele
cte
dvari
able
sre
port
ed.
All
corr
ela
tions
were
signifi
cant
at
the
1%
level.
7

!"#
!
Figure 1: Trade flows between both democratic and both nondemocratic tradingpairs.
binary indicators for trade pairs in which both countries are democracies andfor trade pairs in which only one is a democracy, as summarized by the upperspecification in (2); (B2 ) The same regression as (B3 ), but with quadratic termsfor both log GDP and log GDP per capita; (B3 ) The regression in (1) with thecontinuous measure of democracy, as given in the lower specification of (2);(B4 ) The same regression as (B3 ), but with quadratic terms for both log GDPand log GDP per capita.
We first consider the regressions with the binary indicator variables fordemocracy (specifications (B1 ) and (B2 )). Interestingly, the OLS results sug-gest that, in either case when both countries are democracies or where onlyone is a democracy, there is less trade between these two countries. These co-efficients are significant for both specifications, and for specification (B1 ), thecoefficient for the one democracy dummy is significant at the 5 percent level.This result is in stark contrast to the results of previous studies, all of whichfind a positive relationship between democracy and trade, using much of thesame controls.
Moving on to the regressions with the continuous measure of democracy(specifications (B3 ) and (B4 )), the results are in line with the basic resultsof the first two specifications. That is, the greater the level of democracies innations that form a trading pair, the less these countries trade with each other;indeed, the results indicate that these nations trade between e−0.093 ≈ 0.91and e−0.082 ≈ 0.92 times, or about 8–9 percent, less. Note, however, that thecoefficient for specification (B4 ) is insignificant at the 10 percent level.
Why this apparent incongruity with earlier studies? This could be due totwo possible reasons. First, the larger dataset, which includes not just bilateraltrade between developed (often democratic) countries and developing (oftennon-democratic) countries, is able to provide a contrasting result that is notcaptured when employing a dataset that does not fully capture variable changesacross space as well as time. Second, and related to the first, the differencescould arise due to trade-pair heterogeneity that is not well captured by simpleOLS. In order to conclusively pin down the relationship between democracy and
8

05
1015
20Lo
g B
ilate
ral T
rade
in R
eal $
−5 0 5Log of democracy
Democracy and Bilateral Trade Flows, 1965
−10
010
20Lo
g B
ilate
ral T
rade
in R
eal $
−5 0 5Log of democracy
Democracy and Bilateral Trade Flows, 1995
Figure 2: Relationship between democracy and trade, 1965 and 1995.
9

Table 3: Benchmark regressions for bilateral trade flows†
(B1 ) (B2 ) (B3 ) (B4 )
Log real GDP 0.949 0.717 0.951 0.764(0.01)∗∗∗ (0.26)∗∗∗ (0.01)∗∗∗ (0.26)∗∗∗
Log real GDP 0.495 -0.468 0.476 -0.428per capita (0.02)∗∗∗ (0.28)∗ (0.02)∗∗∗ (0.27)Log distance -1.112 -1.081 -1.107 -1.080
(0.03)∗∗∗ (0.03)∗∗∗ (0.03)∗∗∗ (0.03)∗∗∗
Both democracies -0.183 -0.189(0.04)∗∗∗ (0.04)∗∗∗
One democracy -0.129 -0.080(0.06)∗∗ (0.07)
Log democracy -0.018 -0.014(0.01)∗∗ (0.01)
R2 0.708 0.708 0.708 0.707N 54654 54654 54654 54654
†Notes: Standard errors robust to country-pair clustering reported in parenthe-
ses. ∗ indicates significance at 10 percent level, ∗∗ indicates significance at 5
percent level, and ∗∗∗ indicates significance at 1 percent level. Only selected
controls are reported, although all variables discussed in the data appendix were
included.
10

trade, therefore, we turn to panel regression techniques that are able to distillout this heterogeneity.
Table 4 displays the mixed model estimates for:(P1 ) The binary democracyvariable as regressor using the fixed effects model;5 (P2 ) The random effectsmodel with a GLS estimator for the binary democracy variable; (P3 )–(P4 ) Thespecifications in (P1 ) and (P2 ), respectively, with GDP interacted with thedummy for one democracy as an additional control; (P5 )–(P6 ) The specifica-tions in (P1 ) and (P2 ), respectively, with GDP interacted with the dummy forboth democracies; (P7 )–(P8 ) The specification in (P1 ) with GDP per capitainteracted with the dummy for one democracy and both democracies, respec-tively.
Although both fixed as well as random effects models were estimated, Haus-man tests indicate that the fixed effects model is preferred (χ2 = 2009.2, p =0.000). However, since fixed effects necessitates the exclusion of the time-invariant distance variable—an important control in the gravity model—wereport both specifications for our results for (P1 )–(P6 ). To economize onspace, specifications (P7 ) and (P8 ) report only the estimates for the fixed ef-fects model, although there were no qualitative differences for the correspondingrandom effects estimates.
The results in Table 4 are more in line with that of earlier studies. Considerfirst specifications (P1 ) and (P2 ). The dummy for when both trading partnersare democracies is significant and positive, indicating the fact that democraciestend to trade more with one another. Although the dummy for one democracyis also positive, it is insignificant in both specifications. Likewise, the coefficientsfor the both democracies dummy is also positive and significant for specifications(P3 )–(P4 ) and (P7 )–(P8 ). Based on these results, country dyads that arecomprised of both democracies appear to trade more with each other. Thecoefficients range between [0.066, 0.946] times, or 6.8–146.2 percent, more.6
Hence, once we control for the heterogeneity of countries in this richerdataset, we obtain results that corroborate those of earlier studies in this vein;specifically, that democratic regimes tend to trade more with each other. Thischange in result underscores the importance of controlling for heterogeneityin trading pairs, and for not drawing premature conclusions from studies thatdo not control for country pair-specific idiosyncrasies. In addition, the cross-sectional-time-series nature of the panel dataset also allows us to pinpoint themain driver of this result: It is the increase in trade between democracies overtime, rather than across space, that is important.
This can be seen from the Hausman test results comparing (P1 ) and (P2 ).Since the (fixed effect) within estimator essentially exploits the time-series vari-ation in the data, our results imply that increases in trade are due to movestoward democratic regime change (over time), as opposed to the trading behav-
5Fixed effects are introduced for countries in a given trading pair.6The upper bound of this range should be interpreted very carefully, as it is due to spec-
ification (P8 ), which has a much larger magnitude than the others. Excluding this valuebrings the range to a more modest 6.8–14.9 percent, which is within reasonable bounds foralternative empirical models.
11

Tab
le4:
Mix
edm
odel
regr
essi
ons
for
bila
tera
ltr
ade
flow
san
dbi
nary
dem
ocra
cyva
riab
le†
(P1
)(P
2)
(P3
)(P
4)
(P5
)(P
6)
(P7
)(P
8)
Log
real
GD
P0.
326
0.69
40.
275
0.66
50.
320
0.68
60.
325
0.32
2(0
.03)∗∗∗
(0.0
1)∗∗∗
(0.0
6)∗∗∗
(0.0
3)∗∗∗
(0.0
6)∗∗∗
(0.0
2)∗∗∗
(0.0
6)∗∗∗
(0.0
6)∗∗∗
Log
real
GD
P0.
255
0.19
80.
246
0.19
90.
235
0.19
60.
243
0.28
1pe
rca
pita
(0.0
5)∗∗∗
(0.0
2)∗∗∗
(0.0
7)∗∗∗
(0.0
3)∗∗∗
(0.0
7)∗∗∗
(0.0
3)∗∗∗
(0.0
8)∗∗∗
(0.0
7)∗∗∗
Log
dist
ance
-1.2
55-1
.254
-1.2
57(0
.04)∗∗∗
(0.0
4)∗∗∗
(0.0
4)∗∗∗
Bot
hde
moc
raci
es0.
139
0.06
80.
134
0.06
6-2
.206
-1.2
200.
138
0.94
6(0
.02)∗∗∗
(0.0
2)∗∗∗
(0.0
3)∗∗∗
(0.0
3)∗∗
(0.6
5)∗∗∗
(0.5
9)∗∗
(0.0
3)∗∗∗
(0.4
5)∗∗∗
One
dem
ocra
cy0.
019
0.02
5-3
.162
-1.6
690.
024
0.03
0-0
.211
0.01
3(0
.03)
(0.0
3)(1
.02)∗∗∗
(0.8
7)∗
(0.0
5)(0
.04)
(0.6
0)(0
.05)
One
dem
ocra
cy0.
065
0.03
5×
GD
P(0
.02)∗∗∗
(0.0
2)∗∗
Bot
hde
moc
raci
es0.
047
0.02
6×
GD
P(0
.01)∗∗∗
(0.0
1)∗∗
One
dem
ocra
cy0.
015
×G
DP
per
capi
ta(0
.04)
Bot
hde
moc
raci
es-0
.049
×G
DP
per
capi
ta(0
.03)∗
R2
0.04
90.
049
0.04
90.
049
0.04
9χ
215
312
7.97
E+
068.
01E
+06
N54
654
5465
454
654
5465
454
654
5465
454
654
5465
4
†N
ote
s:H
ub
er-
Whit
e(r
obust
)clu
ster-
adju
sted
standard
err
ors
rep
ort
ed
inpare
nth
ese
s.∗
indic
ate
ssi
gnifi
cance
at
10
perc
ent
level,
∗∗
indic
ate
ssi
gnifi
cance
at
5p
erc
ent
level,
and
∗∗∗
indic
ate
ssi
gnifi
cance
at
1p
erc
ent
level.
Only
sele
cte
dcontr
ols
are
rep
ort
ed,
alt
hough
all
vari
able
sdis
cuss
ed
inth
edata
app
endix
were
inclu
ded.
12

ior of democracies versus non-democracies in any given snapshot in time. Webelieve that the difference in the magnitude of coefficients obtained from thefixed versus random effects models may also be attributed to this phenomenon.7
This result also corroborates our cross-correlation tabulations (Table 2), whileclarifying the otherwise indeterminate visual cues suggested by Figure 1.
The coefficients of the both democracies dummy for specifications (P5 ) and(P6 ), however, are negative and significant. What might explain the apparentincongruence of our results when we include the interaction terms? To under-stand the mechanism, it is helpful to rewrite (1) in the following form:
ln (Tijt) = α+ β1 ln (YiYj)t + β2 ln(Yi
Ni· Yj
Nj
)t
+ β3 lnDij + ln Y′ijtγ′
+[θ1 + θ2 × ln (YiYj)t
]BOTHDEMOCijt + ln Xijδ + εijt,
where we have parsed out the interaction terms from the vector Yijt. Thus, thetotal impact of a dual-democratic trading pair on trade flows is the coefficienton BOTHDEMOCijt alone as well as the coefficient of the interaction termBOTHDEMOCijt × ln (YiYj)t. Since the product of GDP is so large, thissecond term in the parentheses probably outweighs the first for all observationsin the data, such that the influence of the both democracies dummy remainspositive, as found in the other specifications. When understood in this fashion,the negative coefficients are no longer paradoxical, but rather point to the factthat any influence of democracy on trade is heavily moderated by country size.Intuitively, it is trade between the (economically) large, democratic countrypairs that are driving our results obtained in Table 4.8
Another estimate that deserves explanation is the negative and significantcoefficient for the interaction term between the both democracies dummy andGDP per capita in specification (P8 ). We likewise rewrite (1) in the form:
ln (Tijt) = α+ β1 ln (YiYj)t + β3 lnDij + ln Y′′ijtγ′′ + ln Xijδ
+ [β2 + β4 ×BOTHDEMOCijt] ln(Yi
Ni· Yj
Nj
)t
+ εijt.
The partial derivative of trade flows with respect to GDP per capita, which ispositive a priori, can be decomposed into the coefficient on ln (Yi/Ni · Yj/Nj)talone as well as the coefficient of the interaction term BOTHDEMOCijt ×ln (Yi/Ni · Yj/Nj)t. Since BOTHDEMOCijt is a binary variable, the sum ofthe coefficients is 0.281 − 0.049 = 0.232, which is positive. What the negativecoefficient on the interaction term implies, however, is that a given increase inGDP per capita in a both-democracy country pair reduces trade (relative to
7An alternative strategy to teasing out this relationship can be found by looking at theestimates for the between model (not reported). While most of the coefficients for the betweenmodel are qualitatively similar, the both democracies dummy switches signs (while remainingstatistically significant); this suggests that cross-sectional variation not only does not drivethe results, it actually works against the overall finding that democracies tend to trade more.
8A similar approach can be used to justify the negative coefficient for the coefficient of theone democracy dummy in specifications (P3 ) and (P4 ).
13

nondemocratic country pairs). This suggests that democratic countries that arerelatively wealthier—but are not economically large—do not necessarily engagein more trade with other democracies. This makes intuitive sense: Small coun-tries tend to have a narrower production base and be more dependent on tradein general, and so are less likely to allow political-economic pressures associatedwith democracy to unduly influence trade outcomes.
Finally, the other controls that were included in the specifications were gen-erally consistent with expected signs (although not reported). For example,participation in a regional agreement was positive and significant across allspecifications, while policy variables such as tariff barriers and current colonialstatus demonstrated a negative and significant impact. The other controls weregenerally insignificant, although they often appear with the expected signs.
Table 5 displays the analogous mixed model estimates using the continuousdemocracy measure. These are for: (Q1 ) Fixed effects; (Q2 ) Random effects;and fixed and random effects estimates after the inclusion of interaction termswith GDP ((Q3 ) and (Q4 ), respectively) and GDP per capita ((Q5 ) and (Q6 ),respectively).
The results are not unlike the case of the binary democracy measure. Sta-tistically significant (positive) values of the coefficient range [0.017, 0.226], or1.7–22.6 percent. Democracies are therefore likely to trade with other democ-racies: up to almost a quarter times more.
The negative and significant coefficient for specifications (Q3 ) and (Q4 ) maybe justified, analogous to the case above, by recognizing that the partial deriva-tive of trade flows with respect to democracy is comprised of the coefficients forln (DEMi ·DEMj)t and the interaction term ln (DEMi ·DEMj)t × ln (YiYj)t,and that the magnitude of the product of GDP sufficiently large such that theinfluence of the democracy variable remains positive. As before, democracy’sinfluence on trade is moderated by economic size.9
We note that not all estimates of the coefficient of the democracy vari-able are statistically significant. In particular, the random effects models inspecifications (Q2 ) and (Q5 ) do not produce significant coefficients (actual p-values are 0.127 and 0.468, respectively). However, as before, Hausman testsof the two models rejects the random effects model (χ2 = 2008.7, p = 0.000and χ2 = 1907.4, p = 0.000, respectively). This suggests again that the time-series variation in democratic development—as embodied by the fixed effectsmodel—is responsible for the patterns that we observe in our results; the differ-ences in the magnitude of coefficients for fixed versus random effects can alsobe understood in this light.
4 Extensions and Robustness
This section expands on the basic model by considering a series of robustnesschecks and extensions to our basic empirical model.
9The explanation forwarded before for the negative coefficient on the democracy-GDP percapita interaction term also applies for the result in specification (Q6 ).
14

Tab
le5:
Mix
edm
odel
regr
essi
ons
for
bila
tera
ltra
deflo
ws
and
cont
inuo
usde
moc
racy
vari
able†
(Q1
)(Q
2)
(Q3
)(Q
4)
(Q5
)(Q
6)
Log
real
GD
P0.
316
0.69
50.
310
0.68
90.
315
0.69
5(0
.03)∗∗∗
(0.0
2)∗∗∗
(0.0
6)∗∗∗
(0.0
2)∗∗∗
(0.0
6)∗∗∗
(0.0
2)∗∗∗
Log
real
GD
P0.
272
0.20
10.
233
0.19
70.
275
0.22
3pe
rca
pita
(0.0
5)∗∗∗
(0.0
2)∗∗∗
(0.0
7)∗∗∗
(0.0
3)∗∗∗
(0.0
7)∗∗∗
(0.0
3)∗∗∗
Log
dist
ance
-1.2
58-1
.255
-1.2
77(0
.04)∗∗∗
(0.0
4)∗∗∗
(0.0
4)∗∗∗
Log
dem
ocra
cy0.
017
0.00
5-0
.683
-0.2
440.
033
0.22
7(0
.00)∗∗∗
(0.0
0)(0
.14)∗∗∗
(0.1
2)∗∗∗
(0.0
8)(0
.07)∗∗∗
Log
dem
ocra
cy0.
014
0.00
5×
GD
P(0
.00)∗∗∗
(0.0
0)∗∗
Log
dem
ocra
cy-0
.001
-0.0
14×
GD
Ppe
rca
pita
(0.0
0)(0
.00)∗∗∗
R2
0.04
80.
050
0.04
8χ
215
134
8.08
E+
068.
07E
+06
N54
654
5465
454
654
5465
454
654
5465
4
†N
ote
s:H
ub
er-
Whit
e(r
obust
)clu
ster-
adju
sted
standard
err
ors
rep
ort
ed
inpare
nth
ese
s.∗
indic
ate
ssi
gnifi
cance
at
10
perc
ent
level,∗∗
indic
ate
ssi
gnifi
cance
at
5p
erc
ent
level,
and∗∗∗
indic
ate
ssi
gnifi
cance
at
1p
erc
ent
level.
Only
sele
cte
dcontr
ols
are
rep
ort
ed,
alt
hough
all
vari
able
sdis
cuss
ed
inth
edata
app
endix
were
inclu
ded.
15
First, we take a sub-sample of data selected from the time period of 1965to 1995. Specifically, we take observations from five-year periods, beginningwith 1965, to capture changes in levels of democracy. Since levels of democracytypically do not change significantly in a given country in short periods of time,this approach drops potentially repetitive observations. Second, taking as giventhe Huntington (1991) hypothesis of the “third wave” of democratization in thelate twentieth century, we partition the dataset into pre-1990 and post-1990observations, when the wave petered out.
Third, keeping in mind the results from specifications (P5 ) and (P6 ) thatstress the importance of economic size in moderating the amount of trade be-tween democracies, we consider a subset of the data in which bilateral tradeoccurs within two subgroups: developed countries and developing countries.10
These subgroups allow us to uncover whether it is the observations from devel-oped countries that drive the results of the basic model. Fourth, we consider analternative measure of trade barriers—trade openness—as a control, in order toensure that democracy is not simply acting as a proxy for trade policy.11
Fifth, we introduce a stricter definition of democracy for the binary variable,such that only democracies that are relatively mature qualify for such a classi-fication.12 This more specific variable helps distinguish between the impact ofmature democracies versus democracies in general, and helps determine if themature democracies subgroup is biasing the results of the basic model. Sixth,we indirectly address the endogeneity problem by testing for the possibility ofmisspecification. To this effect, we run additional panel regressions that con-trol for potential omitted variables that may be correlated with indicators ofdemocracy.13
Seventh, we attempt to directly address the endogeneity problem in twoways: By performing some simple Granger causality tests on a selection of thedata, in order to tease out Granger causality; and by running a regression withdemocracy as a LHS variable, we seek to establish if trade flows are a significantdeterminant of democracy. Last, we decompose the democracy variable into 21separate dummy variables in order to distill the extent to which the process ofdemocratic development influences bilateral trade.
10The classification of developed countries follows the definition used by the IMF for indus-trialized countries.
11For example, the democracy variable may be capturing the responsiveness of the politicalsystem to special interest lobbying for trade restrictions, rather than the political-economicimpact of the presence of democracy per se.
12For example, in the earlier binary democracy classification, any country with competitiveelections for both the executive branch and the legislature qualifies as a democracy, while thisstricter definition requires that the chief executive(s) must face some moderate to substantialconstraints imposed by accountability groups or institutions.
13A full discussion of policy and stability controls is relegated to the appendix.
16

Table 6: Robustness checks for bilateral trade flows and democracy†
Binary democracy Continuous democracy
Fixed effects Random effects Fixed effects Random effects
Full sample 0.139∗∗∗ 0.068∗∗∗ 0.017∗∗∗ 0.005(0.02) (0.02) (0.00) (0.00)
Selected years 0.086 -0.092 0.015 -0.033(0.05)∗ (0.05)∗∗ (0.01) (0.01)∗∗∗
Pre-1990 -0.030 -0.066 0.003 -0.000(0.03) (0.04)∗ (0.01) (0.01)
Post-1990 0.038 0.212 -0.087 0.070(0.04) (0.05)∗∗∗ (0.02)∗∗∗ (0.01)∗∗∗
Developed only 0.443 0.433 0.284 0.278(0.10)∗∗∗ (0.11)∗∗∗ (0.05)∗∗∗ (0.06)∗∗∗
Developing only 0.189 0.089 0.010 -0.010(0.06)∗∗∗ (0.05)∗ (0.01) (0.01)
Alternative 0.085 0.040 0.026 0.020openness (0.02)∗∗∗ (0.02)∗ (0.00)∗∗∗ (0.00)∗∗∗
Strict 0.116 0.084democracy (0.03)∗∗∗ (0.03)∗∗∗
Policy and 0.808 0.710 0.035 0.008stability controls (0.22)∗∗∗ (0.26)∗∗ (0.07) (0.06)
†Notes: Huber-White (robust) cluster-adjusted standard errors reported in parentheses. ∗ indicates sig-
nificance at 10 percent level, ∗∗ indicates significance at 5 percent level, and ∗∗∗ indicates significance at
1 percent level. Only selected controls are reported, although all variables discussed in the data appendix
were included.
Table 6 reports the various perturbations made to the basic model. Bothfixed and random effects estimates are reported, but for brevity, only the coeffi-cients for the joint democracy dummy and the log of the continuous democracyvariable are shown.
When interpreted as a group, these robustness checks suggest that measuresof democracy are sensitive to the changes in specifications previously outlined.While most of the coefficients remain significant, and often at the 1 percent level,some of the coefficients for democracy actually switch signs. In particular, thesensitivity of democracy to alternative time periods underscores the finding inSection 3 that the time element is important. As such, these results provideinsight not just into the linkages between democracy and trade flows per se, butalso how democratic development factors into the trade picture. Nonetheless,the overall tenor of these results is that, at least in recent history, nations withdeveloped democratic political institutions are likely to be more engaged in tradewith one another than are countries without such institutions. The robustnesschecks thus suggest that the answer to the main inquiry of this study—whether
17
democracies trade more—is largely affirmative.The first robustness check yields coefficients with mixed signs. In particular,
the fixed effects models maintain a positive coefficient, while the random effectsmodels yield negative and statistically significant coefficients. What might ex-plain this result? Recall, a key factor driving our results in Section 3 is the time-series nature of the data. Taking selected five-year cuts of the data smooths outmuch of the dynamics of democratic evolution that is essential in understand-ing how pairwise democracies tend to trade. Since the random effects model isessentially a matrix-weighted average of the within and between estimates, thissubset censors the data in a way that allows the cross-sectional features—whichtend to show that democratic pairs tend to trade less, not more—to dominatethe time-series aspects. These aspects, nonetheless, remain present in the data:Notice the positive signs when we employ fixed effects.
Another way of looking at the time series effects is to consider the sample be-fore and after the third wave of democratization (Huntington 1991) ended, whichis what we seek to perform with our second robustness check. The coefficientsfor most of the pre-1990 specifications—including the one that is statisticallysignificant—is negative, while coefficients for post-1990 estimates tend to bepositive. As such, the partitioning into a pre- and post-democratization timeframe suggests a movement over time toward both a significant as well as posi-tive influence of democracy on trade. The anomalous result for the coefficient onthe fixed effects estimate post-1990 may be due to the increasing participationof China (a strong nondemocracy) in world trade; this can also be seen fromthe density of points on the leftmost part of Figure 2(b).
In spite of China’s significant presence in world trade, it is trade betweenlarge, democratic countries that accounts for finding that democracies tend dotrade more. The third robustness test yields positive and highly significantcoefficients for the subsample of developed countries. In addition, the estimatedcoefficients are economically significant: Trade between a pair of developeddemocracies is on average about 43.2 percent more. However, the finding thatdemocratic pairs tend to trade more is not limited to developed economies;even among less developed countries, democratic pairs trade an average of 14.9percent more (restricting ourselves to statistically significant results).
In some ways, these results are unsurprising. In light of the well-knowntheoretical argument that trade between democratic partners is based on tiesof interest, community and security (Bliss & Russett 1998), democratic nationsare far more likely to see confluence in their trade patterns based on thesemutual commonalities. Conversely, such ties of commonality are less likely tobe pervasive among developing nations, since trade in these nations is oftendriven by purely economic considerations. This explanation justifies the smallerand less significant coefficients for democracy in the purely developing countrysubset. This check also underscores another aspect that we have discussedbefore—that the ability of economically large, developed countries to be selectivewith respect to their trading partners is considerably more greater than thecorresponding trade decisions of developing countries.
The results from the fourth robustness test demonstrate that it is unlikely
18

that democracy is acting as a proxy for trade policy in general. The coefficientfor trade openness is positive and significant at 1 percent level (not reported),while both measures of democracy are positive and significant. Although notreported, the one democracy dummy is also positive and significant at 1 percentlevel. This implies that democracy exerts a first-order effect on trade, one that,while possibly influencing trade via the commercial policy channel, also capturessome political-economic dynamic that is inherent in the nature of democraticpolicymaking. This could well be in the form of foreign policy; after all, the em-ployment of trade sanctions is a relatively common strategy for meeting foreignpolicy objectives determined by the state apparatus.
The fifth check, which uses a stricter definition of democracy, suggests thatour somewhat arbitrary definition of what constitutes a democratic country isnot critical. This test suggests that it is not only the large, democratic coun-tries that drive our results; these large countries also have a strong democratictradition, as captured by a stricter definition of democracy. Hence, while thethird wave may have created a large number of newly democratic states thatare engaged in more trade over time, the ones that have been democratic forthe longest time (or the ones that embrace democracy most strongly) are theones that are also engaged in the most trade.
Similarly, it appears that even after controlling for the political-economicenvironment via the inclusion of controls for policy quality and political stabil-ity (robustness test six), trade flows are still higher for democracies (althoughthis result is not statistically robust for the continuous democracy measure).Two points should be noted, however. First, these controls are proxied by im-perfect measures—policy quality by a corruption index and political stabilityby a government crisis dummy—and so the weaker significance of some coef-ficients do not necessarily negate the earlier results. Second, it is difficult toestablish ex ante how policy quality and political stability might be influencedby democratic outcomes. After all, notoriously non-democratic nations such asIndonesia, Peru, Singapore, and the United Arab Emirates have enjoyed longperiods of stability and growth, while others such as Argentina, Iraq, Myanmar,and Zimbabwe have not had such fortune. Likewise, the policy choices of theruling elite in non-democratic countries are often idiosyncratic, so that a singu-lar directionality may be difficult to isolate. In spite of these shortcomings, thecontrols included in this check seem to reinforce the linkages between democracyand trade flows.
Overall, while it is possible to construe additional controls to include in themodel, the resulting signs of the coefficients and levels of significance of the datasuggest that the linkage between trade and democracy is sound, even when basicperturbations to the econometric specification is made.
The seventh check for robustness concerns direct tests for the endogeneity ofthe democracy variable. First, we consider Granger causality tests on data forbilateral trade between two democracies (the U.S. and the U.K.), one democracyand non-democracy (the U.S. and Singapore) and two non-democracies (China
19

and Singapore). The estimation was of the form[DEMt
Tt
]=[η0
φ0
]+[η11 η11
φ11 φ12
] [DEMt−1
Tt−1
]+[η21 η21
φ21 φ22
] [DEMt−2
Tt−2
]+[Z1t
Z2t
]+[υ1t
υ2t
],
(3)
where Zit is a vector of exogenous variables populated by controls for openness,output, wealth, and distance, and υit are i.i.d. error terms.
The first subsample was for the years 1948 to 1999, and the second wasfrom 1959 to 1999 (with a gap), and the third was from 1981 to 1997. Theresults did not reveal Granger causality in either direction, and experimentingwith different lag times did not change the findings.14 Although somewhatdiscouraging, this test stresses the importance of exploiting the rich dataset toreveal patterns in the cross-sectional data that are otherwise obscured by purelytime-series analysis.
Second, we consider a fixed effects model of the form15
ln(DEMi ·DEMj)t =ρ1 ln(DEMi ·DEMj)t−1 + ρ2 ln(DEMi ·DEMj)t−2
+ ρ3 lnTijt + Iωij + WitΩ + ξij ,
(4)
where ωij captures the (pairwise) individual fixed effects, ξij is the i.i.d. errorterm, and Wit is a vector of control variables that include the controls employedin GDP, GDP per capita, education, urbanization, and population size.16 Theregression was estimated for 5-year periods, with a total of 16,903 pairwiseobservations.
The Hausman test rejects the random effects model (χ2 = 206.2, p = 0.00),and so we limit our discussion to the fixed effects model. Estimated coefficients(not reported) were all significant at 10 percent level and consistent with thesigns in Barro (1999), with the exception of population (which had a nega-tive coefficient and was significant at 10 percent), the primary education gap(insignificant), and trade (insignificant). The coefficient for bilateral trade is -0.0064, with a standard error of 0.060. Hence, we obtain some weak evidence in
14These negative results may have been mitigated somewhat with the application of Grangercausality tests for panel data. However, the technique is still in its infancy, and hence esti-mation of this nature is left for future research. See Hurlin & Venet (2003) for a discussion oftheoretical work in this vein.
15The main drawback of our approach here is that (4) is somewhat atheoretical. Whilethere exists a literature on the economic determinants of democracy (Acemoglu, Johnson,Robinson & Yared 2006; Barro 1999), empirical models are generally based on estimating anequation of the form
DEMit = ρ1DEMit−1 + ρ2DEMit−2 + ρ3DEMit−1 + WitΩ + ξit,
for which the unit of analysis is the country-year observation, rather than country-pair-year.We have chosen to proceed in this fashion to retain consistency with the flavor of our approachin (1), while keeping in mind that, unlike the gravity model, there is no strong theoreticalbasis for an empirical model based on combined pairwise levels of democracy.
16Controls are described in greater detail in the appendix.
20
support of trade not being a determinant of democracy. Although this approachis imperfect, this regression represents a second attempt to address the endo-geneity problem, and suggests that causality flows from democracy to trade, notthe other way round. Nonetheless, the weak power of both tests emphasizes theneed for all empirical results of this nature to be founded on a sound theoreticalbasis.
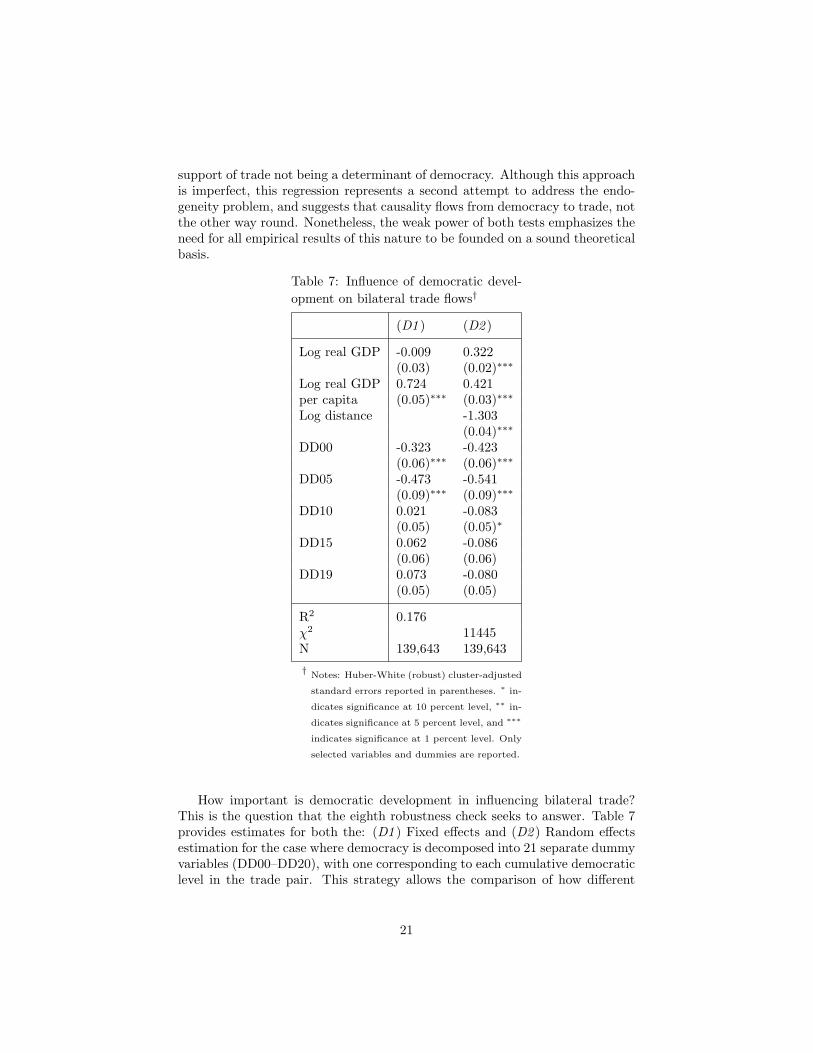
Table 7: Influence of democratic devel-opment on bilateral trade flows†
(D1 ) (D2 )
Log real GDP -0.009 0.322(0.03) (0.02)∗∗∗
Log real GDP 0.724 0.421per capita (0.05)∗∗∗ (0.03)∗∗∗
Log distance -1.303(0.04)∗∗∗
DD00 -0.323 -0.423(0.06)∗∗∗ (0.06)∗∗∗
DD05 -0.473 -0.541(0.09)∗∗∗ (0.09)∗∗∗
DD10 0.021 -0.083(0.05) (0.05)∗
DD15 0.062 -0.086(0.06) (0.06)
DD19 0.073 -0.080(0.05) (0.05)
R2 0.176χ2 11445N 139,643 139,643
†Notes: Huber-White (robust) cluster-adjusted
standard errors reported in parentheses. ∗ in-
dicates significance at 10 percent level, ∗∗ in-
dicates significance at 5 percent level, and ∗∗∗
indicates significance at 1 percent level. Only
selected variables and dummies are reported.
How important is democratic development in influencing bilateral trade?This is the question that the eighth robustness check seeks to answer. Table 7provides estimates for both the: (D1 ) Fixed effects and (D2 ) Random effectsestimation for the case where democracy is decomposed into 21 separate dummyvariables (DD00–DD20), with one corresponding to each cumulative democraticlevel in the trade pair. This strategy allows the comparison of how different
21

levels of democratic development affect bilateral trade, and provides some cluesas to whether there is a “threshold” level of democracy in a trading pair forwhich trade flows experience a significant boost. In the interests of conservingspace, only selected dummies are reported.17 To avoid perfect multicollinearity,the final dummy DD20 was dropped from the regression.
In general, the lower cumulative democracy dummies possess a negativecoefficient—indicating that low levels of democratic development have a neg-ative effect on trade in these trading pairs. For (D2 ), the first cumulativedemocracy dummy for which the coefficient is indistinguishable from zero isDD17; for (D1 ), the coefficient actually turns positive for DD15, and is followedby three more positive, coefficients (for DD17–DD19; with DD16 being negativebut insignificantly different from zero). Since both countries must be at leastmoderately democratic in order to attain a cumulative democracy score of 15(recall DEM ∈ [0, 10]), this test suggests that the level of democratic devel-opment tends to boost trade only for bilateral trading relations between statesthat display a fairly strong democratic tradition.
5 Conclusion
In closing, we return to the central question that motivated this paper: Dodemocracies trade more? The answer, at least within the context of this presentstudy, is a qualified yes. Trade fosters the fertilization of ideas, and democracy issurely one of them. This finding has been demonstrated using the gravity speci-fication for a very large panel dataset together with panel regression techniques.To that end, this study has upheld the findings of earlier studies that demon-strate that democracies are more likely to trade with each other. It has, however,also shown that this result is dependent on several key assumptions. The keydemocracy variable seems to be sensitive to alternative renderings of time pe-riods and cross sections—in the sense that the time series aspect of the dataappears to drive the result—and democracy is also moderated by, inter alia, eco-nomic size. As such, a one-size-fits-all theory of democratic processes and theirpolitical economic influences on trade flows and trade patterns is unlikely to befruitful. Instead, future theoretical research should distinguish between the mo-tivations of trading nations based not just on their broad political-institutionalstructures, but also on their level of economic development as well as globaleconomic trends.
Future theoretical research would naturally fall along the lines of attemptingto build a more coherent model of how democracy affects trade outcomes. Ex-isting research, as reviewed earlier, seldom provide an explicit basis for democ-racies affecting trade outcomes. Given the generally strong empirical evidencethat suggests that the effects of democracy might be first order instead of secondorder, theoretical models of trade should consider explicitly accounting for this
17In the random effects specification, all dummies, except DD15, DD17, and DD19 weresignificant at the 5 percent level. For the fixed effects specification, the dummies DD2, DD8,DD10–DD16, and DD19–DD19 were not significant at the 10 percent level.
22

characteristic, instead of treating such outcomes as exogenous, as Grossman &Helpman (1994) do. Clearly, any model to this effect should also allow for het-erogeneity between developed and developing countries, and, if possible, takeinto account the role of constraints and influences imposed by the external en-vironment. In this regard, Mansfield et al. (2000) is an important step forwardin this direction. (O’Rourke & Taylor 2006) also develop a model premised ona two-country Heckscher-Ohlin world.
Future empirical research would proceed in attempting to further weed outthe endogeneity problem by implementing alternative methodologies to controlfor causality and/or tackle the causality problem head on. This could involveimplementing a more complete Granger causality method than that attemptedhere, one that is amenable to panel data (as discussed by, for example, Hurlin &Venet (2003). Alternatively, one could employ instrumental variable techniques.This would involve introducing democracy as a left hand side variable, employingLogit/Probit to obtain predicted estimates of binary democracy (such as thoseintroduced in Section 4), and using these predicted values as instruments fordemocracy. The drawback of this strategy—and the main reason why we havenot chosen to pursue it for this paper—is that this is likely to significantlyreduce the sample size. Eichengreen & Leblang (2006) have recently takena stab at establishing identification through instruments, but this has beenlimited to trade openness, as opposed to volume. The paucity of both aspectsof research—theoretical as well as empirical—suggests that much remains to bedone.
ReferencesAcemoglu, K. Daron, Simon Johnson, James A. Robinson & Pierre Yared (2006). “Income
and Democracy”. Mimeograph: MIT
Adsera, Alıcia & Carles Boix (2002). “Trade, Democracy, and the Size of the Public Sector:The Political Underpinnings of Openness”. International Organization 56(2) (April): 229–262
Barro, Robert J. (1999). “Determinants of Democracy”. Journal of Political Economy 107(6)(December): S158–S183
Bliss, Harry & Bruce Russett (1998). “Democratic Trading Partners: The Liberal Connection,1962–1989”. Journal of Politics 60(4) (November): 1126–1147
Bonanno, Phyllis O. (1997). “Globalization, Trade and Democracy”. Economic Reform Today3: 2–3
Dixon, William J. & Bruce E. Moon (1993). “Political Similarity and American Foreign TradePatterns”. Political Research Quarterly 46(1) (March): 5–25
Eichengreen, Barry & David Leblang (2006). “Democracy and Globalisation”. Working Paper219, Bank of International Settlements
Engler, Mark (2003). “Free Trade vs. Democracy”. CounterPunch February 10: Article 4
Feenstra, Robert C., James R. Markusen & Andrew K. Rose (2001). “Using the GravityEquation to Differentiate Among Alternative Theories of Trade”. Canadian Journal ofEconomics 34(2) (May): 430–447
23
Frankel, Jeffrey A. & David H. Romer (1999). “Does Trade Cause Growth?” AmericanEconomic Review 89(3) (June): 379–399
Grossman, Gene M. & Elhanan Helpman (1994). “Protection for Sale”. American EconomicReview 84(4) (September): 833–850
Huntington, Samuel P. (1991). The Third Wave: Democratization in the Late TwentiethCentury, volume 4 of Julian J. Rothbaum Distinguished Lecture Series. Norman, OK:University of Oklahoma Press
Hurlin, Christophe & Baptiste Venet (2003). “Granger Causality Tests in Panel Data Modelswith Fixed Coefficients”. Mimeograph: Universite Paris I
Mansfield, Edward D., Helen V. Milner & B. Peter Rosendorff (2000). “Free to Trade: Democ-racies, Autocracies, and International Trade”. American Political Science Review 94(2)(June): 305–321
Mansfield, Edward D., Helen V. Milner & B. Peter Rosendorff (2002). “Why DemocraciesCooperate More: Electoral Control and International Trade Agreements”. InternationalOrganization 56(3) (August): 477–513
Marshall, Monty G. & Keith Jaggers (2003). Polity IV Project: Political Regime Characteris-tics and Transitions, 1800–2003. College Park, MD: Center for International Developmentand Conflict Management
Mayer, Wolfgang (1984). “Endogenous Tariff Formation”. American Economic Review 74(5)(December): 970–985
McCallum, John C.P. (1995). “National Borders Matter: Canada–U.S. Regional Trade Pat-terns”. American Economic Review 85(3) (June): 615–623
Milner, Helen V. & Keiko Kubota (2005). “Why the Move to Free Trade? Democracy andTrade Policy in the Developing Countries”. International Organization 59(1) (January):157–193
Mitra, Devashish, Dimitrios D. Thomakos & Mehmet A. Ulubasoglu (2002). “‘Protection forSale’ in a Developing Country: Democracy versus Dictatorship”. Review of Economics andStatistics 84(3) (August): 497–508
Morrow, James D., Randolph M. Siverson & Tressa E. Tabares (1998). “The Political Deter-minants of International Trade: The Major Powers, 1907–90”. American Political ScienceReview 92(3) (September): 649–661
Olson, Mancur (1982). The Rise and Decline of Nations: Economic Growth, Stagflation, andSocial Rigidities. New Haven, CT: Yale University Press
O’Rourke, Kevin H. & Alan M. Taylor (2006). “Democracy and Protectionism”. WorkingPaper 12250, NBER
Polachek, Solomon W. (1997). “Why Democracies Cooperate More and Fight Less: TheRelationship Between International Trade and Cooperation”. Review of International Eco-nomics 5(3) (August): 295–309
Rose, Andrew K. (2000). “One Money, One Market: The Effect of Common Currencies onTrade”. Economic Policy 15(30) (April): 7–45
Rose, Andrew K. (2005). “Which International Institutions Promote International Trade?”Review of International Economics 15(4) (September): 682–698
Rose, Andrew K. & Mark M. Spiegel (2004). “A Gravity Model of Sovereign Lending: Trade,Default, and Credit”. IMF Staff Papers 51(Special Issue) (June): 50–63
24

Singer, K. David & Melvin Small (1994). Correlates of War Project: International and CivilWar Data, 1816–1992. Ann Arbor, MI: Inter-university Consortium for Political and SocialResearch
Tavares, Jose & Romain Wacziarg (2001). “How Democracy Affects Growth”. EuropeanEconomic Review 45(8) (August): 1341–1378
Yang, Cheng-Chen (1995). “Endogenous Tariff Formation under Representative Democracy:A Probabilistic Voting Model”. American Economic Review 85(4) (September): 956–963
Appendix
This appendix discusses in some detail the various controls employed for boththe benchmark regressions as well as the regressions used in the robustnesstesting section of the paper. It also discusses in greater detail the data sources.
The vectors for controls are as follows:
Xij =
BorderLangLandlIslandMassColOccColHistNation
, Yijt =
FTACU
CurColOpen
, (A.1)
where the time invariant terms are: Border is a binary variable which is unitywhen the trading pair share a contiguous border, and zero otherwise; Lang is abinary variable which is unity when the trading pair share a common language,and zero otherwise; Landl ∈ [0, 2] is the number of landlocked countries in atrading pair, Island ∈ [0, 2] is the number of island nations in a trading pair;Mass is the combined land area of the trading pair; and ColOcc, ColHist andNation are binary variables which take on unity if either nation in the pairwere ever colonized, shared the same colonizer, or are part of a common nationduring the sample, respectively.
The time-variant terms are: the binary variables FTA, CU and CurCol,which take on unity when the trading pair belong to a regional trading agree-ment, a currency union, or are both colonies at time t, and zero otherwise; anda measure for openness. Throughout most of the paper, this measure was takento be applied import duties. The robustness section applied instead a measurederived from
Opennesst =Importst + Exportst
GDPt,
where Importst and Exportst denote aggregate imports and exports at time t,respectively.
The robustness section also incorporated two additional controls, one for pol-icy quality and another for political stability. These were a continuous variable
25

for extent of corruption ranging from [0, 6], used as a proxy for policy qual-ity, and a continuous variable for major governmental crises which ranged from[0, 5], used as a proxy for political stability. The separate dummy variables usedin (D1 ) and (D2 ) corresponding to the cumulative democracy value were gen-erated from the sum of the two continuous democracy measures for the countrypair, with a value of unity assigned to DDv if the sum was equal to v, and zerootherwise, for v ∈ [0, 20].
The vectors for controls for democracy as the dependent variable were:
Zijt =
GDPGDPPCEduc
EducGapUrbanPopOil
, (A.2)
where GDP and GDPPC are GDP and GDP per capita, Educ and EducGapare average years of primary schooling and the gap between male and femaleprimary schooling (for persons aged 25 and over), Urban is the urbanizationrate, Pop is population, and Oil is an indicator variable which is unity whenthe trading pair has a country that is an oil exporter, as classified by the IMF.
The full regression results are available as a log file posted on one of theauthors’ website: http://web.centre.edu/jamus.lim/research/codeipe1.txt
The trade dataset as well as the dataset for openness measures were providedby Andrew Rose, who has made the data freely available online from his website:http://faculty.haas.berkeley.edu/arose/RecRes.htm. The democracy measureswere drawn from the Polity IV project dataset, managed by Monty Marshall andKeith Jaggers, also available online: http://www.cidcm.umd.edu/inscr/polity.The control measures for policy quality and political stability were taken fromWilliam Easterly and Ross Levine’s World Bank growth regressions data, avail-able at: http://paradocs.pols.columbia.edu:8080/datavine/MainPage.jsp. Theeducation controls were taken from the Barro-Lee dataset on international edu-cational attainment, and population and urbanization data were from the WorldBank’s Global Development Finance database.
26