democracy and national economic performance: the search ... · democracy and national economic...
TRANSCRIPT

Democracy and National Economic Performance:
The Search for Stability
ABSTRACT
Does democracy affect national economic performance? Previous analyses of democracy's effect
on economic performance generally begin with an unsound assumption--voters demand the highest rate of
economic growth. From an analysis of the likely risk/return preferences of voters, this paper develops the
hypothesis that democracies differ from dictatorships in that democracies reflect the risk preferences of
citizens. The results, based on a sample of 108 countries, 1974-1989, are consistent with this hypothesis.
Democracies, compared to autocracies, are unquestionably characterized by stable growth rates. The
results are robust both to changes in modeling assumptions and to trimming the upper and lower extremes
of the sample. Three studies from the comparative economic voting literature are re-examined: those by
Powell and Whitten 1993, Pacek and Radcliff 1995, and Wilkin et al 1997. Risk, measured as volatility,
is shown in each model to be a negative and statistically significant influence on incumbent vote shares.
2
Introduction
Does democracy affect national economic performance and if so, how? No question is
more central to the study of political economics. The existing scholarly work on the subject is well
known for its contradictory theoretical and empirical findings. In this paper we advance a modified
perspective that offers some resolution of the prior results. This resolution assumes that voters evaluate
economic performance in two dimensions--rate and stability over time--rather than the more conventional
single dimension--rate of growth. Our analysis proposes that economic performance in more democratic
systems will reflect both the aversion of voters to economic volatility and their desire for increased
income.
This suggests the key hypothesis of the study, that more democratic systems differ from less
democratic systems by having either growth characterized by low volatility or higher volatility
accompanied by higher rates of growth. We will show in an analysis of 108 countries (1974-89) that
when two dimensions of economic performance are examined--the rate and volatility of growth--more
democratic countries unquestionably have distinctively favorable rate and volatility characteristics than
do less democratic countries. Using Leamer's (1983, 1985) "extreme bounds analysis," we show that
these results appear to be extremely robust to changes in conditioning information and to exclusion of
extreme observations.
Next, we present evidence strongly supporting our hypothesis that this effect results from the
tendency of voters to penalize incumbent governments for high economic volatility and reward them for
lower volatility. This demonstration involves adding a measure of economic volatility (or, alternatively, a
measure of risk-adjusted growth) as an independent variable to models used in three published studies of
comparative economic voting. We find that increasing prior volatility is negatively and statistically
significantly linked to incumbent vote shares.
Democracy's Effect on Economic Growth: A Theoretical and Empirical Review
Whether and how democracy and long-run economic growth are associated is a secondary
question for many political scientists and moral philosophers. Democracy is a moral economy that is
3
broadly superior on philosophical grounds independent of economic performance.
Even so, political economists have puzzled at length about democracy's possibly deleterious
effects on national economic performance (for recent reviews, see Alesina and Perotti 1994; Keech 1995;
Przeworski, Alvarez, Cheibub, and Limongi 1996; Remmer 1995; Sirowoy and Inkles 1990; and Wittman
1995). It has often been claimed that democratic politics impose costs, or make economic adaptation
more costly. A "strong hand" may be better suited than democratic political institutions to manage the
challenge of industrialization and rapid economic growth.
A Negative Relationship?
The hypothesized negative relationship between democracy and growth has theoretical
underpinnings rooted in redistributive democratic politics (see Keech 1995 for a useful review). Since
Adam Smith, political economists have worried that political demands for redistribution of wealth and
income are easily realized in democracies. Insofar as redistribution reduces growth, democracies will
grow less rapidly than non-democracies. Alesina and Rodrik 1994 and Persson and Tabellini 1994 offer
modern versions. High levels of inequality are harmful for subsequent economic growth, they suggest,
because in democracies, high inequality leads to policies that reallocate national income from investment
to consumption—thereby slowing growth.
Democracy's theorized deleterious effects on economic performance are not limited to shifting
national income from investment to consumption. Olson 1982 predicts that stable democracies will be
overwhelmed by interest groups, which use political activity to gain rents and, as a side consequence,
reduce national wealth ("sclerosis"). Buchanan and Wagner 1977 predict an unending growth of
government, which eventually will strangle the economy. Nordhaus 1975 demonstrates that democratic
partisan competition can lead to unnecessary manipulation of growth rates, which will be eventually
destructive and costly to correct. Barro and Gordon 1983 show that policy-makers in democracy face a
"time-inconsistency problem" which is very difficult to solve within the context of democratic
institutions, and which makes inflation much more likely. In short, many prominent economists have
developed theory for the claim that democracy harms economic performance.
4
Not all recent theorizing about democracy and growth has produced bleak predictions. In one
very important line of argument, Wittman and others note that democratic competition is inherently
effective as a mechanism for revealing information (Wittman 1989, 1995; Babba 1997). Therefore,
Wittman argues, the more developed the democracy, the more highly developed the institutions that
guarantee transparency of policy and policy-making processes. The information thus revealed--about
preferences, the state of the world, and elite action, and prior policy impacts--is useful both to elites and
to ordinary voters. It enables citizens to monitor more effectively the behavior of elected officials. It has
the effect of reducing the probability of government officials adopting policies that are purely rent-
seeking or self-serving relative to the probability that such policies would be adopted in an undemocratic
setting. It makes, over time, democracy a system of moderation and constraint, with equilibrium
properties (Przeworski 1991).
Several studies build on North (e.g., 1989) in arguing that some institutions critical to growth
(especially property rights) are enhanced in democracy--thereby encouraging growth (e.g., Kormendi and
Meguire 1985, Knack and Keefer 1995, Clague, Keefer, Knack, and Olson 1996, World Bank 1997). As
Pastor and Sung 1995 note, private sector actors are more likely to undertake investment in settings where
property rights are better protected, and they find that higher rates of investment are correlated with
democratic regimes. Other studies, Scully 1992, 1997, in particular, go beyond property rights to link a
broader conception of liberty to stronger national economic performance.
In theoretical terms, however, much of the recent scholarly work represents a remarkable
moderation of the optimism of "modernization theory," which held that democracy and economic growth
were reinforcing processes. (See, e.g., Lipset 1960; Rostow 1960.) What do the empirical studies show?
Ambiguous Empirical Results
While much of the post-1960 theoretical work on democracy and economic growth is pessimistic
regarding democratic performance, the empirical tests of that link have produced ambiguous results.
Sirowy and Inkles 1990, reviewing 15 empirical investigations (drawn from 13 reports), found that 11
showed either no relationship or a conditional relationship between growth and democracy. Przeworski

5
and Limongi 1993 review 18 studies (with 21 sets of findings), and also find inconsistent results: eight
studies reported a positive link between democracy and growth, eight reported a negative link, five others,
no link. Subsequent studies are similarly inconsistent, for example: Helliwell 1994, negative; Keefer and
Knack 1997, negative/none; Leblang 1997, positive; Przeworski et al. 1996, none; Burkhart and Lewis-
Beck 1994, none; Pourgerami 1992, marginally positive; Weede 1996, mixed; Feng 1997, negative.
Prior literature suggests two especially important sources of such inconsistencies. The first is
inconsistent modeling assumptions, and the second is selection bias.1
Inconsistent Modeling Assumptions. Leamer 1983 notes that differences, sometimes minor, in model
specification lead to very different empirical results with very different substantive interpretations.
Leamer proposed that scholars undertake "sensitivity analysis" to see if their econometric results can be
attributed to their modeling assumptions. As he put it, "an inference is not believable if it is fragile, if it
can be reversed by minor changes in [modeling] assumptions" (1983, 38).
Leamer's critique is relevant for studies of democracy and economic growth since the models
used by different investigators do vary widely. For example, in a recent note, Leblang 1997 excludes
investment from his model, even though Levine and Renelt 1992 and Faberger 1994 demonstrate that
investment is the most consistently robust correlate of long-run growth. Keefer and Knack's 1997 models
also exclude investment. Helliwell 1994 includes investment in his analysis, but omits some education
and population measures included by others. Alesina and Rodrik 1994, and Persson and Tabellini 1994
omit from their models any measure of labor force growth. Both typically do include some indicator of
human capital formation. Given that it is apparently unlikely that we will agree precisely on the
appropriate model, if scholars were to employ some version of Leamer's (1983, 1985) extreme bounds
1 There are, of course, many differences between these studies that cannot be explored here. Feng, for example, uses
3SLS and a 1960-1980 cross-section; LeBlang uses three panels of ten-year cross-sections; Pourgerami apparently
reports estimates for a single-year cross-section; Przeworski et al. use survival analysis; and Burkhart and Lewis-
Beck use a large TSCS. Most, except for Pourgerami and Burkhart-Lewis-Beck, can appropriately be characterized
as long-run growth models.
6
analysis, we might come closer to knowing whether democracy's economic effects (or lack thereof) arises
from some small detail of model specification.
Selection Bias. Przeworski and Limongi 1993 (PL) point to a very different problem. In their view,
selection bias, not inconsistent modeling assumptions, undercuts most empirical examinations of the link
between democracy and economic performance. If some factors lead countries to "select" democracy,
and those factors also lead independently to good or bad economic performance, regression models will
result in biased and inconsistent estimates of the impact of democracy on growth. The solution to this
problem would be to implement a two-step estimating procedure (see Green 1993; Maddala 1983).
In order to correct for selection bias, scholars must identify the selection mechanism. In the very
best studies on the topic, we find two proposed selection mechanisms, which are, however, seemingly
inconsistent. One set of authors propose that poorly performing authoritarian regimes are likely to be
displaced by democracies, whereas poorly performing democracies are likely to experience a change of
government in an election (Przeworski and Limongi 1993). As a result of this selection mechanism, we
would mistakenly find a negative relationship between economic performance and democracy. Other
authors argue convincingly that economic failure "causes" dictatorships in poor countries, while
democracies, which appear randomly ("spring up"), or spread by geographic contagion, are sustained by
economic success (Przeworski, Alvarez, Cheibub and Limongi 1996). Thus, econometric analysis might
mistakenly find a positive relationship between democracy and economic growth.
It is quite likely that there is one or more selection mechanism at work. It may also be true that
the divergent empirical results stem predictably from sample composition effects. To our knowledge, no
one has yet advanced a general account linking a selection mechanism to the empirical results.
We believe, however, that failure to model the selection mechanism is probably not the main
source of inconsistency in the existing literature.2 And we also judge that the Przeworski-Limongi
2 As observed above, the results of prior studies reviewed by Przeworski and Limongi and by Sirowy and Inkeles do
not offer strong support for the presence of either mechanism. Some well-regarded econometric studies involving
selection processes (e.g., returns to college education, see Grogger and Edie 1996), treat the problem as an omitted

7
rejection of "standard regression models" is probably overstated, given that there is currently no well-
developed, widely accepted theory of the genesis of democracy that reliably shows how the selection
mechanism is linked to economic performance. We do believe that selection processes are important to
consider. We also accept Leamer's proposal that any results obtained should be examined for "fragility."
An Alternative Solution: Risk and Expected Return
Consider a third explanation for the conflicted theory and ambiguous empirical results. Perhaps
scholars have misjudged the objectives of democratic citizens concerning the economy. Recent studies of
public opinion's effect on public policy show, broadly, that the public get what they want (see, e.g.,
Stimson, Erikson, and MacKuen 1995; Page and Shapiro 1993). Wittman 1995 demonstrates that the
political market is neither less nor more efficient than consumer markets in transmitting information about
preference. It is certainly possible that democratic citizens willingly trade lower growth rates with greater
stability for the chance of higher, but unstable growth. If so, then the prior studies, which have focused
on the rate of growth, will have missed an important aspect of democratic economic performance, and
may mischaracterize what democracy contributes to economic performance.
We know from financial economics that investment risk and expected return are positively
associated. If we pose the question of the possible link between economic growth and democracy in the
risk and return framework of financial economics, then the issue is this: do voters want the high risk (i.e.,
variable question, not as a problem requiring a two-step estimation. In that case, the approach to estimation is
simply to include (control for) the selection variable (ability) in the model of earnings that also shows the
independent effect of college education. The analog omitted variable in the case of democracy and growth could be
some lagged indicator of economic performance, possibly interacted with prior regime type, that would have
"caused" the selection of democracy. To anticipate the empirical results reported below, our experiments with such
specifications show that previous rates of economic growth, taken alone or in interaction with baseline democracy,
have no statistically significant effects, and do not influence our estimates of baseline democracy's effect on
subsequent national economic performance. We also included in our estimates other measures (e.g., primary and
secondary education rates, per capita income) that some have suggested are predictors of future democracy.

8
volatility) that is generally associated with high expected return? After all, the point of the financial
economists is precisely that running higher risks brings with it no guarantee of higher returns, and
empirical investigations readily show that higher risk often brings with it lower returns. The analysis that
follows draws an analogy between democratically controlled economic policy (broadly construed) and
private investment decisions.
Risk and Return
An axiom of financial economics is that risk and return are positively associated--for investors to
hope to earn higher returns in any single investment, they must select an investment that embodies higher
risk of zero or negative returns.3 Risk is defined in financial economics as the variability of financial
returns, and operationalized as the volatility of observed returns (i.e., the standard deviation). The
"expected return" is the most likely return for an investment. The relationship between risk and expected
return is typically portrayed graphically, with risk or volatility (s) on the horizontal axis, and expected
return (Z) on the vertical axis; the "risk/return frontier" traces the minimum-variance locus--a line
showing what return rational investors should demand for a given level of risk (Sharpe 1970; Ingersoll
1987, 82-7). Efficient investments produce optimal returns for a given level of risk. An inefficient
investment is "inside" the frontier and provides a lower return.4 Thus, a low return/low risk investment
can be just as efficient as a high return/high risk investment because there is no available investment with
3 Generally speaking, this is true for portfolios, or combinations of investments, too, although if investments' returns
are negatively correlated, a portfolio can substantially increase the return over a single investment while
substantially reducing risk.
4 For obvious reasons, we do not follow this analogy through the steps of calculating a portfolio of "investments"
(i.e., countries) that could minimize variance. This is a relevant question from the point of view of investors to the
extent that they can make investments that are intended to reflect the performance of different economies (or
"buying" different countries). Voters and other interests participating in democratic politics are not involved in this
kind of diversification. In terms of the financial economics analogy, voters have to put all their eggs in one basket,
but they have some ability to influence the nature of the basket.

9
equally low risk and a higher return. More efficient investments are those closer to the efficient frontier;
they have the best rate of growth, given a level of variance (or vice versa). It is perfectly rational for
investors to seek different degrees of risk exposure, and law often requires that some investment
portfolios (e.g., those of pension funds) must strictly limit risk exposure.
Let us draw an analogy between private investment decisions and national economic
performance. Following this analogy, "risk" can be thought of as the volatility of a nation's growth rate
over time (the standard deviation of a nation's annual economic growth). "Return" can be thought of as
the observed (ex post average) national growth rate. As with investments, risk and expected return in
economic growth can be portrayed graphically (following the convention of financial economics), with
expected return on the vertical axis, and risk on the horizontal axis. Efficiency can be operationalized as
any point near to the analogue to the efficient frontier, which is the line made by the risk-return
performance of the world's best-performing economies. We call this analogue to the efficient frontier the
efficient countries' line. The deviation from the efficient countries' line measures how far from the risk-
return performance of the leading economies a nation is—it measure a country's growth gap.
It is, of course, true that some parts of growth rates and growth volatility differ among nations for
reasons that have little to do with government policy. The widely adopted theoretical notion of
"conditional convergence" in economic growth implies that nations can be thought of as having "growth
trajectories" related to their current level of development, capital investment, and store of "human
capital." The notion of conditional convergence suggests that among similarly endowed countries, poorer
countries grow more rapidly than rich countries (Baumol, Blackman, and Wolff 1989).
The risk/return analogy from financial economics is apt, even so. Many government economic
policies have the effect of stabilizing the economy, thereby dampening volatility in growth rates.
Counter-cyclical fiscal and monetary policies, for example, are employed world-wide by governments.
Various social welfare guarantees have come to be referred to as "automatic stabilizers." Institutions have
been developed to enhance financial stability (e.g., deposit insurance and balance-sheet surveillance) and
to guarantee the orderly resolution of disputes about property rights. And, while it is questionable to what
10
extent government policies toward private investment predictably increase the rate of growth —
risklessly or otherwise (Easterly et al. 1993), it is clear that governments can pursue policies that
predictably decrease growth or increase volatility, or both. A government's ability to undermine growth
is, in fact, the primary claim of the negative hypotheses reviewed above.
Perhaps one of the clearest examples of the relationship between risk/return and government
policies involves international trade. It is axiomatic in economics that trade liberalization increases "the
wealth of nations." It is also true that trade openness increases a nation's exposure to international shocks,
which an obvious potential source of volatility. Hence, countries with large shares of imports and exports
should be wealthier than they otherwise would be, but will also be more exposed to economic volatility
than they would otherwise be.
Another government strategy some have recommended for predictably increasing growth rates is
for a government to invest in such a way so as to change international comparative advantage. By using
industrial policies or trade barriers, it has been suggested, governments might be able to create advantage
in manufacturing products, but only by running a risk that the resulting firms might be inefficient and
drain wealth away from a nation (e.g., World Bank 1993). The investments in human capital made by
governments in Central and Northern Europe are examples of government investments in comparative
advantage in skilled labor that appear to have paid off. Investment in education is not a riskless
investment, however: highly educated individuals may emigrate, and the investment payoff may not be
realized.
Democracy and risk and return
Democracy's distinctive feature (compared to non-democracies) is that it is a mechanism whereby
citizens have a routinized opportunity to oust incumbent politicians.5 Democracy can be thought of as an
equilibrium (Przeworski 1991) whereby deviations from citizen preferences (or changes in voter
preferences) are adjusted, and where elite behavior is circumscribed. We expect democracies, therefore,
broadly to reflect citizen preferences and to limit rent-seeking behavior by elites. We believe that two
11
main mechanisms moderate the volatility of democracy. The first is literally the preference of voters for
avoiding risk. The second is the information-revealing character of democratic competition, which makes
large abuses harder to achieve and raises the likelihood that policies are consistent with the preferences of
voters.
What do citizens want regarding economic growth and risk? We observe that voters want
increased wealth, as they apparently judge politicians based upon national economic performance (Lewis-
Beck 1988; Powell and Whitten 1993). While citizens want increased wealth, do they want the increased
risk associated with governments seeking the highest possible rate of growth?
The public opinion survey data on growth and risk thin, but when questions have been asked, they
show that U.S. voters identify economic instability as one of their greatest fears.6 As the well-known
"equity premium puzzle" shows, investors are risk averse, even when they have an opportunity to
diversify away risk.7 Since voters have even fewer options to diversify away the risk of a failed political
5 Particularly useful are discussions in Dahl 1971; Riker and Weimer 1993, and Przeworski 1991.
6 For example, an April 1974 "State of the Nation Survey" (Question ID: USGALLUP.74POTA.Q02) asked 625
U.S. respondents "What are your fears and worries for the future?" 25% identified "economic instability," which
was the highest response to any question, topping health or other concerns. (In the same survey, 23% identified "ill-
health, accident, death, or continued illness (physical or mental)" as their greatest worry.) The same or very similar
question was asked several times in the 1970s, and economic instability was always the first or second leading
concern. (See USGALLUP.76POTM.Q07A; USGALLUP.74POTB.Q02; USROPER.780651.R03). When the
question was asked in September of 1964 (USGALLUP.633POS.Q05B1), economic instability (13%) took third
place to war (48%) and communism (25%). After 1979, questions on domestic economic instability do not appear
in the Roper Center's Public Opinion Online. Accession at Roper Center 1998.
7 Individuals can acquire portfolios that include assets from other countries, and can thereby diversify the some
aspects of the risk of poor home country performance. Individuals do not, however, diversify internationally as
recommended by theory (Baxter and Jermann 1997). This point is consistent with, but not dependent upon, ideas
about risk aversion that have been illustrated in various ingenious ways by Kahneman and Tversky (1990) in
experimental situations.
12
economic strategy than do investors in investment markets, we expect voters to be unwilling to tolerate
economic volatility.
Voting is the main mechanism whereby citizens can punish or reward politicians for undesired
outcomes. Comparative voting studies provide consistent evidence that incumbent politicians have
compelling reason to be risk averse regarding economic policies. Pacek and Radcliff 1995 report that
economic decline harms incumbent politicians in democracies of emerging market economies, but that
incumbents gained little electoral benefit from increased economic performance. Voting studies in
advanced industrial nations show evidence that voters reward as well as punish incumbents for economic
performance (Erikson 1989; Lewis-Beck 1988; Powell and Whitten 1993). In either case, the incentive
for incumbent politicians is clear: avoid strategies with a high risk of economic downturn.
In this light, the transparency features of democratic political life are important. Democracy
enables citizens to monitor more effectively the behavior of elected officials, and apportion praise or
blame appropriately.
More democratic countries are more likely to pursue policies leading to outcomes that are
consistent with citizen risk/return preferences, which is for low risk growth, unless the risks are well
compensated. Other things equal, more democratic countries will be clustered near the efficient countries'
line. Non-democracies, lacking a routinized mechanism for realizing citizen preferences, will be located
all over the graph.
Democracies, then, should be distinctive not in their high or low rates of growth, but in the way
growth is related to volatility. Citizens everywhere would reject higher economic volatility, but only in
democracies could we expect these preferences to be reliably reflected in outcomes. The argument, in
summary, is that because voters have an ongoing ability to call a halt to an experiment that they judge to
be failing, or to halt an experiment once it has paid adequate returns, democracies will be nearer to, rather
than farther from, the efficient countries' line. What we expect is common to all democracies is that
voters will be relatively more effective in demanding that additional risks be compensated, and that
democracies will tend to be nearer the efficient countries' line than will non-democracies. Democratic
13
governments will not, in general, be located deep in the interior space of the growth/volatility graph: that
outcome is the special preserve of the non-democracy.
In summary, we hypothesize:
H1. The more democratic the country, the more its economic performance will be characterized by
combinations of economic growth and volatility close to the efficient countries' line; and
H2. Voters punish incumbent governments for high rates of volatility and reward them for lower
volatility.
Hypotheses Testing
We will examine the hypotheses in two sections, the first assessing the democracy and economic
performance. In the second section, we build on prior work scholars on comparative economic voting in
assessing whether voters punish incumbents for high rates of uncompensated volatility. We seek to
establish in the second section a domestic-level mechanism for the cross-national phenomenon we
observe in the first section.
National Economic Performance - Dependent Variable
Our interest is in economic growth over time in relationship to the volatility of growth (i.e., risk)
over time. Our hypothesis is that as democracy increases, observed economic performance will be closer
to the efficient countries' line described conceptually in the text above. To describe this relationship, we
use data on growth and volatility calculated from data in the well-known Penn World Tables Mark 5.6.
Our sample period, 1974-89 matches the dates used in Levine and Renelt's (1992) well-known study.8
We first generate a graph with the rate of growth on the vertical axis, and the (logged) variance of growth
on the horizontal axis. We next plotted a line "north-west" of the most "efficient" cases in our analysis.
The most efficient countries are those with the highest average growth rates for a given degree of
volatility or uncertainty. We began with line estimated from a regression equation that described the
slope and intercept of the "best cases," and then adjusted the intercept to insure that all the cases lay
8 The data are easily available to other scholars and the Levine and Renelt results provide a useful benchmark for our
work.
14
below the frontier.9 Because we have used a constant slope, the precise definition of the line--i.e., its
dependence on the details of this particular sample--is not a source of influence on our results.10
[Figure 1 about here]
Our dependent variable is the vertical deviation from the efficient countries' line from the growth-
variance coordinates of each country.11 By definition this distance is zero or negative for all cases—the
9 The efficient countries' line used in Figure 1 is given by Y=12.5(log)X where Y is the observed growth rate and X
is the observed growth volatility. We have performed the analysis using unlogged volatility with the same
substantive results. The logged measure is, however, more normally distributed, and the regression residuals are
better behaved with the logged specification.
10 The key is the definition of a reference line that stipulates that there must be increasing volatility associated with
increasing returns. While precise coefficients would change, the relative relationships of the coefficients of interest
would not change even with a different slope for the efficient countries line.
11 Is this vertical distance is appropriate distance to examine? If countries trying to improve their performance, they
might not follow this vertical distance, but rather the shortest distance--a distance defined as a line beginning at the
country's observed growth/variation combination and intersecting the efficient countries' line at a perpendicular. In
fact, these two distances (the vertical and the shortest) are precisely proportional, and therefore any results that hold
true for the vertical distance will of necessity hold true for the "shortest distance" as well. The logic of this
proportionality is as follows. Connect the efficient countries' line to any point below that line (i.e., any
growth/variability combination) with vertical and horizontal lines that form a right angle at the selected point. This
defines a right triangle, ABC, where C is the right angle, and the line segment AB is the hypotenuse and lies on the
efficient countries' line. In right triangle ABC, the distance we call the "growth gap" is the vertical line segment AC.
The shortest distance to the hypotenuse, call this line CD, is the altitude of the right triangle ABC. The line CD
creates two new right triangles, each of which is similar to triangle ABC. A theorem of geometry is that two
triangles are similar if they share an angle in common and both contain a right angle. A characteristic of similar
triangles is that their similar sides (i.e., two hypotenuses, the two "long" sides, the two "short" sides) are
proportional. The lines AC and CD in these two similar triangles must, then, be proportional. In two similar right
triangles, the "short" legs of the two triangles will be perfectly proportional all the time, and that is exactly the case
15
line passes through or just slightly above the most "efficient" points, and all other points lie to the interior.
The deviation from the line indicates how far below the estimated "efficient" growth rate the observed
growth rate of a particular country is, given the observed degree of volatility. We refer to this below as
"risk-adjusted growth," or the "growth gap." Under our hypothesis, this deviation should smaller for
democracies than for non-democracies; that is, the coefficient on a measure of democracy should be
positive indicating higher risk-adjusted growth rates (smaller negative deviations) as the degree of
democracy increases.
National Economic Performance - Independent Variables
Democracy has been operationalized in various ways, and the task of doing so has engendered
some controversy.12 Several standard quantitative measures are very highly correlated. In a useful
validation study, Bollen 1993 recommends the widely-cited scales published by Freedom House, referred
to as the Gastil scales.13 Burkhart 1997 revisits the question, and comes to similar conclusions about the
utility of the Gastil/Freedom House scales. We therefore use Gastil scales here.
The Gastil scales include one seven-point scale for "political freedom" and another seven-point
scale for civil rights. Following Burkhart and Lewis-Beck 1994, we have adopted the convention of
summing the scales together. We then calculated averages for the period 1974-89, and also for the "base"
in our analysis. See Wallace and West 1982, 117-119.
12 See, for example, the various articles gathered in Diamond and Plattner 1996
13 Bollen suggests that the Gastil measure is preferable to a widely available alternative provided by Jaggers and
Gurr 1996 in the Polity III data set. Others using the Gastil measure are Keefer and Knack 1997, Burkhart and
Lewis-Beck, 1994, and Helliwell 1994. The Polity III updates the Polity II data set described in Gurr et al 1990.
Przeworski et al. 1996 elected to construct a new measure. We found a correlation of .94 between the 1974-89
average of the Gastil data and a 1974-89 average of the ten-point Democracy scale from the Polity III data set. Our
base measure (averaging 1972-73) was correlated at .90 with a similar Polity III average. We used the 1974-89
average Gastil Index to correctly predict 92 percent of the classifications of democratic/non-democratic used by
Alesina and Rodrik 1994.

16
period 1972-73. These averages were then rescaled so that they ranged from 0-1 with 1 being the most
democratic and 0 being the least democratic. Our models also include a measure of contemporaneous
political change, which is the difference between the base-line democracy score and the democracy scale
averaged over the sample period. In both cases, we expect positive associations with risk-adjusted
growth, but we include the estimated contemporaneous relationship between democracy and economic
performance primarily as a control variable rather than as the main object of study at this point. (We do
not estimate simultaneous equations in this cross-sectional investigation.)
To examine whether democracy is associated with risk-adjusted growth, we build on standard
models of economic growth. Our model for risk-adjusted growth is based on the widely-cited Barro 1991
cross-sectional growth model. We have taken special note of the reviews of the growth literature by
Barro and Sala-i-Martin 1995, Fagerberg 1994, and Levine and Renelt 1992. The Fagerberg and Levine
and Renelt studies identify initial level of income and investment share of national income as essential
elements in growth models.
As determinants of risk-adjusted growth, then, we follow these scholars in including investment
(as a share of GDP), baseline levels (1973) of real per capita income, secondary school enrollment rates
(1960), and annual rates of population growth (1974-89). 14 Alesina and Rodrik 1994 and Persson and
14 Population growth has been included as a crude, but readily available measure of labor supply when used by
economists, and as a generic measure of development when used by sociologists. Labor supply is a standard
component of classical economic growth models. Levine and Renelt 1992 report that population growth was
included in 29 (or 71 percent) of the 41 studies they reviewed; Fagerberg reported that population measures were
included in 16 of the 28 studies he surveyed (55 percent). Levine and Renelt are troubled by the fact that population
growth has often entered with the wrong sign. The negative association is, of course, well-known (e.g., Blanchet
1991). Whether the ambiguity about causality is substantially greater than for some other variables regularly
included in growth models is dubious. Note that while Levine and Renelt classify population growth as being
"fragile" it is one of the least fragile of the fragile measures--that is, it is always reasonably close to statistical
significance.

17
Tabellini 1994 use primary education levels (1960) in their analysis of growth, and to assure
comparability we also add that variable to our base models (although it is noteworthy that many other
scholars do not always add these "human capital" measures).15 The initial level of income, investment,
and population growth are expressed in logs.16
To try to capture the potential impact of external shocks on volatility, we included a measure of
imports as a percentage of gross domestic product. Many scholars have hypothesized that such shocks
have significantly adversely affected performance. In testing for robustness of this specification to
additional controls, we also examined the impact on our dependent variable of two additional measures of
trade exposure that may be related to economic volatility. The first is a measure of primary materials
exports as a share of GDP, and the second is a logged measure of volatility in the terms of trade.
Except for the variable of interest, baseline democracy, we treat all of the independent variables
as control variables. The estimated coefficients are not of direct interest in this investigation, but are used
to insure the comparability of our results to those of other scholars.
National Economic Performance - Data Sources
Average growth and volatility are computed from the Penn World Tables Mark 5.6 (Heston,
Summers, Nuxoll, and Aten 1995). Data on most of the other economic variables come from publicly
available data sets developed by Levine and Renelt 1992. The measure of natural-resource exports as a
percentage of GDP comes from Sachs and Warner 1997, and the data on logged change in terms of trade
is from Bruno and Easterly 1998. This study covers long-run behavior for the period 1974-89 and
baseline data are drawn from 1972-73. Our complete data set includes observations for 119 countries, but
many countries have missing data for one or more variables. The "base model" reported below contains
observations for 108 countries.
15 Primary and secondary school enrollment rates are taken to measure the baseline stock of human capital.
16 The growth models upon which we build are descendants of Harrod-Domar/Solow models that are specified as
multiplicative interactions between capital and labor, each, exponentially weighted. When log-transformed, this
specification is rewritten as an additive model.
18
National Economic Performance: Graphical, Regression, and Robustness Analyses
Figure 1 plots averaged data 1974-89 on growth rates (vertical axis) and growth volatility
(horizontal axis) for 108 countries (all former Soviet bloc countries are excluded), and uses different
symbols for countries depending on level of democracy.17 From Figure 1, one can see that almost all
countries that were highly democratic in 1972-73 are located near the efficient countries' line, 1974-89.
Moderately democratic countries are rather broadly dispersed, but generally have more stable economies
than the non-democracies, and they are no more likely to have slow growth (i.e., average growth <1.0
percent) than are the non-democracies. Non-democracies include both the slowest-growing and the
fastest growing cases (the latter of which are almost all Asian countries). The high volatility countries are
all non-democratic.
Several important observations can be made about the data in Figure 1. First, long-run average
growth rates of 4.0 percent or higher have been rare. Long-run average negative growth has been much
more common. Relative to the lowest-variance cases, the cases that define the efficient countries' line
experienced favorable increases in growth rates relative to increased volatility (i.e., there were more than
proportional gains in growth for the additional gains in volatility). Very few cases, however, are located
at the efficient countries' line past a relatively low level of volatility--there are no cases of increasing
gains associated with increasing volatility after the standard deviation exceeds 5. The more highly
democratic countries in this sample are not distinguished by being "slow," but by being steady.
Sustained, low average and uneven growth is most pronounced among poor, non-democratic states.
National Economic Performance - Regression Results
Does the relationship seen in Figure 1 hold up in a multivariate model? Model 1 in Table 1 is our
17 The countries are grouped in terms of their points on the combined Gastil scales. The most democratic countries
are those that scored a 13 or 14, the least democratic are those that scored 2, 3, or 4. The other groupings represent
pairs of scores: 5-6, 7-8, 9-10, 11-12. The case of Taiwan, which is not included in our estimates below because of
missing data, is omitted from figures 1. If it were included it would be just slightly above the efficient countries'
line.
19
"base" model for risk adjusted growth--the "growth-gap." The signs and levels of significance of the
estimated coefficients of the control variables are broadly consistent with our expectations based
primarily on previous studies of economic growth. Note again that these control variables include the
initial level of wealth, the country's average ability to invest out of income, and its exposure to
international shocks in terms of the import share of GDP. The model appears to perform well from a
statistical point of view. In all estimates, we report Newey-White heteroscedasticity-consistent standard
errors (White 1984).
The estimated coefficient of the level of a nation's democracy (1972-73) is positive and highly
statistically significant. The more democratic a nation in 1972-73, the closer was its subsequent risk-
adjusted growth rate to the performance of the world's leading economies—the smaller its growth gap.
The improvement in performance is quite substantial. The coefficient on baseline democracy (1972-73)
translates into a 66 percent reduction in the size of the mean growth gap due to the difference between no
democracy and maximum democracy measured by the Gastil scale. In short, the cross-sectional
econometric estimates show that the story in Figure 1 is robust to multivariate analysis.
The cross-sectional research design does not allow for any strong conclusions about the
contemporaneous relationship between becoming more democratic and economic performance. The
dynamics of the relationship are better revealed with other methods. It is worth noting, even so, that the
estimates of the contemporaneous relationship are positive and statistically significant in most models we
estimated, consistent with the theoretical position we have developed above.
Robustness Checks
Are these results robust to changes in the conditioning information? Do the results derive from
the "whimsical assumptions," as Leamer 1983 put it, of the investigators? Levine and Renelt 1992
employ cross-sectional regression analysis using Leamer's (1983, 1985) extreme-bounds analysis (EBA)
"to test the robustness of coefficient estimates to alterations in the conditioning information" (Levine and
Renelt 1992, 942-3). We employ it here.
The robustness checks are as follows. We ran numerous regressions, adding each time some

20
other plausible independent variables, to see if the initial level of democracy has a relatively stable
statistical relationship to "growth-gap." The point is to assure that the relationship of interest is not
dramatically affected by the changes in the conditioning information. Table 2 reports the results of these
checks. The results for the initial level of democracy are extremely robust to the sequential inclusion of a
wide range of potential control variables, including measures of the size of government, the rate of
inflation, and the number of revolutions and coups. The democracy results also robust to the inclusion of
dummy variables representing East and Southeast Asia, Sub-Saharan Africa, and Latin America.
Most importantly, the coefficient is robust to the addition of two additional variables describing
the international exposure of the economies and which may be particularly linked to variability in the
economy. The first is the share of primary exports in GDP, and the second is a measure of variability in
change in the terms of trade over the sample period. For various reasons, we suspected that baseline
democracy might not be robust to these controls. The measure of variability in the terms of trade is
available for only about half the countries in our sample. Those countries for which data are available are
significantly more democratic, more wealthy, higher growing, and more stable than those without
observations. In short, this test involved a substantial reduction in variation in both our dependent
variable and in the independent variable of interest. As it turns out, the coefficient on baseline democracy
was significant, and the magnitude was approximately the same.
Model 2 in Table 1 includes simultaneously a wide array of control variables; this may
reasonably be termed the "kitchen-sink" model. Versions of model 2 were used by Levine and Renelt
1992 as strong tests for whether coefficient of the variable of interest is robust to the inclusion of a many
different variables.18 In these data, the estimated coefficient of the initial level of democracy does appear
to be affected by the simultaneous inclusion of such a broad array of variables. The coefficient estimate
of democracy's association with Growth-gap decreased from 12.3 to 7.2. The coefficient estimate,
however, is still positive and statistically significant. Altogether, these tests suggest that the estimated
18 We omit several Levine and Renelt 1992 variables that are collinear with democracy: e.g., CIVIL, which is an
indicator of civil rights, and SOC, which is an indicator of a socialist economy.

21
relationship is broadly robust. In short, base year democracy is strongly associated with subsequent
"efficiency" in economic growth.
Outliers do not drive our results. A concern might arise from the fact (obvious in Figure 1) that
Growth Gap could be large for countries with high growth variance. However, even after dropping
(simultaneously) the 10 highest variance cases and the 10 lowest variance cases, our estimated coefficient
on base-year democracy remains strongly positive, and statistically indistinguishable from the original
estimate. That is, even when we reduce the sample by nearly 20 percent by dropping the cases likely to
have unusual leverage, the estimated coefficient of the democracy variable is positive and statistically
significant.19 Similarly, we excluded all of the most extreme cases of democracy (combined Gastil scale
scores of 14, 13, 3, 2) and the results on democracy were still preserved, again with coefficients that are
statistically indistinguishable from the unconstrained results.
Finally, we omitted from the analysis all OECD member countries and East Asian countries. As
the reader can see from Model 7, Table 2, the parameter estimate is statistically significant, and nearly
identical to that in Model 1.
Comparative Economic Voting
We observe a strong association between democracy and stable growth, and we have some
evidence suggesting that this association is due to voters' risk aversion. One implication of our analysis is
that voters dislike volatility--and certainly dislike volatility that is not accompanied by fairly significant
increases in economic growth rates. An empirical implication of our analysis is that incumbents are
punished by voters for increased economic volatility, and rewarded for decreased volatility. To our
knowledge, scholars have not tested this hypothesis.
We suspect that there is a "selection bias" problem in examining the link between voters and
volatility. As the reader can see from Figure 1, very few democracies are characterized by high volatility
1974-89. To study the effects of volatility on voters, however, we need to study democracies. And it is
our argument, of course, that democracy itself contributes independently to economic stability. We can
22
only look for voter response in settings where voters are allowed to speak--i.e., in democracies. Thus, we
suspect that our proposed selection mechanism results in a sample that is biased against our hypothesis.
If voters reliably punish politicians for volatility, and if politicians anticipate voter response, and
if politicians can moderate instability, then policy-makers will learn to avoid the limits, and to stay
"magically" within them. The graphical evidence from Figure 1 strongly suggests that this anticipation
would be rational. Consequently, we expect that voters have some satisficing rule about country-specific
variability so that they punish "unanticipated" volatility and reward "unanticipated" stability.
The comparative economic voting literature provides us with a relatively well-developed set of
voting models in the peer-reviewed literature. To explore the effects of volatility on voting, we simply
extend the analyses from three recently published studies on comparative economic voting. We believe
this provides a straightforward test of the proposition that voters react negatively to economic volatility.
Does an indicator of volatility or risk-adjusted growth contribute statistically to the analyses of
comparative economic voting? If so, then the plausibility of our basic assumptions about voter risk
aversion should be strongly validated. Moreover, if we are correct about selection bias, this test would be
a very conservative one.
Comparative Economic Voting — Models, Methods, Data, and Regression Results
We have built on comparative economic voting studies by Powell and Whitten 1993, Pacek and
Radcliff 1995, and Wilkin, Haller, and Norpoth 1997.20 For the full details of the analyses, we refer the
19 These and the next referenced results are available from authors upon request.
20 We thank Guy Whitten and Ben Radcliff for providing the data used in their studies, which were invaluable
guides in replicating the data. The original data from the Powell and Whitten 1993 study has been lost, but Prof.
Whitten constructed a very similar data set, from which only the data for Greece and the data to compute "previous
government swing" were unavailable. (Email correspondence, Guy Whitten with (author).) The Wilkins, Haller,
and Norpoth 1997 study contains a data appendix from which we took their data. We used Keesings' Contemporary
Archives to cross-check and validate the data, and, for the PW study, we computed "Previous Government Vote
Swing" from Keesings'. In general, the data for the dependent variables used in the other studies are very close to

23
reader to the respective papers. We report only the details essential to presenting our results.
We operationalize volatility as follows. Volatility enters two different ways, depending on the
definition of the dependent variable specified in these three studies. When, as in the Wilkin, Haller, and
Norpoth 1997 study, the dependent variable is the level of the incumbent (dominant party) vote and no
information is provided about past voting, volatility is entered as the standard deviation of economic
growth over the past five years: i.e., the level of volatility.21 When the model includes a measure of past
incumbent vote share, as with both Powell and Whitten 1993 and Pacek and Radcliff 1995, then volatility
is measured as the difference between the volatility of the most recent five years and the volatility of the
previous five years: i.e. change in volatility.
We also estimate models where we operationalize risk-adjusted growth as the ratio of growth for
the most recent year divided by the volatility for the most recent five years, and use it as an independent
variable.22 This operationalization is similar to the "growth-gap" measure used above. It has the obvious
imprecision that it treats low growth countries with very different degrees of volatility as being similar.23
Nonetheless, this risk-adjusted measure is positively correlated with growth-gap in our cross-sectional
sample, and provides a proxy measure of the joint effect of growth and volatility.
Our hypothesis is that volatility will be negatively associated with votes for incumbents, and that
risk-adjusted growth will be positively associated with votes for incumbents. (Because of the strength of
the theory and results derived above, we will use one-tailed tests to examine volatility.)
Powell and Whitten (1993) used regression analysis to examine 102 elections in 19 advanced
the data used in this study, and the details are available on request.
21 Based on annual data calculated from Penn World Tables 5.6.
22 That is, change in per capita national income, purchasing power party adjusted, for the most recent full year
divided by the standard deviation of growth for the five years ending in the most recent year.
23 For example, the Austrian economy prior to the 1983 election had a risk-adjusted growth of .31, and the Indian
economy prior to the 1971 election had a risk-adjusted growth of .09. Both economies grew at roughly .7%, but the
five year volatility of Austria in 1983 was 2.36, whereas the five year volatility for India was 8.27.

24
industrial nations from 1969-1988. A primary finding of their paper was that the full effects of
comparative economic voting were evidenced only in those countries that were characterized by
democratic institutions that give rise to what they term "clear responsibility" in the minds of voters for
economic policy.24
Powell and Whitten's dependent variable was change in the percentage of the votes in parliament
(or the lower house) for the incumbent party or coalition. The independent variables include the
percentage of the votes won by the parties comprising the incumbent government in the previous election
(i.e., at t-1), the "swing" of the vote toward those parties in the previous election (i.e., (t-1)-(t-2)), various
comparative economic indicators, and a dummy variable for a minority government.
We use their model and very similar data to examine the subsample of countries with "clear
responsibility" for economic affairs,25 to replicate their findings, then add indicators of volatility or risk-
adjusted growth. The results are presented in table 3. Model 1 in table 3 is a replication of Powell and
Whitten 1993, 407, model 2. The adjusted R-square is .22 (compared to .21 in the original), and the
coefficient of comparative growth is .533 (compared to .490) with similar levels of statistical significance.
The other results are broadly similar to those reported by Powell and Whitten 1993, apart from the "right-
wing" interaction terms.
[Table 3 about here]
Model 2 of table 3 includes our volatility change measure (∆Volatility). Its coefficient is negative
(as hypothesized) and statistically significant at the .01 level. The adjusted R-square of the new equation
increased from .22 to .30. Comparative GDP growth remains positive and statistically significant. In
model 3, we add risk-adjusted growth, simultaneously dropping change in volatility and comparative
24 Other scholars refer to this clarity of responsibility as "majoritarianism" (e.g., Freeman 1989.)
25 These countries included Australia, Austria, Canada, France, Great Britain, Ireland, Japan, New Zealand, Sweden,
and the United States. The data for growth and variance are taken from the Penn World Tables, Mark 5.6 (Heston,
Summers, Nuxoll, and Aten 1995), except for data series with the years 1993 or 1994. The growth (per capita, ppp
adjusted) and the associated volatility data for these years are taken from Maddison 1995.

25
GDP growth. This coefficient is also positive and statistically significant (in a one-tailed test) as
expected.
Pacek and Radcliff 1995 present an economic voting study of 51 elections in eight emerging
market economies. The Pacek and Radcliff model uses the level of the incumbent vote as a dependent
variable, and prior vote for the incumbent as an independent variable. In tests reported in table 4, we
examine 43 of these cases, omitting only the cases, all from the 1950s, where the data necessary to
compute change in volatility are unavailable in the Penn World Tables data compendium.
Change in Volatility, once added to the Pacek and Radcliff model, is statistically significant and
correctly signed (model 2), and produces an increase in adjusted R-square over the base model. The
coefficient on risk-adjusted growth (model 3, table 4) is large, but not statistically significant, and the
overall fit in Model 3 is essentially identical to the initial Pacek and Radcliff specification (from Model
1). The results from Model 2 confirm that economic volatility appears to shape the electoral fate of
incumbent governments in both emerging market and advanced industrial nations.
[Table 4 about here]
The Wilkin, Haller, and Norpoth 1997 (WHN) study examined the effects of GDP growth and
logged inflation on the level of support for the dominant party in an incumbent governing coalition. The
WHN sample includes 38 elections in 38 different countries, mixing both developed and developing
cases. The time frame is 1989-1994. In Table 5, model 1, we replicate their results from WHN model 1
(1997, 308), omitting several cases for reasons described in the notes to Table 5. The results are very
similar to the WHN published results.
[Table 5 about here]
In model 2, we add level of five-year volatility to the model. The coefficient on volatility is
negative, as expected, and statistically significant. As in the original WHN model, inflation approaches
statistical significance, with a positive (but "wrong") sign. With volatility added, the explanatory power
of the model increased from an adjusted R-square of .16 to .21. In model 3, we add risk-adjusted growth,
which enters with a coefficient that is positive, as hypothesized, and statistically significant. Volatility

26
matters here too for understanding comparative economic voting. Again, the model with risk-adjusted
growth explains less variance than one with growth and past volatility entered separately.
Unlike both the Powell and Whitten and the Pacek and Radcliff models, the WHN model does
not include any measure of prior coalition vote. As a further experiment, we modified the WHN model
by estimating, for the same sample, a simplified version of the Powell and Whitten model (models 4 and
5). That is, the dependent variable is change in support for the incumbent party (coalition), with the
addition of past vote level for the incumbent party and the previous vote swing for that party, as in Powell
and Whitten 1993. In model 4, we enter change in volatility, which has a negative sign and is highly
statistically significant. Inflation is now statistically significant and properly signed (negative). GDP
growth is no longer statistically significant, and the coefficient has a negative sign. The past level of
incumbent support and the previous vote swing are statistically significant in the analyses. In model 5,
we omit volatility and GDP growth, and add risk-adjusted growth. The resulting coefficient is not
statistically significant and is incorrectly signed.
The evidence for comparative economic presented in Tables 3, 4, and 5 are all consistent, and all
show that prior economic volatility works to the detriment of incumbents. In most cases, the electoral
impact of recent growth diminishes significantly when volatility is added to the model. The simple
additive specification, which seems statistically superior, provides a very pessimistic message for elected
officials--the penalty for increased volatility may make it exceedingly risky to pursue higher growth
policies, if growth and volatility are positively correlated in a particular country. The alternative
specification, of risk-adjusted growth, suggests much less of a penalty for increased volatility, but there is
still a large electoral premium for stable growth.
This link between volatility and voting has not, to our knowledge, been established previously. It
offers a domestic level mechanism for the cross-national phenomenon we observed initially--democracies
exhibit stable growth because voters appear to reward or punish incumbents accordingly.
Conclusion
We proposed here a new way of trying to reconcile the inconsistent empirical and theoretical
27
literature about the relationship between democracy and economic growth. This new way involves
assuming that voters in democracy care about two aspects of their economic life--their prosperity relative
to the past (i.e., growth) and the instability they experience (volatility). Most of the prior research on the
economy and democracy focuses on only one part of this concern--increasing prosperity.
We argued that more democratic systems reflect their more highly developed mechanisms for
reflecting the risk-aversion of citizens. The implication of our analysis is that we should observe a strong,
robust, positive association between democracy and various risk-adjusted measures of economic growth.
We do, in fact, observe a strong, statistically robust, positive association between democracy and risk-
adjusted economic growth. Our findings suggest that there is no systematic increase in growth rates that
accompany the increased risk of "investing" in nondemocratic settings. We also observed strong evidence
that citizens penalize incumbents for uncompensated volatility, and reward them for high rates of stable
growth.
These results point to a new agenda for research on how democratic institutions affect economic
performance. This new agenda would examine economic performance not just in terms of rates, but in
terms of the degree of variability around the trends. In the case of growth, we have proposed that one
straightforward way to do this is in terms of risk-adjusted growth. In further research, scholars should
continue to probe the dynamic relationship between democracy and risk-adjusted growth. We also need
to know much more about the political correlates of economic volatility. Above all, this new agenda will
follow Wittman 1995 in developing the implications of the proposition that democracy is the
economically efficient form of government. It will look to the historical development of democracies and
the way in which volatility has been a factor (distinguishable from prosperity) in electoral outcomes. It
will, of course, seek confirmation of the search for stability in newly democratizing societies. And,
perhaps most important, this agenda will involve the search for better understanding of economic
volatility in the processes "selecting" for and against democracy.

28
References
Alesina, Alberto, and Dani Rodrik. 1994. "Distributive Politics and Economic Growth." Quarterly
Journal of Economics 108 (May):465-90.
Alesina, Alberto, and Roberto Perotti. 1994. "The Political Economy of Growth: A Critical Survey of the
Recent Literature." The World Bank Economic Review 8(September):351-371.
Alexander, Gordon J., and William F. Sharpe. 1989. Fundamentals of Investments. Englewood Cliffs,
N.J.: Prentice-Hall.
Babba, Stephen A. 1997. "Democracies and Inefficiency." Economics and Politics 9(July):99-114.
Barro, Robert J. 1991. "Economic Growth in a Cross-Section of Countries." Quarterly Journal of
Economics 106(May):407-43.
Barro, Robert J., and David B. Gordon. 1983. "Rules, Discretion, and Reputation in a Model of
Monetary Policy." Journal of Monetary Economics 12 (July):101-121.
Barro, Robert J., and Xavier Sala-i-Martin. 1995. Economic Growth. New York: McGraw-Hill.
Baumol, William J., Sue Anne Batey Blackman, and Edward N. Wolff. 1989. Productivity and
American Leadership: The Long View. Cambridge: MIT Press.
Baxter, Marianne, and Urban J. Jermann. 1997. "The International Diversification Puzzle Is Worse Than
You Think." American Economic Review 87(March):170-180.
Blanchet, D. 1991. "Estimating the Relationship Between Population Growth and Aggregate Economic
Growth in Developing Countries: Methodological Problems." In Consequences of Rapid
Population Growth in Developing Countries. New York: Taylor and Francis.
Bollen, Kenneth A. 1993. "Liberal Democracy: Validity and Method Factors in Cross-National
Methods," American Journal of Political Science 37(November):1207-1230.
Bruno, Michael, and William Easterly. 1998. "Inflation Crises and Long-run Growth." Journal of
Monetary Economics 41(February):3-26.
Buchanan, James M., and Richard E. Wagner. 1977. Democracy in Deficit. New York: Academic Press.
Burkhart, Ross E. 1997. "Measures of Democracy: Getting the Story Right." Department of Political

29
Science, Boise State University. Typescript.
Burkhart, Ross E., and Michael S. Lewis-Beck. 1994. "Comparative Democracy - The Economic
Development Thesis." American Political Science Review 88 (December): 903-910.
Clague, Christopher, Philip Keefer, Stephen Knack, and Mancur Olson. 1996. "Property and Contract
Rights under Democracy and Dictatorship." Journal of Economic Growth 1(June):243-76.
Dahl, Robert. 1971. Polyarchy: Participation and Opposition. New Haven: Yale University Press.
Diamond, Larry and Marc F. Plattner, eds. 1996. The Global Resurgence of Democracy. 2nd.
Baltimore: Johns Hopkins University Press
Easterly, William, M. Kremer, Lance Pritchett, and Lawrence H. Summers. 1993. "Good Policy or Good
Luck?" Journal of Monetary Economics. 32(December):459-483.
Erikson, Robert S. 1989. "Economic Conditions and the Presidential Vote." American Political Science
Review 83(June):567-73.
Fagerberg, Jan. 1994. "Technology and International Differences in Growth Rates." Journal of
Economic Literature 32 (September):1147-1175.
Feng, Yi. 1997. "Democracy, Political Stability and Economic Growth." British Journal of Political
Science 27 (July):391-418.
Freedom House. 1990. Freedom in the World: Political Rights and Civil Liberties 1989-90. N.Y.:
Freedom House.
Freeman, John R. 1989. Democracy and Markets. Ithaca: Cornell University Press.
Gastil, Raymond Duncan. 1989. Freedom in the World: Political Rights and Civil Liberties 1988-89. New
York: Freedom House.
Green, William H. 1993. Econometric Analysis 2nd. New York: Macmillan.
Grogger, Jeff and Eric Eide, 1995. "Changes in College Skills and the Rise in the College Wage
Premium." Journal of Human Resources. 30 (Spring):280-310.
Helliwell, John F. 1994. "Empirical Linkages Between Democracy and Economic Growth." British
Journal of Political Science 24(April): 225-248.
30
Heston, Alan, Robert Summers, Daniel A. Nuxoll, and Bettina Aten. 1995. The Penn World Table, Mark
5.6." Data file from National Bureau of Economic Research, [email protected].
Ingersoll, Jonathan E. 1987. Theory of Financial Decision Making. New York: Rowman and Littlefield.
Jaggers, Keith and Ted Robert Gurr. 1996. Polity III: Regime Type and Political Authority, 1800-1994.
Inter-University Consortium for Political Research. Study number 6695.
Kahneman, Daniel and Amos Tversky. 1990. "Prospect Theory: An Analysis of Decision Under Risk."
In Rationality in Action, Paul K. Moser, ed. New York: Cambridge University Press.
Keesings' Contemporary Archives. Various Years. London: Keesings' Ltd.
Kearney, Robert N. 1983. "The Political Party System of Sri Lanka." Political Science Quarterly
98(Spring):17-33.
Keech, William R. 1995. Economic Politics: The Costs of Democracy. New York: Cambridge
University Press.
Knack, Stephen and Phillip Keefer. 1997. "Does Inequality Harm Growth Only in Democracies? A
Replication and Extension." American Journal of Political Science 41 (January):323-332.
__________. 1995. "Institutions and Economic Performance: Cross-country Tests Using Alternative
Institutional Measures." Economics and Politics 7 (November):207-227.
Kormendi, Roger C. and Philip C. Meguire. 1985. "Macroeconomic Determinants of Growth: Cross
Country Evidence." Journal of Monetary Economics 16(September):141-163.
Leblang, David. 1997. "Political Democracy and Economic Growth: Pooled Cross-Sectional and Time-
Series Evidence." British Journal of Political Science 27(July):453-472.
Leamer, Edward. 1983. "Let's Take the Con out of Econometrics." American Economic Review
73(March):31-43.
Leamer,Edward. 1985. "Sensitivity Analysis Would Help." American Economic Review 75(June):308-13.
Levine, Ross, and David Renelt. 1992. "A Sensitivity Analysis of cross-country Growth Regressions."
The American Economic Review 82 (September): 942-63.
Lewis-Beck, Michael. 1988. Economics and Elections: The Major Western Democracies. Ann Arbor:

31
U. Michigan Press.
Lipset, Seymour Martin. 1960. Political Man. New York: Doubleday.
Maddison, Angus. 1994. Monitoring the World Economy. Paris: OECD Development Center.
Nordhaus, W. 1975. "The Political Business Cycle." Review of Economic Studies 42(April):169-190.
North, Douglass C. 1989. "Institutions and Economic Growth: An Historical Introduction." World
Development 17 (September):1319-1332.
Olson, Mancur. 1982. The Rise and Decline of Nations. Yale U. Press.
Pacek, Alexander, and Benjamin Radcliff. 1995. "The Political Economy of Competitive Elections in the
Developing World." American Journal of Political Science 39 (August):745-759.
Page, Benjamin I., and Robert Y. Shapiro. 1993. The Rational Public. Chicago: U. of Chicago Press.
Pastor, Manuel, and Jae Ho Sung. 1995. "Private Investment and Democracy in the Developing World."
Journal of Economic Issues 29 (March):223-243.
Persson, Torsten, and Guido Tabellini. 1994. "Is Inequality Harmful for Growth?" The American
Economic Review 84 (June): 600-21.
Pourgerami, Abbas. 1992. "Authoritarian versus Non-authoritarian Approaches to Economic
Development: Update and Additional Evidence." Public Choice 74(October):365-377.
Powell, G. Bingham, Jr., and Guy D. Whitten. 1993. "A Cross-National Analysis of Economic Voting:
Taking Account of the Political Context." American Journal of Political Science 37:391-414.
Przeworski, Adam. 1991. Democracy and the Market. New York: Cambridge University Press.
Przeworski, Adam, and Fernando Limongi. 1993. "Political Regimes and Economic Growth." Journal of
Economic Perspectives 7 (Summer):51-69.
Przeworski, Adam, Michael Alvarez, Jose Antonio Cheibub, and Fernando Limongi. 1996. "What Makes
Democracies Endure?" Journal of Democracy 7 (January):39-55.
Remmer, Karen L. 1995. "New Theoretical Perspectives on Democratization." Comparative Politics
(October): 103-122.
Riker, William H. and David L. Weimer. 1993. "Economic & Political Liberalization of Socialism: The
32
Fundamental Problem of Property Rights." Social Philosophy & Policy 10(Summer):79-102.
Roper Center. 1998. Public Opinion Online. (Accession through Lexis•Nexis.)
Rostow, W. W. 1960. The Stages of Economic Growth. New York: Cambridge University Press.
Sachs, Jeffrey D., and Andrew M. Warner. 1997. "Fundamental Sources of Long-Run Growth."
American Economic Review: Papers and Proceedings 87(May):184-188.
Scully, Gerald W. 1992. Constitutional Environments and Economic Growth. Princeton: Princeton.
______ 1997. “Rule and Policy Space and Economic Progress.” Public Choice 90(March):311-324.
Sharpe, William F. 1970. Portfolio Theory and Capital Markets. New York: McGraw-Hill.
Sirowy, Larry, and Alex Inkeles. 1990. "The Effects of Democracy on Economic Growth and Inequality:
A Review." Studies in Comparative International Development 25 (Spring): 126-157.
Stimson, James A., Michael B. MacKuen, and Robert S. Erikson. 1995. "Dynamic Representation."
American Political Science Review 89 (September):543-565.
Wallace, Edward and Stephen West. 1982. Roads to Geometry. Englewood Cliffs, N.J.: Prentice Hall.
Weede, Erich. 1996. "Legitimacy, Democracy, and Comparative Economic Growth Reconsidered."
European Sociological Review 12 (December) :217-225.
White, Halbert. 1984. Asymptotic Theory for Econometricians. New York: Academic Press.
Wilkin, Sam, Brandon Haller, and Helmut Norpoth. 1997. "From Argentina to Zambia: a World-Wide
Test of Economic Voting." Electoral Studies 16(September):301-316.
Wittman, Donald. 1989. "Why Democracies Produce Efficient Results." Journal of Political Economy
97 (December): 1395-1424.
Wittman, Donald. 1995. The Myth of Democratic Failure: Why Political Institutions are Efficient.
Chicago: University of Chicago Press.
The World Bank. 1993. The East Asian Miracle: Economic Growth and Public Policy. New York:
Oxford University Press.
The World Bank. 1997. The State in a Changing World, 1997. New York: Oxford University Press.

33
Table 1: Democracy Is a Robust Determinant of Economic Growth as Measured by the "Growth Gap"
Model 1
(Basic Model)
Model 2
VariableGrowth Gapregressioncoefficient
(std. err)Growth Gapregressioncoefficient
(std. err)
Initial GDP per capita (log) -2.022 (1.147) -3.637** (1.320)
Investment Share (log) 6.283* (2.517) 0.8844 (2.550)
Secondary-School enrollment 3.665 (5.626) 1.832 (5.086)
Primary-School enrollment -1.063 (2.810) 2.364 (3.183)
Population Growth (log) -2.392* (0.976) -1.830* (0.813)
Imports as % of GDP (log) -3.200** (1.336) -4.229** (1.506)
Index of Democracy, 1972-73
(Gastil Index)12.267** (3.376) 7.176* (3.463)
Change in Democracy, 1974-89 13.464** (4.337) 6.199 (4.520)
Gov. Expenditures as % GDP 13.709 (15.313)
Growth of Government Share -0.149 (0.216)
Revolutions/coups -4.143 (2.971)
Africa dummy -6.927** (1.861)
Latin America dummy -5.318* (1.758)
Growth of domestic credit 0.0097 (0.023)
Stand. Deviation of domestic credit -0.0080 (0.014)
Export-share growth -0.331* (0.156)
Intercept -2.138 (9.269) 4.685 (9.567)
Adj. R2 .41 .62Observations 108 91
*0.05>p-value>0.01; **p-value<0.01
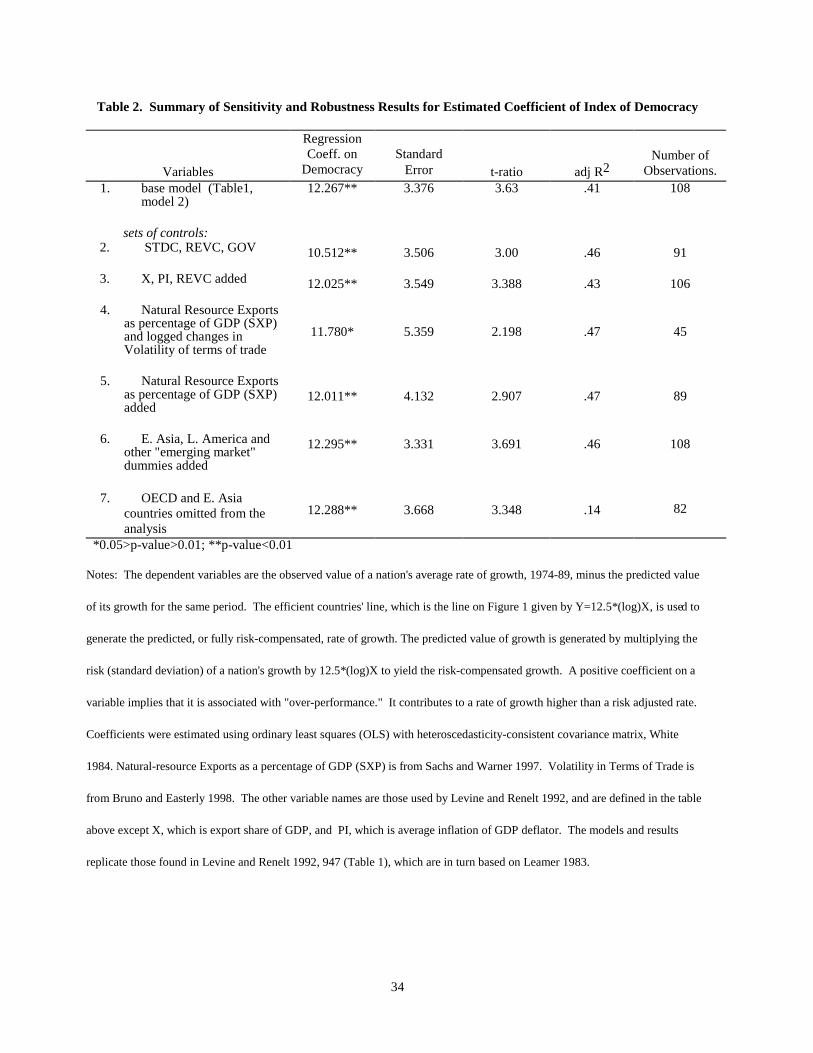
34
Table 2. Summary of Sensitivity and Robustness Results for Estimated Coefficient of Index of Democracy
Variables
RegressionCoeff. on
DemocracyStandard
Error t-ratio adj R2Number of
Observations. 1. base model (Table1,
model 2)
sets of controls:2. STDC, REVC, GOV
3. X, PI, REVC added
4. Natural Resource Exportsas percentage of GDP (SXP)and logged changes inVolatility of terms of trade
5. Natural Resource Exportsas percentage of GDP (SXP)added
6. E. Asia, L. America andother "emerging market"dummies added
7. OECD and E. Asiacountries omitted from theanalysis
12.267**
10.512**
12.025**
11.780*
12.011**
12.295**
12.288**
3.376
3.506
3.549
5.359
4.132
3.331
3.668
3.63
3.00
3.388
2.198
2.907
3.691
3.348
.41
.46
.43
.47
.47
.46
.14
108
91
106
45
89
108
82
*0.05>p-value>0.01; **p-value<0.01
Notes: The dependent variables are the observed value of a nation's average rate of growth, 1974-89, minus the predicted value
of its growth for the same period. The efficient countries' line, which is the line on Figure 1 given by Y=12.5*(log)X, is used to
generate the predicted, or fully risk-compensated, rate of growth. The predicted value of growth is generated by multiplying the
risk (standard deviation) of a nation's growth by 12.5*(log)X to yield the risk-compensated growth. A positive coefficient on a
variable implies that it is associated with "over-performance." It contributes to a rate of growth higher than a risk adjusted rate.
Coefficients were estimated using ordinary least squares (OLS) with heteroscedasticity-consistent covariance matrix, White
1984. Natural-resource Exports as a percentage of GDP (SXP) is from Sachs and Warner 1997. Volatility in Terms of Trade is
from Bruno and Easterly 1998. The other variable names are those used by Levine and Renelt 1992, and are defined in the table
above except X, which is export share of GDP, and PI, which is average inflation of GDP deflator. The models and results
replicate those found in Levine and Renelt 1992, 947 (Table 1), which are in turn based on Leamer 1983.
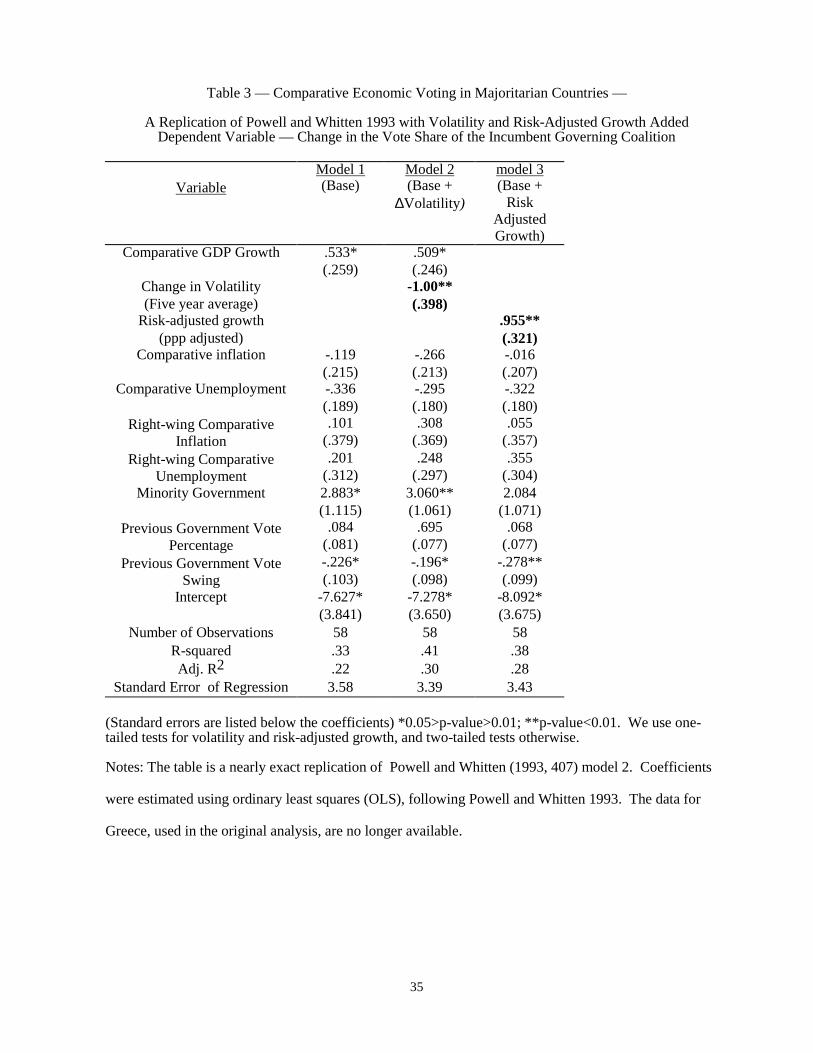
35
Table 3 — Comparative Economic Voting in Majoritarian Countries —
A Replication of Powell and Whitten 1993 with Volatility and Risk-Adjusted Growth AddedDependent Variable — Change in the Vote Share of the Incumbent Governing Coalition
VariableModel 1(Base)
Model 2(Base +
∆Volatility)
model 3(Base +
RiskAdjustedGrowth)
Comparative GDP Growth .533*(.259)
.509*(.246)
Change in Volatility(Five year average)
-1.00**(.398)
Risk-adjusted growth(ppp adjusted)
.955**(.321)
Comparative inflation -.119(.215)
-.266(.213)
-.016(.207)
Comparative Unemployment -.336(.189)
-.295(.180)
-.322(.180)
Right-wing ComparativeInflation
.101(.379)
.308(.369)
.055(.357)
Right-wing ComparativeUnemployment
.201(.312)
.248(.297)
.355(.304)
Minority Government 2.883*(1.115)
3.060**(1.061)
2.084(1.071)
Previous Government VotePercentage
.084(.081)
.695(.077)
.068(.077)
Previous Government VoteSwing
-.226*(.103)
-.196*(.098)
-.278**(.099)
Intercept -7.627*(3.841)
-7.278*(3.650)
-8.092*(3.675)
Number of Observations 58 58 58R-squared .33 .41 .38Adj. R2 .22 .30 .28
Standard Error of Regression 3.58 3.39 3.43
(Standard errors are listed below the coefficients) *0.05>p-value>0.01; **p-value<0.01. We use one-tailed tests for volatility and risk-adjusted growth, and two-tailed tests otherwise.
Notes: The table is a nearly exact replication of Powell and Whitten (1993, 407) model 2. Coefficients
were estimated using ordinary least squares (OLS), following Powell and Whitten 1993. The data for
Greece, used in the original analysis, are no longer available.

36
Table 4 — Economic Voting in the Developing World —
A Replication of Pacek and Radcliff 1995 with Volatility and Risk-Adjusted Growth AddedDependent Variable — Level of the Vote Percentage of the Governing Coalition
VariableModel 1Level of
Votes (BaseModel)
Model 2Level of
Votes (Base+
∆Volatility)
Model 3Level of
Votes (Base+ Risk-
AdjustedGrowth)
Growth (per capita PPPadjusted)
.882(.518)
.652(.496)
Change in Volatility(Five year average)
-.671*(.295)
Risk-adjusted growth(ppp adjusted)
2.159(1.423)
Growth x growth dummy -.881(.772)
-.714(.728)
-.334(.541)
Previous Government VotePercentage
.306(.209)
.398*(.198)
.348(.209)
Election Follows Irregularity -2.388(4.339)
-3.254(4.090)
-2.928(4.369)
Previous Government VoteSwing
Intercept 24.438*(8.818)
21.080*(8.407)
22.101*(8.740)
Number of Cases 43 43 43R-squared .77 .81 .77Adj. R2 .69 .73 .68
Standard Error of Regression 6.54 6.13 6.59
Standard errors are listed below the coefficients. *0.05>p-value>0.01; **p-value<0.01We use one-tailed tests for volatility and risk-adjusted growth, and two-tailed tests otherwise.
Notes: The table is a replication of Pacek and Radcliff (1995, 752). As in Pacek and Radcliff 1995,
coefficients were estimated using ordinary least squares (OLS) with country dummies (not reported). The
data for elections in the 1950s are omitted because of the unavailability of data for change in volatility.

37
Table 5 — Comparative Economic Voting from Argentina to Venezuela —
A Replication of Wilkin, Haller, and Norpoth 1997 with Volatility and Risk-Adjusted Growth AddedDependent Variable — Level of (or Change in) the Vote Share of the Largest Governing Party
VariableModel 1Level of
Votes (BaseModel)
Model 2Level of
Votes (Base+ Volatility)
Model 3Level of
Votes (Base+ Volatility)
Model 4Change in
Votes (Base,past voting +∆Volatility)
model 5Change in Votes
(Base, past voting +Risk Adjusted
Growth)Log of Inflation 3.264
(2.578)5.391
(2.795)2.033
(2.544)-4.815*(2.403)
-3.926(2.354)
GDP Growth 1.523**(.529)
1.314*(.529)
-.341(.592)
Volatility (Five year average) -1.921*(1.125)
Change in Volatility(Five year average)
-2.221**(.956)
Risk-adjusted growth(ppp adjusted)
2.047**(.772)
-.481(.800)
Previous Government VotePercentage
.456*(.176)
.609**(.169)
Previous Government VoteSwing
-.027**(.009)
-.019*(.0008)
Intercept -27.440**(3.246)
30.950**(3.762)
29.477**(2.985)
-15.908*(5.982)
-22.529*(5.793)
Number of Cases 34 34 34 33 33R-squared .21 .28 .19 .55 .47Adj. R2 .16 .21 .14 .47 .39
Standard Error of Regression 9.31 9.03 9.66 8.27 8.85
Standard errors are listed below the coefficients. *0.05>p-value>0.01; **p-value<0.01We use one-tailed tests for volatility and risk-adjusted growth, and two-tailed tests otherwise.
Notes: The table is a replication of Wilkin, Haller, and Norpoth (1997, 308) model 1. Coefficients were
estimated using ordinary least squares (OLS). The data for Ecuador and Malta, used in the original
analysis, are either unavailable or unreliable. Mexico, used in the original analysis, is excluded because
of its —3 score on the summed autocracy/democracy index from Polity III. (See Jaggers and Gurr 1996;
Burkhart 1997.) The incumbent party vote total for 1991 Zambian election is excluded because Zambia's
autocracy/democracy score moved from —9 to +6 in 1991. The data for previous government vote swing
are unavailable for Cyprus, and that case is dropped in models 4 and 5. (The results from models 1-3 are
consistent, with or without data for Cyprus.)

Figure 1. Growth Rates and Growth Volatility, 1974-89, By Level OfDemocracy
-6
-4
-2
0
2
4
6
8
1 10 100Growth Volatility (Standard Deviation)--Log Scale
Growth Rate Average
Most Democratic
Least Democratic

Democracy and National Economic Performance:
The Search for Stability
Dennis P. QuinnProfessor
School of BusinessGeorgetown UniversityWashington, DC 20057
John T. WoolleyProfessor
Political Science DepartmentUniversity of California, Santa Barbara
Santa Barbara, CA [email protected]
17 June 1998
We acknowledge gratefully the generous support of the National Science Foundation (SBR-9729766, SBR-9810410,and SBR-9730403), as well as funding from the Graduate School of Arts and Sciences of Georgetown University,and the Academic Senate of the University of California, Santa Barbara. The authors wish to thank Ross Burkhartand Michael Lewis-Beck for making available their coding of the Freedom House democracy data; Guy Whitten andBen Radcliff for making their economic voting data sets available; Bonnie Field, David Glass, and Wesley Joe forexcellent research assistance; and Joan Murdoch and Steven Velasco of the UCSB Social Science ComputingFacility for help in acquiring several data sets from ICPSR. Thomas Schrock, Jim Bodurtha, John Freeman, CarlaInclán, Bardia Kamrad, Catherine Langlois, Manny Pastor, Dan Philpott, Peter Rosendorff, Pietra Rivoli, AkhtarSiddique, and Maria Toyoda each offered valuable comments and criticisms. Earlier versions of the paper werepresented at the 1996 Annual Meeting of the American Political Science Association Convention, San Francisco, the1997 Summer Research Workshop series at Georgetown, and the Macroeconomics Workshop at the World Bank.We thank the seminar participants at each institution. All errors are our own._