demand funnel reporting - "how it is made"
TRANSCRIPT

Host:David LewisCEO & FounderDemandGen International, Inc.
Guests:Drew NoelAccount DirectorDemandGen
Augusto BisdaSolutions ArchitectDemandGen
“HOW IT’S MADE: DEMAND FUNNEL REPORTING (DFR)”

Key Inventory Stages and Activities
CustomerInquiryMarketing Qualified
Sales Accepted &
Working
SuspectPool
Sales
Qualified
Opportunity
Education PurchaseInterest JustifyAwareness
Marketing generates interest
Marketing further
nurtures and scores
Lead development pre-qualifies
Sales facilitates
buying process
Opportunity Closes
Sample Demand Funnel

Why the Demand Funnel Record?
• Sales has long had detailed and cohesive metrics that can easily be tracked.
• We believe Marketing should have similar metrics in order to understand and predict the quality and contribution of their leads and the impact that they have on the process.
• To take this further, Marketing and Sales should be able to operate off of a shared view of the process and the funnel.

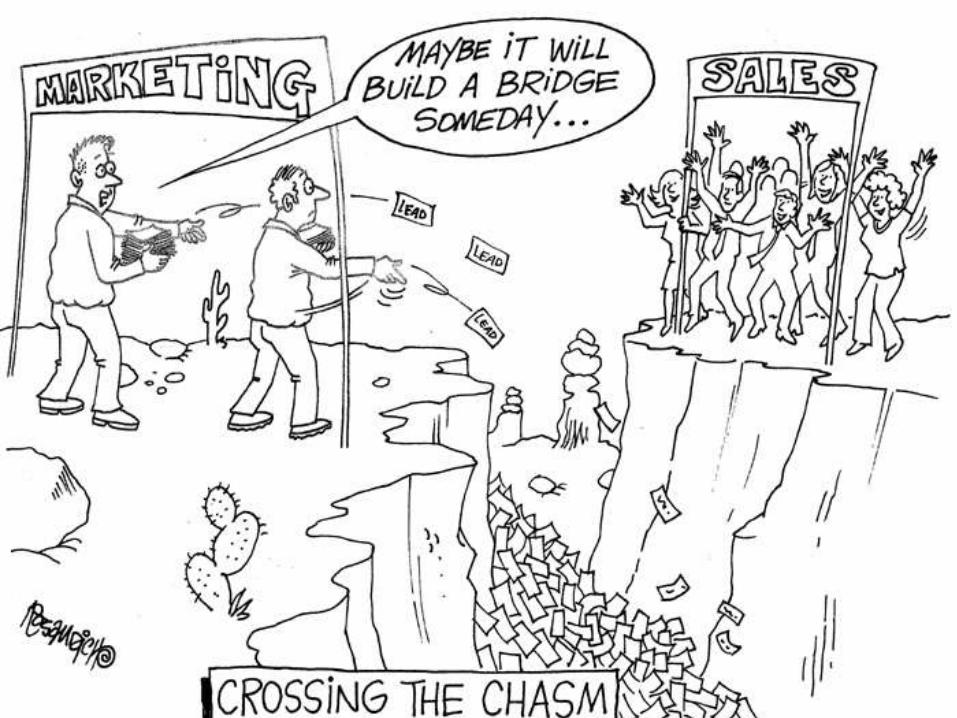
The Power of Factory Thinking
Sales and marketing should now view demand generation, not as a series of disjointed activities and one & done
campaigns, but as a unified set of processes — a specialized kind of factory
— that consistently and predictably “manufactures” demand.

• Track progress thru and within the funnel
• Understand current inventory and know how fast leads and opportunities are moving.
• Evaluate which campaigns or offers are driving conversion
• Track first-touch, last-touch, x-touch. Access historical data.
• Measure ROI
• Evaluate opportunities created and closed won revenue.
The Demand Funnel Record: Goals

Funnel Reporting

What’s in your funnel?
341 : 23%
138 : 9%
115: 8%
107: 7%

Current Inventory Levels?
341 : 23%
138 : 9%
115: 8%
107: 7%

Your funnel doesn’t have 100% conversion…

Where are they going?

Where did they go in the end?

How fast are leads moving through the funnel?

Conversion Velocity?

Source Reporting

Turning Data into Decisions
Campaign
Channel
Activity
Content
Lead Source
Lead Score

Nurturing Through The Funnel

What content drove inquiry conversion?

What drove MQL conversion?

What drove SAL conversion?
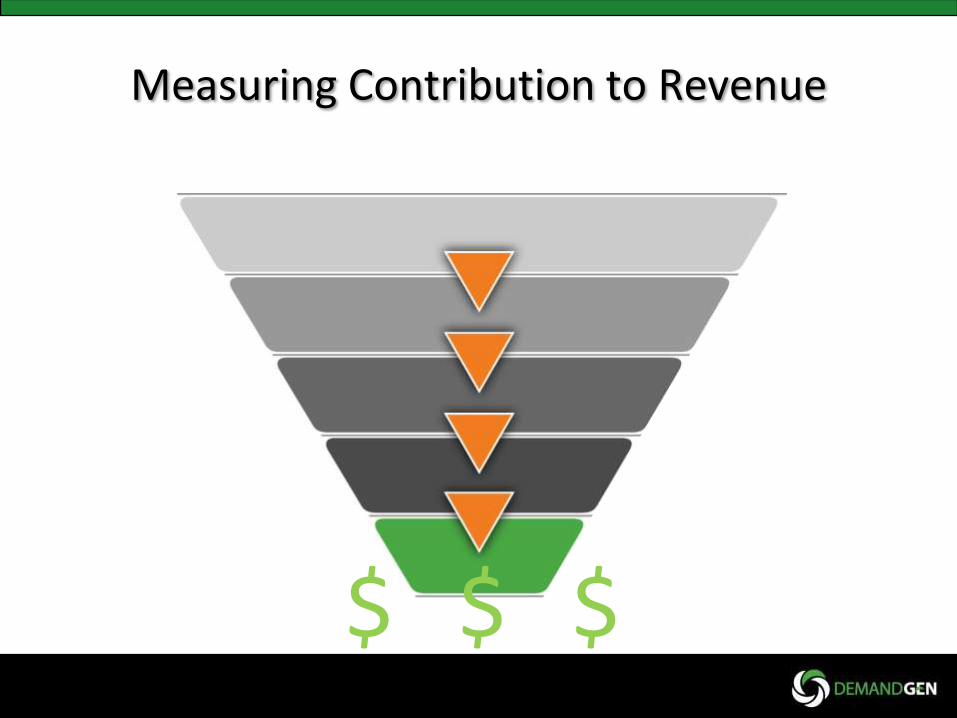
Measuring Contribution to Revenue
$ $ $

What lead sources are generating revenue?

Which offers are driving revenue and when?

How does it work?

Where does it all come together?

• Centralized Cross-Object Reporting
• 1 Record. No object hierarchy. Allows for reporting and connection of data at all levels of the funnel.
• Funnel History and Conversion• Allows for reporting and metrics otherwise only
available via BI solutions.
• Facilitates Process and Prevents Data Loss
• Specific architecture allows for sales to convert leads but also pull back later opportunity creation.
The Demand Funnel Record

Questions?