demand for transport and production systems – … · available at a given time in order to be...
TRANSCRIPT
1
DEMAND FOR TRANSPORT AND PRODUCTION SYSTEMS – SHIPP ER SURVEYS IN FRANCE IN 1988 AND 2004
Michèle Guilbault, Elisabeth Gouvernal, Martin Soppé
INRETS-SPLOT, France INTRODUCTION
Freight transport is closely linked to the industrial and commercial activities of which it is a by-product, and may even constitute a fully integrated component of the production process. The litterature dealing with these logistical aspects is abundant1. It suggests new “integrated demand” paradigm considering transport as a system whose efficiency lies in its capacity of adaptation to a complex demande. Understanding transport and how it changes therefore depends to a large degree on understanding transport demand and requires the ability to understand the constraints that affect shippers and the decisions they make which are responsible for the production of freight. The European Union’s desire to decouple the economic level of production from transport volume means, in particular, that we should give thought to organizational models for the production system and economic development decisions. However, there is little data which allows us to analyze the relationship between transport and the industrial production system and its logistical determinants. To overcome this, two national shipper surveys were conducted in France in 1988 and then in 2004 in which shippers were interviewed about their production constraints and transport practices. These surveys also aimed to provide a comprehensive description of transport chains based on the door-to-door tracking of each shipment from the shipper to the final consignee. But traditional transport statistics, whether from France or the rest of Europe, are mainly based on data collected from carriers about the modes and vehicles used for transport legs, and do not allow us to see how these legs are linked and perceive the increasing complexity of transport chains. Single leg transport in which goods are carried by a single vehicle throughout their journey is less and less the dominant model. The characteristics of demand, and, in particular, the increasingly small weight of shipments have encouraged the development of networks which concentrate flows. The transport chain, within a given mode, involves several legs and passing through intermediate hubs where freight is consolidated and broken up, and increasingly frequently, where additional logistical services linked to stock management, packaging or the final preparation of the products are performed. The profession of carrier is becoming more diversified, and requirements with regard to quality of service, reliability and flexibility are becoming more pressing. Environmental and energy concerns are also militating towards greater intermodality and here too we need to be aware of the links between the different transport modes and the way they can supplement one another.

2
Reconstructing transport chains using precisely identified shipments can also allow us to show the complexity of the organizations that are put in place and link them to precise demand characteristics imposed upstream by the shipper’s production system. This paper will describe the principal characteristics and methodological features of these two national surveys, and the main changes made in the new 2004 survey (renamed ECHO) before presenting some of important findings concerning the structural changes that occurred between the two surveys. 1. METHODOLOGICAL CHOICES 1.1 Choice of the shipment as a transport measureme nt unit The use of the shipment as a transport measurement unit in addition to the conventional units of tonnes or tonne kilometres is an original feature of these surveys. The shipment is defined as a quantity of freight that is made available at a given time in order to be transported during a single transport operation from a given shipper to a given consignee and is the natural observation unit for reconstructing transport chains. However, this unit also has conceptual advantages (Gouvernal, Hanappe 1989). The shipment is the link between the shipper and the consignee. Likewise it is a representation of transport closely integrated with the production and distribution process and allows us to know the economic context of the exchange of goods. In addition, it provides us with a better perception of the practices of shippers and the logistical constraints that affect them. Shippers develop their transport policy not only on the basis the tonnages they produce but also the number and spatial dispersion of their clients and the frequency at which they send out shipments. There is a great difference between sending 1,000 tonnes of freight to a single consignee or 1,000 shipments of 1 tonne at different times to different consignees. The number of tonnes, and perhaps even the number of tonne-kilometres generated are the same, but the economic rationale and the type of transport differ in every respect. Likewise, while it is of course true that carriers have to deal with tonnes and tonne kilometres in a very concrete manner, they are also faced with physical units which they must route on given links with precise deadlines and specifications. By using the shipment as an observation unit, we are able to observe the activity of carriers in terms of the number of operations they perform. Doing so provides a picture of the population of carriers which is close to that based on the total turnover of transport firms. The results from these surveys thus allow us to use a variety of measurement units, not only the classical ones of the number of tonnes or tonne kilometres but also the number of shipments or the number of shippers responsible for the flows in question. Passing from one or other of these units is highly instructive and provides an understanding of the market which is markedly different depending on the unit which is preferred: the relative weight of the different sectors of activity in the generation of traffic changes completely, as do the transport modes (Guilbault, 1994).
3
1.2 The scope of the survey and sampling The 1988 shipper survey covered 1,742 firms and tracked 5,118 shipments including 4,893 for which we were able to reconstruct the transport chain as far as the final consignee or the French border in the case of international shipments. The diversity of the logistical situations and the dispersion of the reweighting variables for the numbers of tonnes and shipments led us to markedly increase the size of the sample and at the same time the reconstruction of transport chains was extended in the case of international shipments to the borders of the former 15 member European Union. The 2004 ECHO survey was thus based on the observation of 2,935 shippers and 10,462 shipments, of which 24% were international, and 9,742 transport chains. Both surveys covered all sites with 10 or more employees in the wholesale trading and industrial sectors, apart from mining and building and construction, and this scope was extended in the second survey to include mail-order companies, farm cooperatives, warehousing services and industrial waste treatment centres, i.e. a total population of the order of 70,000 sites spread over the entire territory of metropolitan France with an average sampling rate of 4%. These characteristics of the survey scope also had important effects on the traffic that was measured insofar as they excluded almost all large bulk shipments of raw intermediate goods (raw oil products, solid mineral fuels, ores and minerals, raw construction materials such as sand and gravel) as well as a large proportion of agricultural products. These types of products were only covered by the survey through wholesale and intermediary traders. Nevertheless, a large range of sectors was covered, in particular those undergoing the most rapid change. In terms of national transported tonnages (national shipments and part of export transport which is within the national territory) this scope represented in 2004 approximately 47% of total tonnage and 84% of the total tonnage other than the large bulk shipments mentioned above. Another characteristic of the survey scope relates to the choice of shipments that are surveyed. It was decided to consider all freight shipments with no other limit than a minimum weight of 1kg. The selection of this very low threshold was very beneficial as it enabled us to highlight the very large number of small shipments which are an important aspect of the modern economy. On the other hand, it was responsible for a large amount of methodological discussion, as the frequency and size of shipments are closely linked and the decision made in 1988 to include the last 3 shipments sent out in the case of each site led to samples with a very low proportion of heavy shipments, making data reweighting difficult. The attempt was therefore made in the new survey to increase the representation of heavy shipments and, more generally, modes other than the road, for which the road’s dominance made it very difficult to obtain a sufficient number of observations. A two-stage sampling plan was designed for the survey. The first stage was to perform a random sampling of the sites using the SIRET complete database of firms held by the INSEE2. As in 1988, stratification was performed on the

4
basis of a detailed breakdown according the site’s activity and size with the application of sampling rates that increased with the size of firms (based on the hypothesis that the number of shipments sent by a firm is proportional to its size) but also by providing an initial over-representation of firms of the type that are the most likely to use modes other than the road (on the basis of size, activity and location). The second stage involved the census of the last 20 shipments dispatched, by all modes, by the firms on the basis of which probabilistic sample selection of the shipments in the survey was performed, also with a view to obtaining an over-representation of shipments in the desired categories while retaining a representative sample and the ability to perform data reweighting. In addition, the procedure was consolidated by an additional census of the last shipment sent during the last three months by each of the non-road modes by selecting the “forced” shipments very few of which are present in the reweighted samples but which allowed us to increase the size of the samples in order to conduct more qualitative analyses.
These over-representation procedures gave a better representation of non-road modes3 in particular in the case of sea and air shipments each of which accounted for roughly 8 or 9% of the shipments in the survey. However, the difficulty is greater in the case of rail shipments which are extremely concentrated amongst the small number of firms for which the level in the final sample was below what was desired, rail shipments accounting for approximately 2 to 3% of the total and combined rail/road shipments for between 1 to 2%. The proportion of waterway shipments remained very low, 70 shipments and can hardly be used for anything other than a monographic approach.
1.3 Structure of the survey and reconstruction of t he transport chains
Figure 1: Structure of the survey
The same structure, which contained five principal modules, was used for both surveys. The first module consisted of sending a letter to the selected
5
firms with a paper “pre-interview” questionnaire dealing with the main figures concerning the volumes and structure of the traffic for which the respondents might have had to refer to documents. These questionnaires were then recovered and if necessary missing information was added during the main “face-to-face” CAPI4 interview with a senior economist in the firm. A great deal of information was collected at this level (the “firm” questionnaire) which describes the economic and industrial characteristics of the firm and its economic environment with reference to its partners and its transport and logistics policy. This data was supplemented by the census of the firm’s most recent shipments and the selection of shipments which were subjected to more detailed study, 3 per firm in the general case, rising to 6 in the case of the largest firms (1,000 or more employees) or the users of “rare” non-road modes who were willing to be interviewed a second time six months later. This last part of the survey covered the “shipment” questionnaires. It dealt with the description of the physical and economic characteristics of the shipments and the economic ties between the shipper and the customer. The questions also related to the conditions of trade, particularly in terms of deadlines and transport organization: how are the costs distributed, who makes the decisions and on the basis of what criteria? Specific maritime and air questionnaires were also used to describe the terrestrial routing in greater detail as well as the criteria used to choose ports and airports.
The first modules therefore contained most of the information used to examine the relationship between the shippers’ production systems, the characteristics of their shipments and the associated transport constraints. The structure of questioning was conventional and raised few methodological problems. The real difficulty was the reconstruction of the transport chains. Most shipper surveys as The U.S. Commodity Flow Survey (Holguin-Veras, 2007) simply asked shippers to state what modes they use. However, this approach was not compatible with the level of detail required to represent the complexity of transport operations as test surveys had shown that shippers have quite poor knowledge of the concrete conditions of transport for their shipments. The difference between the number of multi-leg chains that were reconstructed and the number described by shippers is instructive in this regard: these amount to 30% according to the shippers, and 60% according to our observations. The use of subcontracting in a chain or the use of combined rail-road transport, which are both mainly chosen by carriers, are examples of forms of organization about which shippers are usually quite unaware. The methodological choice therefore consisted of interviewing all those involved: the shipper, but also the consignee, and the logistical or transport operators involved in organizing or conducting the transport of the shipment and the associated logistical services.
The first information for reconstructing the transport chain was thus collected during the main interview with the shipper in which the consignee of the shipment was identified and the shipper was questioned about the transport services and operations that were performed on own account or by a third party, which was identified to be interviewed in its turn. The interviews with these third parties were conducted by telephone and not face-to-face and varied according to the nature of the third party: consignee, maritime or air

6
operator, land carrier or transport agents… These interviews were necessarily fairly short and concerned the economic characteristics of the firms (activity, status, size, location), as well as some more specific details about their activity. They all cover the services performed and the links of the third party with the shipper, the consignee or the principal i.e. the ententity that awards the contract for the services asked. When it emerged that the third party had placed some or all of the shipment in the hands of another operator, this was identified and interrogated thereby permitting full reconstruction of the transport chain using a contactor – contactee approach in which each party that we called “operator” was questioned about what it had actually done, not what it thought had been done.
The “leg” questionnaires constitute the last module. These questionnaires were filled in by all operators who performed the transport service, except in the case of rail journeys where it was not possible to question the rail operators directly so the main characteristics were provided by the principal. Another exception was freight transport performed by the major parcel carriers for which the journeys were reconstructed using the Internet tracking tools placed at the disposal of clients. The transport service was broken down in these leg questionnaires into the modes, vehicles or halts which were required to process the goods. This data was used to identify the intermediate transit points and the services performed at them and provide more details about the leg (rounds, preference for road or motorway, passage through an Alpine tunnel, dead head runs…) and to reconstruct the distances, journey times and transit times. They also related to the modes and vehicles used, loading rates in terms of weight and volume, and the characteristics which are important for calculating relative energy expenditure.
Figure 2: Principal data collected
7
2. INDICATORS OF STRUCTURAL CHANGE The collected data constitute large body of material which allows us to analyze the link between the production system and the transport system from varying standpoints and in very great detail, opening the way for a large amount of research (Guilbault and alii, 2008). We will now present some findings which highlight the major structural and logistical changes observed over the period 1988-2004 which demonstrate the value of using the shipment as a measurement unit in addition to tonnes.
2.1 The spatial and temporal fragmentation of flows
One of the main findings to emerge from these surveys is without doubt the increasing fragmentation of flows, as shown by the fact that the number of shipments has increased more rapidly than the number of tonnes: between 1988 and 2004 there was a 77% increase in shipments for the entire scope of the study and a 54% increase in the number of tonnes. Transport flows appear to be more fragmented in terms of space and time. On the one hand, the productive fabric is more dispersed with an ever rising number of small firms and an increase in intermediary activities and networking relationships, leading to flows which are more dispersed geographically. On the other hand, the logistical practices of firms are changing with increased application of the just in time principle and lean supply chains in order to improve the efficiency of the production process and reduce storage costs, but also (Bernadet, 1997), to provide a rapid response to fluctuating demand when scheduling is difficult which leads more and more to production being a response to demand and more frequent, more fragmented, shipments. The regression of large firms In France, this process of economic deconcentration has resulted in a particularly marked reduction in the number of large firms with 500 or more employees whose importance in the economy had started to grow continuously in the 1980s and then started a constant fall, mainly to the advantage of small and medium enterprises (SMEs) with between 10 and 499 employees, but also very small firms whose number started to grow in number at a considerably faster rate. Of the 2.8 million firms (other than agricultural firms and financial organizations) listed in 2004, 93.4% were very small firms with less than 10 employees, 6.5% were SMEs while major firms with 500 employees and over accounted for only 0.1% of the total (INSEE, 2005). This was linked to the increase in service activities, but not exclusively. All sectors of activity were affected, including industry where the proportion of major firms was low, less than 0.5% in all sectors (Moati, 2002). These changes are apparent over the entire scope of the two surveys which focus more on the industrial sectors and wholesale trading that generate freight and for which the observation unit is no longer the firm but the geographical site. That is to say it is not the firm as the legal production entity but its different geographical sites of activity which appear to be the most appropriate units for investigating incoming and outgoing flows and their special fragmentation.
8
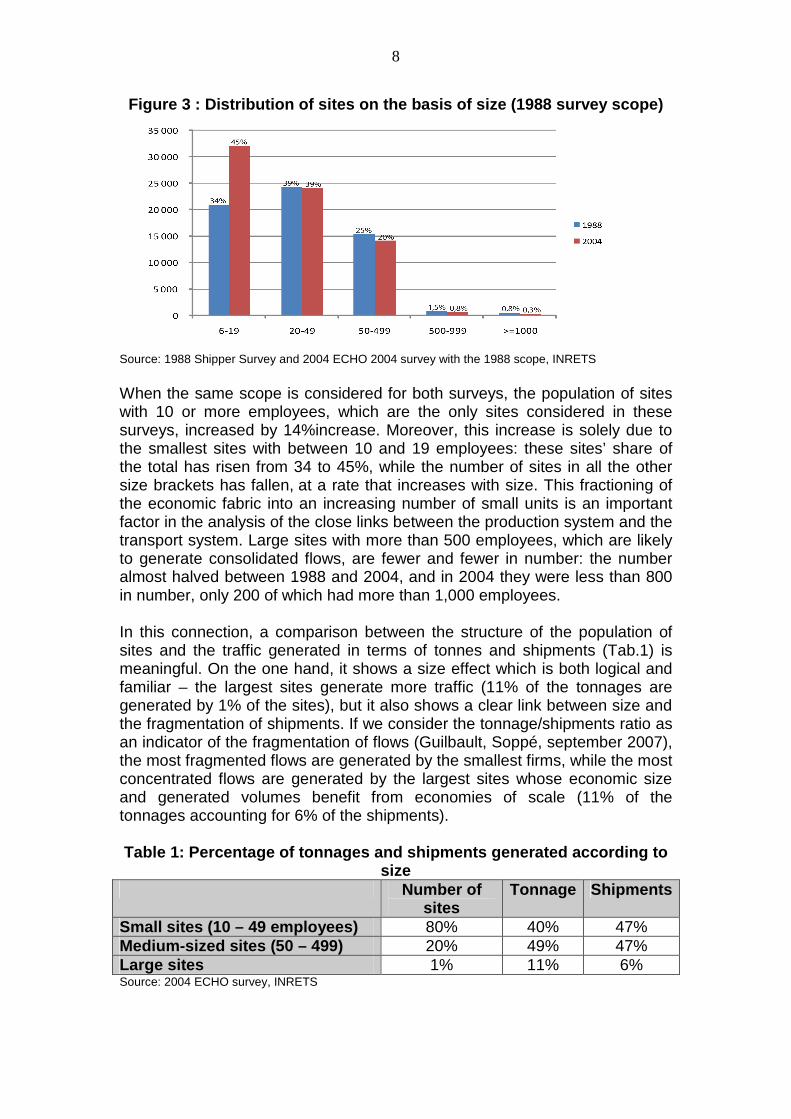
Figure 3 : Distribution of sites on the basis of si ze (1988 survey scope) Source: 1988 Shipper Survey and 2004 ECHO 2004 survey with the 1988 scope, INRETS
When the same scope is considered for both surveys, the population of sites with 10 or more employees, which are the only sites considered in these surveys, increased by 14%increase. Moreover, this increase is solely due to the smallest sites with between 10 and 19 employees: these sites’ share of the total has risen from 34 to 45%, while the number of sites in all the other size brackets has fallen, at a rate that increases with size. This fractioning of the economic fabric into an increasing number of small units is an important factor in the analysis of the close links between the production system and the transport system. Large sites with more than 500 employees, which are likely to generate consolidated flows, are fewer and fewer in number: the number almost halved between 1988 and 2004, and in 2004 they were less than 800 in number, only 200 of which had more than 1,000 employees.
In this connection, a comparison between the structure of the population of sites and the traffic generated in terms of tonnes and shipments (Tab.1) is meaningful. On the one hand, it shows a size effect which is both logical and familiar – the largest sites generate more traffic (11% of the tonnages are generated by 1% of the sites), but it also shows a clear link between size and the fragmentation of shipments. If we consider the tonnage/shipments ratio as an indicator of the fragmentation of flows (Guilbault, Soppé, september 2007), the most fragmented flows are generated by the smallest firms, while the most concentrated flows are generated by the largest sites whose economic size and generated volumes benefit from economies of scale (11% of the tonnages accounting for 6% of the shipments).
Table 1: Percentage of tonnages and shipments gener ated according to
size Number of
sites Tonnage Shipments
Small sites (10 – 49 employees) 80% 40% 47% Medium-sized sites (50 – 499) 20% 49% 47% Large sites 1% 11% 6% Source: 2004 ECHO survey, INRETS
9
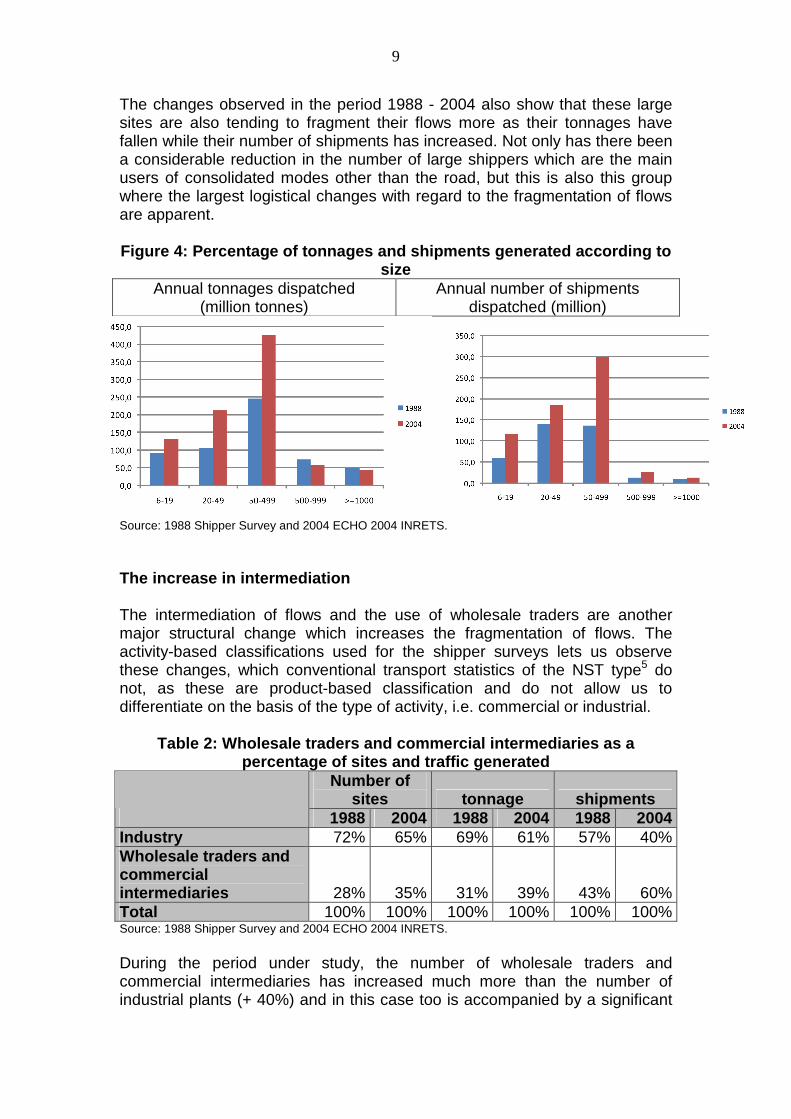
The changes observed in the period 1988 - 2004 also show that these large sites are also tending to fragment their flows more as their tonnages have fallen while their number of shipments has increased. Not only has there been a considerable reduction in the number of large shippers which are the main users of consolidated modes other than the road, but this is also this group where the largest logistical changes with regard to the fragmentation of flows are apparent.
Figure 4: Percentage of tonnages and shipments gene rated according to
size Annual tonnages dispatched
(million tonnes) Annual number of shipments
dispatched (million) Source: 1988 Shipper Survey and 2004 ECHO 2004 INRETS. The increase in intermediation The intermediation of flows and the use of wholesale traders are another major structural change which increases the fragmentation of flows. The activity-based classifications used for the shipper surveys lets us observe these changes, which conventional transport statistics of the NST type5 do not, as these are product-based classification and do not allow us to differentiate on the basis of the type of activity, i.e. commercial or industrial.
Table 2: Wholesale traders and commercial intermedi aries as a
percentage of sites and traffic generated Number of
sites tonnage shipments 1988 2004 1988 2004 1988 2004
Industry 72% 65% 69% 61% 57% 40% Wholesale traders and commercial intermediaries 28% 35% 31% 39% 43% 60% Total 100% 100% 100% 100% 100% 100% Source: 1988 Shipper Survey and 2004 ECHO 2004 INRETS.
During the period under study, the number of wholesale traders and commercial intermediaries has increased much more than the number of industrial plants (+ 40%) and in this case too is accompanied by a significant
10
increase in transport flows: the use of intermediaries rather than direct delivery adds at least one additional transport link. The role of intermediaries in distribution systems is rarely highlighted, but it is essential. They account for 60% of shipments and 39% of tonnages (Tab.2). A reduction in stocks and an increase in shipment f requency Several indicators, based on average levels of storage, can be used to observe the logistical changes brought about by the introduction of lean supply chains: the percentage of production that occurs after an order is received, the average amount of time required to process a standard order, and the delivery deadlines requested by clients. Some of these were only introduced in the newer survey so historical comparisons are not possible. We will simply point out here the very considerable reduction that has taken place in average storage times. Data on this indicator was only collected from production sites, wholesale traders being excluded. It was measured by the number of days of production firms held in advance and fell, on average, from 32 to 19 days, i.e. a reduction of 40%. This is a general trend and is apparent for all the sectors of activity and firms of all sizes, with the firms that have gone furthest in applying the just-in-time principle being agrifood producers (16 days on average) and major firms with 1,000 and more employees (12 days on average). The proportion of all tonnages that are produced in response to an order is another significant indicator for company decisions about the management of flows and the pressure applied from downstream where demand initiates the production process. The figures, which only relate to 2004, show that this practice is highly dominant. 66% of firms produce mainly in response to orders (at least 70% of their tonnage). This percentage is relatively uniform throughout all sectors of activity, except for agrifood goods, which are often affected by specific production constraints due to the seasonality and the perishability of products and for which the distribution between firms producing essentially in response to an order or essentially on the basis of stock is more in balance. The last indicator we shall discuss in this context is no doubt the one that best illustrates this dual process of the spatial and temporal fragmentation of flows. It involves the annual volumes dispatched between a given shipper and a given consignee. Tonnages and the number of shipments seem to have changed in a very different manner, with a marked reduction in annual tonnages (525 tonnes in 1988 to 302 tonnes in 2004) leading one to assume they are more widely spread: the number of shippers but also the number of consignees per shipper has increased, overall tonnages have increased, but are distributed over a large number of shipper-consignee flows, and ultimately, a reduction in the tonnages for each flow is observed. Conversely, frequencies have increased with the average annual number of shipments between the shipper and the consignee increasing from 186 in 1988 to 277 in 2004.

11
2.2 A reduction in the weights shipments and an inc rease in multi-leg transport chains The impacts of these changes on transport demand are extremely great and largely explain the ever-increasing use of road transport. The spatial dissemination of flows, requirements with regard to deadlines, flexibility and reactivity to demand are all factors which favour the road. Above all, the weight of the shipments dispatched by shippers is very low, on average approximately 1.3 tonnes for the entire scope of the 2004 survey (confident interval -8%/+10%), which is far below the weight capacity of heavy modes, i.e. 35 to 70 tonnes per wagon, 700 to 3,000 tonnes for full trains, 3,000 to 4,000 tonnes for pushed barge trains. This phenomenon of small shipments which had already been highlighted in 1988 has been further increased by the changes described above and the reduction in the freight volumes transported in Europe.
The phenomenon is particularly clear if we compare the distribution of the weights of shipments between the two studied years. Figure 5 shows, on the x-axis, the unit weight of shipments on a logarithmic scale. These are highly dispersed, ranging from 1kg to 10,800 tonnes, which was the highest weight observed in the 2004 survey and which corresponded to a maritime shipment of hydrocarbons leaving a port. The y-axis shows the cumulative frequencies in number of shipments expressed as a percentage and calculated by dividing the number of shipments of a weight equal to or below the weight given on the x-axis by the total number of shipments. The change in the median of the distribution of shipments which is shown by the bold arrow is important. Half the consignments studied in 1988 weighed less than 160kg wheras in 2004 half the consignments weighed less than 35kg, which means the median weight was divided by 4.5. 65 % of the shipments dispatched by shippers in 2004 weighed less than 100 kg, and 86 % weighed less than one tonne.
Figure 5: Cumulative distribution of the weight of shipments
Source: 1988 Shipper Survey and 2004 ECHO 2004 survey with the 1988 scope, INRETS
12
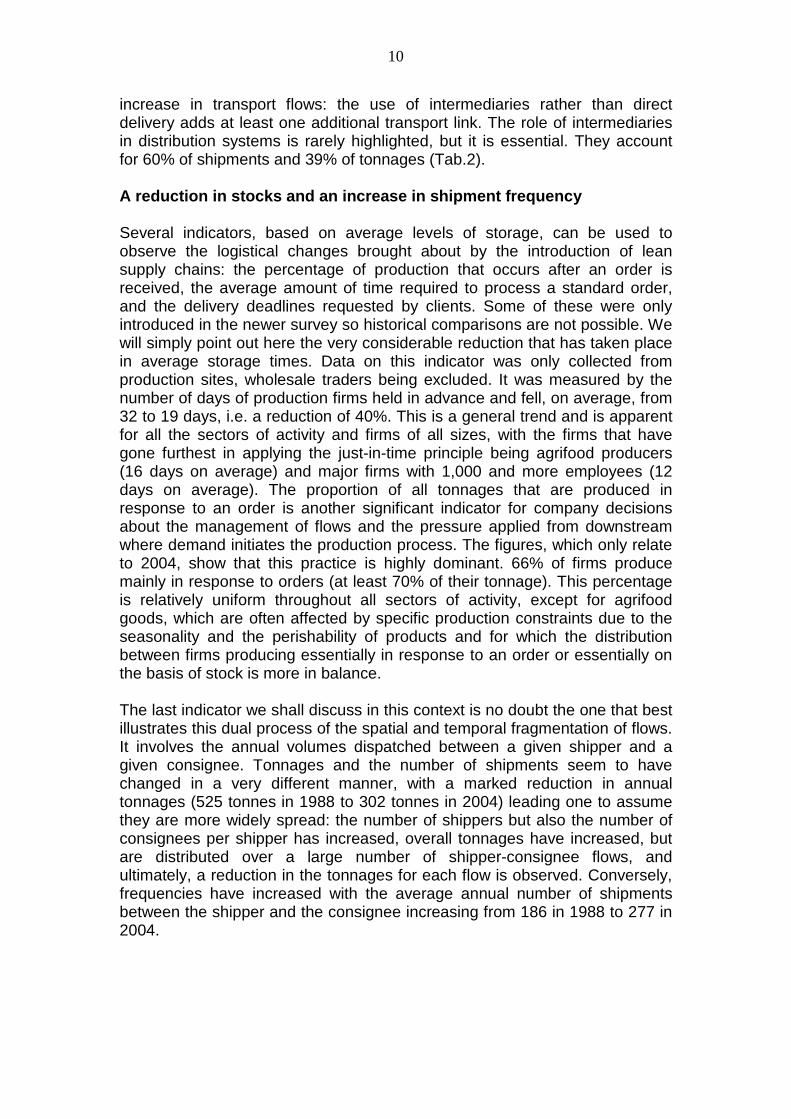
Conversely, heavy shipments (of over 20 tonnes) although accounting for only 2% of shipments accounted for half of total tonnages. Our perception changes completely depending on the unit which is employed. In this context, using shipments allows us to give small batches – parcel services, consolidation, air transport – a role which better reflects their economic importance in terms of transport added value and in terms of movement and transport flows and thus external impacts. It is by considering this last point that we shall conclude this paper, showing the modal distributions of transport chains in tonnes and number of shipments (Fig.6) where the road in all cases remains the most important mode, but with forms of organization that differ a great deal depending on whether what is involved is full loads that permit “straight line” road transport carried out in a single leg or smaller shipments that require consolidation and breaking up operations with multiple legs.
Figure 6: Modal split in 2004
OAR: Own account road transport. TPR: Third-party road transport; WW : Waterways transport. Source: 2004 ECHO 2004 survey with the 1988 scope, INRETS The structural trends observed show that it is the last type of consolitdated consignments which involve increasingly complex transport chains with multiple legs which are increasing the most rapidly. This type of organization, which accounts for 13% of tonnages is in fact becoming the most important mode in terms of the number of shipments, accounting for 48% of all shipments.
These results amount to a fairly pessimistic view of the possibilities of modal rebalancing. The focus on the modal practices and the choice criteria (Guilbault, Soppé, may 2007) shows that the latitude the shippers have to choose the mode or an inter-modal alternative for their shipments is strongly limited and pre-determined by the production and distribution constraints that affect firms. The evolution of production systems’ characteristics have impact on the nature of the demand or, more precisely, on the characteristics of flows to be transported which have been evolving in favour of road haulage. The
13
consolidation of flows is one of the essential conditions for economical transport which is less environmentally harmful. The very low weight of shipments places this constraint at the centre of the debate. It is a major challenge and makes it necessary to explore all the technical and organizational solutions and do so for all modes, including the road. Achieving a better understanding of the channels of production and distribution of goods and the characteristics of transport demand upstream may help this process. It is one of the objectives of this research. Bibliography
Armoogum, J., Guilbault, M., (2004) Sampling schemes for shipper & transport chain survey: the example of the French ECHO survey. 10th World Conference on Transport Research Society, 4 - 8 July 2004 Technical University of Istanbul. Baumol, W.J., Vinod, H.D.(1970) An inventory theoretic model of freight transport demand Management Science 16 7, p. 413-421 Bernadet, M. (1997) Le transport routier de marchandises, Fonctionnement et dysfonctionnements Economica, Paris Besson, P., Savy, M., Vaeyre, A., Veltz, P.(1988) Gestion de production et transports, vers une nouvelle économie de la circulation Paradigme 1988, Paris Burmeister, A.(2000) Familles logistiques – Propositions pour une typologie des produits transportés pour analyser les évolutions en matière d’organisation des transports et de la logistique Rapport INRETS, DRAST, Lille Colin, J., Mathe, H., Tixier, D (1983) La logistique au service de l’entreprise, moyens, mécanismes, enjeux. Dunod entreprise - Paris Christopher, M. (1992) Logistics and Supply Chain Management. Pitman Publishing, London Gouvernal, E., Hanappe, P., et alii (1989) Pratiques de transport des industries et des commerces de gros. INRETS rapport de recherche n° 99 Guilbault, M. (2008) Enquête ECHO Envoi-Chargeurs-Opérateurs de transport. Principauxrésultats de référence. Synthèse INRETS n° 56. Guilbault, M. (1994) Quelles contraintes pour les chargeurs ? Variété de la demande et choix de transport INRETS rapport de recherche n°178- Arcueil Guilbault, M., Soppé, M. (2007) Modal shift and inter-modality: The real latitude of shippers faced with political imperatives of sustainable development. 1st International scientific conference Competitiveness and complementary of transport modes, perspective for the development of intermodal transport, 10-12 May 2007, University of the Aegean, Chios –Greece. Guilbault, M., Soppé, M. (2007) Grandes tendances d’évolution des pratiques de transport et logistique au travers des enquêtes Chargeur 1988 et ECHO 2004 Journée spécialisée Enquête Echo 2004, apport des enquêtes chargeurs pour une meilleure connaissance des chaînes de transport de marchandises. Inrets 12 september 2007 Holguin-Veras, J. (2007) The U.S. Commodity Flow Survey : past, present and suggestions for improvement Journée spécialisée Enquête Echo 2004,
14
les apport des enquêtes chargeurs pour une meilleure connaissance des chaînes de transport de marchandises. Inrets 12 september 2007 INSEE (2005) Annuaire statistique de la France Moati, Ph. (2002) De la petite à la grande entreprise, état des lieux » in Les nouvelles logiques de l’entreprise. Les cahiers français n°309 . La documentation Française. Quinet, E., Vickerman, R. (2004) Principles of Transport Economics. Edward Elgar Editions, Cheltenham UK Rodrigue, J.-P. (2000) L'espace économique mondial, Les économies avancées et la mondialisation. Sainte-Foy, PUQ Rodrigue, J.-P. (2006) Challenging the Derived Transport Demand Thesis: Issues in Freight Distribution. Environment & Planning A, Vol. 38, N°. 8 , p. 1449-1462 Savy, M. (1986) Analyse de la demande de transport Cours de techniques d’exploitation des transports de marchandises. ENPC- Paris Savy, M. (2007) Le transport de marchandises Eyrolles – Editions d’Organisation Swenseth, S.R., Buffa, F.P. (1990) Just-in-Time: Some effects on the logistics function. The International Journal of Logistics Management, 1 2, p. 25–34 Tyworth, J.E. (1991) The inventory Theoretic Approach in Transportation Selection Models: A Critical Review. Logistics and transportation Review, Vol. 27, N° 4 , p. 299-318 VELTZ, P. (1996) Mondialisation, villes et territoires : une économie d’archipel. Paris, Puf Notes 1 We will cite Baumol and Vinod (1970), Swenseth and alii (1990), Tyworth (1991), Christopher (1992),
Rodrigue (2000 and 2006). Or, in France, Colin and alii (1983), Savy (1986, 2007) Besson and alii (1988), Veltz (1996), Bernadet (1997), Burmeister (2000), Quinet and Vickerman (2004)
2 The French National Statistics Office 3 A comparison with the results obtained with simple random sampling shows that these procedures
have multiplied the number of rail consignments by 14 and the number of river consignments by 24, while the number of air consignments, combined road/rail consignments and sea consignments were multiplied by a factor of between 3 and 5 (Armoogum, Guilbault 2004).
4 Computer Assisted Personal Interview 5 Nomenclature Statistique des Transports, standard goods classification for transport statistics used in
France and in Europe

1
Demand for transport and production systems – Shipp er surveys in France in 1988 and 2004
Michèle Guilbault, Elisabeth Gouvernal, Martin Sopp é, INRETS-SPLOT, France. ABSTRACT Freight transport is closely linked to industrial and commercial activities and can be seen as a by-product or even a fully integrated element of the production process. It is acknowledged that while the characteristics of transported commodities are important they are not the only parameters that determine the choice of a given transport solution - production and logistic constraints play an equally important role in this regard. Understanding transport and its development is very much based on the analysis of transport demand and shipper practices. However, there is very little statistical data that enables us to analyze the relationship between transport and its production and logistics related determinants. For this reason two large national surveys were undertaken in France during the last two decades to provide us with new empirical data. This paper will present the main methodological aspects of the two surveys (the 1988 Shipper Survey and the 2004 ECHO Survey). The use of “the shipment” as the measurement unit instead of the usual tonne or tonne-kilometre approach is one of the major innovations of these surveys which provide a new statistical insight. The outcome is a large diversity of traffic generation profiles that vary not only from one sector of activity to another but also according to whether tonnages or the number of shipments is used for measurement purposes. Shipments thus appear to be a useful complementary unit and a realistic logistical indicator. Another particularity of these surveys is the tracking of the shipment throughout the transport chain. This makes it possible to identify each segment and operator - shipper, consignee, carrier and transport agent - involved in transporting the shipment. Shippers do not always know how their freight is carried, so all the operators were asked for details about the services they performed for the shipment and their own activities. This makes it possible to describe the whole transport chain, both from a physical and organizational point of view. We will show the main research fields covered by the collected data. A selection of results, indicators and trends will be presented with a focus on the main changes that have occurred in the last fifteen years based on a comparison of the two datasets. The diversity of logistic organizations at site level in different sectors of industrial and wholesale trading activity enables us to gain a better understanding of shippers' constraints regarding transport. Special attention will be paid to the relationship between transport choices and the production characteristics of sites and the increasing spatial and temporal fragmentation of shipments which makes the choice of modes other than the road increasingly difficult.