demand elasticity - luis cabralluiscabral.net/.../iio2/slides/slides02.2.elasticity.pdf ·...
TRANSCRIPT

DEMAND ELASTICITY
1

Overview
• Context: Product manager wants to estimate impact of pricechange on sales (quantity and revenue). How sensitive is demandto price? How important is the pricing of competing products?
• Concepts: demand elasticity, cross-elasticity
• Economic principle: sometimes reducing price attracts many morecustomers, sometimes very few
2

How sensitive is demand to price changes?
• Example 1: world oil demand decreases by 1.3 million barrels aday when price increases from $50 to $60 dollars per barrel.Would you consider the demand for oil very sensitive or not verysensitive to price?
• Example 2: demand for sugar in Europe decreases by 1 milliontones per day when average retail price increases from e.80 toe.90 per kilo. Can you compare the demand for sugar in Europeto the worldwide demand for oil?
• Problem: by measuring the slope of the demand curve, we arestuck with units: barrels, dollars, kilos, euros, and so on.
3

Demand elasticity: definition
✏ ⌘d q
q
d p
p
=d q
d p
p
q
=d log q
d log p
3

Demand elasticity: definition
✏ ⌘d q
q
d p
p
=d q
d p
p
q
=d log q
d log p
⇡� q
q
� p
p
=% � quantity
% � price
3

Demand elasticity: definition
✏ ⌘d q
q
d p
p
=d q
d p
p
q
=d log q
d log p
⇡� q
q
� p
p
=% � quantity
% � price
⇡ � log quantity
� log price
4

Demand elasticity: notes
• Elasticity and slope are not the same
• Elasticity is independent of units
• Knowing price change, quantity change may be estimated basedon elasticity:
� q
q
⇡ ✏� p
p
5

Examples
Product Elasticity
Milk -0.5
Cigarettes -0.5
Beer -0.8
Apples -1.3
US luxury cars in US -1.9
Foreign luxury cars in US -2.8
6

Elasticity illustrated: linear demand
p
q
✏ = 0
|✏| < 1
|✏| = 1
|✏| > 1
✏ = �1
•
•
•
7

Elasticity illustrated: constant elasticity
p
q
✏ = �1
|✏| > 1
|✏| < 1✏ = 0
8

Elasticity, price, and revenue
Revenue ⌘ R = p ⇥ q. Therefore:
�R
R
=� (p ⇥ q)
(p ⇥ q)⇡ q� p + p� q
(p ⇥ q)
=� p
p
+� q
q
=� p
p
+ ✏� p
p
=� p
p
(1 + ✏)
If price falls, then:
•Revenue rises if ✏ < �1 (that is, |✏ | > 1)
•Revenue falls if ✏ > �1 (that is, |✏ | < 1)
•Revenue is unchanged if ✏ = �1
9

Elasticity, price, and revenue
Examples: for a 1% decrease in price,
•Cigarettes: revenue falls approx 0.5% = �.1%⇥(1+(�.5))
•U.S. luxury cars: revenue rises approx 0.9%
•Foreign luxury cars: revenue rises approx 1.8%
10

Revenue change from price decrease
�p
�q
p
q
E
1
E
2
q
p
Loss L = q (�� p), Gain G = p � q
G > L i↵ p � q > q (�� p)
i↵
� q
� p
p
q
< �1
11
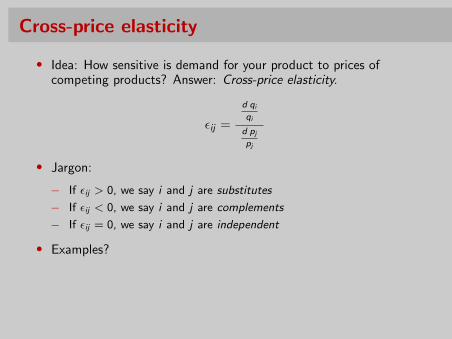
Cross-price elasticity
• Idea: How sensitive is demand for your product to prices ofcompeting products? Answer: Cross-price elasticity.
✏ij
=
d q
i
q
i
d p
j
p
j
• Jargon:
� If ✏ij
> 0, we say i and j are substitutes
� If ✏ij
< 0, we say i and j are complements
� If ✏ij
= 0, we say i and j are independent
• Examples?
12

Income elasticity
• Idea: How sensitive is demand for your product to consumerincome? Answer: income elasticity.
✏y
=
d q
q
d y
y
• Jargon:
� Inferior good: ✏y
< 0
� Normal good: ✏y
> 0
� Necessity: 0 < ✏y
< 1
� Luxury: ✏y
> 1
• Examples?
13

Example: U.S. gasoline demand (cont)
14

Example: gasoline demand
• Based on U.S. data from 1953–2004,
ln q = �16.1� 0.03 ln p + 1.17 ln y � 0.33 ln c + 0.85 ln n
where
q: gasoline consumption
p: gasoline price
y : per capita income
c : price of cars
n: population
• What is the gasoline demand elasticity? Income elasticity? Crossprice elasticity w.r.t. cars? How do you classify the good“gasoline”?
15

Example: gasoline demand
• From 1953 to 2004, p, y , c and n increased at the following
annual rates: 3.9, 2.2, 2.0, 1.2%. How much do you expect
demand to have grown?
• Recall that d z
z
= ✏zx
d x
x
, for any z and x . Hence,
� q
q
= �.03⇥ 3.9% + 1.17⇥ 2.2%� 0.33⇥ 2 + .85⇥ 1.2%
= �.117% + 2.574%� 0.66% + 1.02%
= 2.817%
• Note: actual growth rate was 2.7%
16

Takeaways
• The elasticity (of demand) measures sensitivity of buyers tochanges in price
• It’s useful for computing impact of price changes on quantity andrevenue
• Cross-price and income elasticities measure sensitivity to otherfactors
17