delta t-v pseudo-2d velocity modeling along seismic ...rayfract.com/samples/street_crossing.pdf ·...
TRANSCRIPT
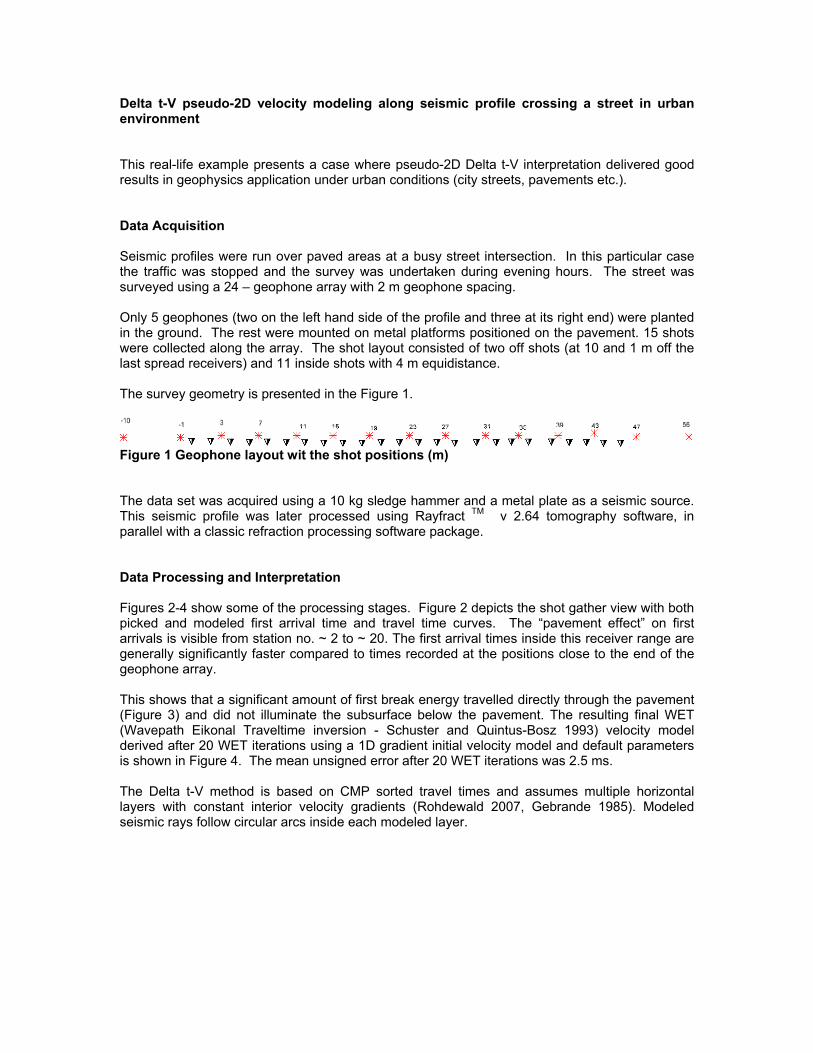
Delta t-V pseudo-2D velocity modeling along seismic profile crossing a street in urban environment This real-life example presents a case where pseudo-2D Delta t-V interpretation delivered good results in geophysics application under urban conditions (city streets, pavements etc.). Data Acquisition Seismic profiles were run over paved areas at a busy street intersection. In this particular case the traffic was stopped and the survey was undertaken during evening hours. The street was surveyed using a 24 – geophone array with 2 m geophone spacing. Only 5 geophones (two on the left hand side of the profile and three at its right end) were planted in the ground. The rest were mounted on metal platforms positioned on the pavement. 15 shots were collected along the array. The shot layout consisted of two off shots (at 10 and 1 m off the last spread receivers) and 11 inside shots with 4 m equidistance. The survey geometry is presented in the Figure 1.
Figure 1 Geophone layout wit the shot positions (m) The data set was acquired using a 10 kg sledge hammer and a metal plate as a seismic source. This seismic profile was later processed using Rayfract TM v 2.64 tomography software, in parallel with a classic refraction processing software package. Data Processing and Interpretation Figures 2-4 show some of the processing stages. Figure 2 depicts the shot gather view with both picked and modeled first arrival time and travel time curves. The “pavement effect” on first arrivals is visible from station no. ~ 2 to ~ 20. The first arrival times inside this receiver range are generally significantly faster compared to times recorded at the positions close to the end of the geophone array. This shows that a significant amount of first break energy travelled directly through the pavement (Figure 3) and did not illuminate the subsurface below the pavement. The resulting final WET (Wavepath Eikonal Traveltime inversion - Schuster and Quintus-Bosz 1993) velocity model derived after 20 WET iterations using a 1D gradient initial velocity model and default parameters is shown in Figure 4. The mean unsigned error after 20 WET iterations was 2.5 ms. The Delta t-V method is based on CMP sorted travel times and assumes multiple horizontal layers with constant interior velocity gradients (Rohdewald 2007, Gebrande 1985). Modeled seismic rays follow circular arcs inside each modeled layer.
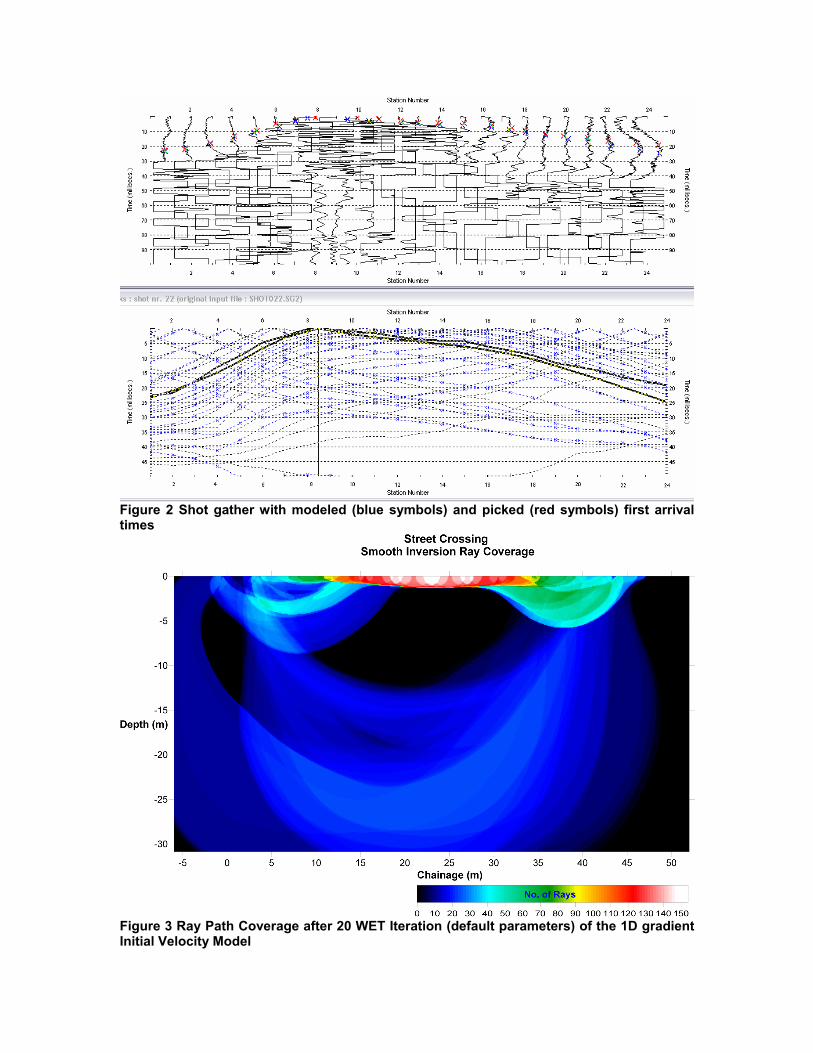
Figure 2 Shot gather with modeled (blue symbols) and picked (red symbols) first arrival times
Figure 3 Ray Path Coverage after 20 WET Iteration (default parameters) of the 1D gradient Initial Velocity Model
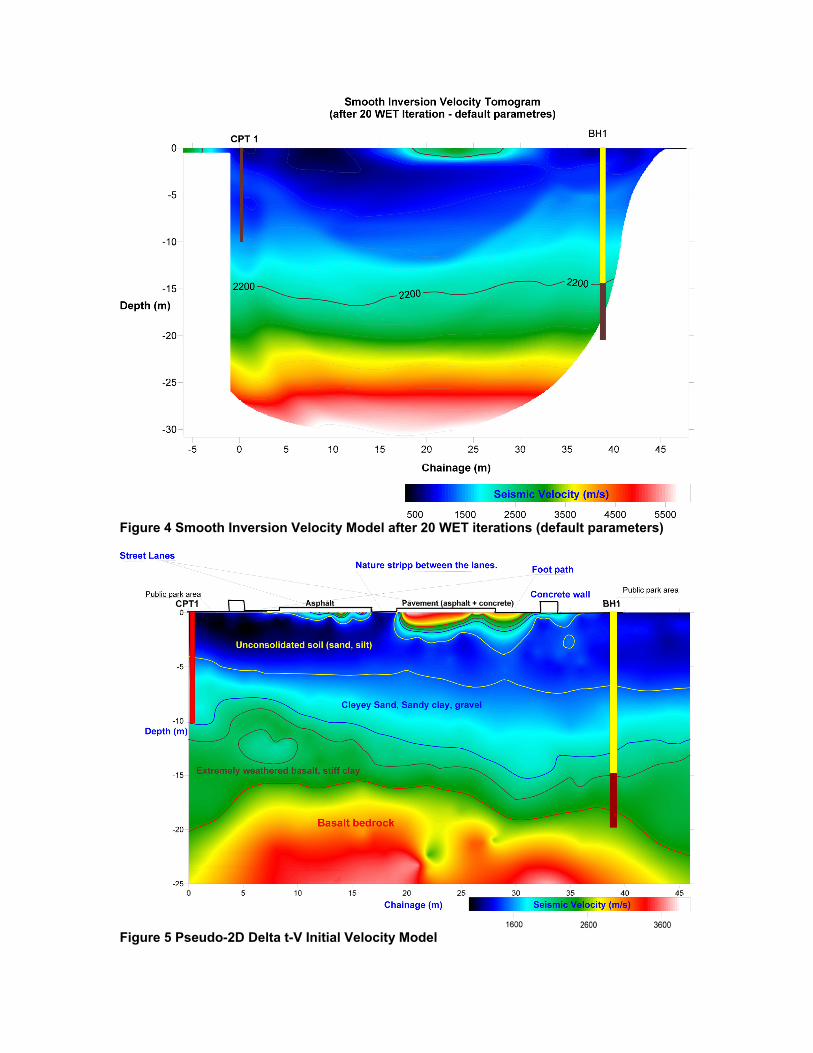
Figure 4 Smooth Inversion Velocity Model after 20 WET iterations (default parameters)
Figure 5 Pseudo-2D Delta t-V Initial Velocity Model
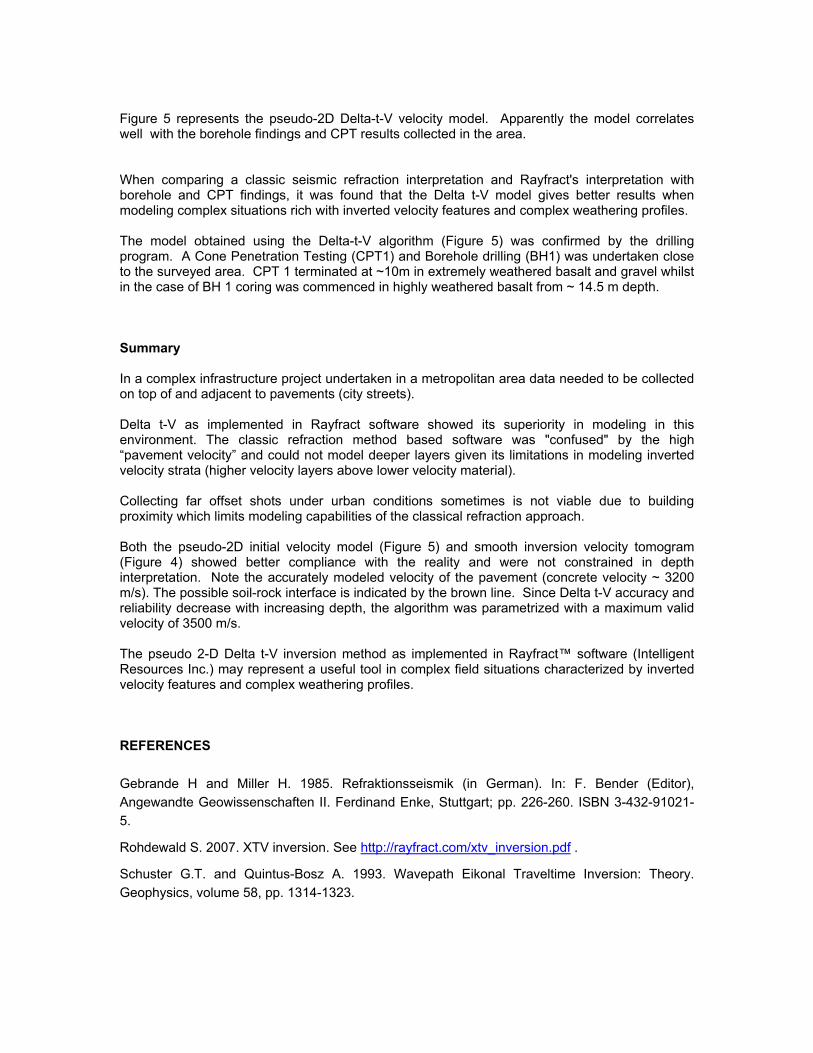
Figure 5 represents the pseudo-2D Delta-t-V velocity model. Apparently the model correlates well with the borehole findings and CPT results collected in the area. When comparing a classic seismic refraction interpretation and Rayfract's interpretation with borehole and CPT findings, it was found that the Delta t-V model gives better results when modeling complex situations rich with inverted velocity features and complex weathering profiles. The model obtained using the Delta-t-V algorithm (Figure 5) was confirmed by the drilling program. A Cone Penetration Testing (CPT1) and Borehole drilling (BH1) was undertaken close to the surveyed area. CPT 1 terminated at ~10m in extremely weathered basalt and gravel whilst in the case of BH 1 coring was commenced in highly weathered basalt from ~ 14.5 m depth. Summary In a complex infrastructure project undertaken in a metropolitan area data needed to be collected on top of and adjacent to pavements (city streets). Delta t-V as implemented in Rayfract software showed its superiority in modeling in this environment. The classic refraction method based software was "confused" by the high “pavement velocity” and could not model deeper layers given its limitations in modeling inverted velocity strata (higher velocity layers above lower velocity material). Collecting far offset shots under urban conditions sometimes is not viable due to building proximity which limits modeling capabilities of the classical refraction approach. Both the pseudo-2D initial velocity model (Figure 5) and smooth inversion velocity tomogram (Figure 4) showed better compliance with the reality and were not constrained in depth interpretation. Note the accurately modeled velocity of the pavement (concrete velocity ~ 3200 m/s). The possible soil-rock interface is indicated by the brown line. Since Delta t-V accuracy and reliability decrease with increasing depth, the algorithm was parametrized with a maximum valid velocity of 3500 m/s. The pseudo 2-D Delta t-V inversion method as implemented in Rayfract™ software (Intelligent Resources Inc.) may represent a useful tool in complex field situations characterized by inverted velocity features and complex weathering profiles. REFERENCES Gebrande H and Miller H. 1985. Refraktionsseismik (in German). In: F. Bender (Editor), Angewandte Geowissenschaften II. Ferdinand Enke, Stuttgart; pp. 226-260. ISBN 3-432-91021-5.
Rohdewald S. 2007. XTV inversion. See http://rayfract.com/xtv_inversion.pdf .
Schuster G.T. and Quintus-Bosz A. 1993. Wavepath Eikonal Traveltime Inversion: Theory. Geophysics, volume 58, pp. 1314-1323.