dell's working capital
TRANSCRIPT

CASE STUDY
Presented by:-1. Siddharth Nahata2. Rohit Patidar3. Deepali Agarwal4. Rajat Srivastava5. Prachi Mandhani6. Shivam Singla
Corporate Finance
Dell’s Working Capital

INTRODUCTION
• Dell was established in 1984 as a small PC company• Initially, dell operated by buying IBM PC-compatible computers, upgrading them by stock components and sold them directly.
• Later, Dell found an opportunity among PC-savvy individuals and began making its own PCs in a build to order model.• They took orders over toll free telephone lines, customized their PCs to the client’s means and had them delivered in days.
•Advantages of having the build to order model:- Low finished goods, low carrying costs.- It could integrate new technologies quicker than its competitors because it built a PC after getting an order.- It could generate cash by maintaining low cash conversion cycle.- Low inventory with less fixed assets led to a higher ROCE.
LOW INVENTORY HOLDING
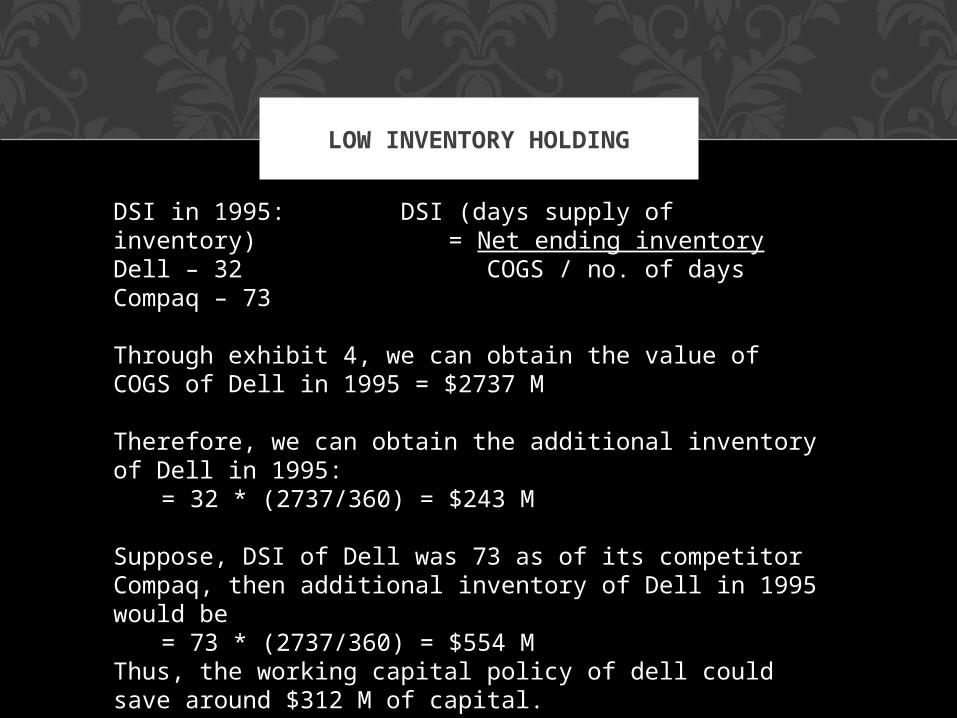
DSI in 1995: DSI (days supply of inventory) = Net ending inventoryDell – 32 COGS / no. of daysCompaq – 73
Through exhibit 4, we can obtain the value of COGS of Dell in 1995 = $2737 M
Therefore, we can obtain the additional inventory of Dell in 1995:
= 32 * (2737/360) = $243 M
Suppose, DSI of Dell was 73 as of its competitor Compaq, then additional inventory of Dell in 1995 would be
= 73 * (2737/360) = $554 MThus, the working capital policy of dell could save around $312 M of capital.

OBSOLESCENCE RISK AND INVENTORY COST REDUCED
• New Technologies are introduced every year, so component cost could be reduced almost by 30%.
As a % of Cost of Sales
DELL COMPAQ
Inventory 8.9 20.3
Inventory Loss 2.7 6.1
Because Compaq had to sell off its old inventory before purchasing new goods so opportunity loss of Compaq is 0.3*312 = 93.6Million

DELL’S EXPANSION
• In 1990, dell announced that it would break from direct only sales model and began selling its PCs through CompUSA• Subsequently, Dell’s market share leaped to the top 5 after a 268% increase in sales.• But in 1993, dell suffered its first loss of $76 M which occurred due to sell-off of excess inventory and termination of a failed product line of notebooks• In 1994, Dell left the retail market and changed its structure.• The restructuring included a shift in focus from growth to growth, liquidity and profitability.• There was reemphasis on direct contact with customers• Suppliers were reduced and inventory was better managed.

HOW DID DELL FUND ITS GROWTH INTERNALLY?
• On comparing Dell’s performance in 1996 as to 1995, the sales increased from $3475 M to $5296 M. Hence, a growth of 52.4% is reported.1995 IN MILLION $ AS A % OF SALES
TOTAL ASSETS 1594 46
(-) short term investments
484 14
OPERATING ASSETS
1110 32
• Operating assets are 32% of sales in 1995, to determine the operating assests’ contribution in 1996, its ratio to sales should remain intact. Thus, the operating assets in 1996 will be
= $5296 M * 32% = $1694 M

Operating assets in 1996 = $1694 M Operating assets in 1995 = $1110 M Funds needed = $584 M
SOURCES OF FUNDS: (internally)
•The liabilities less accounts payable have increased from 1995 to 1996 =• = $ (2148-466) – (1594-403) M = $494 M
•Net Profit as a % of sales in 1995 = 149*100/3475 = 4.3%
The projected operational profit = $5296 * 4.3% = $227 M
• Thus, we can see that the cash inflow (721 M) is more than the required cash outflow, it can be inferred that dell got enough money to fund its growth internally in 1996.
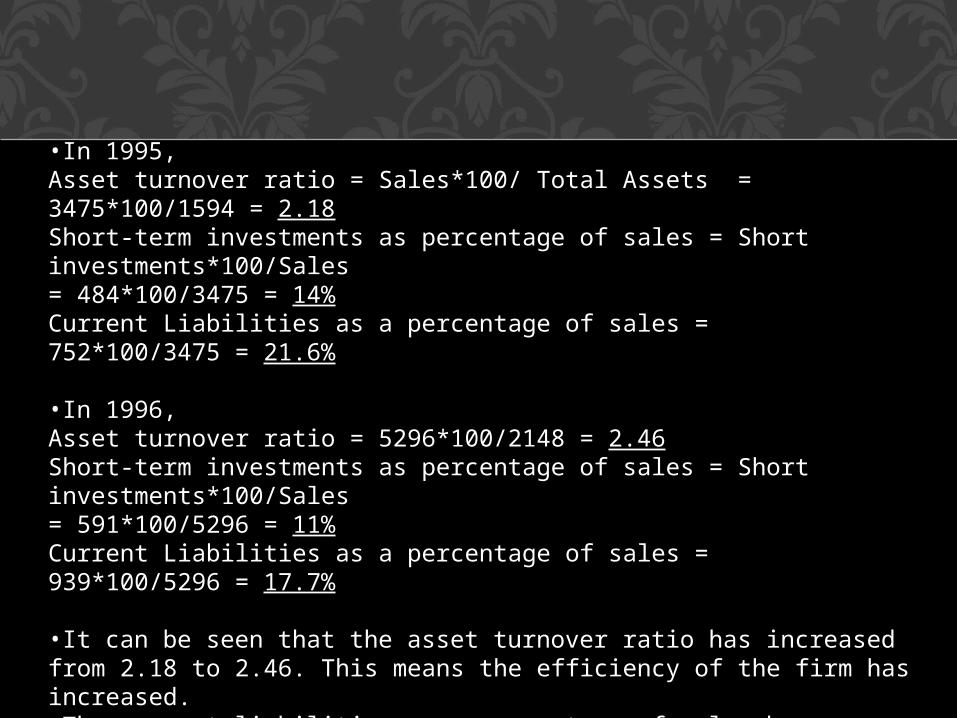
•In 1995,Asset turnover ratio = Sales*100/ Total Assets = 3475*100/1594 = 2.18Short-term investments as percentage of sales = Short investments*100/Sales= 484*100/3475 = 14%Current Liabilities as a percentage of sales = 752*100/3475 = 21.6%
•In 1996,Asset turnover ratio = 5296*100/2148 = 2.46Short-term investments as percentage of sales = Short investments*100/Sales= 591*100/5296 = 11%Current Liabilities as a percentage of sales = 939*100/5296 = 17.7%
•It can be seen that the asset turnover ratio has increased from 2.18 to 2.46. This means the efficiency of the firm has increased.•The current liabilities as a percentage of sales have decreased from 21.6% to 17.7%. Therefore, the liabilities have reduced.•Thus, Dell funded its 52% growth in sales mainly by increasing its asset efficiency, reducing its current liabilities and decreasing its short term investments in comparison to the earlier year

1997 FORECAST
1997 forecast is based on fixed liabilities versus proportional liabilities just like how it was done in 1996.
Also, including or excluding buy back of shares and pay-off of the long term debt
Total assets in 1996 2148
Less: Short Term Investments (-) 591
Operating assets in 1996 = 1557
• Operating assets as a % of sales in 1996 = 1557/ 5296 = 29.4%
• Forecasted Sales in 1997 = 5296 + 50% of 5296 = $7944 M
• To determine the operating assests’ contribution in 1997, its ratio to sales should remain intact. Thus, the operating
assets in 1997 will be= 29.4% of 7944 = $2336 M
FUND SOURCING
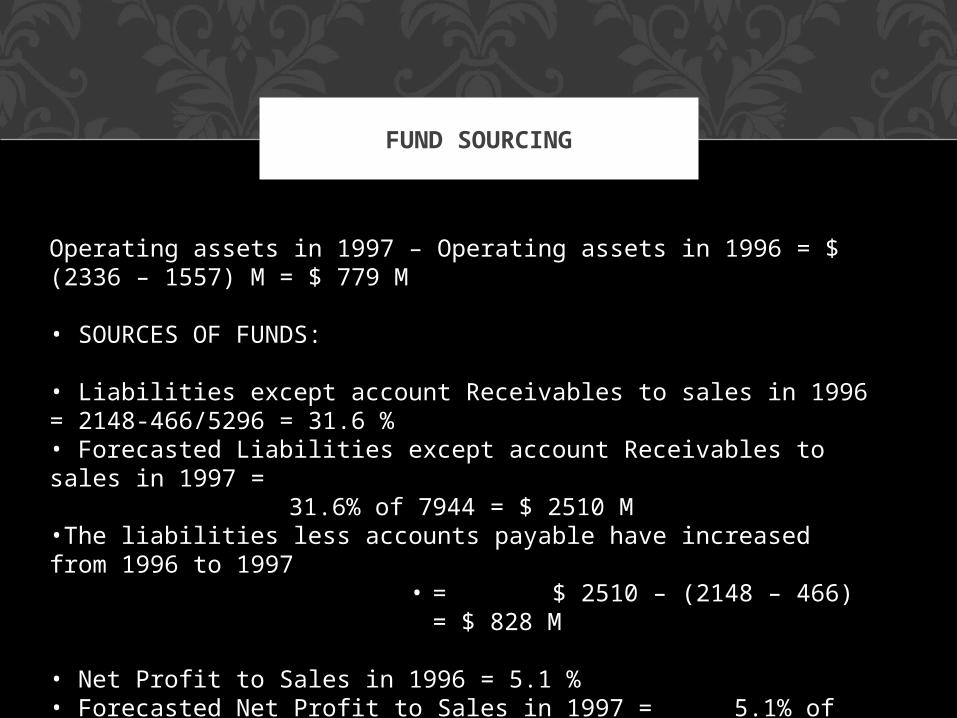
Operating assets in 1997 – Operating assets in 1996 = $ (2336 – 1557) M = $ 779 M
• SOURCES OF FUNDS:
• Liabilities except account Receivables to sales in 1996 = 2148-466/5296 = 31.6 %• Forecasted Liabilities except account Receivables to sales in 1997 =
31.6% of 7944 = $ 2510 M•The liabilities less accounts payable have increased from 1996 to 1997
• = $ 2510 – (2148 – 466) = $ 828 M
• Net Profit to Sales in 1996 = 5.1 %• Forecasted Net Profit to Sales in 1997 = 5.1% of 7944 = $ 405 M
•Thus, we can see that the cash inflow (1233 M) is more than the required cash outflow, it can be inferred that dell got enough money to fund its growth internally in 1997.

Combination of working capital management efficiency and profit margin improvements can lead to:
• fund growth
• Help in repayment of debt
• buy back of shares
• Fund growth with internal funds

ACTUAL 1997
• Profits were way high - COGS% was reduced - Operating Expense % was reduced
• Accounts Receivables fell about 12%
•Inventory Days fell about 40%
•Accounts Payable rose sharply, more than 60%
•Shares were repurchased, Long Term Debt was paid

Thank You