dell emc ready solutions for microsoft sql: sql server ... · sql server 2005 reached end of...
TRANSCRIPT
Dell EMC Ready Solutions for Microsoft SQL: SQL Server 2017 with S2D Ready Node Cluster On-Premises Performance, On-Cloud Cost Savings November 2018
H17381.2
White Paper
Abstract This white paper describes an HCI solution for SQL Server with Microsoft Storage Spaces Direct and Dell EMC Ready Nodes. It includes load testing and validation details as well as price comparisons with legacy systems and a public cloud model.
Dell EMC Solutions
Copyright
2 Dell EMC Ready Solutions for Microsoft SQL: SQL Server 2017 with S2D Ready Node Cluster On-Premises Performance, On-Cloud Cost Savings White Paper
The information in this publication is provided as is. Dell Inc. makes no representations or warranties of any kind with respect to the information in this publication, and specifically disclaims implied warranties of merchantability or fitness for a particular purpose. Use, copying, and distribution of any software described in this publication requires an applicable software license.
Copyright © 2018 Dell Inc. or its subsidiaries. All Rights Reserved. Dell Technologies, Dell, EMC, Dell EMC and other trademarks are trademarks of Dell Inc. or its subsidiaries. Intel, the Intel logo, the Intel Inside logo and Xeon are trademarks of Intel Corporation in the U.S. and/or other countries. Other trademarks may be trademarks of their respective owners. Published in the USA 11/18 White Paper H17381.2.
Dell Inc. believes the information in this document is accurate as of its publication date. The information is subject to change without notice.
Contents
3 Dell EMC Ready Solutions for Microsoft SQL: SQL Server 2017 with S2D Ready Node Cluster On-Premises Performance, On-Cloud Cost Savings
White Paper
Contents
Executive summary ........................................................................................................................ 4
Technology overview ...................................................................................................................... 7
Why Ready Solutions and not just servers? .............................................................................. 10
Load testing and solution validation ........................................................................................... 11
Price comparisons ........................................................................................................................ 19
Integrated protection with Data Domain DD6300 ....................................................................... 25
Conclusion ..................................................................................................................................... 27
References ..................................................................................................................................... 28
Appendix A: Detailed configurations .......................................................................................... 29
Appendix B: Test approach and metrics collection ................................................................... 33
Executive summary
4 Dell EMC Ready Solutions for Microsoft SQL: SQL Server 2017 with S2D Ready Node Cluster On-Premises Performance, On-Cloud Cost Savings White Paper
Executive summary In a 2017 survey, Professional Association for SQL Server (PASS) members reported that SQL Server 2008 R2 or older accounted for more than 50 percent of production instances. SQL Server 2005 reached end of support on April 12, 2016, and SQL Server 2008 and 2008 R2 will reach end of support on July 9, 2019. Organizations must act quickly to avoid operating without security updates and software fixes.
Organizations that are still using SQL Server versions beyond the end of support are at risk of having valuable data exposed to security vulnerabilities. They also risk having their operations affected by a product defect for which Microsoft will not provide a hotfix. Because of Microsoft’s diligence in notifying customers of key end-of-support dates, shifting the responsibility to the vendor is difficult. Further, the consequences of data breaches are becoming more significant as highly publicized cases have increased regulatory and legal scrutiny regarding what actions were taken to prevent the unauthorized access. Depending on the type of data breach, regulations might require notification to customers, which can affect an organization’s brand and result in significant loss of business.
Most of the out-of-support SQL Server instances still in service have not had any hardware upgrades for years. The legacy servers and storage that these database instances use present many challenges. Replacing failed hardware components might require lengthy lead times to order the required parts. Database upgrades could take longer on legacy hardware systems due to a lack of available memory, CPU, or storage resources. Further, organizations might not be able to justify the upgrade disruption and cost of new licenses if performance does not improve significantly. To avoid these risks, IT organizations should plan on full hardware and software upgrades during replatforming of their older SQL Server databases.
A new database platform including the latest generation of servers and storage represents a significant investment for any organization. A common customer question is, “Do these legacy databases and their infrastructure justify the investment?” To answer that question, business leaders should look at multiple interrelated factors that can be complex. Often these evaluations can lead to consideration of public cloud offerings that involve a different set of complexities and business concerns. Alternatively, organizations can easily implement this cost-optimized Ready Solution to obtain the performance, resiliency, and elasticity that they need for their new database platform.
The Ready Solution is a validated hyper-converged architecture solution for your database ecosystem. The solution is based on Dell EMC PowerEdge 14th generation servers with all-flash storage. Each server is a performance-based building block that is preconfigured with S2D. In this Ready Solution, we used four servers, which provide the resiliency to survive two planned SQL virtual machine (VM) failures without affecting database availability. The solution’s modular design enables a cost-optimized entry point and incremental growth through the addition of S2D nodes.
Business challenge
Solution overview
Executive summary
5 Dell EMC Ready Solutions for Microsoft SQL: SQL Server 2017 with S2D Ready Node Cluster On-Premises Performance, On-Cloud Cost Savings
White Paper
This innovative solution for database migration and consolidation reduces cost by eliminating the need for a traditional storage array while still providing the performance and scalability that production database workloads require. The solution is:
• Less expensive than an Amazon Web Services (AWS) dedicated M5 instance—A price comparison example shows that a 3-year up-front dedicated M5 with monthly expenses is more expensive than the Ready Solution using S2D. The M5 is Amazon’s newest Elastic Compute Cloud (EC2) instance for general compute.
• Less expensive than similar legacy systems when comparing performance—You can achieve a cost savings by decommissioning legacy servers and moving to the new Ready Solution for SQL Server.
The Ready Solution for SQL Server can be preloaded with Microsoft Windows Server 2016 and comes with design and deployment guides to accelerate time-to-value. Every part of this database solution can be customized to meet the demands of your database ecosystem.
The solution provides:
• Cost savings—S2D software-defined storage negates the need to invest in proprietary SAN storage.
• Incremental growth flexibility—The modular architecture enables you to start with four Dell EMC PowerEdge R640 server-based Ready Nodes and grow to as many as 16 nodes.
• Less infrastructure, less complexity—Each PowerEdge R640 server takes 1U of rack space and easily connects to existing network infrastructure.
• Fault tolerance—Three-way mirroring and dual parity storage configurations enable the database to survive two failures and still be available to the business.
• Performance—The all-flash configuration delivers sub-millisecond latency combined with a high number of transactions per second (TPS).
The results of our validation and load testing show that this database solution provides:
• The capability to consolidate 11 dedicated legacy servers and a traditional storage array down to four S2D nodes—You can retire legacy servers to a small 4U footprint and centralize management to ease the burden on your IT team. With each traditional server hosting one simulated production database, we consolidated all 12 databases to just four S2D nodes running SQL Server 2017.
• Fast sub-millisecond response times driven by all-flash S2D nodes—The average response time for reads and writes was well below 1 millisecond (ms).
• Near-linear scalability—PowerEdge R640 all-flash servers, providing both database and storage services, maintained excellent performance in load tests for eight databases in parallel.
• The capability to fully back up a 431 GB SQL Server database in 3.8 minutes and restore the same database in 9.25 minutes—You can quickly back up and restore your critical databases by integrating a Dell EMC Data Domain DD6300 appliance with the solution.
Key results
Executive summary
6 Dell EMC Ready Solutions for Microsoft SQL: SQL Server 2017 with S2D Ready Node Cluster On-Premises Performance, On-Cloud Cost Savings White Paper
This white paper provides details to help you understand and evaluate how the Ready Solution for SQL Server 2017 with S2D Ready Nodes might be the right consolidation approach for your SQL Server database workloads.
This paper is intended for database and system administrators, storage administrators, and system architects who are responsible for implementing, managing, and maintaining SQL Server databases. Readers should be familiar with SQL Server and have an interest in achieving higher database availability, better performance, and simplified storage management.
Dell EMC and the authors of this document welcome your feedback on the solution and the solution documentation. Contact the Dell EMC Solutions team with your comments.
Authors: Sam Lucido, Phil Hummel, Karen Johnson
Document purpose
Audience
We value your feedback
Technology overview
7 Dell EMC Ready Solutions for Microsoft SQL: SQL Server 2017 with S2D Ready Node Cluster On-Premises Performance, On-Cloud Cost Savings
White Paper
Technology overview This solution uses the following key hardware and software components and features:
• Dell EMC S2D Ready Nodes
• Dell EMC Networking
• Microsoft Windows Server 2016 with S2D
• Microsoft SQL Server 2017
• Dell EMC Data Domain DD6300 appliance
When testing this solution, we used Dell EMC Live Optics software to capture and analyze performance data.
The S2D Ready Nodes are PowerEdge R640 servers, which have been explicitly designed for dense scale-out architectures such as software-defined storage. R640 servers are dual-socket platforms that can be populated with Non-Volatile Memory Express (NVMe) drives, solid-state drives (SSDs), and high-capacity traditional drives to support multitier software-defined storage architecture. You can customize the configuration of the R640 servers to match a wide range of computational and storage requirements.
Dell EMC Live Optics Dell EMC Live Optics software provides an easy, nonintrusive way to collect, analyze, and report performance data from virtually every IT environment. With Live Optics software, you can generate reports showing:
• CPU performance and memory usage
• Read/write IOPS and throughput
• VMware information and performance metrics
• Windows Server metrics
When testing this solution, we used Live Optics software to collect and analyze performance statistics and to develop many of the graphs in this white paper.
This solution uses the following Dell EMC Networking switches:
• S5048-ON—25 GbE, L2- and L3-capable network switch for storage, cluster, and client traffic.
• S3048-ON—1000 BASE-T, L2- and L3-capable switch that provides 48 ports supporting 10 MbE/100 MbE/1 GbE and four 10 GbE SFP+ uplinks. This switch is deployed to support the out-of-band connectivity between the PowerEdge R640 servers and Networking S5048-ON switches.
• S4048-ON—Ultra-low-latency 10/40 GbE top-of-rack switch that is built for applications in the high-performance data center and computing environment. In this solution, the S4048-ON switch is deployed to segregate S2D storage and optional Data Domain backup and recovery network traffic to avoid a single point of failure.
Introduction
Dell EMC S2D Ready Nodes
Dell EMC Networking
Technology overview
8 Dell EMC Ready Solutions for Microsoft SQL: SQL Server 2017 with S2D Ready Node Cluster On-Premises Performance, On-Cloud Cost Savings White Paper
The following key features of Windows Server 2016 apply to this solution.
Note: For a comprehensive overview of new features in Windows Server 2016, see What’s new in Windows Server 2016.
• Hyper-V—The Hyper-V hypervisor enables isolation of applications using VMs. For information about the numerous improvements and new features of Hyper-V, see What’s new in Hyper-V on Windows Server 2016.
• Resilient File System (ReFS)—When used with a mirror or parity space, ReFS can automatically repair detected corruptions using the alternate copy of the data provided by Storage Spaces Direct. ReFS, Microsoft’s newest file system, has been designed for data availability and diverse workloads, which is ideal for SQL Server databases. For more information about ReFS, see Resilient File System (ReFS) overview.
• Storage Spaces Direct—S2D enables using the four PowerEdge R640 servers as highly available and scalable storage with the performance of all-flash drives.
Storage Spaces Direct Traditionally, IT organizations have invested in storage area network (SAN) storage for mission-critical and high-performance database instances. In recent years, organizations have begun looking to software-defined storage for their mission-critical database infrastructure. S2D, a feature of Microsoft Windows Server 2016, is a modern software-defined storage option that can replace expensive SAN infrastructure.
S2D is a cost-optimized storage solution that provides organizations with the performance and resiliency that they need to migrate and upgrade their high-performance databases. S2D has a wealth of features including caching, support for multiple storage tiers, and data protection with erasure coding. The Dell EMC Ready Solution for SQL Server 2017 with S2D Ready Nodes uses S2D to create a database ecosystem that easily plugs into your existing data center and Microsoft Hyper-V virtual infrastructure.
When you invest in S2D with Dell EMC servers, you pay a fraction of the price that is normally associated with a new SAN infrastructure. You could use the savings to significantly improve the ROI in proven Ready Solutions by upgrading from older, out-of-support database instances.
SQL Server 2017 offers industry-leading OLTP, OLAP, and hybrid transaction and analytical processing (HTAP) capabilities in a single database product. Organizations can achieve improved performance, better management control, and greater resiliency when upgrading from SQL Server 2005 and SQL Server 2008. Important new SQL Server improvements include:
• In-memory database features that can increase transactional performance by 30 to 100 times for many queries
• Support for multiple platforms including Linux, Linux-based Docker containers, and Windows
Microsoft Windows Server 2016
Microsoft SQL Server 2017
Technology overview
9 Dell EMC Ready Solutions for Microsoft SQL: SQL Server 2017 with S2D Ready Node Cluster On-Premises Performance, On-Cloud Cost Savings
White Paper
• Automatic database tuning that proactively notifies you when a potential performance problem is detected and lets you make changes or lets the Database Engine fix the problem
• Always On availability groups, which allow databases to remain in service in the event of an unplanned server outage
• Better tools to manage data across the enterprise
• Capability to develop systems of insight by using unstructured data with Microsoft Excel and Microsoft Power BI for better decision analysis
For more information, see What’s new in SQL Server 2017.
The Dell EMC Data Domain DD6300 is a backup appliance that is designed for the modern software-defined data center. The appliance includes comprehensive data protection software that enables organizations of all sizes to protect, archive, and recover mission-critical workloads, regardless of where the data lives. Carefully designed Data Domain solutions accelerate backups by up to 20 times and recovery by up to 10 times for mission-critical applications.
Data Domain deduplication systems perform inline deduplication of backups and enable high-speed recovery of protected applications. The most recent innovation includes flash SSD in Data Domain systems to accelerate protecting critical data. The Data Domain DD6300 has been validated and tested in this new SQL Server Ready Solution. The performance and capacity of the DD6300 include:
• Maximum throughput of up to 8.5 TB/hour
• Maximum throughput of up to 24 TB/hour with Dell EMC Data Domain Boost (DD Boost) software
• Maximum usable capacity of up to 178 TB
Data Domain Boost for Enterprise Applications (DDBEA) is a software agent that integrates with an application’s native management utility. The DDBEA agent performs host-based deduplication, which means that only unique blocks that have not been backed up to the Data Domain system are sent over the network. Key benefits of DDBEA include:
• Faster backups, depending on the application
• Significant network utilization savings because only unique blocks are sent over the network
Dell EMC Data Domain DD6300 appliance
Why Ready Solutions and not just servers?
10 Dell EMC Ready Solutions for Microsoft SQL: SQL Server 2017 with S2D Ready Node Cluster On-Premises Performance, On-Cloud Cost Savings White Paper
Why Ready Solutions and not just servers? Dell EMC improves customer outcomes with Ready Solutions for SQL Server by investing engineering resources into validating and testing the infrastructure that supports robust and easy-to-manage SQL Server environments. Validation starts with a fully documented deployment of the solution in our engineering labs. As a result of the validation work, customers receive the following guides:
• Deployment guide—Provides instructions on how to deploy a Ready Solution for Microsoft SQL Server. The deployment guide helps to accelerate Ready Solution deployment while removing the guesswork and risk.
• Design guide—Provides a detailed view of the Ready Solution and its components. The design guide shows the architecture of the Ready Solution so that you can understand all the design details.
Both guides include best practices so you can understand how to optimize the Ready Solution infrastructure for Microsoft SQL Server databases.
In contrast, purchasing only servers leaves you with the burden of design and deployment. Testing workloads on Ready Solutions is another way we provide value. Providing information about how a solution performs assists you with sizing and developing a plan for optimizing your use of the modern infrastructure.
Ready Solutions for Microsoft SQL Server are supported and managed by a team of deeply committed and experienced professionals who are dedicated to ensuring your success. We understand how critical it is that your databases perform well and that your data is protected from unplanned events. We strive to add value so you can leverage your investment in our Ready Solutions and focus more resources on producing business value.

Load testing and solution validation
11 Dell EMC Ready Solutions for Microsoft SQL: SQL Server 2017 with S2D Ready Node Cluster On-Premises Performance, On-Cloud Cost Savings
White Paper
Load testing and solution validation Our goal in developing a test methodology was to establish a comparison between a state-of-the-art SQL Server consolidation platform from 5 years ago, a legacy system, with a modern hyper-converged system, the Ready Solution for SQL Server. We used a simulated near-real-world workload that could be run on both the legacy system and the new hyper-converged platform. The legacy SQL Server consolidation environment consisted of multiple servers running VMware virtualization connected to a dedicated storage array. The modern hyper-converged consolidation platform is based on Dell EMC Ready Nodes for S2D.
The comparison of legacy and hyper-converged platforms provided a contrast that highlights performance and cost benefits. We designed our test approach to:
• Simulate a real-world OLTP workload comparable to an enterprise resource management system that drives critical back-office operations. The same workload was used on both the legacy system and the modern hyper-converged platform.
• Model additional workload based on simulated testing data. Time and hardware resources are key limiting factors in running a full suite of tests. The Ready Solutions team used data that enabled modeling additional workload on both the legacy and hyper-converged platforms.
Incremental load testing is a good way to measure system performance because workload is added in steps, with metrics collected for each step. Using an incremental load-testing approach can also enable the development of a performance model based on the trends produced by the step metrics. Incremental load testing works by running a load test for a specific workload for a time that is needed for the system to reach a steady state of workload execution. When the first step-load test is complete, the load is increased and held again until the system stabilizes. The trends that result from all or some of the steps can then be used to model performance of additional workload on the same system.
The following figure illustrates the incremental load-test methodology.
Figure 1. Example of an incremental load-test methodology
We developed a test profile that worked across both the legacy and modern hyper-converged platforms. A workload configuration that exerted a workload that was too large might work well on the modern hyper-converged platform but not on the legacy system.
Introduction
Incremental load testing
Load testing and solution validation
12 Dell EMC Ready Solutions for Microsoft SQL: SQL Server 2017 with S2D Ready Node Cluster On-Premises Performance, On-Cloud Cost Savings White Paper
For this reason, we simulated a small database workload. We used Quest Benchmark Factory to simulate users and transactions, and we used the following TPC-E-like configuration:
• A user load of 100 users
• Embedded wait time of 40 ms
• Scale factor of 500 GB database
For configuration details about the S2D Ready Nodes, legacy system, and SQL Server databases that we used in our testing, see Appendix A: Detailed configurations.
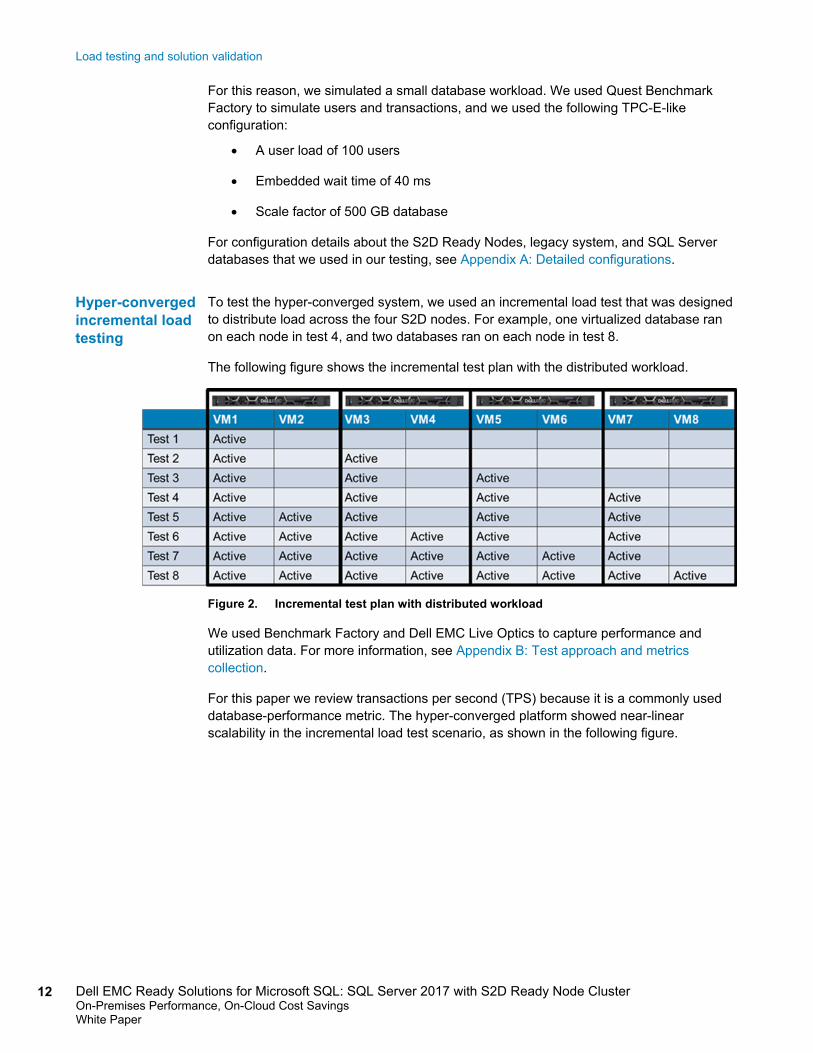
To test the hyper-converged system, we used an incremental load test that was designed to distribute load across the four S2D nodes. For example, one virtualized database ran on each node in test 4, and two databases ran on each node in test 8.
The following figure shows the incremental test plan with the distributed workload.
Figure 2. Incremental test plan with distributed workload
We used Benchmark Factory and Dell EMC Live Optics to capture performance and utilization data. For more information, see Appendix B: Test approach and metrics collection.
For this paper we review transactions per second (TPS) because it is a commonly used database-performance metric. The hyper-converged platform showed near-linear scalability in the incremental load test scenario, as shown in the following figure.
Hyper-converged incremental load testing

Load testing and solution validation
13 Dell EMC Ready Solutions for Microsoft SQL: SQL Server 2017 with S2D Ready Node Cluster On-Premises Performance, On-Cloud Cost Savings
White Paper
Figure 3. Total TPS for each incremental load test
When one virtualized database was running on the platform, it achieved a peak of 1,823 TPS, and when all eight virtualized databases were running, the total TPS was 13,351 and the average TPS was 1,669. The difference is a minor drop of 154 IOPS for each of the eight virtualized databases when compared to the single virtualized database.
After we obtained the incremental load findings through eight virtualized databases on the hyper-converged platform, we modeled four additional databases. In this way, we could achieve a consolidation ratio of 3 to 1, meaning that we had three virtualized databases running on one physical S2D node.
To model the four additional databases, we had to account for a slight degradation in performance of the hyper-converged platform. If characterized correctly, the TPS slope shows how all-flash technology can sustain increased workloads with a minor drop in performance. The goal was to err on the slightly conservative side to provide room for error, meaning that the hyper-converged platform could perform better than our model. We used a 5 percent loss in TPS to model each additional virtualized database. The following figure shows the resulting chart.

Load testing and solution validation
14 Dell EMC Ready Solutions for Microsoft SQL: SQL Server 2017 with S2D Ready Node Cluster On-Premises Performance, On-Cloud Cost Savings White Paper
Figure 4. Model of TPS with four additional databases
The orange data points indicate the four modeled databases. Overall, the slope of the four modeled databases is very close to the slope of the findings for the eight virtualized databases. Using this model, the estimated TPS for 12 databases running on the hyper-converged infrastructure is 19,368.
To provide a comparison with what was considered a leading-edge system for a SQL Server 2008 implementation, we tested a legacy Dell EMC architecture with SQL Server 2008. The goal was to show the performance, scalability, and consolidation improvements that are achievable by moving from a legacy architecture to a modern hyper-converged solution. Key components of the legacy system include:
• SQL Server 2008
• Windows Server 2008 Service Pack 1
• PowerEdge R720 server
• Dedicated SAN: Dell EMC Compellent SC4020
We matched the configuration and size of the databases and the VMs for the tests of both systems.
The following figure illustrates the distributed workload for the legacy incremental load tests.
Figure 5. Legacy incremental test plan with distributed workload
Legacy system incremental load tests
Load testing and solution validation
15 Dell EMC Ready Solutions for Microsoft SQL: SQL Server 2017 with S2D Ready Node Cluster On-Premises Performance, On-Cloud Cost Savings
White Paper
The test methodology for the legacy system is a two-step load test in which the first step is running a single virtualized database and the second step is running two virtualized databases in parallel. Comparing the legacy SQL Server architecture test metrics with the new Ready Solution test metrics provides insights into the advantages of the new hyper-converged infrastructure.
The legacy system uses a dedicated PowerEdge R720 server and a Compellent SC4020 array to support the workload of a virtualized database. Before the advent of hyper-converged platforms, many IT organizations had dedicated servers for production database workloads. The primary disadvantage of having dedicated servers was the resulting server sprawl that increased both capital expenditure and operating expenses. The advantages of having dedicated servers included:
• Deterministic performance—The database had the full resources of the server, which resulted in predictable system performance.
• Periods of peak workloads—Although unused CPU, memory, and storage existed during normal workloads, those resources were available for peak business activity to ensure that database performance did not degrade.
• Isolation—Protecting sensitive data on the dedicated server resulted in the protection of the entire system: server, operating system, and database.
We used the incremental load-test methodology on the legacy system to determine system scalability and to create a comparative model against a modern hyper-converged platform. Running one virtualized database on the PowerEdge R720 server produced 1,683 TPS. Running two virtualized databases produced an average of 1,256 TPS, which is a 25 percent drop in performance. Comparatively, the modern hyper-converged infrastructure dropped 1.43 percent in TPS from the first to the second test. Because a 25 percent loss of TPS is significant, we decided to compare a legacy production environment supporting one virtualized database to the hyper-converged platform supporting twelve virtualized databases. The benefits of this comparison include:
• Increased confidence in moving production databases to the hyper-converged platform—Many DBA teams see risk in moving from a dedicated production environment to a hyper-converged platform. We show how the Ready Solution for SQL Server 2017 with S2D Ready Nodes can easily support these production databases.
• Capital expenditure savings from retiring dedicated legacy production database systems—The IT organization can propose to the business that the investment in the S2D solution can be justified by the savings in decommissioning servers, including:
Reclaimed data center space
Reduced networking and supporting systems
• Operating expense savings from consolidation and centralized management of databases to the hyper-converged infrastructure—The complexity of managing multiple dedicated SQL Server systems increases operational costs. Migrating the SQL Server databases to a standardized platform such as this Ready Solution makes operational savings, such as reduced power and cooling expenditures, achievable.

Load testing and solution validation
16 Dell EMC Ready Solutions for Microsoft SQL: SQL Server 2017 with S2D Ready Node Cluster On-Premises Performance, On-Cloud Cost Savings White Paper
Using the findings of one virtualized database on one PowerEdge R720 server, our tests show a peak TPS of 1,683. To simulate the challenge of server sprawl in managing older SQL Server databases, we show that 11 databases servers are required to achieve 18,513 TPS, as illustrated in the following figure.
Figure 6. Simulated legacy SQL Server environment with 11 servers
The Ready Solution for SQL Server with 12 virtualized databases achieves approximately 19,268 TPS. Comparing the legacy to the modern database solution shows that the 11 databases can be migrated to the new platform, providing the capability to retire the legacy servers and reclaim substantial data center space. In this scenario, the organization achieves nearly a 3 to 1 physical consolidation ratio, as illustrated in the following figure.
Figure 7. Consolidating 11 legacy servers to four S2D nodes
The PowerEdge R720 servers have a 2U form factor, and 11 R720 servers would require 22U or 50 percent of a 42U server rack. With the addition of the Compellent SC4020 storage array that is used in the legacy infrastructure, the total rack space is 24U. Comparatively, the PowerEdge R640 servers in the S2D cluster take 1U each, for a total of 4U for all the nodes. Thus, the capability to achieve a near 3 to 1 consolidation ratio of legacy servers to the modern SQL Server solution means a six-times savings in rack space.
Load testing and solution validation
17 Dell EMC Ready Solutions for Microsoft SQL: SQL Server 2017 with S2D Ready Node Cluster On-Premises Performance, On-Cloud Cost Savings
White Paper
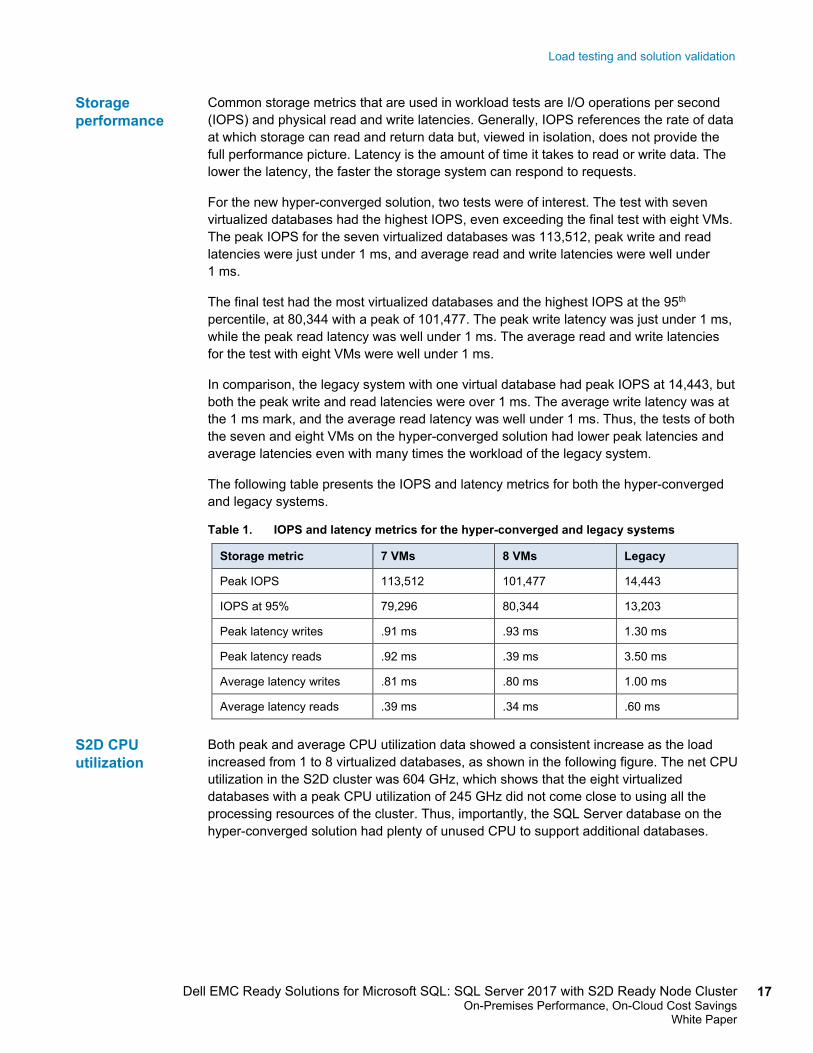
Common storage metrics that are used in workload tests are I/O operations per second (IOPS) and physical read and write latencies. Generally, IOPS references the rate of data at which storage can read and return data but, viewed in isolation, does not provide the full performance picture. Latency is the amount of time it takes to read or write data. The lower the latency, the faster the storage system can respond to requests.
For the new hyper-converged solution, two tests were of interest. The test with seven virtualized databases had the highest IOPS, even exceeding the final test with eight VMs. The peak IOPS for the seven virtualized databases was 113,512, peak write and read latencies were just under 1 ms, and average read and write latencies were well under 1 ms.
The final test had the most virtualized databases and the highest IOPS at the 95th percentile, at 80,344 with a peak of 101,477. The peak write latency was just under 1 ms, while the peak read latency was well under 1 ms. The average read and write latencies for the test with eight VMs were well under 1 ms.
In comparison, the legacy system with one virtual database had peak IOPS at 14,443, but both the peak write and read latencies were over 1 ms. The average write latency was at the 1 ms mark, and the average read latency was well under 1 ms. Thus, the tests of both the seven and eight VMs on the hyper-converged solution had lower peak latencies and average latencies even with many times the workload of the legacy system.
The following table presents the IOPS and latency metrics for both the hyper-converged and legacy systems.
Table 1. IOPS and latency metrics for the hyper-converged and legacy systems
Storage metric 7 VMs 8 VMs Legacy
Peak IOPS 113,512 101,477 14,443
IOPS at 95% 79,296 80,344 13,203
Peak latency writes .91 ms .93 ms 1.30 ms
Peak latency reads .92 ms .39 ms 3.50 ms
Average latency writes .81 ms .80 ms 1.00 ms
Average latency reads .39 ms .34 ms .60 ms
Both peak and average CPU utilization data showed a consistent increase as the load increased from 1 to 8 virtualized databases, as shown in the following figure. The net CPU utilization in the S2D cluster was 604 GHz, which shows that the eight virtualized databases with a peak CPU utilization of 245 GHz did not come close to using all the processing resources of the cluster. Thus, importantly, the SQL Server database on the hyper-converged solution had plenty of unused CPU to support additional databases.
Storage performance
S2D CPU utilization

Load testing and solution validation
18 Dell EMC Ready Solutions for Microsoft SQL: SQL Server 2017 with S2D Ready Node Cluster On-Premises Performance, On-Cloud Cost Savings White Paper
Figure 8. CPU utilization for the SQL Server incremental load test on eight VMs
On the legacy system, the peak CPU reached 47 GHz, with an average of 35 GHz during the load test with one VM. The net clock speed was 112 GHz, so the peak was less than half of the total available CPU. In this case, CPU utilization on the legacy R720 server was not the bottleneck. Rather, it was the substantial loss in IOPS and the impact to read and write latencies that prevented further database scaling on the legacy servers.
0
100
200
300
400
500
600
1 VM 2 VMs 3 VMs 4 VMs 5 VMs 6 VMs 7 VMs 8 VMs
Peak CPU (GHz) Average CPU (GHz)
Legacy CPU utilization
Price comparisons
19 Dell EMC Ready Solutions for Microsoft SQL: SQL Server 2017 with S2D Ready Node Cluster On-Premises Performance, On-Cloud Cost Savings
White Paper
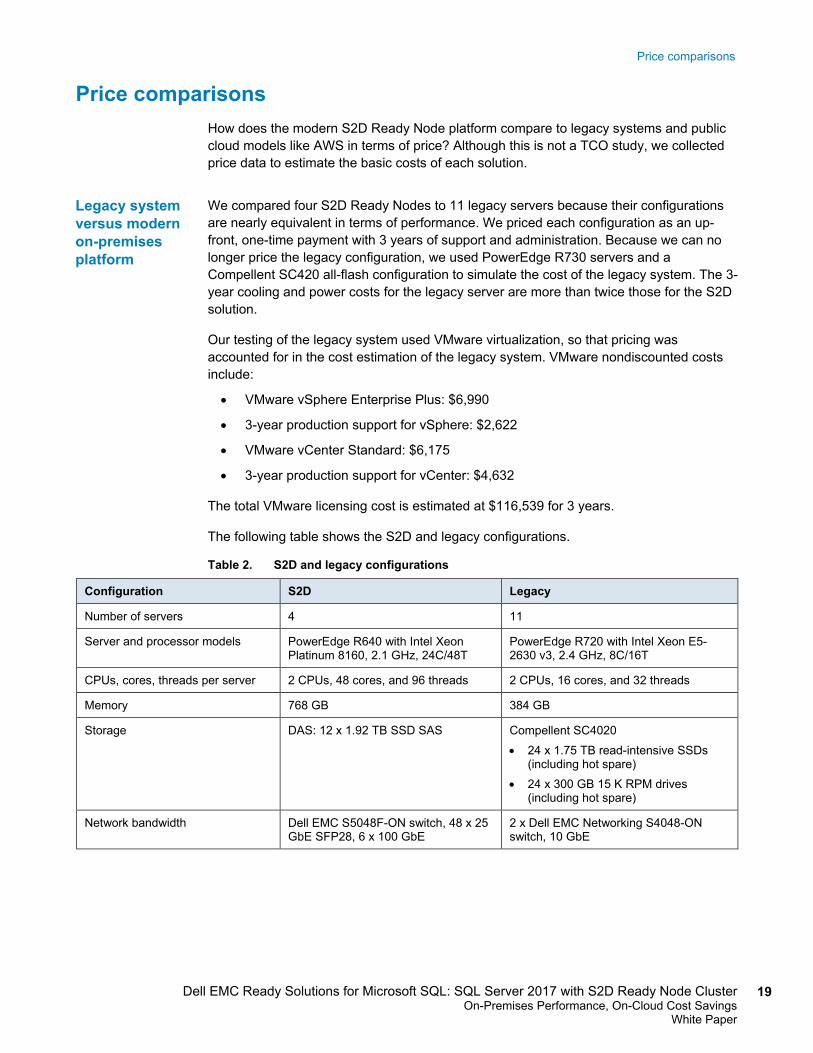
Price comparisons How does the modern S2D Ready Node platform compare to legacy systems and public cloud models like AWS in terms of price? Although this is not a TCO study, we collected price data to estimate the basic costs of each solution.
We compared four S2D Ready Nodes to 11 legacy servers because their configurations are nearly equivalent in terms of performance. We priced each configuration as an up-front, one-time payment with 3 years of support and administration. Because we can no longer price the legacy configuration, we used PowerEdge R730 servers and a Compellent SC420 all-flash configuration to simulate the cost of the legacy system. The 3-year cooling and power costs for the legacy server are more than twice those for the S2D solution.
Our testing of the legacy system used VMware virtualization, so that pricing was accounted for in the cost estimation of the legacy system. VMware nondiscounted costs include:
• VMware vSphere Enterprise Plus: $6,990
• 3-year production support for vSphere: $2,622
• VMware vCenter Standard: $6,175
• 3-year production support for vCenter: $4,632
The total VMware licensing cost is estimated at $116,539 for 3 years.
The following table shows the S2D and legacy configurations.
Table 2. S2D and legacy configurations
Configuration S2D Legacy
Number of servers 4 11
Server and processor models PowerEdge R640 with Intel Xeon Platinum 8160, 2.1 GHz, 24C/48T
PowerEdge R720 with Intel Xeon E5-2630 v3, 2.4 GHz, 8C/16T
CPUs, cores, threads per server 2 CPUs, 48 cores, and 96 threads 2 CPUs, 16 cores, and 32 threads
Memory 768 GB 384 GB
Storage DAS: 12 x 1.92 TB SSD SAS Compellent SC4020 • 24 x 1.75 TB read-intensive SSDs
(including hot spare) • 24 x 300 GB 15 K RPM drives
(including hot spare)
Network bandwidth Dell EMC S5048F-ON switch, 48 x 25 GbE SFP28, 6 x 100 GbE
2 x Dell EMC Networking S4048-ON switch, 10 GbE
Legacy system versus modern on-premises platform
Price comparisons
20 Dell EMC Ready Solutions for Microsoft SQL: SQL Server 2017 with S2D Ready Node Cluster On-Premises Performance, On-Cloud Cost Savings White Paper
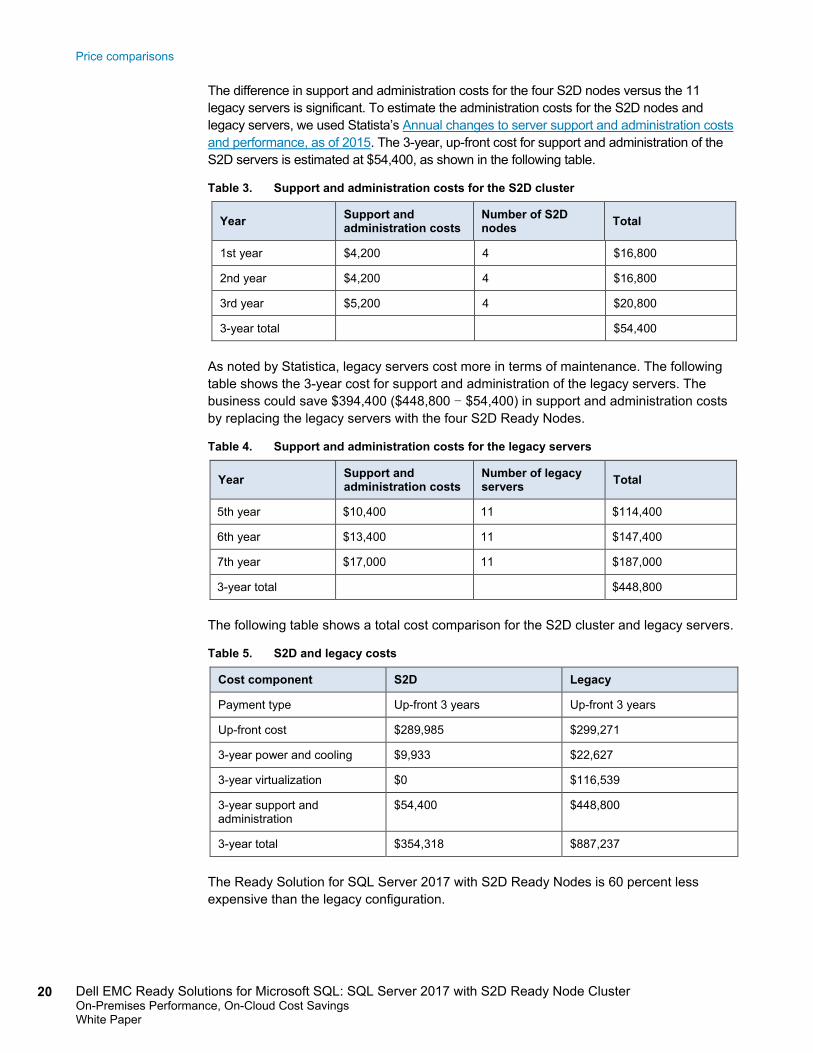
The difference in support and administration costs for the four S2D nodes versus the 11 legacy servers is significant. To estimate the administration costs for the S2D nodes and legacy servers, we used Statista’s Annual changes to server support and administration costs and performance, as of 2015. The 3-year, up-front cost for support and administration of the S2D servers is estimated at $54,400, as shown in the following table.
Table 3. Support and administration costs for the S2D cluster
Year Support and administration costs
Number of S2D nodes Total
1st year $4,200 4 $16,800
2nd year $4,200 4 $16,800
3rd year $5,200 4 $20,800
3-year total $54,400
As noted by Statistica, legacy servers cost more in terms of maintenance. The following table shows the 3-year cost for support and administration of the legacy servers. The business could save $394,400 ($448,800 – $54,400) in support and administration costs by replacing the legacy servers with the four S2D Ready Nodes.
Table 4. Support and administration costs for the legacy servers
Year Support and administration costs
Number of legacy servers Total
5th year $10,400 11 $114,400
6th year $13,400 11 $147,400
7th year $17,000 11 $187,000
3-year total $448,800
The following table shows a total cost comparison for the S2D cluster and legacy servers.
Table 5. S2D and legacy costs
Cost component S2D Legacy
Payment type Up-front 3 years Up-front 3 years
Up-front cost $289,985 $299,271
3-year power and cooling $9,933 $22,627
3-year virtualization $0 $116,539
3-year support and administration
$54,400 $448,800
3-year total $354,318 $887,237
The Ready Solution for SQL Server 2017 with S2D Ready Nodes is 60 percent less expensive than the legacy configuration.
Price comparisons
21 Dell EMC Ready Solutions for Microsoft SQL: SQL Server 2017 with S2D Ready Node Cluster On-Premises Performance, On-Cloud Cost Savings
White Paper
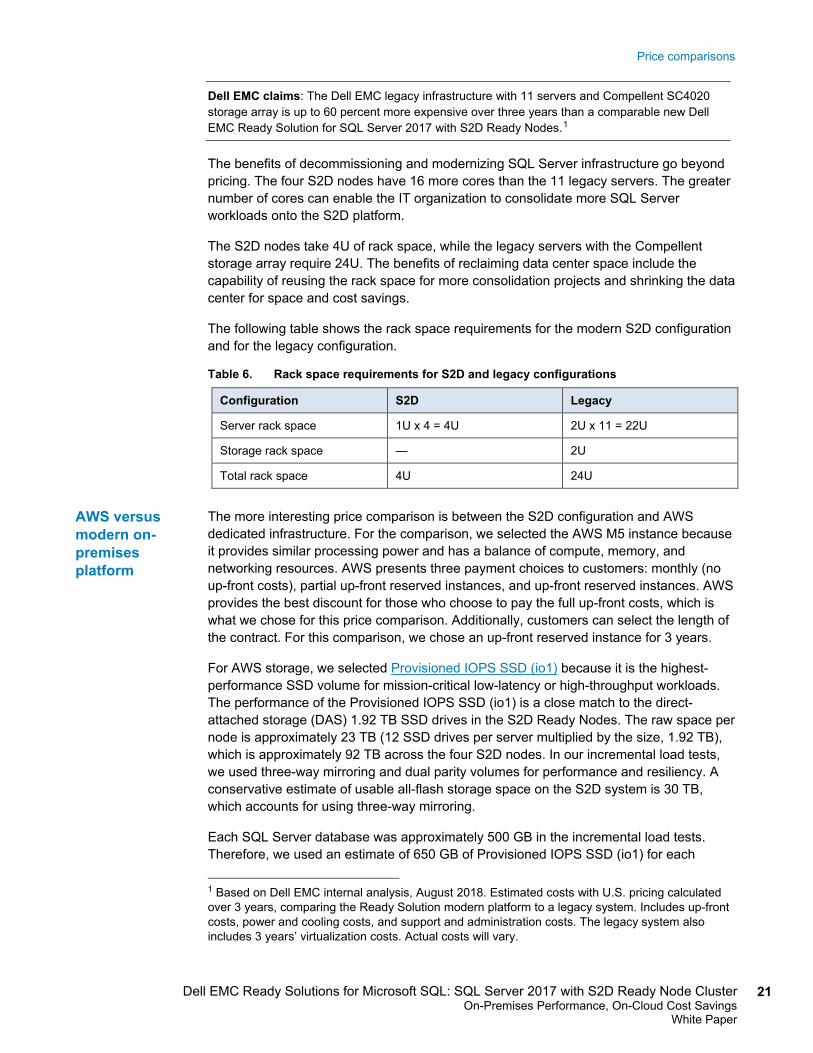
Dell EMC claims: The Dell EMC legacy infrastructure with 11 servers and Compellent SC4020 storage array is up to 60 percent more expensive over three years than a comparable new Dell EMC Ready Solution for SQL Server 2017 with S2D Ready Nodes.1
The benefits of decommissioning and modernizing SQL Server infrastructure go beyond pricing. The four S2D nodes have 16 more cores than the 11 legacy servers. The greater number of cores can enable the IT organization to consolidate more SQL Server workloads onto the S2D platform.
The S2D nodes take 4U of rack space, while the legacy servers with the Compellent storage array require 24U. The benefits of reclaiming data center space include the capability of reusing the rack space for more consolidation projects and shrinking the data center for space and cost savings.
The following table shows the rack space requirements for the modern S2D configuration and for the legacy configuration.
Table 6. Rack space requirements for S2D and legacy configurations
Configuration S2D Legacy
Server rack space 1U x 4 = 4U 2U x 11 = 22U
Storage rack space — 2U
Total rack space 4U 24U
The more interesting price comparison is between the S2D configuration and AWS dedicated infrastructure. For the comparison, we selected the AWS M5 instance because it provides similar processing power and has a balance of compute, memory, and networking resources. AWS presents three payment choices to customers: monthly (no up-front costs), partial up-front reserved instances, and up-front reserved instances. AWS provides the best discount for those who choose to pay the full up-front costs, which is what we chose for this price comparison. Additionally, customers can select the length of the contract. For this comparison, we chose an up-front reserved instance for 3 years.
For AWS storage, we selected Provisioned IOPS SSD (io1) because it is the highest-performance SSD volume for mission-critical low-latency or high-throughput workloads. The performance of the Provisioned IOPS SSD (io1) is a close match to the direct-attached storage (DAS) 1.92 TB SSD drives in the S2D Ready Nodes. The raw space per node is approximately 23 TB (12 SSD drives per server multiplied by the size, 1.92 TB), which is approximately 92 TB across the four S2D nodes. In our incremental load tests, we used three-way mirroring and dual parity volumes for performance and resiliency. A conservative estimate of usable all-flash storage space on the S2D system is 30 TB, which accounts for using three-way mirroring.
Each SQL Server database was approximately 500 GB in the incremental load tests. Therefore, we used an estimate of 650 GB of Provisioned IOPS SSD (io1) for each 1 Based on Dell EMC internal analysis, August 2018. Estimated costs with U.S. pricing calculated over 3 years, comparing the Ready Solution modern platform to a legacy system. Includes up-front costs, power and cooling costs, and support and administration costs. The legacy system also includes 3 years’ virtualization costs. Actual costs will vary.
AWS versus modern on-premises platform
Price comparisons
22 Dell EMC Ready Solutions for Microsoft SQL: SQL Server 2017 with S2D Ready Node Cluster On-Premises Performance, On-Cloud Cost Savings White Paper
database, for a total of 5.2 TB in AWS storage for eight databases. We focused on keeping the AWS storage estimate as close to the database size as possible because the storage is expensive.
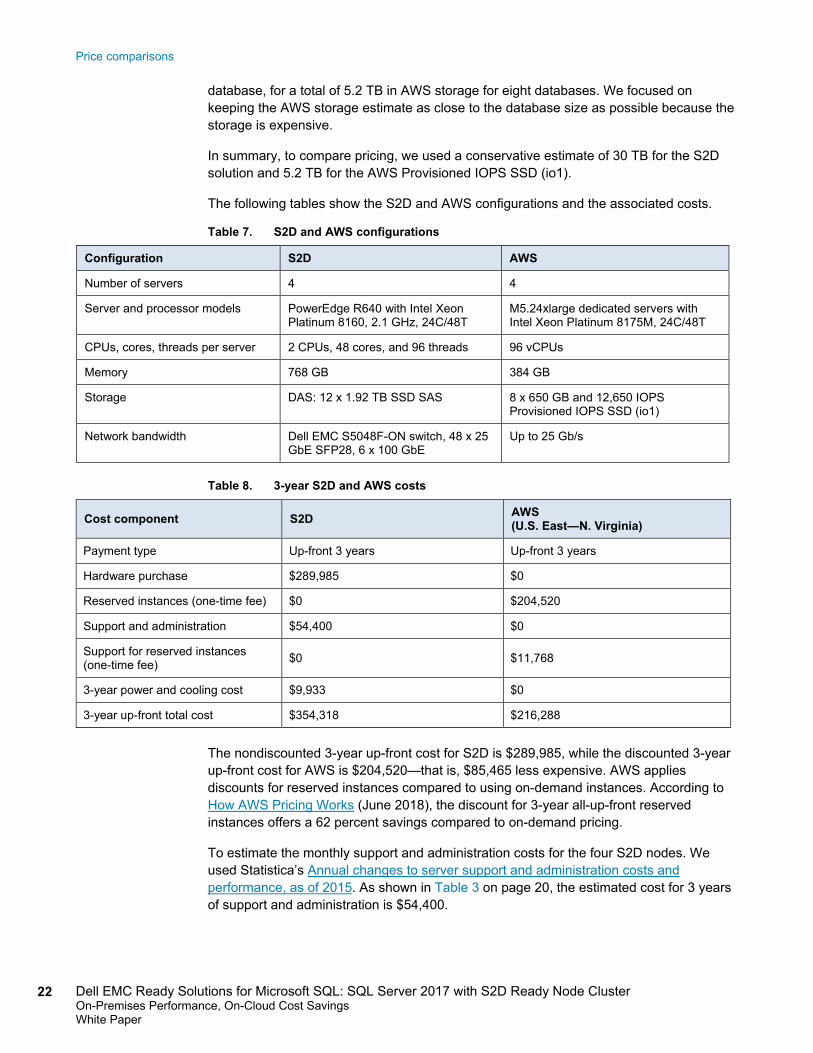
In summary, to compare pricing, we used a conservative estimate of 30 TB for the S2D solution and 5.2 TB for the AWS Provisioned IOPS SSD (io1).
The following tables show the S2D and AWS configurations and the associated costs.
Table 7. S2D and AWS configurations
Configuration S2D AWS
Number of servers 4 4
Server and processor models PowerEdge R640 with Intel Xeon Platinum 8160, 2.1 GHz, 24C/48T
M5.24xlarge dedicated servers with Intel Xeon Platinum 8175M, 24C/48T
CPUs, cores, threads per server 2 CPUs, 48 cores, and 96 threads 96 vCPUs
Memory 768 GB 384 GB
Storage DAS: 12 x 1.92 TB SSD SAS 8 x 650 GB and 12,650 IOPS Provisioned IOPS SSD (io1)
Network bandwidth Dell EMC S5048F-ON switch, 48 x 25 GbE SFP28, 6 x 100 GbE
Up to 25 Gb/s
Table 8. 3-year S2D and AWS costs
Cost component S2D AWS (U.S. East—N. Virginia)
Payment type Up-front 3 years Up-front 3 years
Hardware purchase $289,985 $0
Reserved instances (one-time fee) $0 $204,520
Support and administration $54,400 $0
Support for reserved instances (one-time fee) $0 $11,768
3-year power and cooling cost $9,933 $0
3-year up-front total cost $354,318 $216,288
The nondiscounted 3-year up-front cost for S2D is $289,985, while the discounted 3-year up-front cost for AWS is $204,520—that is, $85,465 less expensive. AWS applies discounts for reserved instances compared to using on-demand instances. According to How AWS Pricing Works (June 2018), the discount for 3-year all-up-front reserved instances offers a 62 percent savings compared to on-demand pricing.
To estimate the monthly support and administration costs for the four S2D nodes. We used Statistica’s Annual changes to server support and administration costs and performance, as of 2015. As shown in Table 3 on page 20, the estimated cost for 3 years of support and administration is $54,400.
Price comparisons
23 Dell EMC Ready Solutions for Microsoft SQL: SQL Server 2017 with S2D Ready Node Cluster On-Premises Performance, On-Cloud Cost Savings
White Paper
The one-time fee for AWS reserved-instance support costs $11,768. Comparing the estimated 3-year up-front support and administration cost for the four S2D nodes to the AWS one-time support fee, AWS offers a savings of $46,632.
Finally, we estimated 3-year up-front power and cooling costs for the S2D cluster. Using Dell EMC internal tools, we estimated that 3-year cost at $9,933. A power and cooling cost estimate for the AWS instances does not apply because the assumption is that these costs are part of the 3-year up-front reserved-instance cost. This completes the review of the 3-year all-up-front costs.
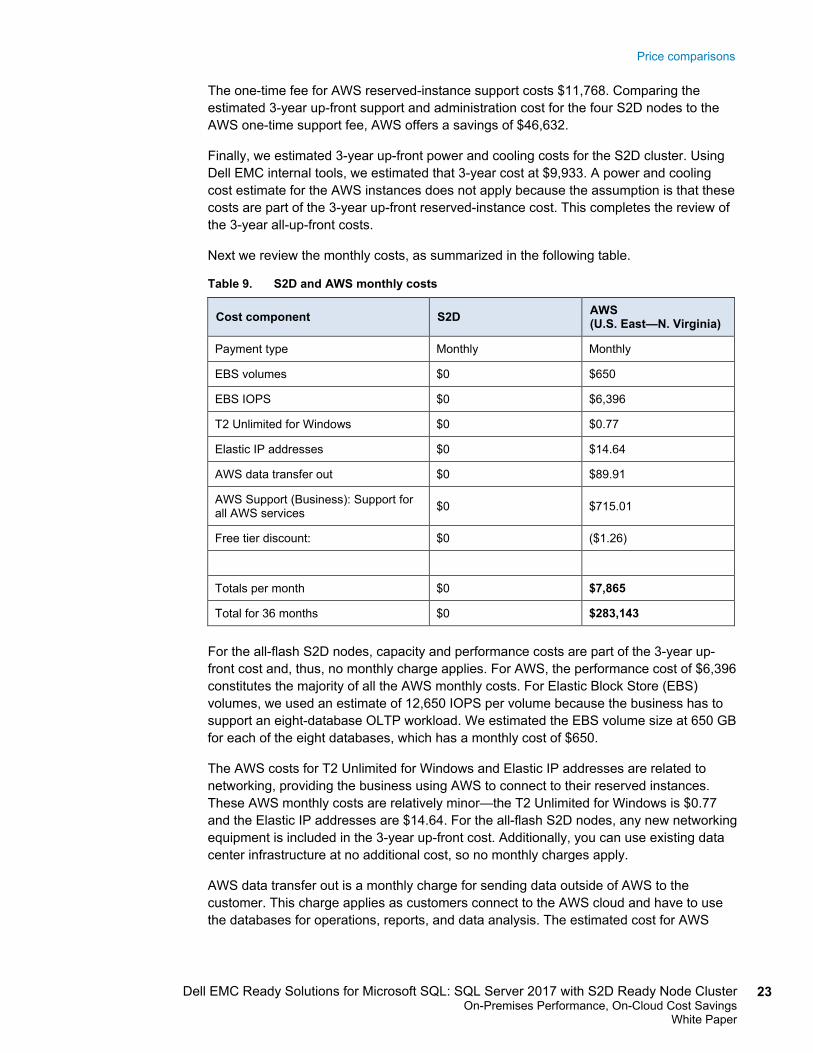
Next we review the monthly costs, as summarized in the following table.
Table 9. S2D and AWS monthly costs
Cost component S2D AWS (U.S. East—N. Virginia)
Payment type Monthly Monthly
EBS volumes $0 $650
EBS IOPS $0 $6,396
T2 Unlimited for Windows $0 $0.77
Elastic IP addresses $0 $14.64
AWS data transfer out $0 $89.91
AWS Support (Business): Support for all AWS services $0 $715.01
Free tier discount: $0 ($1.26)
Totals per month $0 $7,865
Total for 36 months $0 $283,143
For the all-flash S2D nodes, capacity and performance costs are part of the 3-year up-front cost and, thus, no monthly charge applies. For AWS, the performance cost of $6,396 constitutes the majority of all the AWS monthly costs. For Elastic Block Store (EBS) volumes, we used an estimate of 12,650 IOPS per volume because the business has to support an eight-database OLTP workload. We estimated the EBS volume size at 650 GB for each of the eight databases, which has a monthly cost of $650.
The AWS costs for T2 Unlimited for Windows and Elastic IP addresses are related to networking, providing the business using AWS to connect to their reserved instances. These AWS monthly costs are relatively minor—the T2 Unlimited for Windows is $0.77 and the Elastic IP addresses are $14.64. For the all-flash S2D nodes, any new networking equipment is included in the 3-year up-front cost. Additionally, you can use existing data center infrastructure at no additional cost, so no monthly charges apply.
AWS data transfer out is a monthly charge for sending data outside of AWS to the customer. This charge applies as customers connect to the AWS cloud and have to use the databases for operations, reports, and data analysis. The estimated cost for AWS
Price comparisons
24 Dell EMC Ready Solutions for Microsoft SQL: SQL Server 2017 with S2D Ready Node Cluster On-Premises Performance, On-Cloud Cost Savings White Paper
data transfer out is $89.91. In comparison, the S2D cluster is internal to the business and, thus, monthly charges for data transfer out do not apply.
AWS Support (Business) is a monthly charge to cover support for all AWS services. The cost of this support for all services is $715.01 per month. In comparison, the support and administration costs for the S2D cluster are part of the 3-year up-front costs, so, again, monthly charges do not apply.
The S2D Ready Solution costs less in terms of both capacity and IOPS, but particularly, IOPS. Databases are one of the most demanding applications on storage, and the storage layer must support the IOPS at low latencies to drive good performance. When purchasing the all-flash S2D Ready Nodes, you pay for the IOPS and low latency as part of the Ready Node and have no related monthly expenses. Whether a database uses 2,000 IOPS or 20,000 IOPS, the cost remains the same for the Ready Node.
In this comparison, the final cost of the Dell EMC S2D solution is $354,318. The cost of the AWS configuration is $499,431, which includes 3 years of up-front costs at $216,288 and monthly expenses for 36 months at $283,143. The AWS configuration is 29 percent more expensive than the S2D solution.
Dell EMC claims: The AWS public cloud solution using reserved M5 servers is up to 29 percent more expensive over three years than a comparable Dell EMC Ready Solution for SQL Server 2017 with S2D Ready Nodes on-premises solution.2
The S2D nodes take 4U of rack space compared to AWS M5 instances, which are hosted in the public cloud. Thus, AWS offers a minor data center space savings compared to the S2D solution.
In summary:
• S2D is approximately 29 percent less expensive than a comparatively configured AWS solution using M5 dedicated instances.
• S2D usable space is approximately 30 TB, and the space quoted from AWS is 5.2 TB of Provisioned IOPS SSD (io1) with 12,650 IOPS for each volume.
• S2D Ready Nodes have 768 GB of memory, and the AWS M5.24xlarge offers 384 GB.
This is a simple price comparison, and pricing will vary for each customer. The goal is to give you an estimation of how the Ready Solution for Microsoft SQL compares to the public cloud in terms of cost.
2 Based on Dell EMC internal analysis, August 2018. Estimated costs with U.S. pricing calculated over 3 years, comparing the Ready Solution to an equivalent AWS cloud solution. Includes up-front costs, power and cooling costs, and administration and support costs. The AWS solution also includes 36 months of monthly expenses. Public online calculator used for AWS pricing estimates. Actual costs will vary.
Integrated protection with Data Domain DD6300
25 Dell EMC Ready Solutions for Microsoft SQL: SQL Server 2017 with S2D Ready Node Cluster On-Premises Performance, On-Cloud Cost Savings
White Paper
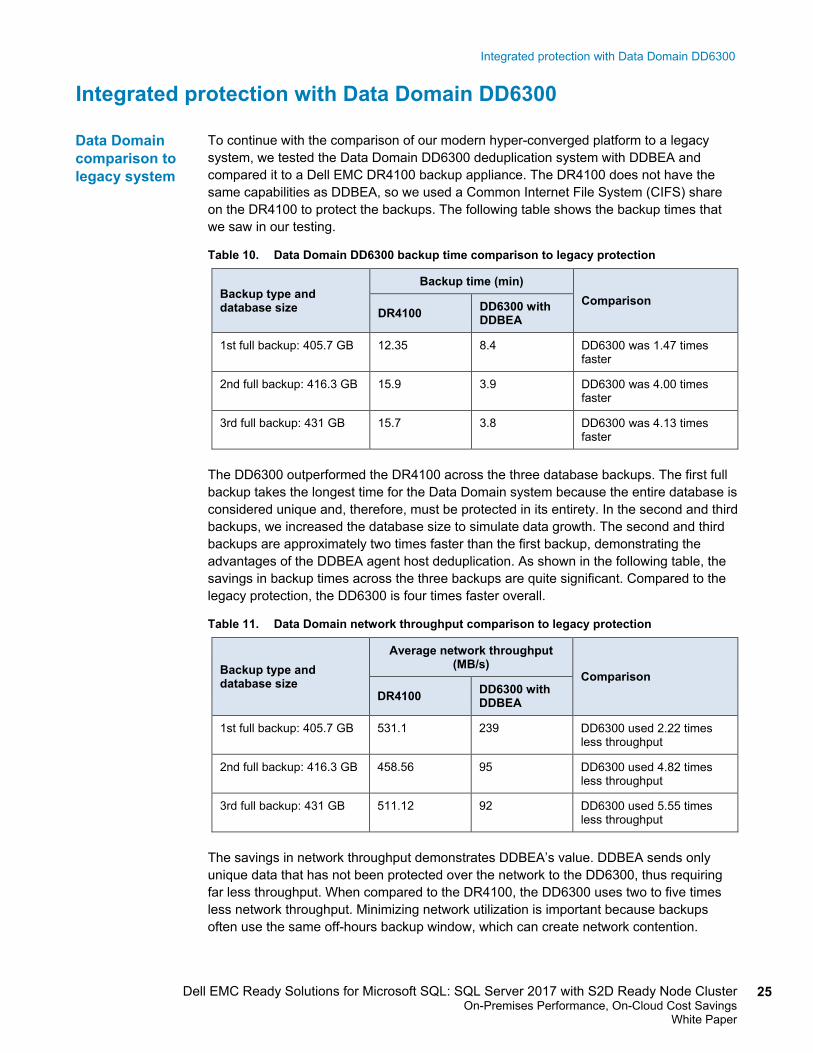
Integrated protection with Data Domain DD6300 To continue with the comparison of our modern hyper-converged platform to a legacy system, we tested the Data Domain DD6300 deduplication system with DDBEA and compared it to a Dell EMC DR4100 backup appliance. The DR4100 does not have the same capabilities as DDBEA, so we used a Common Internet File System (CIFS) share on the DR4100 to protect the backups. The following table shows the backup times that we saw in our testing.
Table 10. Data Domain DD6300 backup time comparison to legacy protection
Backup type and database size
Backup time (min) Comparison
DR4100 DD6300 with DDBEA
1st full backup: 405.7 GB 12.35 8.4 DD6300 was 1.47 times faster
2nd full backup: 416.3 GB 15.9 3.9 DD6300 was 4.00 times faster
3rd full backup: 431 GB 15.7 3.8 DD6300 was 4.13 times faster
The DD6300 outperformed the DR4100 across the three database backups. The first full backup takes the longest time for the Data Domain system because the entire database is considered unique and, therefore, must be protected in its entirety. In the second and third backups, we increased the database size to simulate data growth. The second and third backups are approximately two times faster than the first backup, demonstrating the advantages of the DDBEA agent host deduplication. As shown in the following table, the savings in backup times across the three backups are quite significant. Compared to the legacy protection, the DD6300 is four times faster overall.
Table 11. Data Domain network throughput comparison to legacy protection
Backup type and database size
Average network throughput (MB/s)
Comparison DR4100 DD6300 with
DDBEA
1st full backup: 405.7 GB 531.1 239 DD6300 used 2.22 times less throughput
2nd full backup: 416.3 GB 458.56 95 DD6300 used 4.82 times less throughput
3rd full backup: 431 GB 511.12 92 DD6300 used 5.55 times less throughput
The savings in network throughput demonstrates DDBEA’s value. DDBEA sends only unique data that has not been protected over the network to the DD6300, thus requiring far less throughput. When compared to the DR4100, the DD6300 uses two to five times less network throughput. Minimizing network utilization is important because backups often use the same off-hours backup window, which can create network contention.
Data Domain comparison to legacy system
Integrated protection with Data Domain DD6300
26 Dell EMC Ready Solutions for Microsoft SQL: SQL Server 2017 with S2D Ready Node Cluster On-Premises Performance, On-Cloud Cost Savings White Paper
Once it is protected on the Data Domain appliance, a SQL Server database or any application gets compressed. Test findings show that the first backup used 87.5 GB of space, the second backup used 10.18 GB, and the third backup used 19.5 GB. With these backup space savings, the DBA team can keep more backups on the Data Domain system, thus improving consolidation of backups.
You do not have a data protection strategy if the organization cannot recover a database or application quickly. To complete the validation and test work, we restored the 431 GB SQL Server database from the DD6300 to the S2D platform. The full restore of the database took 9.25 minutes and had an average network throughput of 1,239 MB/s.
The Data Domain deduplication system is an optional, validated add-on to the Ready Solution for SQL Server with S2D. The system can be configured to meet the demands of the organization, and it can be easily integrated to protect SQL Server and other applications.
Database restore from Data Domain system
Conclusion
27 Dell EMC Ready Solutions for Microsoft SQL: SQL Server 2017 with S2D Ready Node Cluster On-Premises Performance, On-Cloud Cost Savings
White Paper
Conclusion The new Ready Solution for Microsoft SQL Server 2017 with S2D offers the performance and resiliency that are needed for a modern database platform without the associated price. The ability to combine processing power to deliver both database and storage performance makes the S2D Ready Nodes highly competitive with cloud-based pricing. Your organization can have savings that are similar to or better than cloud offerings without the complexities and security concerns that come from moving sensitive data to the cloud. The elasticity in the solution design gives the IT team the ability to add another S2D node to address incremental growth.
The public cloud offers one advantage in that it takes no on-premises data center space. However, this advantage is slight because the four-node S2D solution takes only 4U of rack space. Our validation of this solution has shown these key consolidation benefits:
• Nearly 3 to 1 physical-consolidation ratio (11 legacy servers to 4 S2D nodes)
• 3 to 1 database-to-S2D-node ratio, achieved through workload modeling
Decommissioning legacy servers means alleviating pressure on the IT budget to spend on outdated technology and provides more money for innovation. The inflection point is the capability to consolidate both physical servers and databases to a validated SQL Server solution such as a Dell EMC Ready Solution.
DBAs might be concerned about moving from a dedicated database environment to a hyper-converged platform, but our performance tests findings have been impressive:
• High rate of TPS for the virtualized databases
• Near-linear scalability for the all-flash S2D cluster
• High IOPS combined with sub-millisecond peak and average read and write latencies
Migrating to a modern database platform can trigger data protection planning. Data Domain DD6300 has been validated and tested with the Ready Solution for SQL Server 2017 with S2D Ready Nodes to provide a way to quickly back up and restore databases. In our testing, the third full backup of a 431 GB SQL Server database took 3.8 minutes, and restoring the same database took 9.25 minutes.
A Dell EMC representative can help you customize the Ready Solution for SQL Server to match your business requirements and to achieve your performance, resiliency, and data protection goals.
References
28 Dell EMC Ready Solutions for Microsoft SQL: SQL Server 2017 with S2D Ready Node Cluster On-Premises Performance, On-Cloud Cost Savings White Paper
References For SQL Server Ready Solution documentation, see Solutions for Microsoft SQL Server Info Hub—Documentation on the Everything Microsoft at Dell EMC Community forum.
The following pages on Dell.com provide additional and relevant information:
• PowerEdge R640 Rack Server
• Dell EMC Live Optics
The following documentation on the Microsoft Developer Network (MSDN), Microsoft Support, Microsoft Blog, or Microsoft.com provides additional and relevant information:
• SQL Server Release Services: SQL Server 2005 end of life and upgrade options
• Microsoft Lifecycle Policy: Search product lifecycle
• Upgrade your way to a modern data platform – End of support for SQL Server 2005 less than 6 months away
• Storage Spaces Direct overview
• Automatic tuning
Dell EMC
Microsoft
Appendix A: Detailed configurations
29 Dell EMC Ready Solutions for Microsoft SQL: SQL Server 2017 with S2D Ready Node Cluster On-Premises Performance, On-Cloud Cost Savings
White Paper
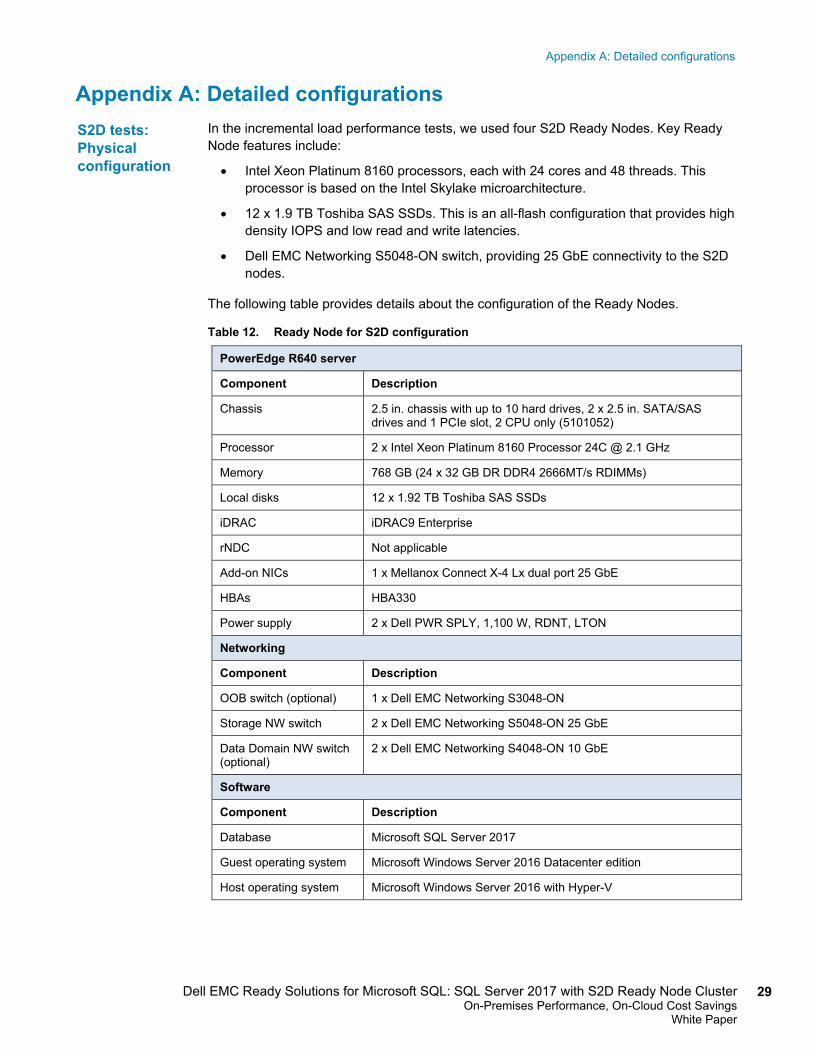
Appendix A: Detailed configurations In the incremental load performance tests, we used four S2D Ready Nodes. Key Ready Node features include:
• Intel Xeon Platinum 8160 processors, each with 24 cores and 48 threads. This processor is based on the Intel Skylake microarchitecture.
• 12 x 1.9 TB Toshiba SAS SSDs. This is an all-flash configuration that provides high density IOPS and low read and write latencies.
• Dell EMC Networking S5048-ON switch, providing 25 GbE connectivity to the S2D nodes.
The following table provides details about the configuration of the Ready Nodes.
Table 12. Ready Node for S2D configuration
PowerEdge R640 server
Component Description
Chassis 2.5 in. chassis with up to 10 hard drives, 2 x 2.5 in. SATA/SAS drives and 1 PCIe slot, 2 CPU only (5101052)
Processor 2 x Intel Xeon Platinum 8160 Processor 24C @ 2.1 GHz
Memory 768 GB (24 x 32 GB DR DDR4 2666MT/s RDIMMs)
Local disks 12 x 1.92 TB Toshiba SAS SSDs
iDRAC iDRAC9 Enterprise
rNDC Not applicable
Add-on NICs 1 x Mellanox Connect X-4 Lx dual port 25 GbE
HBAs HBA330
Power supply 2 x Dell PWR SPLY, 1,100 W, RDNT, LTON
Networking
Component Description
OOB switch (optional) 1 x Dell EMC Networking S3048-ON
Storage NW switch 2 x Dell EMC Networking S5048-ON 25 GbE
Data Domain NW switch (optional)
2 x Dell EMC Networking S4048-ON 10 GbE
Software
Component Description
Database Microsoft SQL Server 2017
Guest operating system Microsoft Windows Server 2016 Datacenter edition
Host operating system Microsoft Windows Server 2016 with Hyper-V
S2D tests: Physical configuration
Appendix A: Detailed configurations
30 Dell EMC Ready Solutions for Microsoft SQL: SQL Server 2017 with S2D Ready Node Cluster On-Premises Performance, On-Cloud Cost Savings White Paper
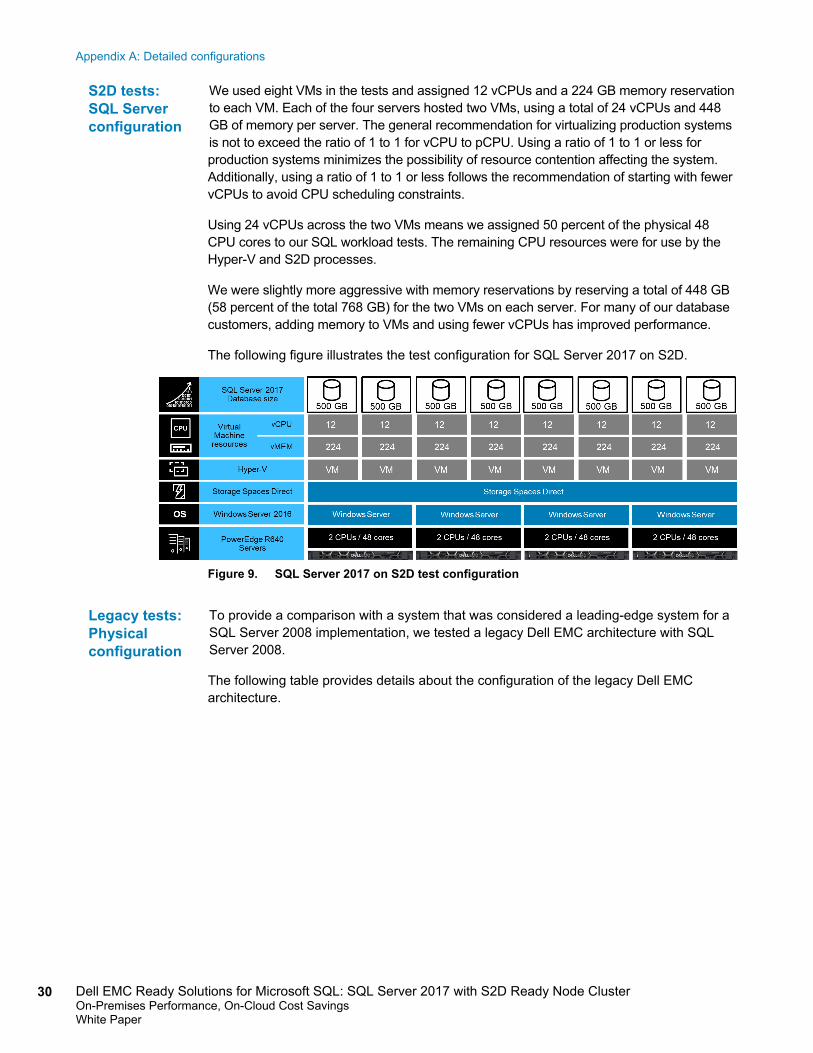
We used eight VMs in the tests and assigned 12 vCPUs and a 224 GB memory reservation to each VM. Each of the four servers hosted two VMs, using a total of 24 vCPUs and 448 GB of memory per server. The general recommendation for virtualizing production systems is not to exceed the ratio of 1 to 1 for vCPU to pCPU. Using a ratio of 1 to 1 or less for production systems minimizes the possibility of resource contention affecting the system. Additionally, using a ratio of 1 to 1 or less follows the recommendation of starting with fewer vCPUs to avoid CPU scheduling constraints.
Using 24 vCPUs across the two VMs means we assigned 50 percent of the physical 48 CPU cores to our SQL workload tests. The remaining CPU resources were for use by the Hyper-V and S2D processes.
We were slightly more aggressive with memory reservations by reserving a total of 448 GB (58 percent of the total 768 GB) for the two VMs on each server. For many of our database customers, adding memory to VMs and using fewer vCPUs has improved performance.
The following figure illustrates the test configuration for SQL Server 2017 on S2D.
Figure 9. SQL Server 2017 on S2D test configuration
To provide a comparison with a system that was considered a leading-edge system for a SQL Server 2008 implementation, we tested a legacy Dell EMC architecture with SQL Server 2008.
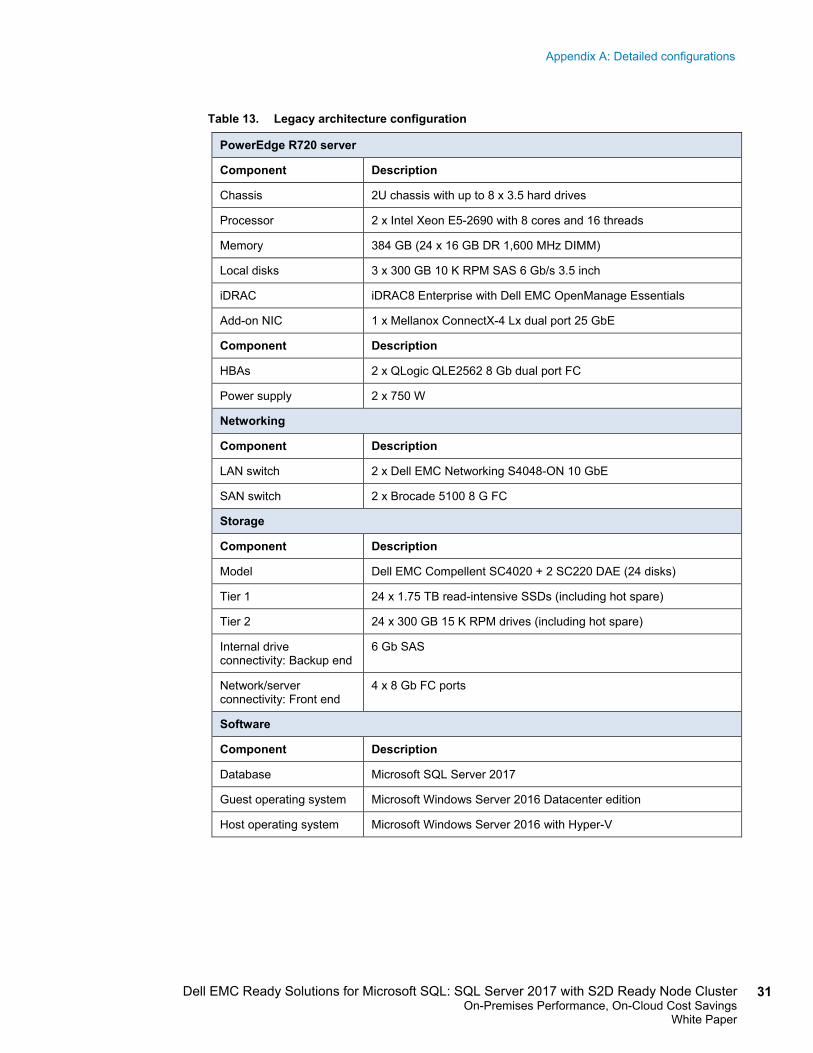
The following table provides details about the configuration of the legacy Dell EMC architecture.
S2D tests: SQL Server configuration
Legacy tests: Physical configuration
Appendix A: Detailed configurations
31 Dell EMC Ready Solutions for Microsoft SQL: SQL Server 2017 with S2D Ready Node Cluster On-Premises Performance, On-Cloud Cost Savings
White Paper
Table 13. Legacy architecture configuration
PowerEdge R720 server
Component Description
Chassis 2U chassis with up to 8 x 3.5 hard drives
Processor 2 x Intel Xeon E5-2690 with 8 cores and 16 threads
Memory 384 GB (24 x 16 GB DR 1,600 MHz DIMM)
Local disks 3 x 300 GB 10 K RPM SAS 6 Gb/s 3.5 inch
iDRAC iDRAC8 Enterprise with Dell EMC OpenManage Essentials
Add-on NIC 1 x Mellanox ConnectX-4 Lx dual port 25 GbE
Component Description
HBAs 2 x QLogic QLE2562 8 Gb dual port FC
Power supply 2 x 750 W
Networking
Component Description
LAN switch 2 x Dell EMC Networking S4048-ON 10 GbE
SAN switch 2 x Brocade 5100 8 G FC
Storage
Component Description
Model Dell EMC Compellent SC4020 + 2 SC220 DAE (24 disks)
Tier 1 24 x 1.75 TB read-intensive SSDs (including hot spare)
Tier 2 24 x 300 GB 15 K RPM drives (including hot spare)
Internal drive connectivity: Backup end
6 Gb SAS
Network/server connectivity: Front end
4 x 8 Gb FC ports
Software
Component Description
Database Microsoft SQL Server 2017
Guest operating system Microsoft Windows Server 2016 Datacenter edition
Host operating system Microsoft Windows Server 2016 with Hyper-V
Appendix A: Detailed configurations
32 Dell EMC Ready Solutions for Microsoft SQL: SQL Server 2017 with S2D Ready Node Cluster On-Premises Performance, On-Cloud Cost Savings White Paper
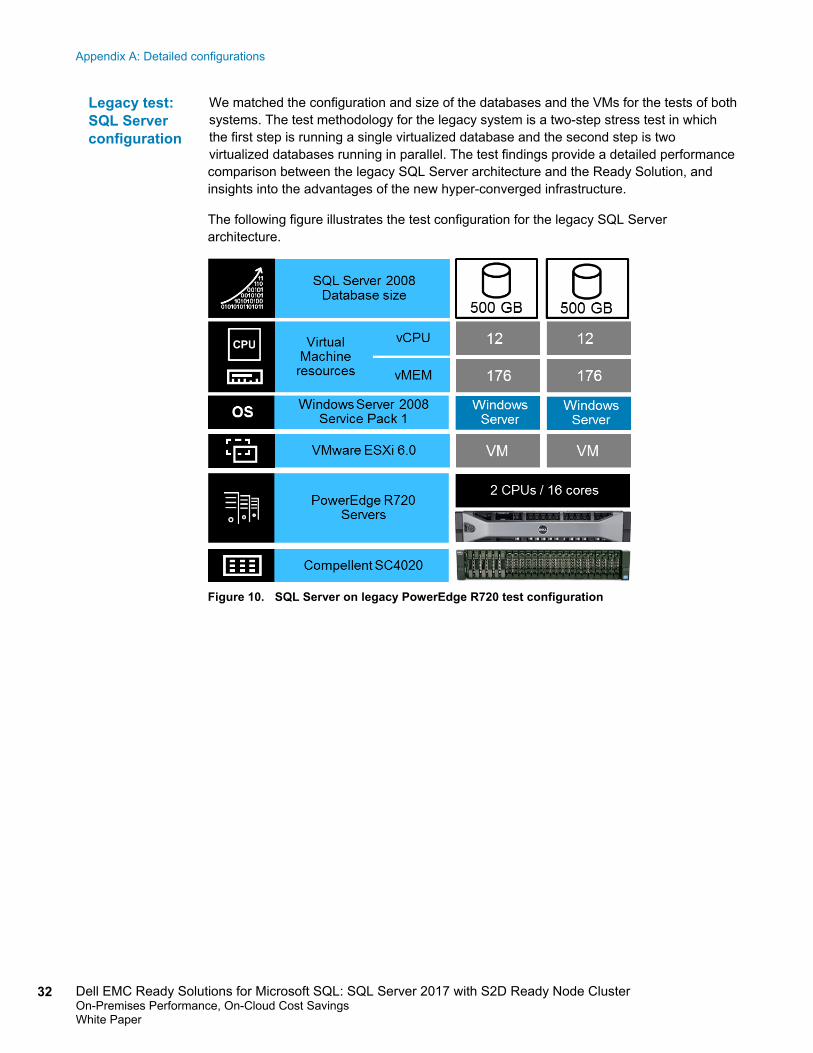
We matched the configuration and size of the databases and the VMs for the tests of both systems. The test methodology for the legacy system is a two-step stress test in which the first step is running a single virtualized database and the second step is two virtualized databases running in parallel. The test findings provide a detailed performance comparison between the legacy SQL Server architecture and the Ready Solution, and insights into the advantages of the new hyper-converged infrastructure.
The following figure illustrates the test configuration for the legacy SQL Server architecture.
Figure 10. SQL Server on legacy PowerEdge R720 test configuration
Legacy test: SQL Server configuration
Appendix B: Test approach and metrics collection
33 Dell EMC Ready Solutions for Microsoft SQL: SQL Server 2017 with S2D Ready Node Cluster On-Premises Performance, On-Cloud Cost Savings
White Paper
Appendix B: Test approach and metrics collection
Quest Benchmark Factory is a software program used to test database performance by simulating users and transactions. We used Benchmark Factory to simulate a transactional database workload. For example, the database workload is similar to business suites used to support back office operations. The Benchmark Factory TPC-E-like configuration included:
• A user load of 100 to generate the database workload
• Embedded wait time of 14 ms
• Scale factor of a 500 GB database
Benchmark Factory and Dell EMC Live Optics captured detailed performance metrics. From Benchmark Factory, we reviewed the following metrics:
• Transactions per second (TPS)—Number of transactions, or SQL statements, processed by the server per second. The greater the value of TPS, the faster the system is processing transactions.
• Bytes per second (BPS)—Number of bytes processed per second over the sampling period. The greater the value of BPS, the more data the system is processing.
From Live Optics, we reviewed the following metrics:
• Peak CPU (GHz)–High watermark of CPU utilization during the workload tests. This metric is useful because it shows the extent of CPU resource utilization during the tests.
• Average CPU (GHz)—Central CPU utilization during the workload tests. Average CPU utilization is useful because it shows the steady state of CPU usage during the tests.
• Peak IOPS—High watermark of IOPS during the workload tests. Analyzing IOPS with latency provides an accurate picture of storage performance.
• SQL Server average read latency—Wait time for the database to perform a physical read from storage. The lower the read latency, the faster the storage.
• SQL Server average write latency—Wait time for the database to perform a physical write from storage. The lower the write latency, the faster storage can acknowledge a write to the database.
Test approach
Metrics collection