delivering growth and excellence - bocpic.bankofchina.com/bocappd/report/201406/p... · bank of...
TRANSCRIPT
Delivering Growth and ExcellenceBank of China Limited
2008 Annual Results
Mar 24, 2009

1
Forward-looking Statement Disclaimer
This presentation and subsequent discussions may contain forward-looking statements that involve risks and uncertainties. These statements are generally indicated by the use of forward-looking terminology such as believe, expect, anticipate, estimate, plan, project, target, may, will or may be expressed to be results of actions that may or are expected to occur in the future. You should not place undue reliance on these forward-looking statements, which reflect our belief only as of the date of this presentation. These forward-looking statements are based on our own information and on information from other sources we believe to be reliable. They relate to future events or our future financial, business or other performance and are subject to a number of uncertainties that may cause our actual results to differ materially.

2
Presentation Team
Mr. Zhu Min, Executive Vice President
Mr. Li Lihui, Vice Chairman & President
Mr. Chen Siqing, Executive Vice President

3
1 Key performance highlights and strategy Mr. Li Lihui, President
2 2008 Annual Results and 2009 Outlook Mr. Zhu Min,Executive Vice President
Agenda Speaker
Agenda

4
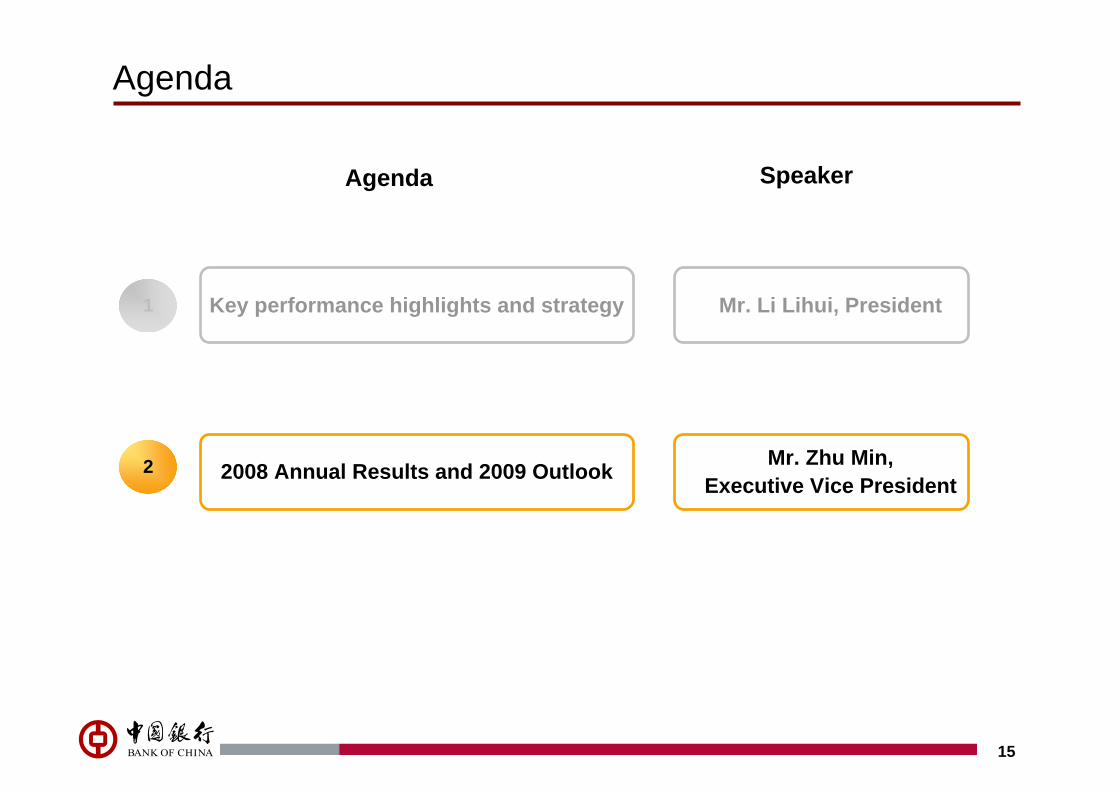
Agenda
1 Key performance highlights and strategy Mr. Li Lihui, President
2 2008 Annual Results and 2009 Outlook Mr. Zhu Min,Executive Vice President
Agenda Speaker
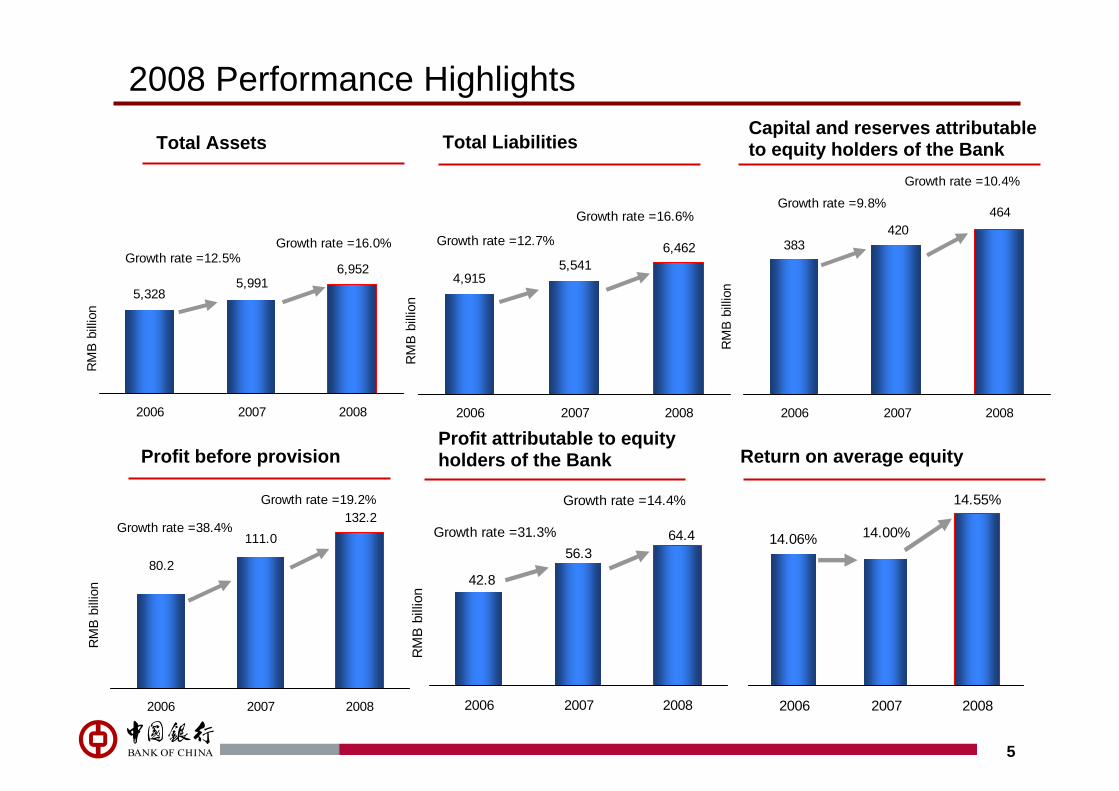
42.8
56.364.4
2006 2007 2008
RM
B b
illio
n
Growth rate =31.3%
Growth rate =14.4%
5,3285,991
6,952
2006 2007 2008
RM
B b
illio
n
Growth rate =12.5%Growth rate =16.0%
Profit before provision
464420
383
2006 2007 2008
RM
B b
illio
n
Growth rate =9.8%
Growth rate =10.4%
5
2008 Performance Highlights
Total Assets Total LiabilitiesCapital and reserves attributable to equity holders of the Bank
Profit attributable to equity holders of the Bank Return on average equity
4,9155,541
6,462
2006 2007 2008R
MB
bill
ion
Growth rate =12.7%
Growth rate =16.6%
80.2
111.0132.2
2006 2007 2008
RM
B b
illio
n
Growth rate =38.4%
Growth rate =19.2% 14.55%
14.00%14.06%
2006 2007 2008

16.06%16.05%
2007 2008
7.02%8.06%
2007 2008
8.40%8.13%
2007 2008
6.25%6.54%
2007 2008
6
Enhanced Competitiveness
Market share of RMB corporate loans
Market share of RMB corporate deposits
Market share of RMB personal loans
Market share of issued credit card volume
Leading position in various business lines
Corporate Banking Business
Leading position in foreign currency-denominated corporate deposits & loans
International settlement transaction vol. reached US$1.7 trillion, topped the global banking sector
BOC Aviation reinforced its leading position in Asia
Personal Banking Business
Largest market share in personal foreign currency denominated deposits & loans
No.1 in FX card merchant acquiring business
Financial Markets Business
Leading position in foreign-currency WM business, FX sale & settlement, RMB bond repurchase, forward bond transaction and gold trading in domestic market
Increased market share in RMB deposit and loan business

805.75
25.91 10.06
30
58
2006 2007 2008
Value involved in the cases (RMB mn)Number of cases
3.17% 2.76%
4.24%
117.18%106.37%
91.34%
2006 2007 2008
Impaired loan ratio Coverage ratio
7
Risk Management in Financial CrisisManage investment securities portfolio
Reduced exposure in foreign currency investment
Effectively strengthened internal controlEffective risk management through timely adjustment of industry credit policies
Charge impairment provision on investment securities in a prudent manner
Total amount and currency structure of investment securities
62.6%56.5%
37.4%43.5%
2007 2008
RM
B b
illio
n
RMB FX
1,713 1,646
Impairment losses for investment securities
27.15
12.26
2007 2008
RM
B b
illio
n

Earthquake Relief Fulfilling Corporate Social Responsibilities
8
Resume operationResume operation in the shortest timeSichuan Branch is the only financial institution to receive the honor of “National Quake-relief Hero Group”.
DonationsDomestic and overseas institutions and employees made over RMB150 million donationsA “Green Channel for Global Donations” was opened in all domestic & overseas outlets
Support after-quake reconstructionSigned a RMB300 billion “Full Strategic Co-operation Agreement” with Sichuan Province Government
Extended credit to Dongfang Electric, Panzhihua Iron & Steel, Sichuan Highway, and Conch Cement to support after-quake reconstruction
Provided priority handling of personal loan application for quake-hit region local resident at prime rate. Extended RMB18 billion credit lines to over 20 real estate development companies and car agencies.
Effective earthquake relief

40 outlets in 7 Olympic hosting cities provided one-to-one services to Game Center, Olympic Village & International Broadcasting Center
Zero customer complaints, zero machinery defaults, zero network breakdown, zero negative news report, zero security defaults and zero errors
Fulfilled the ticket consignment plan & the issuance and sales of Olympic commemorative banknotes denominated in HK Dollar and MOP Dollar
Hot sales of Olympic franchised products and precious metal products
Successfully launched the Great Wall Payment Card and Great Wall Pre-paid card
80% of the Olympic Gold-Medallists became BOC Private Banking VIP customers
Enhanced Brand Value through Olympic Services
9
Provided full range of quality financial services, reflecting comprehensive competitiveness

Achievement in Infrastructure
10
3 Global Business Units
Corporate Banking
Personal Banking
Financial Markets
Corporate BankingFinancial Institutions
International SettlementDomestic Settlement
SME
Individual ServicesWealth Management
Private BankingBank Cards
Security InvestmentTrading
Agency BusinessCustodian Investment
Corporate Annuity
Integrating Business Structure
ImprovingRisk Management
Further enhanced global risk management system
Accelerated implementation of Basel II
Implementation of
IT Blueprint
Beijing and Shanghai Information Centers are ready for operationThe second stage of System Integration Test commenced and the first regression test completedSmooth progress in data clearance. Successful implementation of some key projects. Improved Online Banking System
Operation Service Unit
Transforming Retail Outlets
Transformed 6,761 outlets, 68% of the total domestic 9,980 outlets
Over 6,220 ATM terminals were put into service

Strategy In New Age
11
Delivering Growth & ExcellenceBecome a leading global bank
Stra
tegi
c G
oal
Stra
tegi
c Po
sitio
ning
Commercial Banking as core business
Develop diversified service capabilities
Focusing on domestic market with
multinational operation
Integrated development of domestic & overseas
operations

Commercial Banking as Core Business with Diversified Services
Investment Banking
Direct Investment
Insurance
Fund Management
Aircraft Leasing
CommercialBanking
12
Diversified servicing platform is an important component and competitiveness of Commercial Banking
Trade FinanceInternational
Settlement
Global CreditCash Management
Financial AdvisoryInsurance
Asset ManagementAgency Business
Legal ConsultationTax Consultation
Wealth ManagementOverseas Education
Financial Services

13
Integrated Development of Domestic and Overseas Businesses
Total assets by region Operating profit by regionDomestic assets CAGR = 14.9% Domestic operating profit CAGR= 37.3%
Expand service lines and provide integrated global financial services to customers
To become an international first-class bank supported by strong domestic business
Integratedcustomer service
Unified capital management
Vertical business management
Domestic assets
75.2%77.4%76.5%
24.8%22.6%
23.5%5,327.7
5,991.2
2006 2007 2008
RM
B bi
llion
Overseas assets
6,951.7
92.8%67.5%
62.9%
7.2%32.5%
37.1%
67.3
89.4
2006 2007 2008
RM
B bi
llion
Domestic operating profit Overseas operating profit
86.5

Expanding Business Base & Optimizing Business Structure
♦ Reduce low yield foreign currency assets, including investment securities
♦ Increase % of RMB assets
Customer Mix
♦ Increased % of key customers i.e. mid-to-high end corporate & personal customers. Expand high quality SME customers
Regional Structure
♦ 3 major economic regions, 10 key areas& 40 key cities as major markets. Actively adjust resources allocation &market focused in line with country policies, and increase its profit contribution
♦ Asia as the key overseas market
Assets & Liabilities
♦ Increase % of loans in key industries & mid-to-long term loans. Actively attract low cost demand deposit
♦ Maintain leading position in non-interest income ratio among peers
RMB & FX
♦ Expand deposit base. Attract low-cost funding
♦ Expand market share of RMB deposits & loans as major performance indicator
♦ Expand customer base that matches China’s industries adjusting directions & customers with the needs of overseas services
♦ Explore good quality large corporate customers
♦ Increase penetration rate in key regions & key industries
♦ Expand domestic network in key provinces♦ Enhance domestic & overseas electronic
service channels
Deposit & Loan
Customer Base
Institutional Network
♦ Expand overseas network through self-constructing, M&A etc.
♦ Fully utilize our international & diversified business advantages, provide quality services to high-end and “going-aboard”customers.
OverseasNetwork
14
Expanding Business Base Optimizing Business Structure
15
Agenda
1 Key performance highlights and strategy Mr. Li Lihui, President
2 2008 Annual Results and 2009 Outlook Mr. Zhu Min,Executive Vice President
Agenda Speaker
16
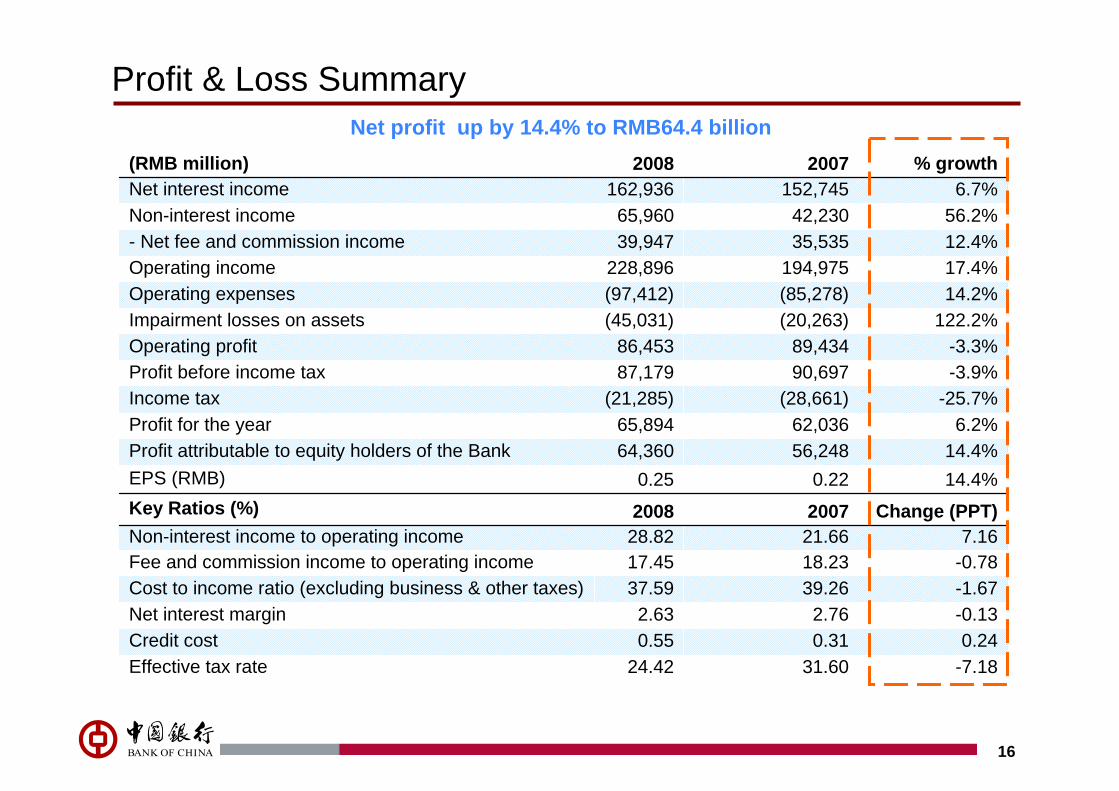
Profit & Loss SummaryNet profit up by 14.4% to RMB64.4 billion
-7.1831.6024.42Effective tax rate0.240.310.55Credit cost
-0.132.762.63Net interest margin-1.6739.2637.59Cost to income ratio (excluding business & other taxes)-0.78 18.2317.45 Fee and commission income to operating income7.1621.6628.82Non-interest income to operating income
Change (PPT)20072008Key Ratios (%)14.4%0.220.25EPS (RMB)14.4%56,24864,360Profit attributable to equity holders of the Bank6.2%62,03665,894Profit for the year
-25.7%(28,661)(21,285)Income tax-3.9%90,69787,179Profit before income tax-3.3%89,43486,453Operating profit
122.2%(20,263)(45,031)Impairment losses on assets14.2%(85,278)(97,412)Operating expenses17.4%194,975228,896Operating income12.4%35,53539,947- Net fee and commission income56.2%42,23065,960Non-interest income6.7%152,745162,936Net interest income
% growth20072008(RMB million)
17
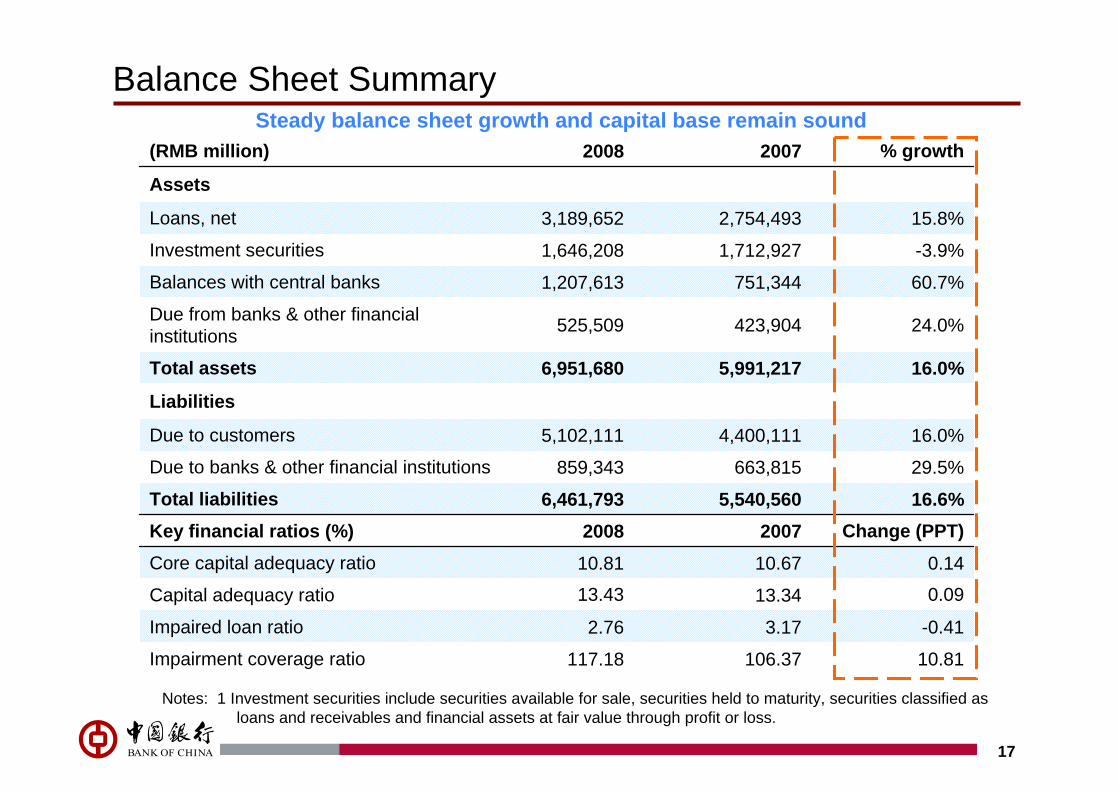
Balance Sheet SummarySteady balance sheet growth and capital base remain sound
Notes: 1 Investment securities include securities available for sale, securities held to maturity, securities classified as loans and receivables and financial assets at fair value through profit or loss.
10.81106.37117.18Impairment coverage ratio
-0.413.172.76Impaired loan ratio
0.0913.3413.43Capital adequacy ratio
0.1410.6710.81Core capital adequacy ratio
Change (PPT)20072008Key financial ratios (%)16.6%5,540,5606,461,793Total liabilities29.5%663,815859,343Due to banks & other financial institutions
16.0%4,400,1115,102,111Due to customers
Liabilities
16.0%5,991,2176,951,680Total assets
24.0%423,904525,509Due from banks & other financial institutions
60.7%751,3441,207,613Balances with central banks
-3.9%1,712,9271,646,208Investment securities
15.8%2,754,4933,189,652Loans, net
Assets
% growth20072008(RMB million)

18
Robust Growth in Domestic BusinessMajor domestic indicators Domestic loans
Domestic deposits
39.51%79,303110,638Profit before impairment losses
13.74 ppt107.21%120.95%Domestic non-performing loan coverage ratio
-0.63 ppt3.76%3.13%Domestic non-performing loan ratio
22.04%3,221,6603,931,645Domestic RMB deposits
19.59%1,955,6382,338,684Domestic RMB loans
69.63%35,83160,779Profit after tax
32.90%60,40880,281Operating profit
28.18%25,58232,791- Net fee & commission income
362.66%10,13946,909Non-interest income
6.80%130,533139,412Net interest income
Growth20072008(RMB million)
87.8%84.5%
84.9%
12.2%
15.5%
15.1%
2006 2007 2008
RM
B B
illio
n
RMB loans FX loans
2,315.7
2,662.8
1,988.3
Growth rate=16.46%Growth rate=14.99%
2006 2007 2008
RM
B b
illion
RMB deposits FX deposits
11.6%
88.4%91.3%
8.7%
3,269.8 3,529.0
92.4%
4,254.3
7.6%Growth rate = 7.93%
Growth rate =20.55%

19
Corporate Banking
Optimized domestic corporate client structure
Improved corporate loan industry structureCorporate deposit growth (Group)
Corporate loan growth (Group)Optimized customer & industry structure, promoted new SME model
778.2
410.8318.3 310.8
271.5
103.9 74.3 68.6 54.4 51.6 50.1
0.840.46
-0.58
0.16
-0.16-0.07
-0.79
1.64
0.17
-0.41
-1.26
Manufa
cturin
g
Commerc
e & se
rvice
s
Trans
porta
ton & Lo
gistic
s
Power,
Gas
& Wate
rRea
l Esta
te
Mining
Finan
cial S
ervice
sPub
lic U
tilities
Water, E
nviro
nmen
t etc
Constr
uctio
n
others
RM
B b
illio
n
2008 balance 2007 balance Change in proportion to total corporate loan
The balance of loans to corporate clients with BB above ratingaccounts for 91.37% of total loans, up by 3.74 ppts
2007 2008
1,357.4
1,625.7
RM
B b
illion
2006 2007 2008
RM
B B
illio
n
Domestic Overseas
1,528.8
Growth rate =22.30%Growth rate =15.64%
84.0%
16.0%
1,869.7 14.4%
85.6%
84.5%
15.5%%
2,162.1
2006 2007 2008
RM
B B
illio
n
Domestic RMB Loan Domestic FX Loan Overseas FX Loan
1,849.32,118Growth rate =14.53%
Growth rate =17.69%
64.7%
17.0%
18.3%19.4%
67.6%
13.0%
67.3%
16.3%
16.4%
2,492.7

20
2006 2007 2008
RM
B B
illio
n
Time Demand
2,416.52,355.7
Growth rate = -2.52%Growth rate =15.61%
36.46%
65.6%
34.4%33.1%
66.9%68.1%
31.9%
2,723.5
50 Fortune Mgmt Centers
525 Wealth Mgmt Centers
Personal Banking
Retail Deposit (Group)
Enhanced 3-tier wealth management service framework, expanded customer base
Retail loans (Group)
12 Private Banks
Issued 127.57 million debit cards in domestic marketIssued 15.79 million credit cards in domestic market, of which 9.72 million non quasi-credit cardsLaunched a series of commercial cardsLaunched co-branded cards, such as Nanhang Mingzhu BOC Credit cards & BOC Gotone Credit card2006 2007 2008
RM
B B
illio
n
Mortgage Others
582.7
Growth rate = 25.71%
Growth rate =9.67%
78.9%
21.1%
732.621.0%
79.0%
78.4%
21.6%
803.4
21
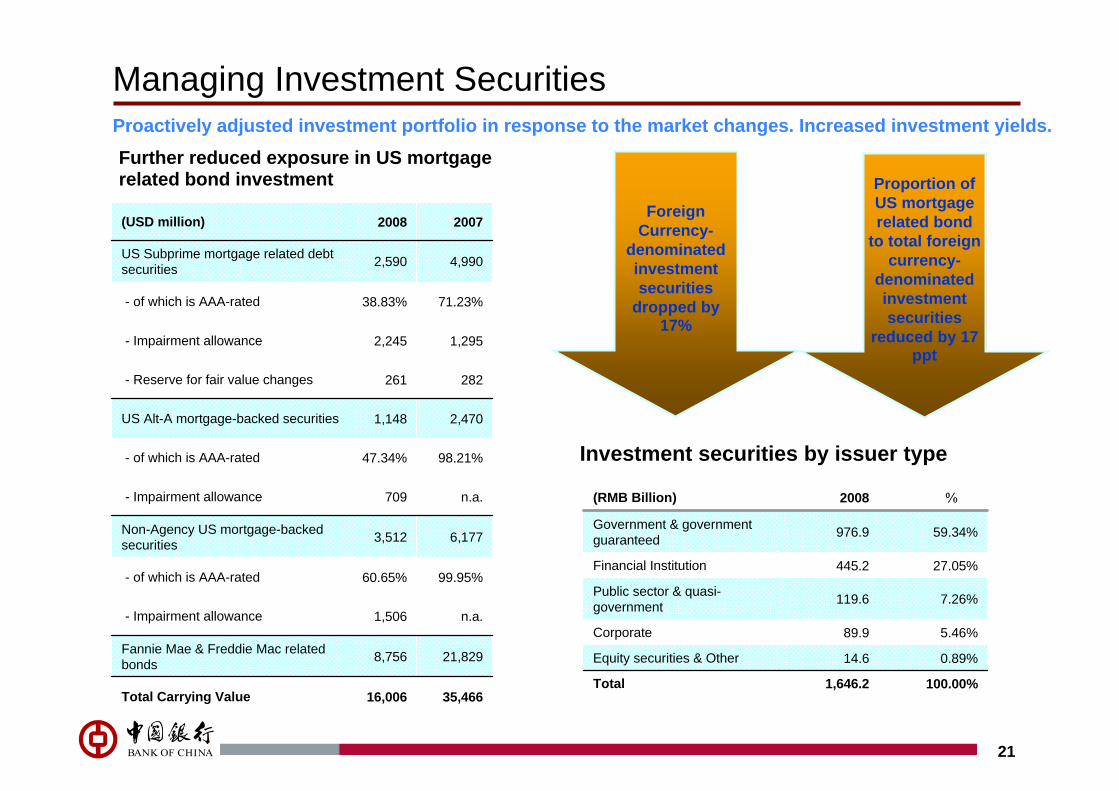
Managing Investment Securities Proactively adjusted investment portfolio in response to the market changes. Increased investment yields.Further reduced exposure in US mortgage related bond investment
Investment securities by issuer type
35,466 16,006 Total Carrying Value
21,829 8,756 Fannie Mae & Freddie Mac related bonds
n.a.1,506 - Impairment allowance
99.95%60.65%- of which is AAA-rated
6,177 3,512 Non-Agency US mortgage-backed securities
n.a.709 - Impairment allowance
98.21%47.34%- of which is AAA-rated
2,470 1,148 US Alt-A mortgage-backed securities
282 261 - Reserve for fair value changes
1,295 2,245 - Impairment allowance
71.23%38.83%- of which is AAA-rated
4,990 2,590 US Subprime mortgage related debt securities
20072008(USD million)
100.00%1,646.2Total
0.89%14.6 Equity securities & Other
5.46%89.9 Corporate
7.26%119.6Public sector & quasi-government
27.05%445.2Financial Institution
59.34%976.9Government & government guaranteed
%2008(RMB Billion)
Foreign Currency-
denominated investment securities
dropped by 17%
Proportion of US mortgage related bond
to total foreign currency-
denominated investment securities
reduced by 17 ppt

3.17% 2.76%
4.24%
117.18%106.37%
91.34%
2006 2007 2008
Impaired loan ratio Coverage ratio
22
NPL and special-mention loan ratio
Impaired loan ratio of manufacturing, real-estates & construction industries
Impaired loan balance and credit cost
Impaired loan and coverage ratio
Further Improvement in Asset Quality
103.2
90.990.3
0.53% 0.55%
0.31%
2006 2007 2008
RM
B b
illio
n
Impaired loan balance Credit Cost
32.9
8.6
33.6
6.9
34.1
13.0
Impaired loan balance ofManufacture
Impaired loan balance of Propertyand Construction
RM
B bi
llion
2006 2007 2008
5.22%6.14%
4.76%
Impaired loan ratio ofManufacture
4.74%
8.79%
3.51%
Impaired loan ratio of Property andConstruction
4.85%
8.15%
5.08%4.04%3.12%
2.65%
2006 2007 2008Special-mention Loan ratio NPL ratio
23
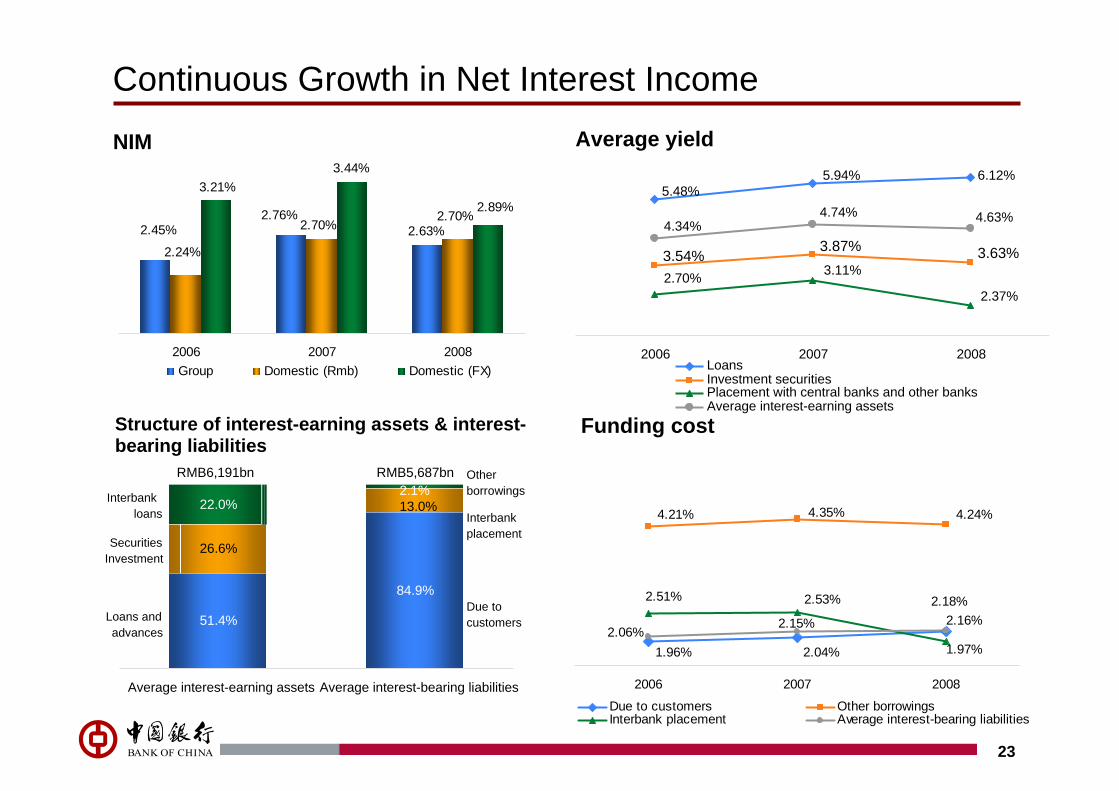
Continuous Growth in Net Interest Income
NIM Average yield
Funding costStructure of interest-earning assets & interest-bearing liabilities
2.63%2.76%
2.45% 2.70%
2.24%
2.70%
3.21%3.44%
2.89%
2006 2007 2008Group Domestic (Rmb) Domestic (FX)
1.96% 2.04%
2.16%
4.24%4.35%4.21%
1.97%
2.51% 2.53%
2.06%2.15%
2.18%
2006 2007 2008
Due to customers Other borrowingsInterbank placement Average interest-bearing liabilities
51.4%
84.9%
26.6%
22.0% 13.0%2.1%
Average interest-earning assets Average interest-bearing liabilities
RMB6,191bn RMB5,687bn
SecuritiesInvestment
Loans andadvances
Otherborrowings
Interbankplacement
Due tocustomers
Interbankloans
5.48%5.94% 6.12%
3.63%3.54%3.87%
2.37%
3.11%2.70%
4.34%4.74% 4.63%
2006 2007 2008LoansInvestment securities Placement with central banks and other banksAverage interest-earning assets

24
Further Growth in Non-Interest Income
Non-interest income Net fee and commission income breakdown
Note: 1 Others include net gains or losses on investment securities and other non-interest income.
2007 2008
RM
B m
illio
nOther feesBank card feesCredit commitment feesSettlement and clearing feesSpread income from foreign exchange businessAgency commissions
9.1%
20.3%
12.2%
9.4%
36.3%
11.0%
21.4%
18.1%
14.7%
19.3%
39,601
43,712 Growth rate = 10.38%
12.7%15.5%
Fee and commission expense
3,7654,066
2007 2008
RM
B m
illio
n
Net fee and commission incomeNet trading income and others1
84.1%
15.9%
60.6%
39.4%
42,230
65,960
Growth rate = 56.19%
28.8%
21.7%
% of operating income
25
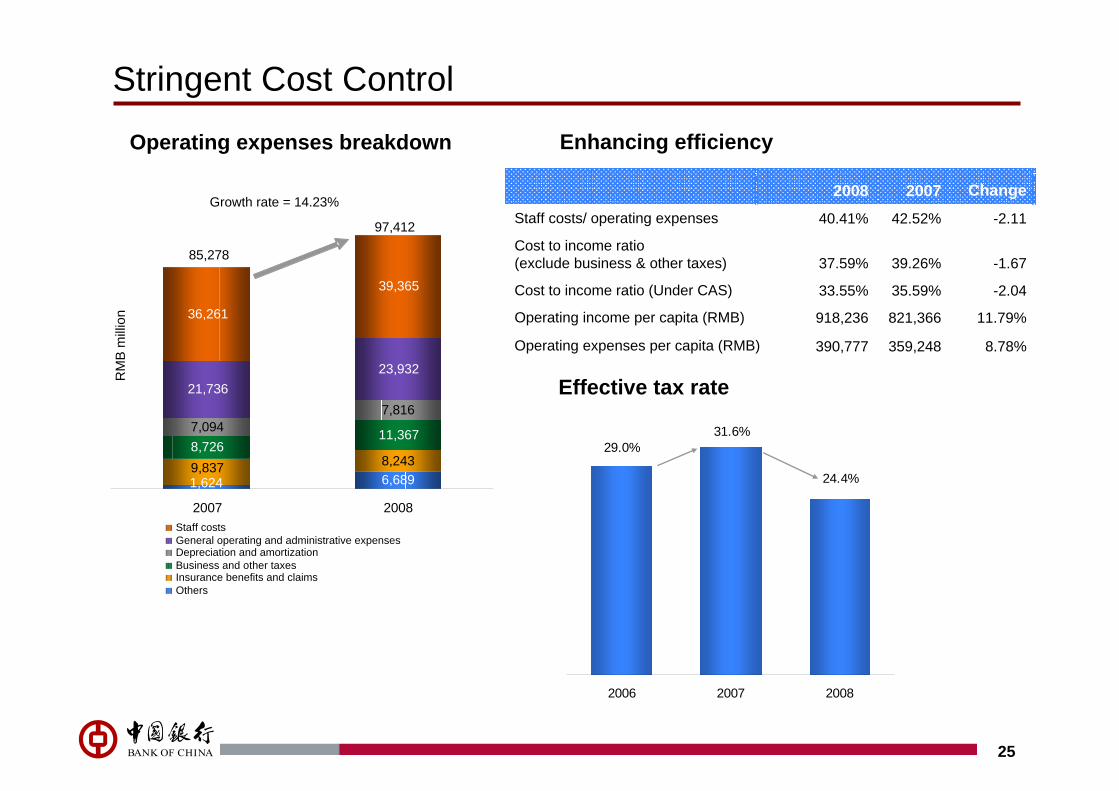
Stringent Cost Control
Operating expenses breakdown Enhancing efficiency
Effective tax rate
37.59%
8.78%359,248 390,777 Operating expenses per capita (RMB)
11.79%821,366 918,236 Operating income per capita (RMB)
-2.0435.59%33.55%Cost to income ratio (Under CAS)
-1.6739.26%Cost to income ratio (exclude business & other taxes)
-2.1142.52%40.41%Staff costs/ operating expenses
Change20072008
29.0%
24.4%
2006 2007 2008
31.6%
6,6898,243
8,72611,3677,0947,816
21,73623,932
36,261
39,365
1,6249,837
2007 2008
RM
B m
illio
n
Staff costs General operating and administrative expensesDepreciation and amortizationBusiness and other taxesInsurance benefits and claimsOthers
85,278
97,412
Growth rate = 14.23%
26
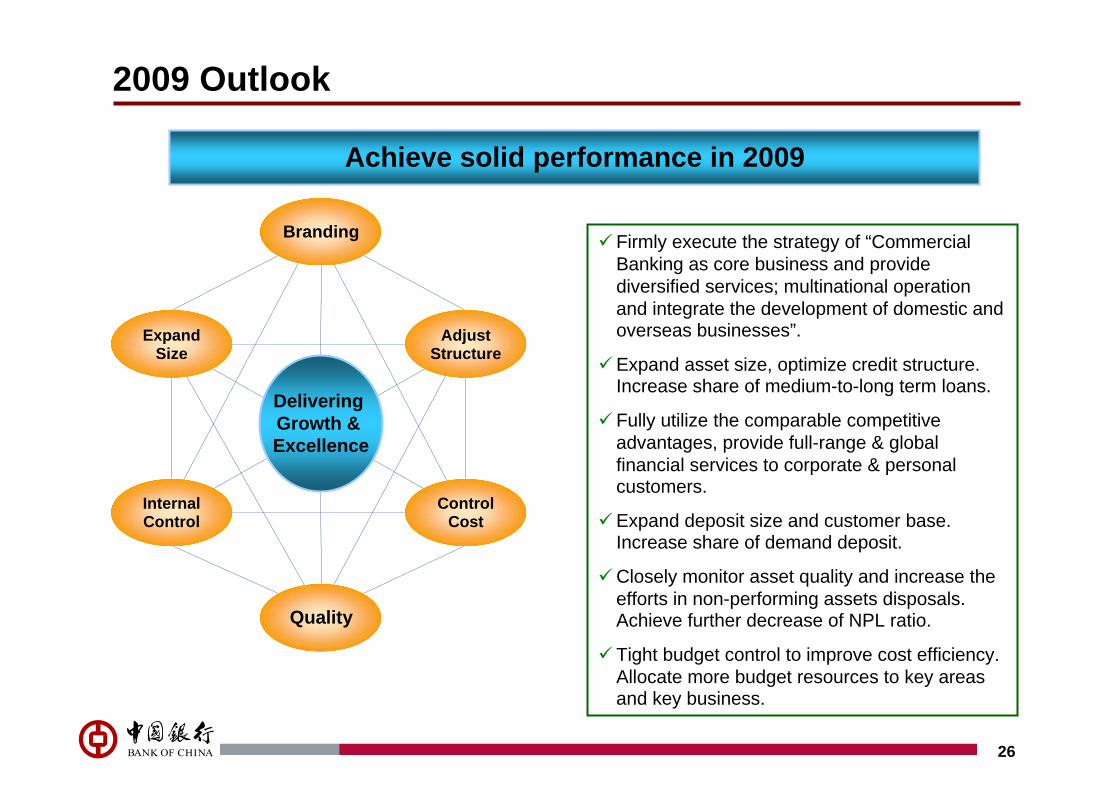
2009 Outlook
Branding
Delivering Growth & Excellence
Quality
Internal Control
Expand Size
ControlCost
Adjust Structure
Firmly execute the strategy of “CommercialBanking as core business and provide diversified services; multinational operation and integrate the development of domestic and overseas businesses”.
Expand asset size, optimize credit structure. Increase share of medium-to-long term loans.
Fully utilize the comparable competitive advantages, provide full-range & global financial services to corporate & personal customers.
Expand deposit size and customer base. Increase share of demand deposit.
Closely monitor asset quality and increase the efforts in non-performing assets disposals. Achieve further decrease of NPL ratio.
Tight budget control to improve cost efficiency. Allocate more budget resources to key areas and key business.
Achieve solid performance in 2009

27
Q&A