deliverable d2.1: design of the greendc dss greendc
TRANSCRIPT

Deliverable D2.1:
Design of the GREENDC DSS
GREENDC
Brunel University London
TURKSAT
LK Knowledge Engineering
Gebze Technical University
David Holding
Project reference: 734273
GREENDC D21 – GREENDC DSS Design Document
Project no: 734273 2 31/10/2017
Project Number 734273 Acronym GREENDC
Full Title GEENDC
Project URL http://www.greendc.eu/
Project Officer Irina-Elena Tiron
Deliverable Nº D2.1 Title Design of the GREENDC DSS
Work Package Nº WP2 Title GREENDC DSS
Date of delivery Contractual 31 Oct 2017 Actual 31 Oct 2017
Version Submission
Nature* R
Access level** P
Status level***
Responsible Author Name Youngseok
Choi
Institute LKKE
Internal Reviewer 1 Name Habin Lee Institute Brunel University
London
Internal Reviewer 2 Name Stanimir
Yovchev
Institute DAVID
Email [email protected]
o.uk
Phone +44-7432-882521
Abstract (for
dissemination)
This deliverable aims to define the architecture of GREENDC DSS for
the implementation. Based on the result of focused group interviews in
D1.1, user requirements have been defined through this deliverable. To
realise the requirements, four interactional layers have been designed;
data layer, math model layer, business logic layer, and user interface.
This deliverable is describing not only the detail design of each layer,
but also the efficient way of interaction among the layers. The proposed
architecture in this deliverable will be a concrete skeleton that enable
this project to anchor the right direction for defined project objectives.
Keywords DSS architecture, GREENDC DSS, DSS Implementation

GREENDC D21 – GREENDC DSS Design Document
Project no: 734273 3 31/10/2017
Document Contributor
Table 1 Document contributor
Name Company e-Mail
Youngseok Choi LKKE [email protected]
Habin Lee UBRUN [email protected]
Marios Pournaris UBRUN [email protected]
Stanimir Yovchev DAVID [email protected]
Tuba Gozel GTU [email protected]
M. Hakan Hocaoglu GTU [email protected]
Onur Ozturk GTU [email protected]
M. Turker Takci GTU [email protected]
Ahmet Koksoy GTU [email protected]
Fatih Karatana TURKSAT [email protected]
Kaan Uzuner TURKSAT [email protected]
Document historic
Table 2 Document history
Version
NO Date Authors Description
v0.1 07/04/2017 Youngseok Choi The structure of the deliverable defined
v0.2 08/05/2017 Youngseok Choi Integrated initial draft for user stories
v0.3 02/06/2017 Tuba GÖZEL Integrated GTU input regarding math model
layer
v0.4 07/07/2017 Youngseok Choi Integrated LKKE/GTU input regarding user
requirements
v0.5 11/08/2017 M. Hakan Hocaoglu Integrated DAVID/TRUKSAT input regarding
architecture
v0.6 23/09/2017 Habin Lee Integrated technical details of each layers
v0.7 02/10/2017 M. Hakan Hocaoglu Minor editing for correcting typos
v0.8 25/10/2017 Fatih Karatana Revision based on review comments
v1.0 30/10/2017 Youngseok Choi Final version

GREENDC D21 – GREENDC DSS Design Document
Project no: 734273 4 31/10/2017
Glossary
Acronym Meaning
AF Application Functions
API Application Programming Interface
CPU Central Processing Unit
DC Data Centre
DCIM Data Centre Infrastructure Management
DRC Disaster Recovery Center
DSS Decision Support Systems
DVFS Dynamic Voltage Frequency Scaling
ELM Elaboration Likelihood Model
ERD Entity Relationship Diagram
IT Information Technology
JSON JavaScript Object Notation
LB Load Balancing
NIST The National Institute of Standards and Technologies
ORM Object Relational Mapping
PUE Power Usage Effectiveness
RAM Random Access Memory
REST Representational State Transfer
RFC Request for Comments
RP Relying party
GREENDC D21 – GREENDC DSS Design Document
Project no: 734273 5 31/10/2017
RPC Remote Procedure Call
RST Request Security Token
RSTR Request Security Token Response
SAML Security Assertion Markup Language
SOA Service-oriented Architecture
SOAP Simple Object Access Protocol
STS Security Token Service
UA User Authentication
UPS Uninterrupted Power System
VM Virtual Machine
WS Web Socket
WSDL Web Service Definition Language

GREENDC D21 – GREENDC DSS Design Document
Project no: 734273 6 31/10/2017
1. Contents
1. INTRODUCTION 11
1.1 Purpose and Scope 11
1.2 Relation to Work Packages and Deliverables 11
1.3 Document Structure 11
2. User Requirements Definition 13
2.1 GREENDC DSS Roles 13
2.2 GREENDC DSS Personas and Scenario 14
2.2.1. The Monitoring and Reporting of Energy Consumption 15
2.2.2 Energy Consumption Forecasting 15
2.2.3. Simulation and Real-time Intervention for Energy Saving (Simulation Dashboard)
16
2.3 GREENDC User Stories 18
2.3.1. Monitoring of Energy Consumption User Stories 18
2.3.2. Energy Consumption Forecasting User Stories 18
2.3.3. Simulation and Real-time Intervention User Stories 19
3. GREENDC Architecture 20
3.1 Overall architecture 20
3.2 Interfaces 22
3.2.1 Business logic layer 23
3.2.2 Math model layer 24
3.2.3 Data layer 26
3.3 Sequence Diagrams for User Stories 28
3.3.1 Monitoring energy consumption user stories 29
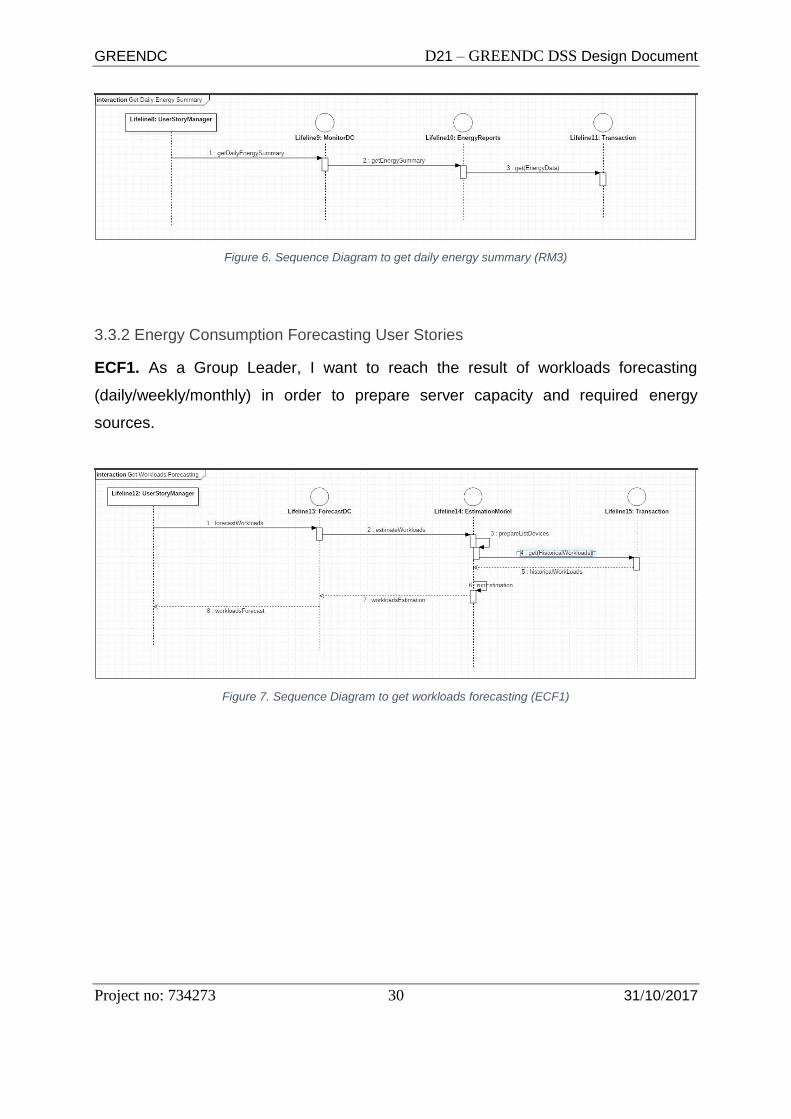
3.3.2 Energy Consumption Forecasting User Stories 30
3.3.3 DC Simulation User Stories 31
4. Data Layer 35
4.1 Components Architecture 35
4.1.1 Components Description of Data Layer 35
Components & Class/Interface Relations(bottom to top): 36
4.2 Data collection layer 37
4.2.1 Workloads Allocation 38
4.2.2 Data Entities and Models 42
4.2.3 Energy and workloads data 45
GREENDC D21 – GREENDC DSS Design Document
Project no: 734273 7 31/10/2017
4.2 Data normalization layer 53
5. Math Model Layer 56
5.1. Forecasting Method: 56
5.2. Optimization Method: 61
5.3. Class Structure of Math Model Layer 64
5.4. Sequence Diagram of Math Model Layer 71
5.4.1 Data Preparation for Math Layer 71
5.4.2. Forecasting 71
5.4.3. Optimization 73
6. Business Logic Layer 74
6.1 UserManager 74
6.2 DCMonitor & DCForecaster 80
6.2.1 Consumption Monitoring, Analysis and Control 80
6.2.2 Energy optimiser and smart grid integrator 92
6.3 DCSimulator 95
6.4 CloudSim 96
6.4.1 Architecture 97
6.4.2 Class Diagram 98
6.4.3 User Interaction with CloudSim 104
6.4.4 Power Consumption Models 105
6.4.5 Workload Distribution 106
6.4.6 User Activity Diagrams for Simulation and Real-time Intervention User Stories 107
7. User Interface - UI 112
7.1 Basic Interface Principles 112
7.2 User Interface Structure 112
7.3. Serving User Stories and Scenarios 119
7.4. General DASHBOARDS for user scenarios 123
8. Conclusion with Implementation Plan 127
8.1. Data Layer 127
8.2. Math Model Layer 127
8.3. Business Logic Layer 128
8.4. User Interface 129
8.5. Conclusion 130
APPENDIX A : REGISTRATION MAPS(DCIM) 131

GREENDC D21 – GREENDC DSS Design Document
Project no: 734273 8 31/10/2017
Table of Figure
Figure 1. GREENDC DSS Architecture ................................................................................20
Figure 2. Interface and three layers ......................................................................................22
Figure 3. Flow chart – Data Transmit between Layers ..........................................................28
Figure 4. Sequence Diagram to detect abnormal energy consumption (RM1) ......................29
Figure 5. Sequence Diagram to get event logs (RM2) ..........................................................29
Figure 6. Sequence Diagram to get daily energy summary (RM3) ........................................30
Figure 7. Sequence Diagram to get workloads forecasting (ECF1).......................................30
Figure 8. Sequence Diagram to forecast energy consumption (ECF2) .................................31
Figure 9. Sequence Diagram to set simulator parameters (SRI1) .........................................31
Figure 10. Sequence Diagram to analyse VMs Configuration (SRI2) ....................................32
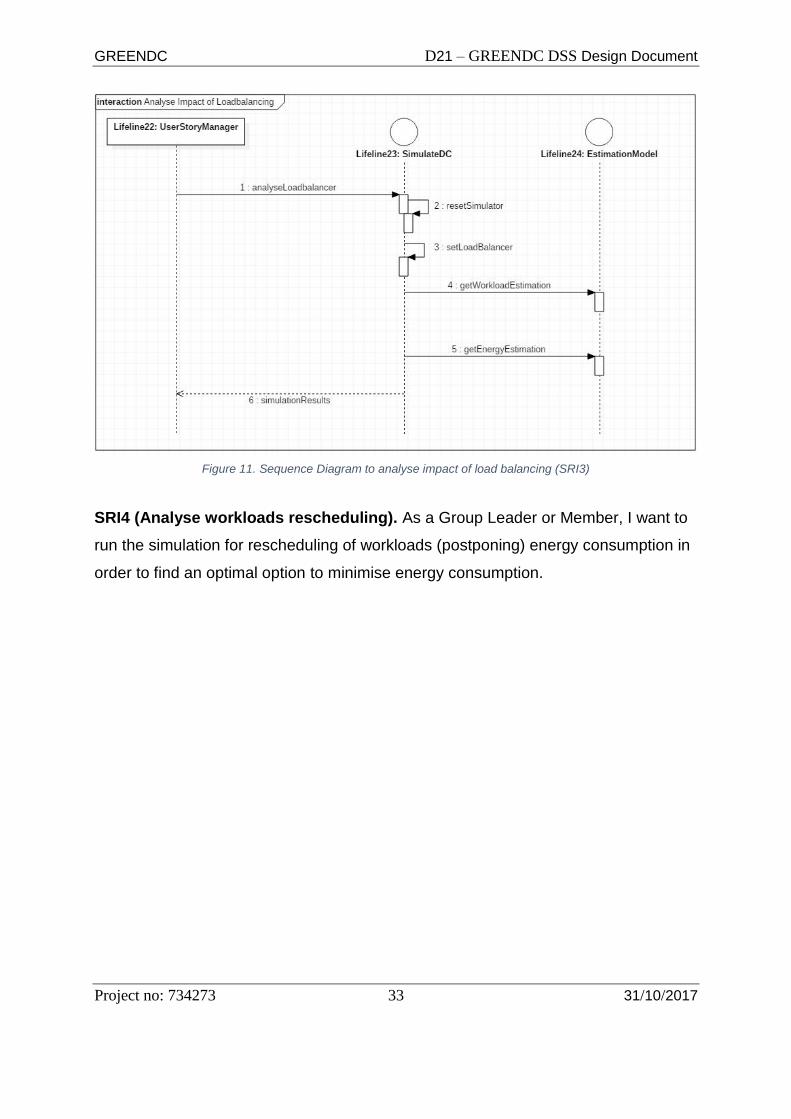
Figure 11. Sequence Diagram to analyse impact of load balancing (SRI3)...........................33
Figure 12. Sequence Diagram to analyse impact of work migration (SRI4) ..........................34
Figure 13. Sequence Diagram to analyse network configuration operation (SRI5) ...............34
Figure 14. Component Architectures for Data Layer .............................................................35
Figure 15. Collect Component ..............................................................................................36
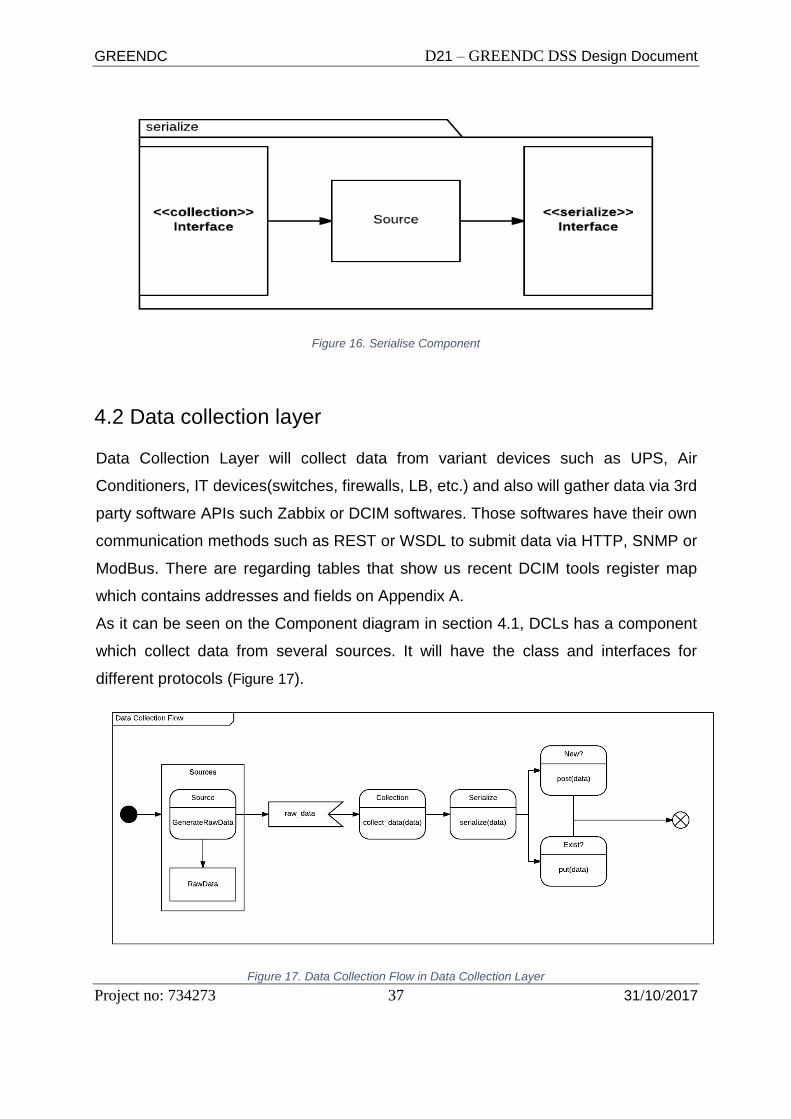
Figure 16. Serialise Component ...........................................................................................37
Figure 17. Data Collection Flow in Data Collection Layer .....................................................37
Figure 18. Sample Graph to examine connection requests to served URLs .........................39
Figure 19. Sample Reports for load per virtual machine .......................................................40
Figure 20. Load Balancing Example .....................................................................................41
Figure 21. Data Entity Diagram ............................................................................................42
Figure 22. Data Sources and Data Collector ........................................................................45
Figure 23. Data Source - UPS ..............................................................................................46
Figure 24. Smart PDUs Interface ..........................................................................................47
Figure 25. Energy Meter .......................................................................................................47
Figure 26. Power Monitoring through the Energy Meter........................................................48
Figure 27. Chiller and Its Interface ........................................................................................49
Figure 28. Air Conditioner Interface ......................................................................................50
Figure 29. Energy Consumption from Servers – Example from Zabbix .................................50
Figure 30. Energy Consumption of Server – CPU level ........................................................51
Figure 31. Memory Usage and Energy Consumption ...........................................................52
Figure 32. File I/O and Server Energy Consumption ............................................................52
Figure 33. Network Traffic and Energy Consumption ...........................................................52
Figure 34. ERD – Consumption and Its Types ......................................................................54
Figure 35. ORM Transaction and RPC Interface ..................................................................54
Figure 36. Flowchart for Forecasting Process ......................................................................57
Figure 37. Flowcharts of Forecasting Models .......................................................................59
Figure 38. Class Structure of Math Model Layer ...................................................................65
Figure 39. Sequence Diagram of Math Model Layer for forecasting .....................................72
Figure 40. Sequence Diagram of Math Model Layer for Optimization ...................................73
Figure 41. Logical entities for the authentication domain ......................................................75
Figure 42. Authentication Classes ........................................................................................79

GREENDC D21 – GREENDC DSS Design Document
Project no: 734273 9 31/10/2017
Figure 43. Authentication sequence diagram ........................................................................79
Figure 44. CloudSim Architecture .........................................................................................97
Figure 45. An overall class Diagram of CloudSim .................................................................98
Figure 46. User Interaction with CouldSim .......................................................................... 105
Figure 47. User Activity Diagram – Analyse Parameter Change using CloudSim ............... 107
Figure 48. User Activity Diagram – Analyse VMs Configuration using CloudSim ................ 108
Figure 49. User Activity Diagram – Analyse Load Balancing Tools Change using CloudSim
........................................................................................................................................... 109
Figure 50. User Activity Diagram – Analyse Workloads Rescheduling using CloudSim ...... 110
Figure 51. User Activity Diagram – Analyse Network Configuration Change using CloudSim
........................................................................................................................................... 111
Figure 52. User Interface - Log-in Form .............................................................................. 113
Figure 53. User Interface – Initial Dashboard ..................................................................... 114
Figure 54. User Interface – Top Navbar ............................................................................. 114
Figure 55. User Interface - Dynamic left navigation panel ................................................... 115
Figure 56. User Interface – Page Title and Quick DC Swicher ............................................ 116
Figure 57. User Interface – DC Data Loader Navbar .......................................................... 116
Figure 58. User Interface – DSS Simulation Monitor Panel ................................................ 117
Figure 59. User Interface – DC Nodes Panel ...................................................................... 118
Figure 60. User Interface – My Simulation Page................................................................. 118
Figure 61. User Interaction – Getting Useful Results in 3 Easy Steps ................................. 119
Figure 62. User Interface – Scenario Chooser .................................................................... 120
Figure 63. User Interface – Scenario Dashboard ................................................................ 121
Figure 64. DC Measured Nodes Panel ............................................................................... 122
Figure 65. User Interface – Actions .................................................................................... 122
Figure 66. 1. Energy Consumption Forecasting DASHBOARD ...................................... 123
Figure 67. 2. Simulation for Energy Saving DASHBOARD ............................................. 125
Figure 68. User Interface – UX configuration ...................................................................... 126

GREENDC D21 – GREENDC DSS Design Document
Project no: 734273 10 31/10/2017
Tables
Table 1. Sample Data Set For Neural Network 60
Table 2. Expected Services from Energy consumption monitoring .......................................80
Table 3. Expected Services from Energy consumption automatic data Analyser ..................88
Table 4. Expected Services from Control centre for consumption and distributed generation
.............................................................................................................................................89
Table 5. Expected Services from energy optimizer and smart grid integrator .......................93
GREENDC D21 – GREENDC DSS Design Document
Project no: 734273 11 31/10/2017
1. INTRODUCTION
1.1 Purpose and Scope
The objective of work package two “GREENDC DSS” is to provide a detailed specification for
the GREENDC DSS and present the implementation details of DSS accordingly. This
deliverable, “D2.1. GREENDC Architecture” is the blueprint for actual development of
GREENDC DSS. It has been prepared as part of the project’s agile management process
and is dedicated to design the GREENDC DSS in all its aspects to fulfil the minimum
functional and technical requirements for the implementation based on user scenarios that
have been selected and sorted out through the requirement specification process. The
requirement specification will derive not only the detail user scenario, but also the component
structure of GREENDC DSS.
1.2 Relation to Work Packages and Deliverables
The work presented here is based on the results of work package one “Requirements
for Energy Efficient Data Centre” that can be viewed in “D1.1 Data Centre Energy
Management Practices.” There, a concrete definition of the GREENDC DSS
methodology as well as an elicitation of agile requirements by means of roles,
scenarios and user stories has been conducted. This placed the first corner stone for
the design, architecture and definition of the functional requirements.
The outcomes of this deliverable will be the basis of the following deliverable D2.2
GREENDC DSS, which will show the detail implementation results.
1.3 Document Structure
In this deliverable, Section 2 “User Requirement Definition” presents the user scenarios
specified based on the results from focused group interview in D1.1 and how the specified
requirements will be realised in terms of module. This section will provide the overview of
main function of DSS – Setting Parameter, Real-time Monitoring of Energy Consumption,
Energy Consumption Forecasting, Simulation and Real-time Intervention, and Periodic
Reporting.

GREENDC D21 – GREENDC DSS Design Document
Project no: 734273 12 31/10/2017
Section 3 “GREENDC Architecture” presents the detail architecture of GREENDC DSS with
layer and component structures.
Section 4 “Data Layer” provides the details about data collection and normalization for
GREENDC DSS implementation.
Section 5 “Math Model Layer” show the mathematical formulation of forecasting and
optimisation model that will used for data centre decision making with their class structure.
Section 6 “Business Logic Layer” conveys the detail information regarding energy
consumption monitoring and forecasting. The simulator for data centre is also introduced.
Section 7 “User Interface” shows the progress on the interface implementation that will
interacted with the user. Some of tentative interface designs are presented.
Section 8 “Implementation of GREENDC DSS” outlines the implementation strategies for
each layer including development environment and important library for DSS implementation.
Last Section concludes with the future plan of GREENDC DSS implementation.

GREENDC D21 – GREENDC DSS Design Document
Project no: 734273 13 31/10/2017
2. User Requirements Definition
This section presents system scenarios and user stories by considering the user
requirements of GREENDC DSS. To construct system scenarios, GREENDC DSS
roles and the personas in these roles are also defined. User requirements, on the
other hand, are determined by using the deliverable D1.1. The generated user stories
at the end of this section are then used to construct the first prototype of GREENDC
DSS.
2.1 GREENDC DSS Roles
Roles combine a set of typical actions that will fulfil tasks in scenarios. Thus, roles are not
technical descriptions but mirror responsibilities in the workflows of processes. The scenarios
(see below) will illustrate these processes. The role concept typecasts users in different
categories. However, for a better usability of the GREENDC DSS, the implementation should
facilitate the use of all tools by group leader and member of Data Centre.
- Group Leader: As described in the personas in next section, a group leader
should make sure that every group member does his/her own duties right on
time and complete as defined by regulations. The very first responsibility for
this role starts from the energy consumption forecast and he needs to assign
proper actions and tasks to group members based on the forecasting result.
GREENDC DSS provide the long-term and short-term perspectives on the
energy consumption to the group leader so that he can cope with any
circumstances. Also, GREENDC DSS support the simulation for energy
consumption of data centre so that a leader can choose appropriate
intervention option with the support of group members.
- Group Member: Group members usually conduct overall management action
regarding the control of energy consumption level based on the supervision of
a leader. The fundamental role of members is to monitor the level of energy
consumption and GREEDNC DSS can provide whole functionality for
monitoring. GREENDC also support convenient simulation interface to adjust
the possible option for controlling energy consumption level. To cope with the
variability of knowledge and experience level of members, some simulation

GREENDC D21 – GREENDC DSS Design Document
Project no: 734273 14 31/10/2017
function can support automatic function to tune the variables based on the
computation using historical data.
2.2 GREENDC DSS Personas and Scenario
Using scenarios integrates the personas and gives them defined roles for a current situation.
By doing this, it shows the possible use of the tools provided by GREENDC DSS to
exemplify their interplay and usefulness for energy efficiency management in the data centre.
Scenario will be developed based on the result of focus group interview and we scoped down
the main functionality into five; setting of parameters, real-time monitoring of energy
consumption, energy consumption forecasting, real-time intervention for energy saving, and
periodic reporting. In particular, we will define several sub-scenarios for real-time intervention
function as this function can give enough functionality to the data centre manager to tune the
energy consumption options.
To describe the detail of GREENDC Scenario, we define the personas below. A persona
illustrates the reality of life with a multi-dimensional view on the possible men and women
behind a role in GREENDC DSS. The persona concept facilitates system architects to meet
the requirements of this analysis to put oneself in the position of possible system users with
their diverse social backgrounds. The personas described below can be imagined as taking
several roles for which reason there is less personas than roles
Johan Green (Group Leader)
- He has to make sure that every group member does his/her own duties right
on time and complete as defined by regulations.
- He makes assignment and coordinates the group member duties.
Melina Silverwood (Group Member)
- Manage and distribute all IP addresses which belong to XX Data centre.
- Manage and control all internal IP blocks which are used in Data Centre LAN
and E-government network
- Manage and control all active network devices and infrastructure of Data
Centre and E-government network
- Take and manage backups of all active network devices and infrastructure of
Data Centre and E-government network

GREENDC D21 – GREENDC DSS Design Document
Project no: 734273 15 31/10/2017
- Manage and configure VPN and other network configurations between/inside
E-government services, Data Centre regional branches and headend, call
centres, DRC(Disaster Recovery Centre), TV and Satellite broadcast units.
- Design system (network and infrastructure) architecture for required
governmental agencies and manage configured system(s).
- Prepare technical RFC.
2.2.1. The Monitoring and Reporting of Energy Consumption
Melina Silverwood is a Group Member of XX Data Centre. Her main role is to ensure the
data centre operations in an efficient and timely manner by monitoring the real-time energy
consumption. Melina’s daily task is always starting from investigation of real-time monitoring
dashboard in GREEN DC DSS, which shows the unified interface with DCIM tool.
Melina check the real-time line chart presenting energy consumption of every minutes.
Meanwhile, she needs to check the event logs in the dashboard that shows the event stamps
that may cause unusual energy consumption patterns. Also, she can check daily
consumption summary if today’s consumption is consistent with previous few days.
XX data centre management team has regular meeting in every weeks and weekly energy
consumption report is the most important material for in-depth analysis for data centre
maintenance. To get the periodic report, Melina or John open the Periodic Reporting
dashboard in the GREENDC DSS. It offers daily, weekly, monthly, and quarterly reporting
including energy consumption stats, major events/intervention, and future consumption trend
report. The reporting results also can be exported into doc or pdf file format.
2.2.2 Energy Consumption Forecasting
John Green, Group Leader, has a lot of concerns as the energy consumption of data centre
has been stiffly increased since last few years. Furthermore, in terms of long-term trend, the
increasing digitisation in all areas of the economy and society is resulting in an increasing
need for processing power. Based on his experience, he is also recognising seasonal trend
(short-term) of energy consumption. To build-up the plan to cope with this micro and macro
change of energy consumption, John Green wants to estimate the future energy
consumption for long-term and short-term perspective.

GREENDC D21 – GREENDC DSS Design Document
Project no: 734273 16 31/10/2017
John Green choose the “Energy Consumption Forecasting” menu from GREEN DC DSS and
the dashboard for consumption forecasting is shown to him. The dashboard shows the
daily/weekly/monthly-based energy consumption forecasting using the forecasting model that
has been fitted through the whole historical data of data centre. The forecasting result says
the consumption will increase so John tries to tune some variables in the forecasting model
through the simulation interface to see how these variables can affect to the future
consumption.
2.2.3. Simulation and Real-time Intervention for Energy Saving
(Simulation Dashboard)
Whilst Melina monitors the energy consumption in real-time, she realises that the current
consumption is higher than same time in previous few days. To sort out this situation, Melina
discusses with John Green, the centre manager, regarding intervention options. To choose
one of the options, they conduct the simulation of each possible intervention option. All these
actions can be done through the Simulation Dashboard that supports the energy
consumption simulation and real-time intervention interface.
- Simulation for Controlling the Variable in the Energy Consumption Model
GREENDC DSS embeds some energy consumption models and tunes their parameters
using historical data. One directive way to minimise the energy consumption is to adjust
some tuneable variables in the energy consumption model. Melina can choose one of
embedded energy consumption model to verify the main factor cause higher consumption.
Then she can check tune some variables that can be directly adjustable from DSS level.
Also, Melina can compare the performance of energy consumption model among embedded
ones as DSS shows the performance comparison tables among existing energy consumption
models. After this comparison, she can apply the variable into real-time service level.
Different parameters for the operation of data centres are used and the optimization of
settings is critical for the overall energy consumption and meeting service level agreement.
For example, temperature has bidirectional impacts between cooling system and servers.
Keeping a DC in the higher temperature will make the energy consumption by cooling
system less while the performance of servers worse therefore more energy consumption.
How much positive impacts for cooling system and negative impacts for servers are now
known and finding the optimal temperature for a given forecasted workloads.
GREENDC D21 – GREENDC DSS Design Document
Project no: 734273 17 31/10/2017
- Simulation for the impact of shutting down VMs
XX data centre management team know that how to effectively balance the power load in
data centres is an issue that every data centre manager is familiar with. When done
correctly, a properly balanced data centre helps to secure uptime and is often an important
avenue for the facility to utilize extra power capacity. When improperly balanced, available
power can become stranded, and the chance of damage to vital infrastructure increases.
Taking the time to optimize power distribution when installing or refitting a data centre is well
worth the effort and is another crucial step toward maximizing its performance.
To help avoid stranding power, Melina can conduct simulation for shutting down the idle VMs
to reach the optimal balanced status through the Load Balancing interface in Simulation
Dashboard. If the simulation result shows the expected level of consumption, then she can
push the “Apply to System” button with the setting used for simulation.
- Simulation for the impact of different load balancing tools
How to use servers and VMs within DC affects the overall energy consumption as
overloaded devices are expected to consume energy unnecessarily. Different load balancing
tools are used to have even usage of servers and VMs for high level of workloads. However,
the performance of load balancing tools is different for different tools therefore data centre
managers would like to know what are the net amount saved (or wasted) for using alternative
load balancing tools.
- Simulation for the impact of postponing workloads
Different workloads have different priorities depending on who the requests come from and
when they are created. Therefore, postponing workloads with low priority can prevent
overloads of servers and VMs and save energy consumption. Melina would be able to set the
rules for delaying certain workloads. This setting includes the level of priority, the duration of
postponing, in certain case designate such workloads to certain VMs or servers. Melina then
check how much energy was saved and the impact to overall service level agreement.
- Simulation for Setting the Network Configuration
The last option for Melina is to set the network configuration again. She can open the
network configuration menu on the Simulation Dashboard. The menu presents the graphic
user interface with network structure and enables her to configure the parameter of each
network node to minimise the energy consumption so that she can check the expected
energy consumption according to the network configuration setting. If the simulation result
shows the expected level of consumption, then she can push the “Apply to System” button
with the setting used for simulation.
GREENDC D21 – GREENDC DSS Design Document
Project no: 734273 18 31/10/2017
Worst network configuration causes the network devices consumes more resources to make
the topology works well. Suggest that, there may be lots of repeated or duplicated firewall
rules to filter the network content; it will take too long time to compile and apply any network
packages from L2 to L7 corresponding policies. Regarding content weight, network devices
will consume more resources to handle and filter the whole network traffic. However, the
optimum network setup will handle the traffic and filter the packages in a fast and efficient
way.
2.3 GREENDC User Stories
User stories are used in agile software development techniques. By switching the
perspective to individual (though typecasted) users they are used as the basis for defining
the functional requirements that a system must entail and lay the foundation for the system
design. The user stories will follow this general scheme to demonstrate the user requirement:
As a <role> I want to <action> in order to <value/benefit>.
The following user stories have all been directly or indirectly inferred from the above
presented scenarios.
2.3.1. Monitoring of Energy Consumption User Stories
RM1 (Detect abnormal energy consumption). As a Group Member, I want to monitor the
energy consumption in order to check if any abnormal consumption pattern happens from
time to time.
RM2 (Reach to the event log). As a Group Member, I want to reach the event log of data
centre in order to take action to the change of energy consumption more efficiently.
RM3 (Daily energy consumption summary). As a Group Member, I want to see the daily
energy consumption summary in order to check the trend of energy consumption.
RM4 (Periodic reports). As a Group Leader (member), I want to get the periodic report
regarding energy consumption in order to plan the energy consumption schedule and to
manage the overall energy consumption trend.
2.3.2. Energy Consumption Forecasting User Stories
ECF1 (Forecast workloads). As a Group Leader, I want to reach the result of workloads
forecasting (daily/weekly/monthly) in order to prepare server capacity and required energy
sources.

GREENDC D21 – GREENDC DSS Design Document
Project no: 734273 19 31/10/2017
ECF2 (Forecast energy consumption). As a Group Leader, I want to reach the result of
energy consumption forecasting (daily/weekly/monthly) in order to cope with the change of
the energy consumption.
2.3.3. Simulation and Real-time Intervention User Stories
SR1 (Analyse parameter changes). As a Group Leader, I want to run a simulation to learn
the impact of changing the parameters (such as cooling temperature, workload, humidity,
etc.) in order to find an optimal option to minimise energy consumption.
SRI2 (Analyse VMs configuration). As a Group Leader or Member, I want to run the
simulation to learn the impact of shutting down VMs in order to find an optimal option to
minimise energy consumption.
SRI3 (Analyse load balancing tools change). As a Group Leader or Member, I want to run
the simulation to learn the impact of changing load balancing algorithms in order to find an
optimal option to minimise energy consumption.
SRI4 (Analyse workloads rescheduling). As a Group Leader or Member, I want to run the
simulation for rescheduling of workloads (postponing) energy consumption in order to find an
optimal option to minimise energy consumption.
SRI5 (Analyse network configuration changes). As a Group Leader or Member, I want to
run the simulation for setting the network configuration in order to find an optimal option to
minimise energy consumption.

GREENDC D21 – GREENDC DSS Design Document
Project no: 734273 20 31/10/2017
3. GREENDC Architecture
3.1 Overall architecture
Figure 1. GREENDC DSS Architecture
The GREENDC DSS has three-tier architecture including data, business logic, and
user interface layers (see Figure 1 above). Each layer will provide Interfaces for upper
layer to make them independent from each other.

GREENDC D21 – GREENDC DSS Design Document
Project no: 734273 21 31/10/2017
Data layer has two sub layers: data collection layer and data normalisation layer.
Data collection layer includes components that interact with devices or third-party
tools that generate or provide data from DC devices including IT and non-IT facilities.
Data normalisation layer components convert the collected data into data model of
the GREENDC DSS.
Mathematical layer will contain components that conduct estimation and optimisation
of energy use of DCs. Two major components are created: estimation component
and optimisation component. Estimation component will provide services related to
estimating energy consumption of devices and DC as a whole. Optimisation
component will provide services related to optimising the operation of DCs by
manipulating intervention mechanisms including optimal temperature for a given
predicted workloads, number of VMs to be shut down for a given time period, the
duration and which workloads to be postponed in case of high workloads, and
identifying the best load balancing mechanisms in different circumstances.
Business logic layer contains components that will deal with requests coming from
user interface layer components. The components include user manager, DC
Monitoring, and DC Simulator. User manager component will deal with authorisation
and authentication of users as well as user profile management. DC Monitoring
component will provide data on the DC usage for a given period including energy
consumption, workloads, status of facilities (IT and non-IT), and management
reports. Finally, DC Simulator will allow users conduct diverse simulations to test the
effectiveness of different intervention mechanisms. They include the impact of
changing temperature of a DC, load balancing mechanisms, the number of active
VMs, postponing the certain types of workloads.
Finally, the user interface layer includes user interface components for easy and
efficient interaction with users. The user interface components will be designed to
minimise users’ interactions with the system. The components in the user interface
layer will use services provided by the business logic layer components.
GREENDC D21 – GREENDC DSS Design Document
Project no: 734273 22 31/10/2017
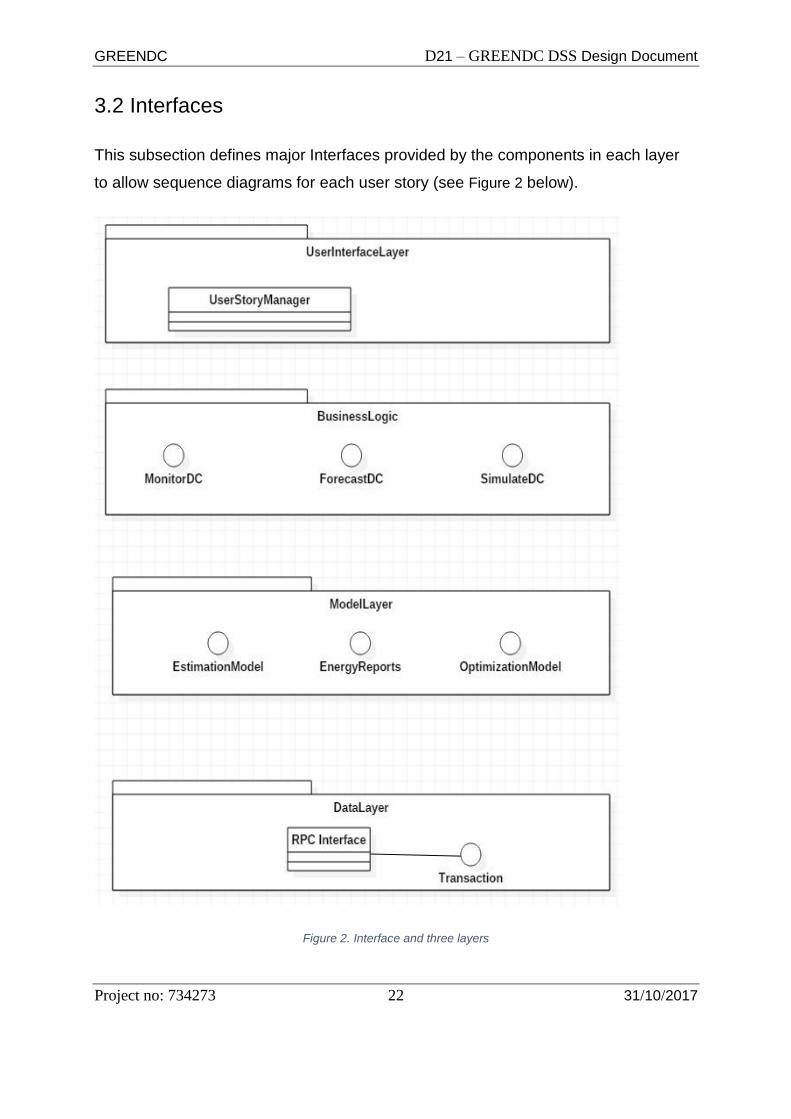
3.2 Interfaces
This subsection defines major Interfaces provided by the components in each layer
to allow sequence diagrams for each user story (see Figure 2 below).
Figure 2. Interface and three layers

GREENDC D21 – GREENDC DSS Design Document
Project no: 734273 23 31/10/2017
3.2.1 Business logic layer
There are three Interfaces to serve for the user stories.
Interface UserManager {
// Declare basics of CRUD functions of a User model
void createNewUser (UserProfile up);
void removeUser(String user_id);
void getUser(String user_id);
void setUser(String user_id);
void getUsers();
boolean authenticateUser(String user_id, String passwd);
List authorisedServices(String user_id, String role);
}
The UserManager Interface will reveal four public methods: createNewUser,
removeUser, authenticateUser and authorisedServices. The first two methods are
used to register and remove a user in the system. The third method will be used to
authenticate if a given user_d and passwd pair is registered at the user database of
the system. The final method will be used to check if a user has access rights for a
given role and if so a list of allowed services will be returned.
Interface MonitorDC {
LIst detectAbnomalConsumption(List devices, DateTime start, DateTime end);
List getEnergyLog(List devices, DateTime start, DateTime end);
List getDailyConsumptionSummary(List devices, DateTime start, DateTime end);
List getPeriodicReports(String type, DateTime start, DateTime end);
}
The MonitorDC interface will provide four methods for the user stories for monitoring
energy consumption of data centres respectively for RM1, RM2, RM3 and RM4.
Interface ForecastDC {
LIst forecastWorkloads(List devices, DateTime start, DateTime end);
List forecastEnergyConsumption(List devices, DateTime start, DateTime end);
}
GREENDC D21 – GREENDC DSS Design Document
Project no: 734273 24 31/10/2017
Likewise, two public methods are defined for two user stories for forecasting energy
consumption scenario. The first one will return a list of forecasted workloads for a
given list of devices (or data centre as a whole). The latter one will return forecasted
energy consumption for a given list of devices (or data centre) for specified periods.
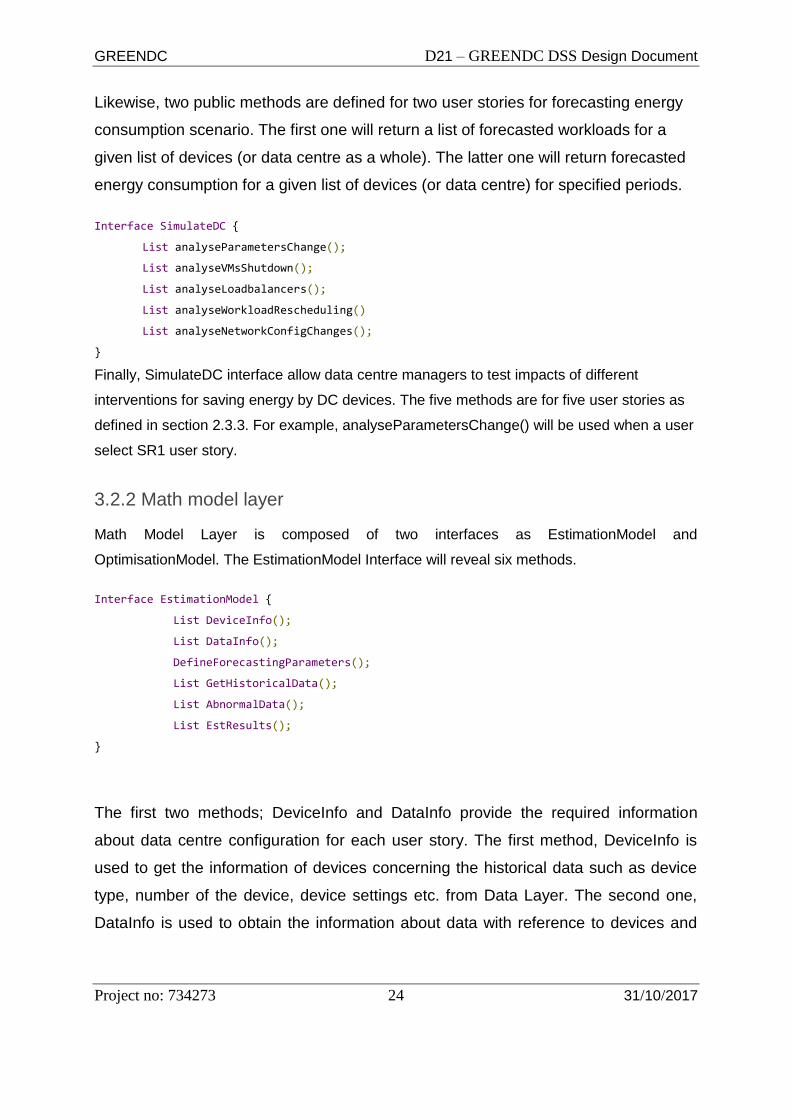
Interface SimulateDC {
List analyseParametersChange();
List analyseVMsShutdown();
List analyseLoadbalancers();
List analyseWorkloadRescheduling()
List analyseNetworkConfigChanges();
}
Finally, SimulateDC interface allow data centre managers to test impacts of different
interventions for saving energy by DC devices. The five methods are for five user stories as
defined in section 2.3.3. For example, analyseParametersChange() will be used when a user
select SR1 user story.
3.2.2 Math model layer
Math Model Layer is composed of two interfaces as EstimationModel and
OptimisationModel. The EstimationModel Interface will reveal six methods.
Interface EstimationModel {
List DeviceInfo();
List DataInfo();
DefineForecastingParameters();
List GetHistoricalData();
List AbnormalData();
List EstResults();
}
The first two methods; DeviceInfo and DataInfo provide the required information
about data centre configuration for each user story. The first method, DeviceInfo is
used to get the information of devices concerning the historical data such as device
type, number of the device, device settings etc. from Data Layer. The second one,
DataInfo is used to obtain the information about data with reference to devices and
GREENDC D21 – GREENDC DSS Design Document
Project no: 734273 25 31/10/2017
the other measured data (i.e. room temperature and humidity) from Data Layer. This
information helps to specify historical data type for DefineForecastingParameters.
DefineForecastingParameters is used to define the forecasting parameters
corresponding with the user stories ECF1 and ECF2. For ECF1, data type of IT
devices (i.e. CPU usage, CPU temperature, network traffic etc.) and the related other
parameters such as temperature, day of week and time will be considered for
defining. For ECF2, the power consumption of IT devices, cooling and power
systems will be evaluated separately. Parameters will be defined related with each
part.
GetHistoricalData provides the historical data from Data Layer according to the user
stories; ECF1 and ECF2. Historical data will be reached between the given time
interval and time step. The historical data consists of the regarding data types of the
forecast workloads or the energy consumption of devices and data centre. They will
be identified in the previous method.
AbnormalData is used to examine the historical data as to whether ordinary data or
abnormal data for RM1 user story. If it detects abnormal data, it will give information
about the abnormal data contents.
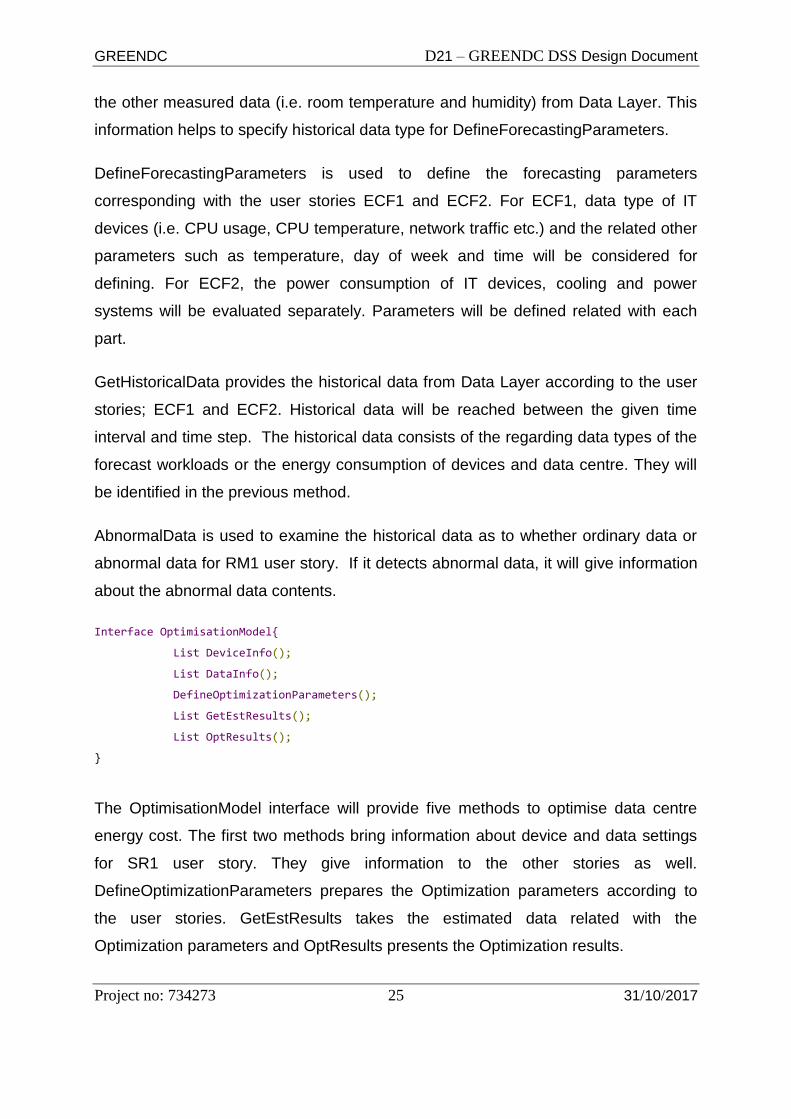
Interface OptimisationModel{
List DeviceInfo();
List DataInfo();
DefineOptimizationParameters();
List GetEstResults();
List OptResults();
}
The OptimisationModel interface will provide five methods to optimise data centre
energy cost. The first two methods bring information about device and data settings
for SR1 user story. They give information to the other stories as well.
DefineOptimizationParameters prepares the Optimization parameters according to
the user stories. GetEstResults takes the estimated data related with the
Optimization parameters and OptResults presents the Optimization results.

GREENDC D21 – GREENDC DSS Design Document
Project no: 734273 26 31/10/2017
These methods are used for all user stories but required info of parameters varies by
each story. For example, cooling set temperature info, humidity info, outside
temperature info can be given by these methods for SR2 at the same time info about
VM to determine how many VMs are needed to be shut down or to change their
settings. CPU configuration and data priority are for SR2. Likewise, SR3 deals with
the load balancing parameters, SRI4 considers the workload rescheduling and SRI5
examines network configuration in order to minimise the energy consumption cost.
3.2.3 Data layer
In data layer, the data will be provided upon request payload parameters. There is
only one interface to interact with 3rd party components, Business Logic Layer and
Math Model Layer and two internal interfaces which are supposed to be used by
other Data Layer classes and interfaces. These interfaces will be called as:
Interface Collection{
Data collect_data(Data data,Source source,Consume consump);
}
Collection interface will communicate physical devices and collect consumption data
from data center’ resources by given parameters which are explained already by
following chapters.
Interface Serialize{
JSON serialize(Data data);
}
Serialize interface will serialize the data which means verify and correct the data to
store into database as much as pure, clean and secure. It takes a Data object and
serializes to a JSON object.
Interface Transaction{
Boolean post(JSON data);
JSON get(Query query);
Boolean put(Query query);
Boolean delete(Query query);
JSON bulk(Query query);
Query toQuery(JSON query);
Query sanitize(JSON query);
}
GREENDC D21 – GREENDC DSS Design Document
Project no: 734273 27 31/10/2017
This Interface allows us, as 3rd party components or other layers, to post, get, put,
delete data.
Transaction.post(JSON data)
This method takes JSON data from inbound interface which is called Serialize, and
cast the data into related ORM model based object on the architecture and insert into
NoSQL database as an entity. Since, it will be already defined in the database while
creating tables and defines relations between tables, it is not necessary to redefine
foreign relations and constraints while inserting new rows. Please see further details
about the entities and models mentioned above, are shown as ERD in following
chapter 4.2.2 Data Entities and Models.
Transaction.get(Query query)
The get method gathered the required data from the database and respond it in
usual sequence to the request. The request sent will have some mandatory and non-
mandatory fields inside.
Transaction.put(Query query)
The put method will update/edit the data upon request.
Transaction.delete(Query query)
This method, as it can be understood from its declaration, will delete regarding data
which is submitted by the request.
Transaction.bulk(Query query)
Bulk method is defined to bulk operations such as multiple get or multiple delete at a
time.
Transaction.toQuery(JSON query)
This method will help us to generate or create new query object based on the
payload which is submitted by Math Model Layer and Business Logic Layer upon
their needs and requirements. It takes JSON payload and convert it into a internal
Query object after the sanitize method is executed.
Transaction.sanitize(JSON query)
The sanitize method is declared to clear, secure and verify data which is need to be
before submitting to other methods or objects.
GREENDC D21 – GREENDC DSS Design Document
Project no: 734273 28 31/10/2017
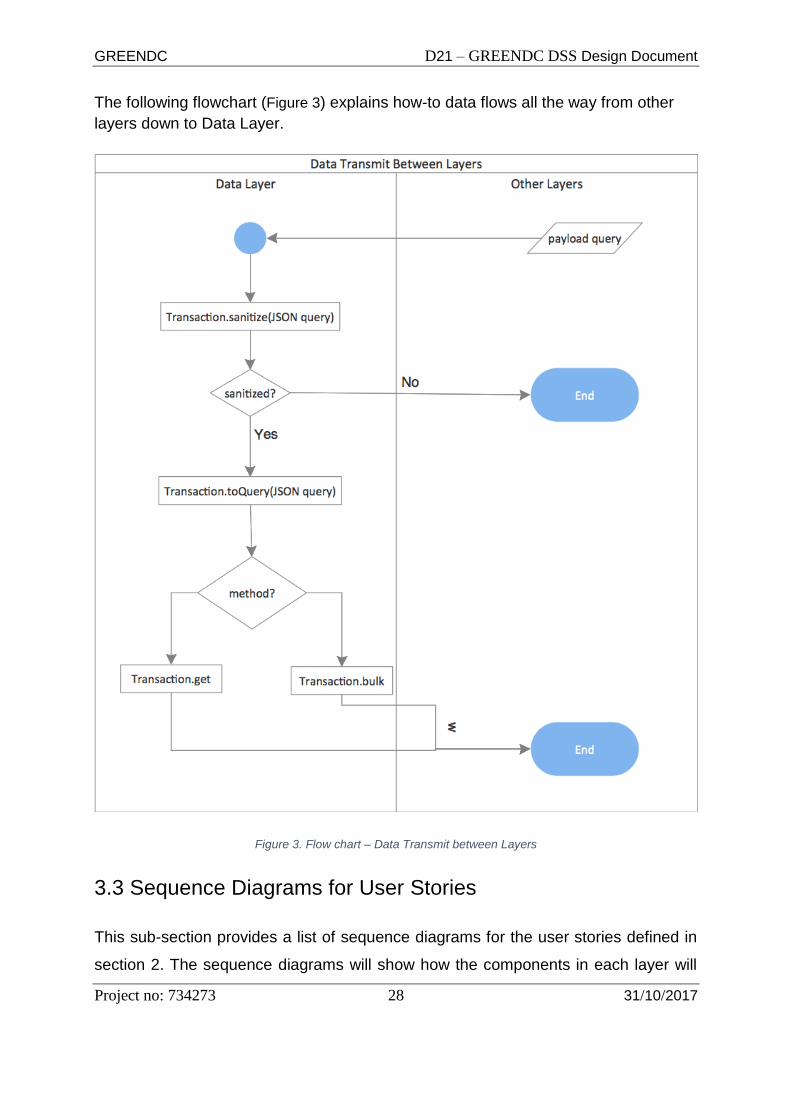
The following flowchart (Figure 3) explains how-to data flows all the way from other
layers down to Data Layer.
Figure 3. Flow chart – Data Transmit between Layers
3.3 Sequence Diagrams for User Stories
This sub-section provides a list of sequence diagrams for the user stories defined in
section 2. The sequence diagrams will show how the components in each layer will
GREENDC D21 – GREENDC DSS Design Document
Project no: 734273 29 31/10/2017
interact with each other to serve the user stories. Also, this can verify that the
Interfaces defined in section 3.2 are complete to meet the requirements in section 2.
3.3.1 Monitoring energy consumption user stories
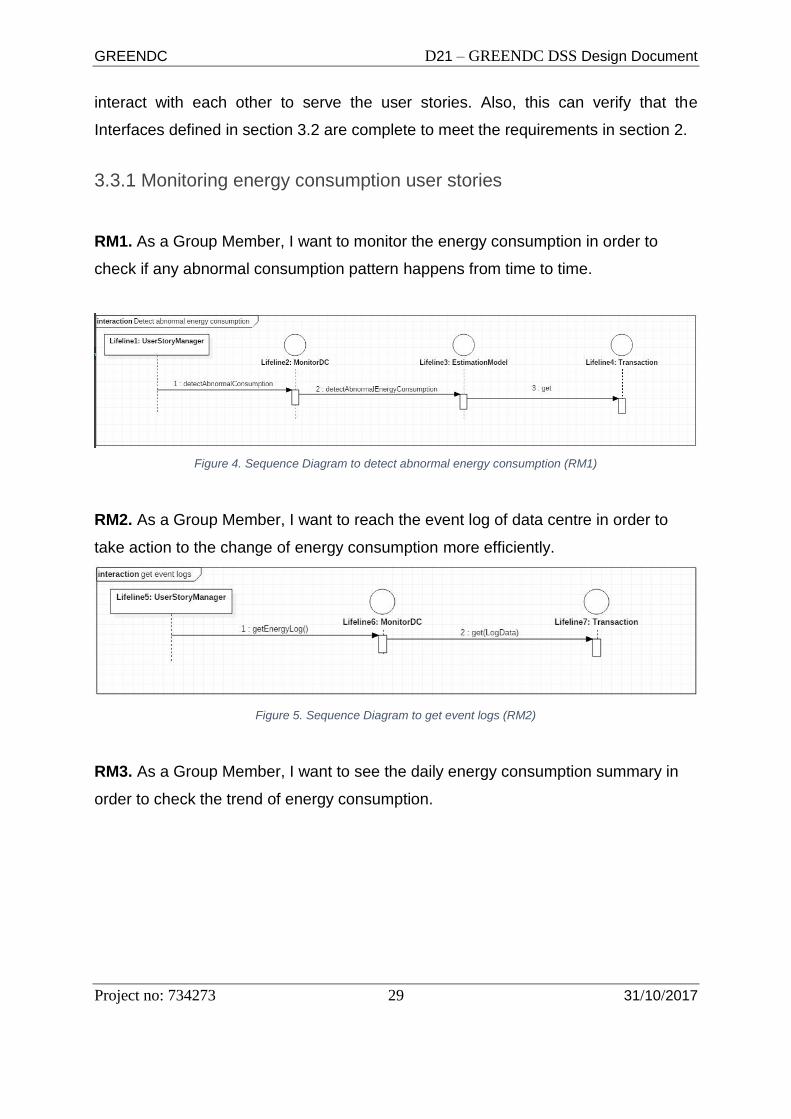
RM1. As a Group Member, I want to monitor the energy consumption in order to
check if any abnormal consumption pattern happens from time to time.
Figure 4. Sequence Diagram to detect abnormal energy consumption (RM1)
RM2. As a Group Member, I want to reach the event log of data centre in order to
take action to the change of energy consumption more efficiently.
Figure 5. Sequence Diagram to get event logs (RM2)
RM3. As a Group Member, I want to see the daily energy consumption summary in
order to check the trend of energy consumption.
GREENDC D21 – GREENDC DSS Design Document
Project no: 734273 30 31/10/2017
Figure 6. Sequence Diagram to get daily energy summary (RM3)
3.3.2 Energy Consumption Forecasting User Stories
ECF1. As a Group Leader, I want to reach the result of workloads forecasting
(daily/weekly/monthly) in order to prepare server capacity and required energy
sources.
Figure 7. Sequence Diagram to get workloads forecasting (ECF1)

GREENDC D21 – GREENDC DSS Design Document
Project no: 734273 31 31/10/2017
ECF2. As a Group Leader, I want to reach the result of energy consumption
forecasting (daily/weekly/monthly) in order to cope with the change of the energy
consumption.
Figure 8. Sequence Diagram to forecast energy consumption (ECF2)
3.3.3 DC Simulation User Stories
SRI1. As a Group Leader, I want to set the parameters (such as cooling, workload,
humidity, etc.) in order to forecast the energy consumption and make an intervention
individually.
Figure 9. Sequence Diagram to set simulator parameters (SRI1)

GREENDC D21 – GREENDC DSS Design Document
Project no: 734273 32 31/10/2017
SRI2 (Analyse VMs configuration). As a Group Leader or Member, I want to run
the simulation to learn the impact of shutting down VMs in order to find an optimal
option to minimise energy consumption.
Figure 10. Sequence Diagram to analyse VMs Configuration (SRI2)
SRI3 (Analyse load balancing tools change). As a Group Leader or Member, I
want to run the simulation to learn the impact of changing load balancing algorithms
in order to find an optimal option to minimise energy consumption.
GREENDC D21 – GREENDC DSS Design Document
Project no: 734273 33 31/10/2017
Figure 11. Sequence Diagram to analyse impact of load balancing (SRI3)
SRI4 (Analyse workloads rescheduling). As a Group Leader or Member, I want to
run the simulation for rescheduling of workloads (postponing) energy consumption in
order to find an optimal option to minimise energy consumption.

GREENDC D21 – GREENDC DSS Design Document
Project no: 734273 34 31/10/2017
Figure 12. Sequence Diagram to analyse impact of work migration (SRI4)
SRI5 (Analyse network configuration changes). As a Group Leader or Member, I
want to run the simulation for setting the network configuration in order to find an
optimal option to minimise energy consumption.
Figure 13. Sequence Diagram to analyse network configuration operation (SRI5)

GREENDC D21 – GREENDC DSS Design Document
Project no: 734273 35 31/10/2017
4. Data Layer
4.1 Components Architecture
Figure 14. Component Architectures for Data Layer
4.1.1 Components Description of Data Layer
Data Layer is splitted into two segments above the physical segments:
1. Data Collection Layer(DCLr)
2. Data Normalization Layer(DNLr)
These layers have their own components inside to implement their duties. In the
diagram, components names do not match related classes, objects or interfaces;
they are named metaphorical, based on what they do. Such as Serialize component
will serialize the data which is collected by Collect component. Here is Data Layer
components and it is found by following paragraphs further details:

GREENDC D21 – GREENDC DSS Design Document
Project no: 734273 36 31/10/2017
DCLr Components: DNLr Components
1. Collect
2. Serialize
3. Insert Database(Transactions)
1. ORM
2. Normalizer
3. RPC Interface(Web
Service/REST)
Components & Class/Interface Relations(bottom to top):
Collect: It is one the major components, contains base fundamentals to collect data.
Here is related objects and interfaces (Figure 15):
● DataCenter class ● DCData class ● Source class ● Consumption class
● RawData class ● Data class ● Collection interface
Figure 15. Collect Component
Serialize: It aims to Serialize the data which is collected by Collect component and
make the data ready for database operations (Figure 16). Here are related objects:
● Data class ● Serialize Interface
GREENDC D21 – GREENDC DSS Design Document
Project no: 734273 37 31/10/2017
Figure 16. Serialise Component
4.2 Data collection layer
Data Collection Layer will collect data from variant devices such as UPS, Air
Conditioners, IT devices(switches, firewalls, LB, etc.) and also will gather data via 3rd
party software APIs such Zabbix or DCIM softwares. Those softwares have their own
communication methods such as REST or WSDL to submit data via HTTP, SNMP or
ModBus. There are regarding tables that show us recent DCIM tools register map
which contains addresses and fields on Appendix A.
As it can be seen on the Component diagram in section 4.1, DCLs has a component
which collect data from several sources. It will have the class and interfaces for
different protocols (Figure 17).
Figure 17. Data Collection Flow in Data Collection Layer

GREENDC D21 – GREENDC DSS Design Document
Project no: 734273 38 31/10/2017
As it can bee seen in the figure below, there are 4 methods in a single thread and
three of them are interfaces to collect, serialize and transact the data. Here is further
explanation about these four methods:
● Sources: Is a list to keep the object called Source which defines data source
of DC operations such as AC, Chillers, IT devices(switches, firewalls, load
balancers, etc.). This object model has its own attributes which are internally
declared. It has generic OOP methods such as getter and setter inside the
boundary.
● RawData: RawData is the one of the main objects while the main thread
collects data. RawData is an object which is gathered from Sources and it has
required variables and based on resource context.
● Collection: This interface will help us to collect data from sources by a
specific methods which is called collect_data. This method collects data and
forwards to the Serialize interface. Collection interface has private methods to
implement a connection between source objects and manages those
connections.
● Serialize: As an interface, Serialize, since it is already self-described, is an
serializer interface to build serialized data transformed into a structured well-
formed JSON data from raw data.
● Transaction: Transaction interface includes insert serialized data after
transformed it by Serialize into the database or an external interface(s).
The data collection strategies are as follows.
4.2.1 Workloads Allocation
All workloads are received by firewall devices to secure, clear and authorize the
traffic. Then, all packets coming from outbound network are transferred to the load
balancer appliances. Load balancing mechanism is based on some LB algorithms
but, since enterprise appliances are used to balance the traffic load, we do not need
to know which load balancing algorithms that is used inside the appliance. It is

GREENDC D21 – GREENDC DSS Design Document
Project no: 734273 39 31/10/2017
explained in their own data-sheets and benchmarks. It is should be preferred to pick
the best option based on the traffic load, network topology and needs of the data
centre.
Figure 18 shows a sample LB(F5) graph to examine connection request to served
URLs:
Figure 18. Sample Graph to examine connection requests to served URLs
GREENDC D21 – GREENDC DSS Design Document
Project no: 734273 40 31/10/2017
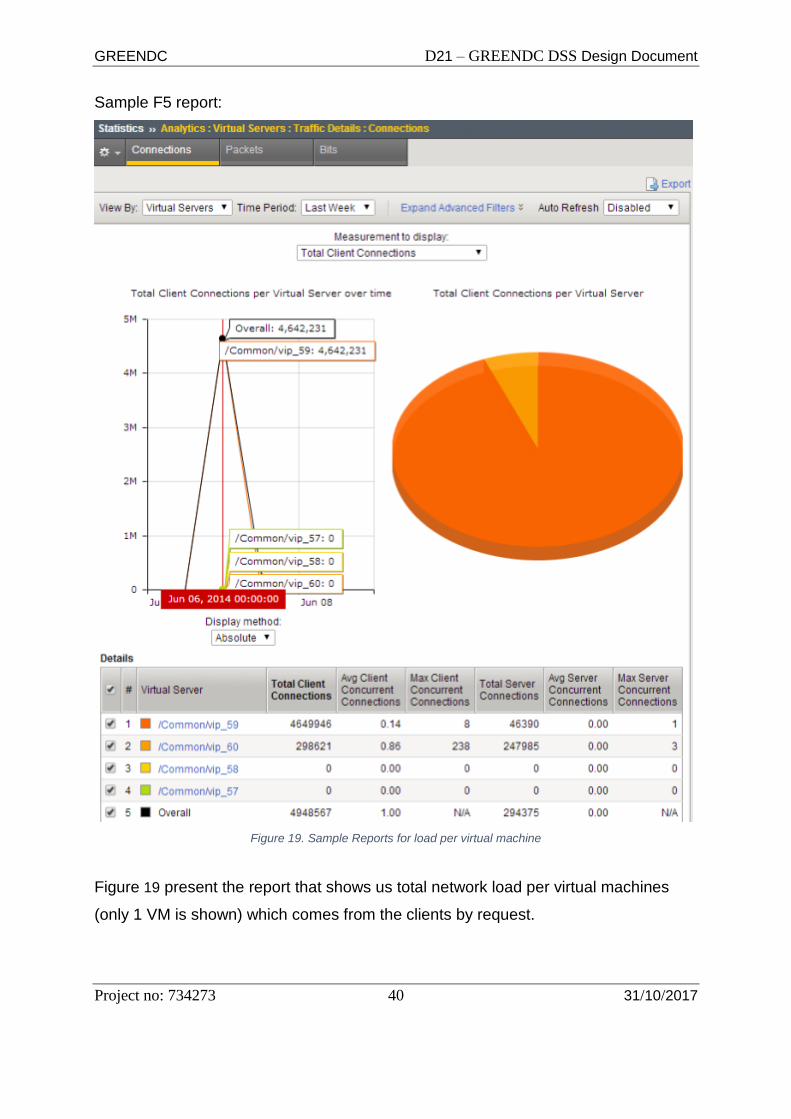
Sample F5 report:
Figure 19. Sample Reports for load per virtual machine
Figure 19 present the report that shows us total network load per virtual machines
(only 1 VM is shown) which comes from the clients by request.

GREENDC D21 – GREENDC DSS Design Document
Project no: 734273 41 31/10/2017
Although there should be physical appliance in front of the whole network topology, in
some cases it is better to use a load balancing software such as Nginx, HAProxy,
etc. What we do while implementing is an architecture must be keeping our
application(s) reliable, sustainable, highly available and secured. Thus, it might be
efficient choice to put a load-balancer to balance the traffic through the clustered data
stores or application servers. In the Figure 20 below it is shown that there only is
physical load balancer and it is left to the application team to discuss either they use
load balancer software or not:
Figure 20. Load Balancing Example
They are distributed to one of hosts within the server rooms as can be seen Figure 20.
There are three server rooms and each server room handles different service
requests. The allocation of workloads to hosts are based on load balancing
appliance. The total workloads for the DC room can be measured by getting load
balancer software reports.

GREENDC D21 – GREENDC DSS Design Document
Project no: 734273 42 31/10/2017
4.2.2 Data Entities and Models
There will be required entities to be stored in database. This entities will help us to get
historical and runtime data in order to supply forecast and analytics to the user.
The entity diagram is shown below (Figure 21) which is contained field names and their types
though:
Figure 21. Data Entity Diagram
Here is model implementation samples including attributes and methods below to
identify entity objects:
Class DataCenter{
Integer id;
String name;
String desc;
String location;
Date create_date;
Date edit_date;
Date delete_date;
List<DCData> dcdata;
}
GREENDC D21 – GREENDC DSS Design Document
Project no: 734273 43 31/10/2017
DataCenter entity object is designed to implement an actual Data Center model. It
has its own attributes to store what a real-world Data Center would had. Class DCData{
Integer id;
Integer dc_id;
Date create_date;
Date edit_date;
Date delete_date;
Integer humidity;
Integer temp;
}
DCData is an only entity to store Data Center measurement which are related with only
physical assets of the Data Center, not with racks or servers.
Class Source{
Integer id;
String make;
String model;
String firmware_version;
Date date_assembled;
Date create_date;
Date delete_date;
Date edit_date;
DataCenter dc;
Integer conn_protocol;
IPv4 conn_ip;
Integer conn_port;
HashMap register;
void set_make();
void set_model();
void set_firmware_version();
void date_assebled();
void set_proto();
void set_register();
…
…
…
}
Source model is designed to identify physical or virtual resources which consume
energy by based on their workloads including CPU, memory, storage and network
usages. Since it may vary upon physical devices or appliances have their own
vendors, it has to be identified that which resource had what attributes such as make,
GREENDC D21 – GREENDC DSS Design Document
Project no: 734273 44 31/10/2017
model, firmware, connection protocol, connection ip, connection port, date of
assembled and which data center it was assembled to.
Class Consumption{
Integer id;
String _type; // consumption type such as electricity, heat, etc.
Uint measure;
Date measer_date; // self-descriptive attribute
void set_date_measured();
void set_measure();
void set_type();
…
…
…
}
Consumption model is built based on consumption entity which is required to store
energy measurement values consumed by resources which is submitted by Collect
interface.
Class RawData{
Date date_get;
Source source;
Consumption consump;
void set_consume();
void set_source();
void set_timestamp();
…
…
…
}
RawData class is an internal object to cast objects into each other and bring together
into a single model. This model is not related any entity and will not be stored in
database though.
Here are other classes which will not be stored in the database but only used in
internal processes and threads written:
Class Data extends RawData{
Integer id;
HashMap values;
…
…

GREENDC D21 – GREENDC DSS Design Document
Project no: 734273 45 31/10/2017
}
Class Query extends HashMap{
String id;
String _type;
Date start_date;
Date end_date;
Integer id_datacenter;
Source source;
Integer source_type;
}
4.2.3 Energy and workloads data
Energy and workloads data will be collected from three different types of devices: IT,
Cooling, and Power (Figure 22).
Figure 22. Data Sources and Data Collector
Data collecting may vary for every single device in Data Center; besides
software/simulator must use required communication protocols such as SNMP and/or
ModBus to collect data from any cooling and power devices. On the other hand it is
GREENDC D21 – GREENDC DSS Design Document
Project no: 734273 46 31/10/2017
possible to retrieve data from such Open Source Softwares (Zabbix etc.) for IT
devices.
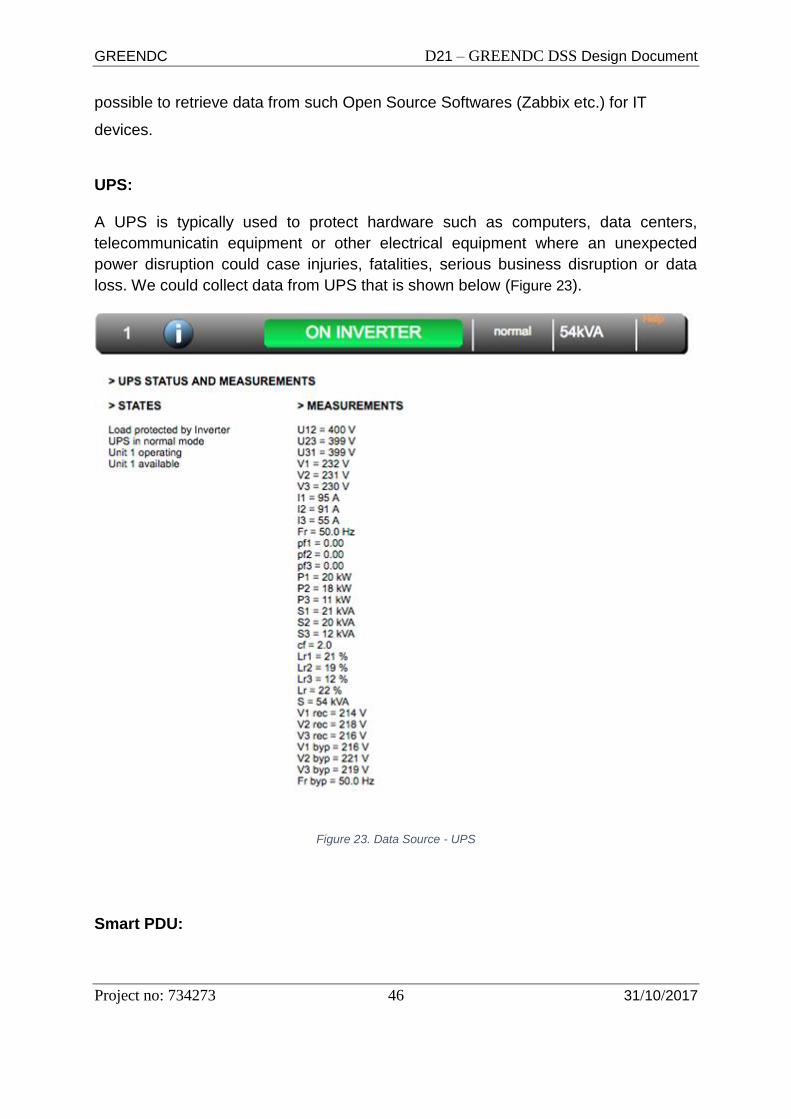
UPS:
A UPS is typically used to protect hardware such as computers, data centers,
telecommunicatin equipment or other electrical equipment where an unexpected
power disruption could case injuries, fatalities, serious business disruption or data
loss. We could collect data from UPS that is shown below (Figure 23).
Figure 23. Data Source - UPS
Smart PDU:

GREENDC D21 – GREENDC DSS Design Document
Project no: 734273 47 31/10/2017
Smart PDUs offer a higher level of monitoring at the device or outlet-level via an
Ethernet port. Smart PDUs offer the ability to configure outlets into up tos ix groups
an assign use group Access to specific outlets groups. Smart PDUs collect also
humidity and temperature values for each rack. Example of the smart PDUs interface
is shown below (Figure 24).
Figure 24. Smart PDUs Interface
Energy Meter:
An electric meter, an electric meter, or an energy meter is a device that measures the
amount of electric energy consumed by a resident, a business, or an electrically
powered device (Figure 25).
Figure 25. Energy Meter

GREENDC D21 – GREENDC DSS Design Document
Project no: 734273 48 31/10/2017
When energy savings are desired, some meters may measure demand, the
maximum use of power in some interval. "Time of day" metering allows for an
increase in electricity prices during the day, to record during peak high-cost periods
and off-peak, lower-cost, periods.
Power Monitoring is possible with modbus for energy meters. Examples are shown
below about interface and energy meters (Figure 26).
Figure 26. Power Monitoring through the Energy Meter
Generator:
In electricity generation, a generator is a device that converts motive power into
electrical power for use in an external circuit. Sources of mechanical energy include
steam turbines, gas turbines, water turbines, internal combustion engines and even
hand cranks. Generators provide nearly all of the power for electric power grids.
Generators are a key to data center reliability. Supplementing a battery-based
uninterruptible power supply (UPS) with an emergency generator should be
considered by all data center operators.
GREENDC D21 – GREENDC DSS Design Document
Project no: 734273 49 31/10/2017
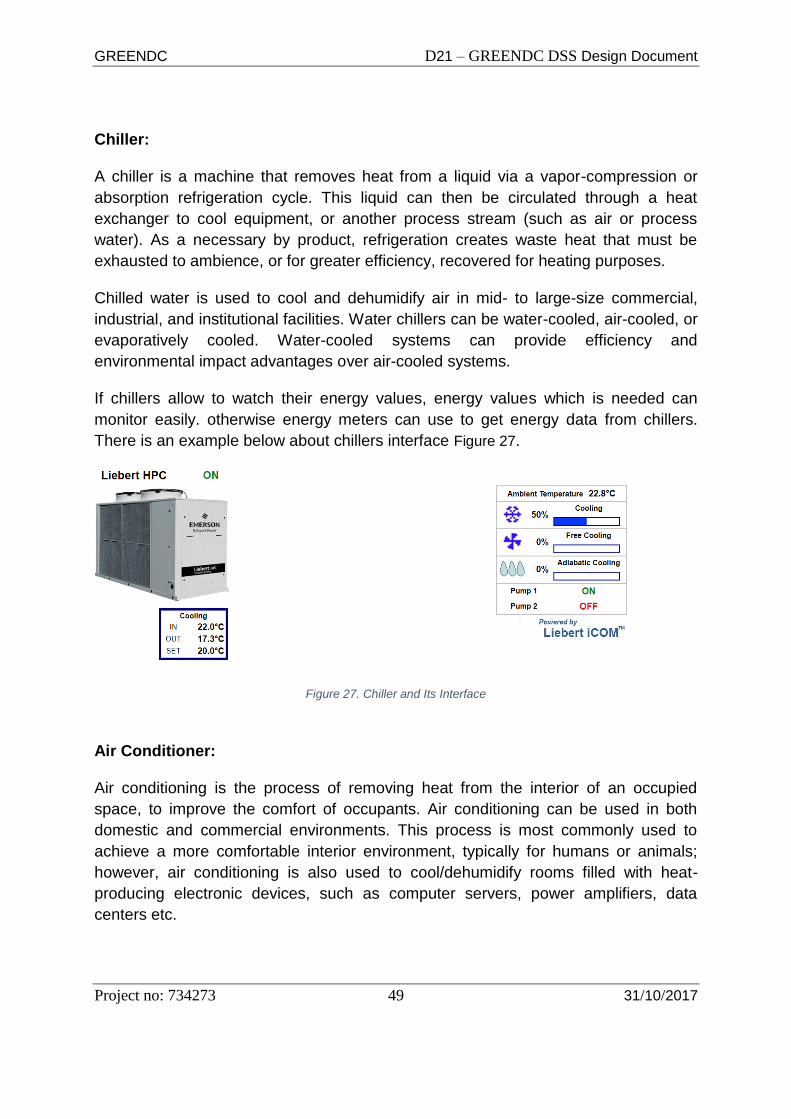
Chiller:
A chiller is a machine that removes heat from a liquid via a vapor-compression or
absorption refrigeration cycle. This liquid can then be circulated through a heat
exchanger to cool equipment, or another process stream (such as air or process
water). As a necessary by product, refrigeration creates waste heat that must be
exhausted to ambience, or for greater efficiency, recovered for heating purposes.
Chilled water is used to cool and dehumidify air in mid- to large-size commercial,
industrial, and institutional facilities. Water chillers can be water-cooled, air-cooled, or
evaporatively cooled. Water-cooled systems can provide efficiency and
environmental impact advantages over air-cooled systems.
If chillers allow to watch their energy values, energy values which is needed can
monitor easily. otherwise energy meters can use to get energy data from chillers.
There is an example below about chillers interface Figure 27.
Figure 27. Chiller and Its Interface
Air Conditioner:
Air conditioning is the process of removing heat from the interior of an occupied
space, to improve the comfort of occupants. Air conditioning can be used in both
domestic and commercial environments. This process is most commonly used to
achieve a more comfortable interior environment, typically for humans or animals;
however, air conditioning is also used to cool/dehumidify rooms filled with heat-
producing electronic devices, such as computer servers, power amplifiers, data
centers etc.

GREENDC D21 – GREENDC DSS Design Document
Project no: 734273 50 31/10/2017
If air conditioners allow to watch their energy values, energy values which is needed
can monitor easily. otherwise energy meters can use to get energy data from chillers.
There is an example below about air conditioners interface (Figure 28).
Figure 28. Air Conditioner Interface
Server:
Currently following data is collected from each server through Zabbix API*. There is
some zabbix examples of energy consumptions for servers below (Figure 29).
Figure 29. Energy Consumption from Servers – Example from Zabbix

GREENDC D21 – GREENDC DSS Design Document
Project no: 734273 51 31/10/2017
There are four fundemental workload contents that affect the energy consumption of
servers. these,
● CPU time
Figure 30. Energy Consumption of Server – CPU level

GREENDC D21 – GREENDC DSS Design Document
Project no: 734273 52 31/10/2017
● Memory usage
Figure 31. Memory Usage and Energy Consumption
● File I/O
Figure 32. File I/O and Server Energy Consumption
● Network Traffic
Figure 33. Network Traffic and Energy Consumption
Server Room:

GREENDC D21 – GREENDC DSS Design Document
Project no: 734273 53 31/10/2017
Sensors or thermometers can measure temperature and humidity of the server room
every 5 minute.
4.2 Data normalization layer
How to collect data is explained in section 4.1. However, collecting data is the
fundamental process of data layer. Data normalization is another operation to make
data available for any authorised request. Therefore, we need to implement a
generic-data normaliser and publish it into an API or SOA object.
Since we have an opinion to store the data in a schema-free structured data in
NoSQL datastore. By this approach, we will not need sophisticated and complicated
methods or entities in our architecture.
By this layer, we will have an ORM(Object Relational Mapping) library such as
Hibernate(Java) or SqlAlchemy(Python) or Doctrine(Php). This library helps us to
manage connection operations like open-close connections; execute SQL
statements, handle result-sets retrieved from database; map object models(classes)
with database entities. Create table from source code instead of SQL scripts. Using
an ORM library may increase development or production lifecycle. See a basic
Python model implementation to sample DSS data:
Class Consumption(Base):
__tablename__ = "tbl_consume_mtrx"
Id = Column(Integer, primary_key=True)
_type = Column(Integer, ForeignKey("tbl_consume_types", cascade="all, delete"))
measure = Column(Float, nullable=True)
date_measured = Column(DateTime, nullable=False, default=text('NOW()')
…
…
…
As it is seem above, we only need to declare a class as a model with its attributes
and ORM will create required tables, relations, entities, etc. The declaration of a

GREENDC D21 – GREENDC DSS Design Document
Project no: 734273 54 31/10/2017
model will create an entity in the database with its attributes shown as below ERD
(Figure 34):
Figure 34. ERD – Consumption and Its Types
The fields declared above are only suggestions. Real fields will be defined based
upon real data retrieved from DCLr.
ORM transactions will transmit the data to the Normalization class, which is a sub-
layer between ORM and RPC interface (Figure 35).
Figure 35. ORM Transaction and RPC Interface
RPC interface responds data in required format to any requester component (class or
interface). Basically, it is assumed that that responded data might be in JSON format
or WSDL. It depends on what is required upon Mathematical layer interface or 3rd
party component or software. This interface will transmit data to external pipes
outside of the Data Layer. RPC response may probably be like below:
{
code: 200, // should be based on HTTP status codes which are globally standard by
Client-Server conventions
msg: "Status OK" //
content: {
data: {
...

GREENDC D21 – GREENDC DSS Design Document
Project no: 734273 55 31/10/2017
}
}

GREENDC D21 – GREENDC DSS Design Document
Project no: 734273 56 31/10/2017
5. Math Model Layer
This section describes the algorithm of the forecasting and optimization process in
GreenDC DSS interface. In the next section forecasting process of the DSS is briefly
explained. In section 5.2 optimization process is detailed. In the last sections class
structure and sequence diagrams of math model layer is explained.
5.1. Forecasting Method:
The required workflow diagram for forecasting process is explained in Figure 36.

GREENDC D21 – GREENDC DSS Design Document
Project no: 734273 57 31/10/2017
Figure 36. Flowchart for Forecasting Process
GREENDC D21 – GREENDC DSS Design Document
Project no: 734273 58 31/10/2017
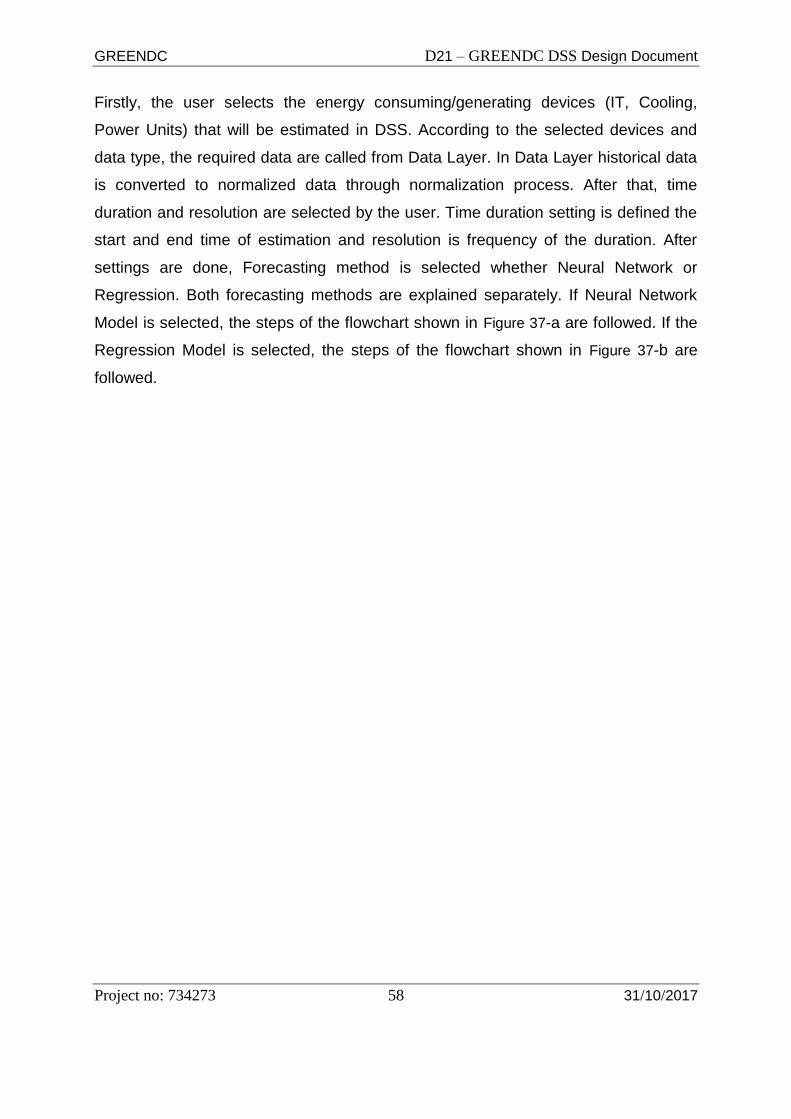
Firstly, the user selects the energy consuming/generating devices (IT, Cooling,
Power Units) that will be estimated in DSS. According to the selected devices and
data type, the required data are called from Data Layer. In Data Layer historical data
is converted to normalized data through normalization process. After that, time
duration and resolution are selected by the user. Time duration setting is defined the
start and end time of estimation and resolution is frequency of the duration. After
settings are done, Forecasting method is selected whether Neural Network or
Regression. Both forecasting methods are explained separately. If Neural Network
Model is selected, the steps of the flowchart shown in Figure 37-a are followed. If the
Regression Model is selected, the steps of the flowchart shown in Figure 37-b are
followed.
GREENDC D21 – GREENDC DSS Design Document
Project no: 734273 59 31/10/2017
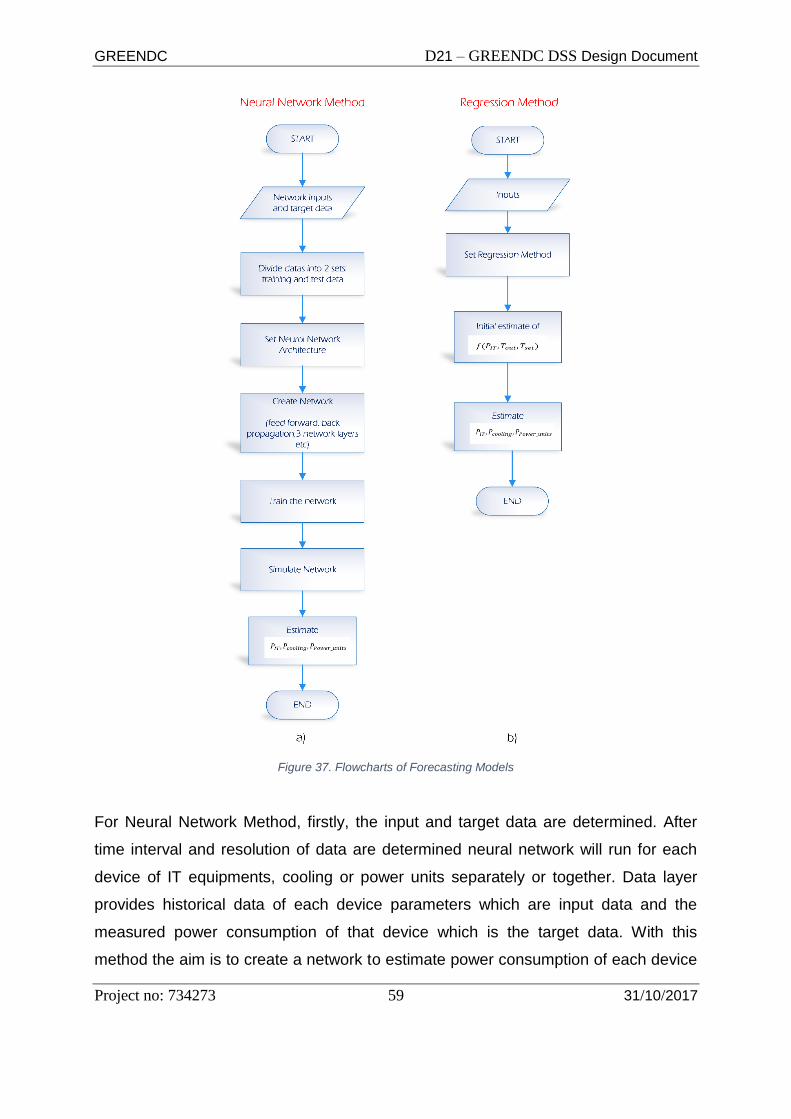
Figure 37. Flowcharts of Forecasting Models
For Neural Network Method, firstly, the input and target data are determined. After
time interval and resolution of data are determined neural network will run for each
device of IT equipments, cooling or power units separately or together. Data layer
provides historical data of each device parameters which are input data and the
measured power consumption of that device which is the target data. With this
method the aim is to create a network to estimate power consumption of each device

GREENDC D21 – GREENDC DSS Design Document
Project no: 734273 60 31/10/2017
under certain conditions. For example if we want to create a network for a server
power consumption, which is one of IT equipment, input and target data imported
from historical data can be defined as follows (Table 1):
Table 1. Sample Data Set For Neural Network
CPU Input data Target
historical
data
CPU usage CPU
temperature
RAM usage etc. P_server
training
data
val val val val val
val val val val val
val val val val val
val val val val val
... ... ... ... ...
test data
val val val val val
... ... ... ... ...
These data are divided as training and test data. After that Neural Network
architecture is identified with the number of neurons for inputs and outputs and
number of hidden layers and network is created. The network is trained and if results
satisfy, network is simulated. As a result of the simulation, the data to be estimated
like 𝑃𝐼𝑇 , 𝑃𝑐𝑜𝑜𝑙𝑖𝑛𝑔,𝑃𝑝𝑜𝑤𝑒𝑟_𝑢𝑛𝑖𝑡𝑠 are calculated.
Similarly, in Regression method, required historical data are obtained as inputs from
data layer. Then, regression parameters and regression type are defined. There are
different types of regression techniques in the literature to make estimates. These
techniques are usually based on three metrics that are type of dependent variables,

GREENDC D21 – GREENDC DSS Design Document
Project no: 734273 61 31/10/2017
number of independent variables and shape of regression line. Since we have a
polynomial function depending on outside temperature, set temperature and IT load,
we will use polynomial regression technique to forecast 𝑃𝐼𝑇 , 𝑃𝑐𝑜𝑜𝑙𝑖𝑛𝑔, 𝑃𝑝𝑜𝑤𝑒𝑟_𝑢𝑛𝑖𝑡𝑠
which are represent power consumption of IT, power consumption of Cooling Units
and power consumption of Power Units respectively. For example, the equation of
energy consumption of cooling is shown as:
𝑃𝑐𝑜𝑜𝑙𝑖𝑛𝑔,𝑡 = ∑
𝑐_𝑑𝑛
[ 𝑎0 + (𝑏1,𝑡 𝑋1,𝑐_𝑑𝑛,𝑡 +𝑏2,𝑡 𝑋2,𝑐_𝑑𝑛,𝑡 + ⋯ + 𝑏𝑐_𝑝𝑛,𝑡 𝑋𝑐_𝑝𝑛,𝑐_𝑑𝑛,𝑡)
+ (𝑐1,𝑡 𝑋1,𝑐_𝑑𝑛,𝑡 +𝑐2,𝑡 𝑋2,𝑐_𝑑𝑛,𝑡 + ⋯ +𝑐𝑐_𝑝𝑛,𝑡 𝑋𝑐_𝑝𝑛,𝑐_𝑑𝑛,𝑡)2]
a, b and c represent constant. Required historical data such as room temperature,
outdoor temperature, delivery air temperature, chilled water temperature, room
relative humidity etc. are indicated by (𝑋1,𝑐_𝑑𝑛,𝑡 + 𝑋2,𝑐_𝑑𝑛,𝑡 + ⋯ + 𝑋𝑐𝑝𝑛,𝑐𝑑𝑛,𝑡). There are
similar equations to calculate energy consumption of IT and power units. After
solving each polynomial equation to forecast 𝑃𝐼𝑇 , 𝑃𝑐𝑜𝑜𝑙𝑖𝑛𝑔, 𝑃𝑝𝑜𝑤𝑒𝑟_𝑢𝑛𝑖𝑡𝑠, forecasted
results are obtained.
5.2. Optimization Method:
The main objective of GREENDC DSS tool is to minimize the electric energy
consumption cost of data centre by incorporating into the energy market. Thus, the
objective function is formulated with two parts; energy consumption cost of DC and
the profit from demand side participation.
The objective function
The two parts of objective function are 𝐸𝑐𝑜𝑠𝑡𝐷𝐶 and 𝐸𝑝𝑟𝑜𝑓𝑖𝑡𝐷𝑆𝑀 which are explained
in detail below. 𝐸𝑐𝑜𝑠𝑡𝐷𝐶presents the energy consumption cost of DC and 𝐸𝑝𝑟𝑜𝑓𝑖𝑡𝐷𝑆𝑀
is the profit from demand side participation.
min 𝐶𝑜𝑠𝑡𝐷𝐶 = 𝐸𝑐𝑜𝑠𝑡𝐷𝐶 − 𝐸𝑝𝑟𝑜𝑓𝑖𝑡𝐷𝑆𝑀

GREENDC D21 – GREENDC DSS Design Document
Project no: 734273 62 31/10/2017
𝑠. 𝑡. ∑
𝑡
𝑃𝑢𝑝𝑠_𝑔,𝑡 + 𝑃𝑏𝑎𝑐𝑘𝑢𝑝_𝑔,𝑡 + 𝑃𝑔𝑟𝑖𝑑,𝑡 − (𝑃𝑠𝑒𝑟𝑣𝑒𝑟,𝑡 + 𝑃𝑠𝑡𝑜𝑟𝑎𝑔𝑒,𝑡 + 𝑃𝑛𝑒𝑡𝑤𝑜𝑟𝑘,𝑡 + 𝑃𝑐𝑜𝑜𝑙𝑖𝑛𝑔,𝑡
+ 𝑃𝑢𝑝𝑠𝑐,𝑡 + 𝑃𝑏𝑎𝑐𝑘𝑢𝑝_𝑔𝑐,𝑡) = 0
𝑚𝑖𝑛𝑣𝑎𝑙𝑢𝑒 < 𝑃𝑢𝑝𝑠,𝑡 < 𝑚𝑎𝑥𝑣𝑎𝑙𝑢𝑒
𝑚𝑖𝑛𝑣𝑎𝑙𝑢𝑒 < 𝑃𝑏𝑎𝑐𝑘𝑢𝑝 < 𝑚𝑎𝑥𝑣𝑎𝑙𝑢𝑒
𝑚𝑖𝑛𝑣𝑎𝑙𝑢𝑒 < 𝑃𝑠𝑡𝑜𝑟𝑎𝑔𝑒 < 𝑚𝑎𝑥𝑣𝑎𝑙𝑢𝑒
𝑚𝑖𝑛𝑣𝑎𝑙𝑢𝑒 < 𝑃𝑐𝑜𝑜𝑙𝑖𝑛𝑔 < 𝑚𝑎𝑥𝑣𝑎𝑙𝑢𝑒
𝑚𝑖𝑛𝑣𝑎𝑙𝑢𝑒 < 𝑇𝑒𝑚𝑝𝑒𝑟𝑎𝑡𝑢𝑟𝑒𝑠𝑒𝑟𝑣𝑒𝑟 < 𝑚𝑎𝑥𝑣𝑎𝑙𝑢𝑒
𝑃𝑢𝑝𝑠_𝑔,𝑡 + 𝑃𝑏𝑢𝑔_𝑔,𝑡 + 𝑃𝑔𝑟𝑖𝑑,𝑡 − (𝑃𝐼𝑇,𝑡 + 𝑃𝑐𝑜𝑜𝑙𝑖𝑛𝑔,𝑡 + 𝑃𝑢𝑝𝑠𝑐,𝑡 + 𝑃𝑏𝑢𝑔𝑐,𝑡 ) = 0 𝑓𝑜𝑟 𝑒𝑎𝑐ℎ "𝑡"
where,
𝑃𝑢𝑝𝑠,𝑡 is the consumed or generated power by UPS at t.period.
𝑃𝑏𝑎𝑐𝑘𝑢𝑝,𝑡 is the consumed or generated power by back-up units.
𝑃𝑔𝑟𝑖𝑑 is the provided power from grid.
𝑃𝑛𝑒𝑡𝑤𝑜𝑟𝑘,𝑡 , 𝑃𝑠𝑡𝑜𝑟𝑎𝑔𝑒,𝑡 , 𝑃𝑠𝑒𝑟𝑣𝑒𝑟,𝑡 are the consumed power by IT equipment of DC.
𝑃𝑐𝑜𝑜𝑙𝑖𝑛𝑔 is the consumed power by cooling units.
Energy consumption cost of DC (𝐸𝑐𝑜𝑠𝑡𝐷𝐶) can be formulated as follows;
𝐸𝑐𝑜𝑠𝑡𝐷𝐶 = ∑(𝑃𝑢𝑝𝑠,𝑡 ∗ 𝑀𝑢𝑝𝑠,𝑡)
𝑡
+ ∑(𝑃𝑏𝑎𝑐𝑘𝑢𝑝,𝑡 ∗ 𝑀𝑏𝑎𝑐𝑘𝑢𝑝,𝑡)
𝑡
+ ∑(𝑃𝑐𝑜𝑜𝑙𝑖𝑛𝑔,𝑡 ∗ 𝑀𝑐𝑜𝑜𝑙𝑖𝑛𝑔,𝑡)
𝑡
+ ∑[(𝑃𝑠𝑒𝑟𝑣𝑒𝑟,𝑡 + 𝑃𝑠𝑡𝑜𝑟𝑎𝑔𝑒,𝑡 + 𝑃𝑛𝑒𝑡𝑤𝑜𝑟𝑘) ∗ 𝑀𝑢𝑝𝑠,𝑡]
𝑡
𝐸𝑐𝑜𝑠𝑡𝐷𝐶 consists of the energy consumption cost of IT (server, storage and network)
and non-IT devices (ups, backup unit and cooling) in DC. Their energy consumption
can be calculated with their consumed power in t time period (i.e.𝑃𝑠𝑒𝑟𝑣𝑒𝑟,𝑡), and its unit
energy cost (i.e.𝑀𝐼𝑇,𝑡).

GREENDC D21 – GREENDC DSS Design Document
Project no: 734273 63 31/10/2017
Every device type has its parameters and its model. They are constituted from device
and data information settings and the historical data by the forecasting model.
The consumed power of each device, modelled by nonlinear regression method, can
be calculated with the related parameters determined from the forecasting methods.
For example, the consumed power of the servers can be calculated as follows:
where a, 𝑏 and 𝑐 are the constants that previously modelled related with the server
characteristics and the historical data parameters, (𝑋1,𝑠_𝑑𝑛,𝑡 + 𝑋2,𝑠_𝑑𝑛,𝑡 + ⋯ + 𝑋𝑠𝑝𝑛,𝑠𝑑𝑛,𝑡)
is the server parameters specified from the historical data parameters. s_pn is the
number of server parameters, s_dn is the number of server and t is time period. Such
server parameters are CPU temperature, CPU usage, RAM usage etc.
Similarly for UPS, power equation can be written as follows:
as in the servers 𝑎 , 𝑏 and 𝑐are the constants that previously modelled related to the
historical data parameters, (𝑋1,𝑢_𝑑𝑛,𝑡 + 𝑋2,𝑢_𝑑𝑛,𝑡 + ⋯ + 𝑋𝑢,𝑢𝑑𝑛,𝑡) is the UPS parameters
specified from the historical data parameters. u_pn is the number of UPS
parameters, u_dn is the number of UPSs and t is time period. Parameters of UPS are
input voltage, frequency, current, total active and apparent power; bypass voltage,
frequency, current, total active and apparent power, nominal output rating, output
voltage, frequency, current, peak output current, total active and apparent power;
UPS installation load percentage, estimated charge time of battery, battery system
temperature, battery power, available amp hours etc.
Power consumption for cooling can be calculated as follows and it may have different
parameters depending on the system;

GREENDC D21 – GREENDC DSS Design Document
Project no: 734273 64 31/10/2017
For example if it is a water cooled chiller system, the parameters are room
temperature, outdoor temperature, delivery air temperature, chilled water
temperature, room relative humidity etc. Formulations for each device can be created
in this way to model energy consumption of DC most properly.
Second part of objective function, 𝐸𝑝𝑟𝑜𝑓𝑖𝑡𝐷𝑆𝑀 , the profit from demand side
participation, can be formulated as follows;
where each part has saving power, which can be calculated with their
operation conditions and constraints at a time period t. Power of each part has some
unit price given by energy market.
5.3. Class Structure of Math Model Layer
Math Model Layer interconnects with Data Layer and Business Logic Layer. Class
structure of Math Model Layer composes with two main parts; Data Preparation and
Math Model as shown in Figure 38. Data Preparation part has five classes which are
MathDeviceSetup, MathDeviceList, MathDataSetup, MathDataFlowSetup,
MathDataFlow and Math Model part consists of two classes: MathForecasting,
MathOptimization.

GREENDC D21 – GREENDC DSS Design Document
Project no: 734273 65 31/10/2017
Figure 38. Class Structure of Math Model Layer
MathDeviceSetup class is identified the device setup concerning the estimation and
optimisation methods. This class will contribute to understand properties and
information such as device type, limits, status etc. It does not represent physical
setup of the device. Math Model Layer gets to know all devices of data centre with
this class.
Each device has its attributes; name, type and ID. DeviceName, DeviceID and
DeviceType member represent these attributes respectively. Device type can be
considered as UPS, Backup generator, server, storage etc. DeviceID is unique
member of MathDeviceSetup class. An information of device related to this class is
obtained via DeviceID. Devices can be grouped as generating (back-up generator),
consuming (servers, storages etc.) and both generating and consuming device (UPS
etc.) according to energy flow direction. IsConsuming and IsGenerating member will
be used to get energy flow direction. StartUpEnergy member corresponds to
consuming energy while initialization of the device. DeviceStatus member shows us
whether device in use or not. The class includes minimum and maximum energy
consumption and/or generation information. If the device is only energy consuming
device, minimum and maximum energy generation of the device should be zero. On
the other hand, if the device is only energy generating device, minimum and

GREENDC D21 – GREENDC DSS Design Document
Project no: 734273 66 31/10/2017
maximum energy consumption of the device should be zero. StartUpTime member
mean that required time during initialization. In the same way, ShutDownTime
represents elapsed time until completely close. In addition, the class has lower and
upper temperature limit information of the device.
Class MathDeviceSetup{
int Device_ID;
string DeviceName;
string DeviceType; //UPS, Back-up generator, server, storage etc.
boolean IsConsuming;
boolean IsGenerating;
double StartUpEnergy;
double NoLoadEnergyInput;
boolean DeviceStatus;
double MinEnergyConsumption;
double MaxEnergyConsumption;
double MinEnergyGeneration;
double MinEnergyGeneration;
double StartUpTime;
double ShutDownTime;
double LowerTempLimit;
double UpperTempLimit;
DeviceSetup()
}
MathDeviceList class represents the list of all devices in data centre. List will be
created with Device_ID of all devices as an array. The class also includes number of
device in data centre.
Class MathDeviceList{
int[] Device_ID;
double NumberofDevice;
MathDeviceSetup[] DevicesSetup;
DeviceList()
}

GREENDC D21 – GREENDC DSS Design Document
Project no: 734273 67 31/10/2017
MathDataSetup class provides general information about data unit, availability status
(IsAvailable). This class also provides understanding of data source type (UPS,
server etc.) and data type (temperature, power, workload, etc.). DeviceType and
DataType represents these parameters, respectively. Each data has data ID
(Data_ID) and required parameter of the related data setup obtained by this ID. Data
can be used in math model parts; forecasting and/or optimization . UseInEst and
UseInOpt define data usage in math model parts. The last three boolean variables
are used to identify control variables of optimization function (Power unit, Cooling
and/or IT). Data_ID is unique member of MathDataSetup class.
Class MathDataSetup{
int Data_ID;
string DataName;
int DeviceID;
string DataType; // Temperature, power, workload, Network traffic, CPU usage
etc.
string DeviceType; //UPS, Back-up generator, server, storage etc.
string DataUnit;
boolean UseInOpt;
boolean UseInEst;
boolean IsAvailable;
boolean DataOptPower;
boolean DataOptCooling;
boolean DataOptIT;
Dataetup()
}
MathDataFlowSetup class corresponds to time information of data acquisition (start
time, end time, time step). This class determines starting and end time of flowed data
from data layer via DataFlowSetup() constructor method.
Class MathDataFlowSetup{
int DeviceID;
int DataID;
string DataType;

GREENDC D21 – GREENDC DSS Design Document
Project no: 734273 68 31/10/2017
string DataName;
double StartTime
double EndTime;
double TimeStep;
DataFlowSetup();
}
MathDataFlow class specifies data flow features. TimeStamp is an real time
information about acquisition of the data. CheckBit controls data integrity. If there is
no measurement or misinformation belong to this data, CheckBit will be zero
otherwise one. Data value can be queried by ID from different function.
DataFlowSetup() is used to get flow setup information. GetDataFlow() method gets
data flow information from data layer and sets member of the class.
Class MathDataFlow{
int DataID;
double TimeStamp;
double DataValue;
boolean CheckBit;
DataFlowSetup();
GetDataFlow();
}
MathDataSetup, MathDataFlowSetup and MathDataFlow classes mentioned above
are generic for all acquired data type.
MathForecasting and MathOptimasation classes include parameters and methods
related to forecasting and Optimization, respectively.
Firstly, input parameter is determined in order to forecast user-defined parameters in
a forecasting operation. Input parameters consist of various data type such as
temperature, network traffic, power etc. FCInputParamsID_List is an array composed

GREENDC D21 – GREENDC DSS Design Document
Project no: 734273 69 31/10/2017
of data ID of required input parameters. There are two types of time information in
this class. The first one represents time duration and time step for historical data. The
second one represents desired timeframe of the forecast and time step.
HistoricalDataSetup() method specifies the historical data. Getting of historical data
related to input parameters is executed by means of GetHistoricalData() method in
the class. Neural Network and Regression will be used for forecasting.
FCMethod_NN() and FCMethod_Reg() functions execute these forecasting methods.
RunForcasting() function perform forecasting operation according to selected
methods. Forecasting results can be showed in a routine by using FCResults()
methods.
Class MathForecasting{
double[] FCInputParamsID_List; //includes Data_ID
/* Start time,end time and time step information acquired from data preparation interface
*/
double HistData_starttime;
double HistData_endtime;
double HistData_timestep;
double FCtOutputParamID; //. It represents data type.of objective
double FCData_starttime;
double FCData_endtime;
double FCData_timestep;
DefineForecastingParameters(); //Required parameters for forecasting
HistoricalDataSetup(); //specifies the historical data
List GetHistoricalData();
double FCMethod_NN (); //Forecasting Method-1
double FCMethod_Reg (); //Forecasting Method-2
RunForecasting(); //Perform selected forecasting
method.
List FCResults();
}

GREENDC D21 – GREENDC DSS Design Document
Project no: 734273 70 31/10/2017
MathOptimization class includes required optimisation parameters and methods.
Input parameter types (temperature, power etc.) have to be determined before
optimization execution. OptInputParamsID_list is the list of data ID of optimisation
input parameters. It can be reached data type of input parameters via this ID list.
Output parameter ID (OptOutputParamID) is used for identifying data type of output
parameter as in MathForecasting class. Numerical normalized data of input
parameters are obtained in GetEstimatedData method via OptInputParamsID_list.
OptPower, OptCooling and OptIT members identify control variables of optimization
function. Two methods will be used for optimization. Methods will be decided in
progress. Constraints of optimization problem are taken from MathDeviceSetup in
DefineConstraints(). Optimization results can be listed by using OptResults() in a
routine.
Class MathOptimization{
/* OptInputParamsID_List defines list of input parameter types for optimastion. It
includes Data_ID information */
double[] OptInputParamsID_List;
/*OptOutputParamID defines output parameters type for optimastion. It includes
Data_ID information */
double OptOutputParamID;
/*identify control variables of Optimization function*/
boolean OptPower;
boolean OptCooling;
boolean OptIT;
DefineOptimizationParameters();
DefineConstraints(); //These constraints are taken from
MathDeviceSetup.
GetOptParameterList();
List GetEstimatedData();
double OptMethod1 ();

GREENDC D21 – GREENDC DSS Design Document
Project no: 734273 71 31/10/2017
double OptMethod2 ();
RunOptimization ();
List OptResults();
}
5.4. Sequence Diagram of Math Model Layer
The Math Model Layer consists of two sublayer which are Data Preparation and Math
Model. The Math Model has two subsections: Forecasting and Optimization. Each
section is expressed in different colours for easy understanding. As shown figure 10,
Data preparation Layer is represented by purple colour. The forecasting section is
indicated by red colour and the optimization section is represented by blue colour.
The arrows providing the information flow are represented by the color of the section
where the arrow goes. For example, to define optimization parameters, GreenDC
DSS need to know the info are taken from DeviceSetup,DataSetup and EstResult .
Because of these info are related with optimization section the arrows which
represent info flows are represented by blue colour. Although, DeviceSetup and
DataSetup functions send data to the forecasting section, data flow is represented by
red colour.
5.4.1 Data Preparation for Math Layer
Data preparation for math layer section provide the required information to
forecasting and optimization sections. The historical data which include device type,
number of device, device settings, room temperature, humidity etc. are provided by
Data Layer to Data preparation section. List DeviceInfo and List DataInfo functions
are used to obtain these data. DeviceSetup and DataSetup functions identify the
devices and data specifications and set the relevant setup information of devices and
data for the estimation and optimization methods. The DataFlowSetup function is
used to specify historical data flow. List GetDataFlow function is used to get the
specified historical data list from data layer.
5.4.2. Forecasting
Sequence Diagram of Math Model Layer for forecasting is shown in figure 10. As
shown in Figure 39, firstly, DefineForecastingParameters and HistoricalDataSetup
functions are used to take and define the data from DeviceSetup and DataSetup for

GREENDC D21 – GREENDC DSS Design Document
Project no: 734273 72 31/10/2017
each forecasting parameters such as:. CPU usage, CPU temperature, network traffic,
room temperature, day of week etc.
Figure 39. Sequence Diagram of Math Model Layer for forecasting
List GetHistoricalDataSetup function is used to get specified data from list
GetDataFlow and helps to DataFlowSetup to specify historical data which required
for FC Methods. FCMethod1 and FCMethod2 represent the Neural Network and
Regression methods and these functions execute the forecasting method that is
selected by user. According to selected methods, forecasted data are calculated and
results are sent to the Business Logic Layer by CalculateFC and List FCResults.

GREENDC D21 – GREENDC DSS Design Document
Project no: 734273 73 31/10/2017
5.4.3. Optimization
In Figure 40, Sequence Diagram Of Math Model Layer for Optimization is shown.
DefineOptimizationParameters takes information about devices and data settings
from DeviceSetup and DataSetup.
Figure 40. Sequence Diagram of Math Model Layer for Optimization
Input parameters are determined in this function. Estimated data needed for
optimization are provided by List FCResults by means of List GetFCResults.
Optimization Parematers values and its constraints are defined in
OptimizationParameterSetup function. One of optimization method is chosen by user
and according to selected method, optimization tool executed and results are
obtained. List OptResult function sends the results to Business Logic Layer.
GREENDC D21 – GREENDC DSS Design Document
Project no: 734273 74 31/10/2017
6. Business Logic Layer
The business logic layers include components that provide services required by the
components of the user interface layer.
6.1 UserManager
The major responsibility of UserManager component is to authenticate users and
ensure service access based on their roles. In this section we describe the user
authentication mechanism to be used by the GREENDC DSS when invoking
operations on the web services provided by the application server. The process of
Authentication means to verify that a specific entity is who or what it claims to be. In
other words, authentication is the verification of an identity containing at least an
identifier. Authentication can also be understood as the process of establishing
confidence in the authenticity of a claim made by an entity.
Authentication requires the usage of at least one authentication factor. Authentication
factors commonly are classified in three categories:
● something you know (password, personal identification number (PIN),
symmetric or asymmetric cryptographic key)
● something you have (smartcard, other hardware tokens)
● something you are (biometric data such as iris, fingerprint)
In order to increase the strength of the authentication, several authentication factors
can be combined. Commonly known examples are a PIN or a signature for your bank
card or the PIN in conjunction with your SIM-Card to authenticate towards a mobile
phone network.
The National Institute of Standards and Technologies (NIST) has defined 4
assurance levels in (NIST 2008) that should be considered in the design of the
GREENDC DSS:
● Level 1: Little Confidence - allows all kinds of authentication and provides little
or no confidence in the authentication such as username and password.
● Level 2: Some Confidence - still allows single factor authentication but
demands encryption.

GREENDC D21 – GREENDC DSS Design Document
Project no: 734273 75 31/10/2017
● Level 3: High Confidence - requires multi-factor authentication using highly
secure authentication factors such as biometrics or one-time passwords.
● Level 4: Very High Confidence - provides the highest possible level of
confidence and requires hardware tokens, multi-factor authentication and hard
cryptography.
There will be two logical entities involved to handle user authentication:
● Authentication Domain: Handles the authentication of the requesting principal.
● Identity Token Issuance Domain: Issues identity tokens and using the protocol
specific communication between the end-user and the relying party (RP).
The authentication domain includes all necessary components, functions and
capabilities to authenticate a user or other external entities. It includes several
classes of functions coordinating and performing the authentication. These functions
perform all necessary processes to determine the identity of an external entity that
requests access to the identity manager's functionalities. Beyond the mere
authentication process, the functions determine and express the level of trust in the
assurance of the identity gained by a successful performance of authentication
processes and hold that knowledge in a context which can be re-used for
authenticating further interactions as long as it is valid (Figure 41).
Figure 41. Logical entities for the authentication domain
The Authentication Controller summarizes the capacities to determine and keep an
authentication context based on a previous successfully conducted authentication

GREENDC D21 – GREENDC DSS Design Document
Project no: 734273 76 31/10/2017
process. This authentication context should include data about the time of
authentication, the methods of authentication, time of the validity of the authentication
and information about the level of trust. The controller has to possess knowledge
about all available authentication methods and the level of trust those methods
justify. The functions performing authentication control have to determine if an entity
requesting access has a previously established valid authentication context and if the
authentication context meets the respective security requirements. If not, the
authentication control has to determine which of the available authentication methods
or which combination of authentication methods would be sufficient.
The Authentication Selector is a capability that determines which specific
authentication method will be used for authenticating the user/service. The selection
is based on the results of the authentication controller, i.e. the selector has to perform
a selection or it offer a pre-selected scheme based on the set of authentication
methods determined by authentication control to be sufficient. If the principal
requesting authentication is a web service client, regardless whether it is an UA
wielded by a human end user or a service, authentication selection is done implicitly.
Therefore, the web service clients have to attach authentication credentials to the
initial request in order to receive an identity token.
The Authentication Executor represents the concrete implementation of an
authentication method. It is separated from the controller and the selector in order to
be generic, distributable and extensible to support a wide variety of different
authentication methods (X.509 certificates, username/password, SAML, etc.). This
design also provides the feature to implement each authentication method in a
physically distinct entity and being dynamically deployable and un-deployable.
Furthermore, an executor might be implemented and deployed in an external domain
(e.g. using a specific authentication method from business partner who operates as
an Identity Provider). In the mentioned scenario, neither the operator nor the token
provider will relinquish control over their infrastructure to the other.
User Authentication in the GREENDC project will be based on the brokered
authentication and heavily rely on the WS-Security specification, more precisely WS-
Trust and WS-SecureConversation, respectively. The authentication process
includes two levels of authentication: (1) authentication against the STS and (2)
GREENDC D21 – GREENDC DSS Design Document
Project no: 734273 77 31/10/2017
“anonymous” authenticated, secure conversation at the GREENDC service level
(using a so called “Communication Manager”). This approach separates the real
identity of the end user from the identity that is used inside of the GREENDC DSS,
allowing for a more finely granulated and flexible architecture in terms of security,
privacy and extensibility.
There will be a single web service operation dedicated to authentication. When
authentication is successful a security token is returned. This token needs to be
passed as an argument to all other operations that require previous authentication.
On the server side, the token is then used as key to the session data for the user.
The design also considers supporting Web Service Federation later on. To do so, the
realization of the identity and security manager‟s respective communication endpoint
for secure, session-based conversation leads to the implementation of an ITF-WS for
both WS-Trust and WS-SecureConversation. Depending whether the mobile
application fully/partially supports WS-* or not, a fully set/subset of the specifications
or just the general approach will be implemented. This ITF-WS fill be called Security
Token Service (STS).
The STS offers at least one method by the description of the web service via a
WSDL file which also contains a list of supported authentication methods or
authentication profiles:
● public void authenticate();
The method is called by the client who sends Request Security Token (RST)
message in form of an authentication request to the STS. In case of a successful
authentication, the STS issues a Security Context Token (SCT) to the client by
responding with a Request Security Token Response (RSTR) message. The SCT is
used by the client to request a session token from the STS in order to communicate
with the intended GRENDC service. The submitted credentials are included in the
SOAP request due to the concept of message layer security. The issued tokens,
attributes or error codes are included in the appropriate SOAP response.
The user authentication itself will be executed in the authentication domain, namely
one of the provided Application Functions. The authentication is triggered by the STS
which sends an authentication request to the AF. The AF that will be invoked
depends on the type of authentication that is in use. That means that different

GREENDC D21 – GREENDC DSS Design Document
Project no: 734273 78 31/10/2017
authentication operations need to be invoked (and implemented on the server side)
for different types of authentication.
We now introduce as examples two types of authentication:
a) Authentication with username and password.
b) Authentication with client certificates.
These two types of authentication are described in the following sections. As only the
initial request requires an authentication, all other web service operations do not
require to authenticate again. This will make the SSL connections between the client
and the server more lightweight, improving performance and lowering request
latency.
To obtain the token the mobile application invokes an operation that performs the
authentication using a username and password. Therefore, the client generates an
RST that contains a UsernameToken. In order to create the token, this operation
expected two arguments: username and password. It will return the SCT upon
successful authentication, or an error status. The SCT will be used in a subsequent
request to obtain a service token from the STS.
In the following paragraphs, we sketch a possible AF implementation of the operation
on the identity manager. The AF needs to invoke AuthManager.authenticate(...) with
the appropriate credentials object. The implementation of the operation obtains a
reference to the AuthManager object through a dependency injection mechanism.
In the scenario where authentication requires username and password, the
AuthManager used is an instance of MuxPwdAuthManager.
The implementation of “authenticate(…)” on class “MuxAuthManager” checks the
type of authentication for the user (Figure 42). The type of authentication is defined in
“UserAuthSource”. It then selects an apropriate “PwdAuthManager” instance and
invokes its “checkPassword(…)” method (Figure 43). The DbPwdAuthSource has to
encrypt the password, e.g. by using the MD5 algorithm, before storing it.
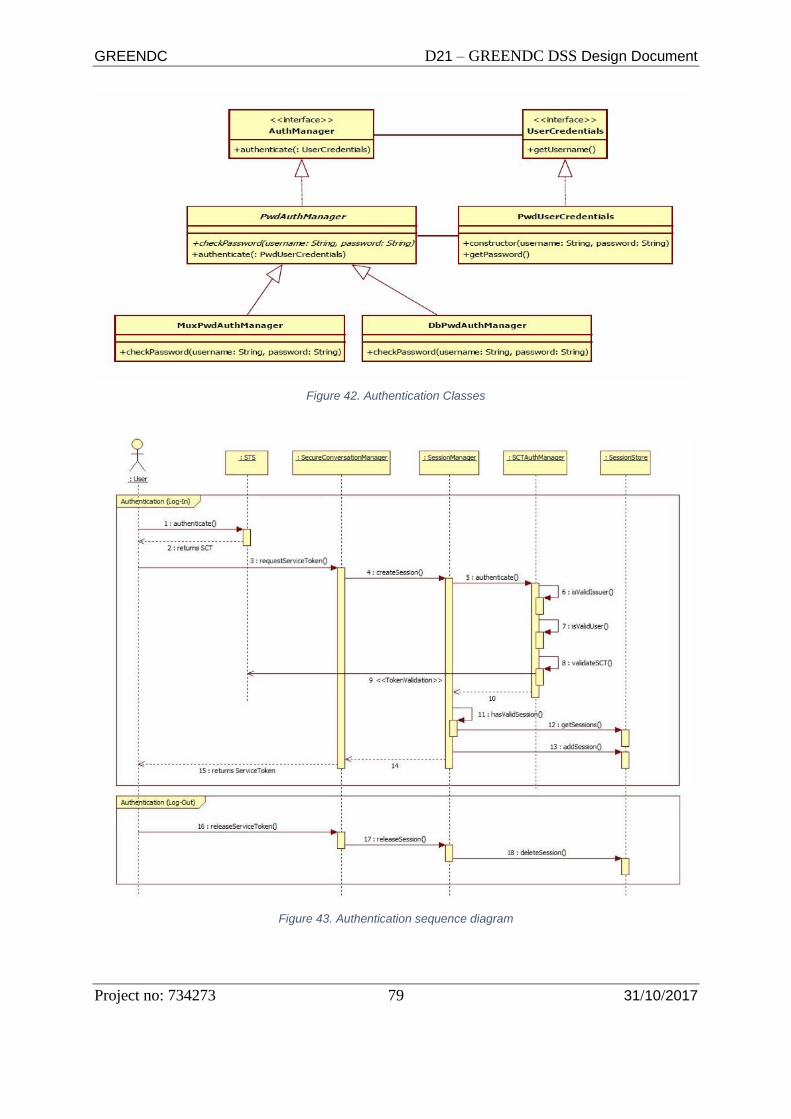
GREENDC D21 – GREENDC DSS Design Document
Project no: 734273 79 31/10/2017
Figure 42. Authentication Classes
Figure 43. Authentication sequence diagram

GREENDC D21 – GREENDC DSS Design Document
Project no: 734273 80 31/10/2017
6.2 DCMonitor & DCForecaster
6.2.1 Consumption Monitoring, Analysis and Control
Consumption monitoring, analysis and control module comprises a set of
components destined to know and understand in detail energy consumption and
generation in the data centres and characterize how energy is employed, with the
ultimate objective of controlling and managing distributed generation to the best
possible configuration, tending to the maximum efficiency of resources.
The three identified components related to this module correspond to
· Energy consumption monitoring
· Energy consumption automatic data Analyser
· Control centre for consumption and distributed generation
Energy consumption monitoring:
This component will collect actual and valuable data from data centres which serve to
generate feedback from DCs regarding their energy use. At the same time, it will
allow DC managers to have semi-real time information of their consumptions, profiles
and emissions. Currently, in most cases, the DC managers’ access to information
about their electricity use is limited to the data that is included in the bill from their
utility company. The system will provide semi-instant feedback on energy
consumption. This will give rise to applications, information and processes that
automatically adapt the behaviour of the manageable resources of the DC depending
on network situation. In this context we identify the following services, described in
detail in the Table 2.
Table 2. Expected Services from Energy consumption monitoring
Component name Energy consumption monitoring
Service name Target user Description

GREENDC D21 – GREENDC DSS Design Document
Project no: 734273 81 31/10/2017
Monitor energy
consumption at
DC level
DC
managers
Description: This service will collect all the
data which is created by metering devices
and generate energy usage information in the
DC. The gathered information will then be
available for the users, arranged in the most
appropriate way for their use through the
visualization service which will be detailed in
this section.
All data will be provided homogeneously,
which will facilitate the comprehension of the
information.
Thanks to the monitoring service, users will
have information about energy use of and
energy flow in a DC in several ways.
Input: Consumption information (Energy and
thermal) and other types of sensing
(Temperature, lighting…).
Output: Consumption profiles, comparisons
between servers or racks, consumption
information aggregated by time, gas
emissions, categories and processes.
Additional comment:
This service is meant for every user of the
platform but at the same time the information
which is gathered by monitoring will serve to
other components of the system, for example

GREENDC D21 – GREENDC DSS Design Document
Project no: 734273 82 31/10/2017
in order to perform forecasting analysis.
A key aspect on this service is the
homogeneous and proper data handling that
must be ensure through the complete
information process. In this sense, the data
management components (data aggregator
and normalised data base) will work in
connection to the monitoring services.

GREENDC D21 – GREENDC DSS Design Document
Project no: 734273 83 31/10/2017
Store aggregated
energy information
from different
measurement
devices
DC members Description: All the information that the
system receives through the monitoring
service could be classified in different ways,
aggregated by time or period, type of
consumer, energy tariffs, DC, etc.
This will enlarge the raw data from metering
devices and enrich system information which
will be available to users by creating
multidimensional data.
Every piece of information that is aggregated
by the analytical processing will be stored in
the system for further queries of users or
other components.
Inputs: Processed information from
consumption monitoring services, energy
prices, energy tariffs, energy policies,
sensing, and any other relevant data for
aggregation.
Outputs: Aggregated information by the
different parameters concerning
consumption.
Additional comment:
As the monitoring service, the aggregated
energy information would be available to
every user in the system and other
components that may require the aggregated
info for further analysis.

GREENDC D21 – GREENDC DSS Design Document
Project no: 734273 84 31/10/2017
The importance of the role of storing the
aggregated information is the advantage of
having that info automatically, since it is
produced before it is actually needed by other
components. This saves a valuable amount
of time and computing resources to other
components and improves system
performance.

GREENDC D21 – GREENDC DSS Design Document
Project no: 734273 85 31/10/2017
Aggregate data
query
DC
manager,
members
Description: This service will provide users
with a tool to retrieve the aggregated
information that is stored in the system so the
complexity of the aggregation is invisible to
the users, simplifying the labour of generating
particular information already adjusted to
their needs. Besides, the aggregate data
query service could serve to provide
summarized information and aggregated
information that is automatically created by
the system during its continuous data
processing.
Inputs: User’s queries and aggregated data.
Outputs: Aggregated energy consumption
information following query’s specifications.
Additional comment:
A key aspect on the aggregate data query
service is the view selection problem which
will depend on the semantic engine behind
the analysis process. Answer data queries
should not take much resource in order to
guarantee a correct performance and the
system stability.
If data is automatically aggregated then query
process will be quick. However, if the data is
aggregated following a particular query, then
it is traduced into a costly time-consuming
process.

GREENDC D21 – GREENDC DSS Design Document
Project no: 734273 86 31/10/2017
Visualize and
compare energy
consumptions
DC
manager,
members
Description: Through users’ interfaces it
would be possible to visualize energy
consumption and make comparisons
between various consumption profiles so that
users can analyse the information by
themselves.
Data should be available in several formats
and in different units. Energy use could
appear in terms of kWh, tons of CO2 or €
depending on what does the user prefer.
For example, a DC manager will be able to
inspect its DC energy use through the
information which is managed by this service
and be aware of how much energy it
employed in air conditioning, lighting, etc.
Inputs: User’s request. Sensing, energy data
and aggregated data.
Outputs: Energy consumption information,
comparisons between DC rooms,
consumption information aggregated by time,
etc.
Additional comment:
This service will act as the last element in the
monitoring process as it will present to users
the information they need. That information
would have been gathered by the monitoring

GREENDC D21 – GREENDC DSS Design Document
Project no: 734273 87 31/10/2017
service, adapted and transform to a coherent
shape, aggregated if necessary and stored in
the system before it is shown to the user.
Target users of this service are the human
users of the application who need the
information they want to know to be adapted
to their requirements.
Energy consumption automatic data Analyser
The consumption automatic data analysis component will utilize the data gathered by
monitoring and will be able to automatically generate high level information which
facilitates energy management at the system. It will detect inadequate energy uses,
and rise alarms related to energy consumptions by a prior configured rule base for
GREENDC D21 – GREENDC DSS Design Document
Project no: 734273 88 31/10/2017
example. This information will be a complementary tool for achieving energy
management. The automatic data analysis would be performed following certain
preconfigured declarations, which could be rule-based defined for example and
enable the system to generate that high level information autonomously.
The main service offered by this component is the automation alarm for energy miss-
consumption which is described in detail below Table 3.
Table 3. Expected Services from Energy consumption automatic data Analyser
Component name Energy consumption automatic data Analyser
Service name Target user Description
Automation alarm
for energy miss-
consumption
DC manager,
members
Description: This service offers
automatically generated alarms to alert of any
energy consumption deficiencies. The service
delivers the results of a sentinel who is
continuously analysing energy consumption
in the system to detect and prevent any
undesirable event.
Input: Processed information from monitoring
services, energy prices, energy tariffs,
consumer characteristics, energy policies,
energy consumption aggregated information.
Output: Automatic generated alarms to
inform of unexpected consumptions.
Information for future detection of energy
deficiencies.

GREENDC D21 – GREENDC DSS Design Document
Project no: 734273 89 31/10/2017
The service of this component is for DC manager and members in the system and is
designed to support them in the energy consumption analysis. Instead of users
preferences the service could be automatically configured by the system, which
contrast with the services related to the Energy consumption monitoring component.
Control centre for consumption and distributed generation
To orchestrate energy management it is required knowledge from various billing
components, the behaviour of the hourly demand and the consumption pattern of
each DC room. This component is intended to be as a general control centre for
consumption and distributed generation, which will guide the energy balance to the
economic optimum. In order to do that the system will send signals to the local
controllers of distributed generation modifying energy flow according to the demand.
The component will be based its processes on simulations of the whole system
taking into account diverse parameters as energy tariffs, energy prices for the next
periods or technical features of distributed generation systems. These simulations
will provide a series of possible scenarios for the next hours among which the
optimum will be chosen. Besides, once the simulations are completed and an
optimum is chosen, every element in the system needs to be inquired in order to
know the feasibility of the elected scenario and validate the result, or in the opposite
case, restart the process in the search of a new solution.
In this context we identify the following services, described in detail in the following
Table 4.
Table 4. Expected Services from Control centre for consumption and distributed generation
Component name Control centre for consumption and distributed
generation
Service name Target
user
Description
GREENDC D21 – GREENDC DSS Design Document
Project no: 734273 90 31/10/2017
Forecast energy
bill
DC
manager
Description: This service will provide an
estimation of the energy bill for the following
hours at a certain consumption point based on
its previous patterns, energy tariff, estimated
energy demand and ambient conditions.
This could be understood as a tool to influence
in energy demand too, because if users have
information of what are they going to spend in
energy they may reduce their consumption to
reduce their energy bill.
Input: Weather conditions, energy tariffs,
consumption patterns and other additional
influential parameters that affect energy
demand and therefore the resulting energy bill.
Output: An estimation of the energy bill of
certain consumption point.
Send energy
prices for next
periods
DC
managers
Description: This service will send to users the
latest energy prices that have been published
according to the electricity market. Thanks to
this service, users will be aware of how much
would they spend on electricity in each hour of
the day as well as notice the active nature of the
price seeing how is the shape of price curves
and how does the price actually changes during
the day.
Input: Energy market prices, users’ energy
tariffs.

GREENDC D21 – GREENDC DSS Design Document
Project no: 734273 91 31/10/2017
Output: Users energy prices for next periods.
Send signal to
local controllers of
distributed
generation
DC
managers
This service will send signals to local controllers
of distributed generation in order to organize
energy flow according to the demand and the
best feasible scenario for the distributed
generation which leads to the global benefit.
Input: Optimum scenario of energy balance,
technical features of distributed generation
systems.
Output: Signals to local controllers to
orchestrate distributed generation.

GREENDC D21 – GREENDC DSS Design Document
Project no: 734273 92 31/10/2017
Level of acceptance
of proposed
generation plan
DC
manager
Description: This service will serve to collect
the response from distributed generation
systems to the proposed generation plan given
by the control centre for consumption and
distributed generation.
After the control centre for consumption and
distributed generation has establish a possible
generation plan for the following periods, this
service will give the system a feedback of how
willing are distributed generation elements to
observe the suggestion given to them. As a
result of the survey, it might be necessary to
search a new generation plan that could be
accepted by most of the generators.
Input: Optimum scenario of energy balance.
Generation configuration for the following hours.
Output: Level of acceptance of the proposed
plan from distributed generation.
6.2.2 Energy optimiser and smart grid integrator
Energy optimiser component provides support for energy monitoring and
consumption analysis to energy efficiency and the proper integration between
consumption and generation.
The energy optimizer and smart grid integrator component would be the part of the
system in charge of deciding for each period of the day which is the optimal
configuration for the consumption and generation of both electrical and thermal

GREENDC D21 – GREENDC DSS Design Document
Project no: 734273 93 31/10/2017
production in DC rooms. Besides it will integrate and optimize the use of renewable
energy by automatically adjusting distributed generation systems to general
conditions.
This component will act at the local scope directing tasks as:
· Coordinated management of electric energy.
· Combine the supply (and availability) of the grid with batteries and renewable
energy sources.
· Take into account consumption forecast.
· Take into account guidance signals from the Control centre for consumption
and distributed generation
The fulfilment of these tasks will require a complex management of various
information regarding measurements of consumption and generation, components of
billing, consumption patterns of a DC room, fixed and variable generation costs and
technical features of renewable sources and batteries. The component will manage
local consumption and generation by deciding the best configuration of the elements
under its control and providing energy saving recommendations and notifications of
upgradeable use for energy for a DC room.
The identified services related to the local energy optimizer and smart grid integrator
are described in the following Table 5.
Table 5. Expected Services from energy optimizer and smart grid integrator
Component name Local energy optimizer and smart grid integrator
Service name Target user Description

GREENDC D21 – GREENDC DSS Design Document
Project no: 734273 94 31/10/2017
Manage and
optimize energy
flow
DC manager Description: By means of simulations
based on a DC room’s consumption
patterns, energy tariff, estimated energy
demand, distributed generation technical
features and the rest of influential
parameters as expected weather conditions
or central system indications, the best
configuration for a DC’s energy demand and
generation will be proposed. The result will
indicate whether is better to produce energy
locally rather than purchase it from the grid,
which is the best use for local energy
storage elements or how should be the
energy produce by distributed generation
systems.
Input: Measures of consumption and
generation, components of billing,
consumption patterns, fixed and variable
generation costs, available information of
renewable energy sources and batteries.
Rules for best energy consumption
practices.
Output: Set points of generation and
consumption elements that allow control, set
points for battery management, energy
saving recommendations.

GREENDC D21 – GREENDC DSS Design Document
Project no: 734273 95 31/10/2017
Manage rule base
for best energy
consumption
practices
DC member This service will serve to manage predefined
rules to optimize energy use in the DC
rooms. Rules could comprise act and control
of certain elements of the system as well as
perform informative actions addressed to
users.
One rule could be as ‘if contracted power is
exceeded during a certain time then a
message will be sent’ to inform DC manager.
Upper layer managers could contribute to
the creation of this database by defining
rules associate with energy efficiency
measures.
Input: Rules definition for best energy
practices.
Output: Rules database with the established
configuration for each case.
6.3 DCSimulator
The goal of the DCsimulation component is to allow data centre managers to understand the
impacts of different strategies for energy-efficient data centre operations.
For the design or configuration of a data centre we need to consider using appropriate
metrics and tools evaluating how much computation or data processing can be done within a
given power and energy budget and how it affects temperatures, heat transfers, and airflows
within the data centre. Therefore, there is a need for simulation tools and models that
GREENDC D21 – GREENDC DSS Design Document
Project no: 734273 96 31/10/2017
approach the problem from a perspective of end users and take into account all the factors
that are critical to understanding and improving the energy efficiency of data centres, in
particular, hardware characteristics, applications, management policies, and cooling.
There are several submodels to represent dynamics of energy consumption in DCs but the
GREENDC project considers two major energy consumers in DCs: IT facility and non-IT
facility. For the IT-facility, servers are the major devices for energy consumption and cooling
devices for non-IT facilities. Therefore, the GREENDC DSS will develop two submodels for
the energy consumption of the two devices.
A simulator tool helps in evaluation of an hypothesis where different scnearios could be
simulated and tested the outcomes of those scenarios. The simulation tools are generally
used before the actual prototype development of the solution and enables testing different
solutions in an efficient and cost effective manner. In cases of DC energy consumption tests,
a simulator allows evaluating studies with different resource allocation and leasing scenarios
under different load and pricing distributions. The studies help the DC team to optimize the
energy consumption models to achieve least energy consumption with maximum
performance possible from the infrastructure.
6.4 CloudSim
The GreenDC project adopts the CloudSim tool to achieve its simulation of DC energy
consumption models. CloudSIM is a tool that provides a framework to model and simulate
Cloud Computing infrastructures And services. It was developed and presented by the
researchers from Australian universities. It is mainly designed to evaluate the performance of
Cloud provisioning policies, application workload models, and resources performance
models via simulation tests that can be repeatable with different system and user
configurations. Some of the main features of the CloudSim functionalities are:
● large scale DC can be modelled and simulated
● server hosts, policies for resource allocation to hosts can be customized
● supports modelling and simulation of application containers
● supports modelling and simulation of nergy-aware computational resources
● DC network topologies can be modelled for simulation
● Allows dynamic insertion of simulation elements, start, stop and resuming of
simulations
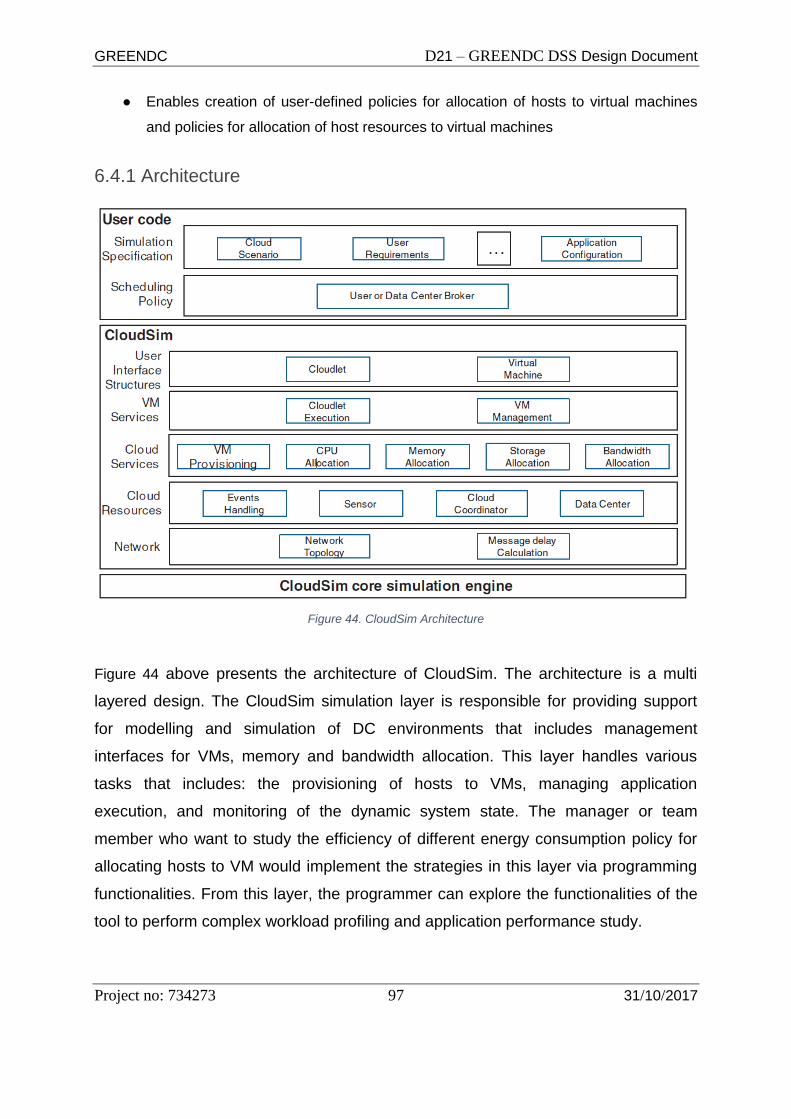
GREENDC D21 – GREENDC DSS Design Document
Project no: 734273 97 31/10/2017
● Enables creation of user-defined policies for allocation of hosts to virtual machines
and policies for allocation of host resources to virtual machines
6.4.1 Architecture
Figure 44. CloudSim Architecture
Figure 44 above presents the architecture of CloudSim. The architecture is a multi
layered design. The CloudSim simulation layer is responsible for providing support
for modelling and simulation of DC environments that includes management
interfaces for VMs, memory and bandwidth allocation. This layer handles various
tasks that includes: the provisioning of hosts to VMs, managing application
execution, and monitoring of the dynamic system state. The manager or team
member who want to study the efficiency of different energy consumption policy for
allocating hosts to VM would implement the strategies in this layer via programming
functionalities. From this layer, the programmer can explore the functionalities of the
tool to perform complex workload profiling and application performance study.

GREENDC D21 – GREENDC DSS Design Document
Project no: 734273 98 31/10/2017
At the User Code layer, the entities of the host, such as hosts (number of machines,
their specification, and so on), applications (number of tasks and their requirements),
VMs, number of users and their application types, and broker scheduling policies is
available. The developer can perform activities here, such as: creating a combination
of workload distribution and application configuration, model scenarios and
customise configurations to perform tests, and implement custom application
provisioning techniques for the DC.
6.4.2 Class Diagram
Figure 45. An overall class Diagram of CloudSim
The above Figure 45 shows the overall class diagram of the CloudSim tool. Some of
the important classes are discussed below.
BwProvisioner: It is an abstract class that is used for modelling the policy of
bandwidth provisioning to the VMs. It is responsible for bandwidth allocation for the
VMs in the DC. This class along with BwProvisioningSimple allows the developers to
allocate or reserve bandwidths to the VMs and use it to design the allocation policies
according to the application requirements.
public abstract class BwProvisioner {

GREENDC D21 – GREENDC DSS Design Document
Project no: 734273 99 31/10/2017
/** The total bandwidth capacity from the host that the provisioner can allocate to
VMs. */
private long bw;
/** The available bandwidth. */
private long availableBw;
/**
* Creates the new BwProvisioner.
*
* @param bw The total bandwidth capacity from the host that the provisioner can
allocate to VMs.
*
* @pre bw >= 0
* @post $none
*/
public BwProvisioner(long bw) {
setBw(bw);
setAvailableBw(bw);
}
In the above example code, the bandwidth allocation classes form the CloudSim is
demonstrated. From the user stories, the SRI user stories would use this class. For
instance, the SRI3 user story of workload balancing and the SRI5 user story of
network configuration changes use these classes to set bandwidth allocation and
analyse its impact on the energy consumption of the DC.
CloudCoordinator: This class is responsible for monitoring the state of the DC
based on which load shedding decisions can be made. It includes the sensors and
the policies that should be used for the load shedding. The updateDatacenter()
method performs the monitoring of the DC by sending queries to the sensors. The
setDatacenter() abstract method is used for implementing custom protocols and
mechanisms such as multicast, broadcast, peer-to-peer. It can also be used for
simulating cloud services such as Amazon Load-Balancer.

GREENDC D21 – GREENDC DSS Design Document
Project no: 734273 100 31/10/2017
This class corresponds to the user story RM4, where the group leader monitors and
gets periodic reports of the performance of DC energy consumption. This allows
them to perform energy consumption schedule and make load shedding decisions.
Datacenter and DatacenterCharacteristics: This class is responsible for setting the
hardware configurations such as memory, cores, capacity, and storage. Every DC
implements a set of policies for allocating bandwidth, memory, and storage devices
to hosts and VMs and this handled by the Datacenter class. Further, the
DatacenterCharacteristics is responsible for configuring information related to DC
resources.
public Datacenter(
String name,
DatacenterCharacteristics characteristics,
VmAllocationPolicy vmAllocationPolicy,
List<Storage> storageList,
double schedulingInterval) throws Exception {
super(name);
setCharacteristics(characteristics);
setVmAllocationPolicy(vmAllocationPolicy);
setLastProcessTime(0.0);
setStorageList(storageList);
setVmList(new ArrayList<Vm>());
setSchedulingInterval(schedulingInterval);
for (Host host : getCharacteristics().getHostList()) {
host.setDatacenter(this);
}
// If this resource doesn't have any PEs then no useful at all
if (getCharacteristics().getNumberOfPes() == 0) {
throw new Exception(super.getName()
+ " : Error - this entity has no PEs. Therefore, can't process any
Cloudlets.");
}
// stores id of this class
getCharacteristics().setId(super.getId());

GREENDC D21 – GREENDC DSS Design Document
Project no: 734273 101 31/10/2017
}
public DatacenterCharacteristics(
String architecture,
String os,
String vmm,
List<? extends Host> hostList,
double timeZone,
double costPerSec,
double costPerMem,
double costPerStorage,
double costPerBw) {
setId(-1);
setArchitecture(architecture);
setOs(os);
setHostList(hostList);
/*@todo allocationPolicy is not a parameter. It is setting
the attribute to itself, what has not effect. */
setAllocationPolicy(allocationPolicy);
setCostPerSecond(costPerSec);
setTimeZone(0.0);
setVmm(vmm);
setCostPerMem(costPerMem);
setCostPerStorage(costPerStorage);
setCostPerBw(costPerBw);
}
The above example codes illustrate the Datacenter and DatacenterCharacteristics
class. The user can set various configuration parameters using these two classes.
From the user stories, all the user stories from the .Simulation and Real-time
Intervention (SRI) User Stories can be managed from this class. For instance, in
SRI1, the user can analyse parameter changes by configuring them here and running
the simulation. The SRI2 user story of setting VM configuration can also be done
from here. Further, the network configuration by a group member or leader in SRI5
user story can be done from here too.
Other Classes
The other classes in CloudSim include classes such as:
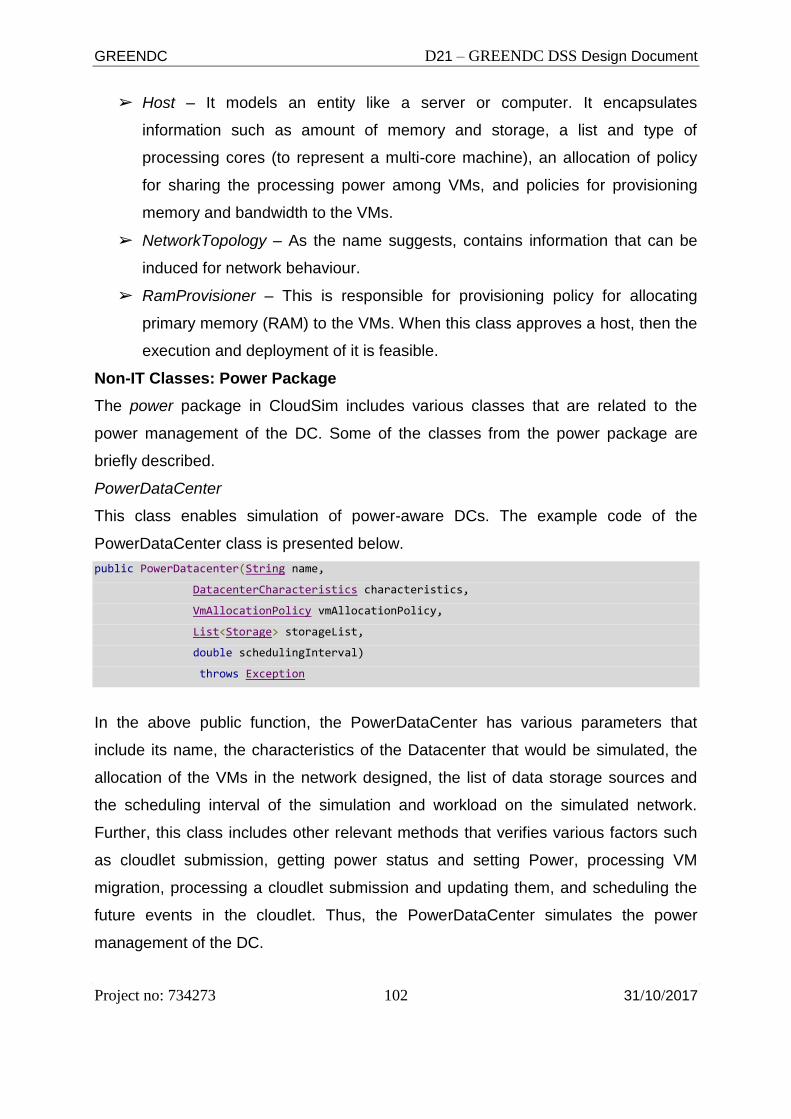
GREENDC D21 – GREENDC DSS Design Document
Project no: 734273 102 31/10/2017
➢ Host – It models an entity like a server or computer. It encapsulates
information such as amount of memory and storage, a list and type of
processing cores (to represent a multi-core machine), an allocation of policy
for sharing the processing power among VMs, and policies for provisioning
memory and bandwidth to the VMs.
➢ NetworkTopology – As the name suggests, contains information that can be
induced for network behaviour.
➢ RamProvisioner – This is responsible for provisioning policy for allocating
primary memory (RAM) to the VMs. When this class approves a host, then the
execution and deployment of it is feasible.
Non-IT Classes: Power Package
The power package in CloudSim includes various classes that are related to the
power management of the DC. Some of the classes from the power package are
briefly described.
PowerDataCenter
This class enables simulation of power-aware DCs. The example code of the
PowerDataCenter class is presented below.
public PowerDatacenter(String name,
DatacenterCharacteristics characteristics,
VmAllocationPolicy vmAllocationPolicy,
List<Storage> storageList,
double schedulingInterval)
throws Exception
In the above public function, the PowerDataCenter has various parameters that
include its name, the characteristics of the Datacenter that would be simulated, the
allocation of the VMs in the network designed, the list of data storage sources and
the scheduling interval of the simulation and workload on the simulated network.
Further, this class includes other relevant methods that verifies various factors such
as cloudlet submission, getting power status and setting Power, processing VM
migration, processing a cloudlet submission and updating them, and scheduling the
future events in the cloudlet. Thus, the PowerDataCenter simulates the power
management of the DC.

GREENDC D21 – GREENDC DSS Design Document
Project no: 734273 103 31/10/2017
PowerHost
This class enables simulation of power aware hosts. This class instantiates the
powerhost and also manages the power model used by the host. The example code
of the PowerHost class is presented below.
public PowerHost(int id,
RamProvisioner ramProvisioner,
BwProvisioner bwProvisioner,
long storage,
List<? extends Pe> peList,
VmScheduler vmScheduler,
PowerModel powerModel)
The PowerHost public function has various parameters such as the id of the host, the
RAM and bandwidth allocation of the hosts, the storage associated to the host, the
processing elements (cores) associated with the host, and the scheduling of the host
VM and the power model used by it. This class manages the power consumption of a
host as a single unit. This class also inherits data from other methods that are
associated with aspects such as getting the power consumption by a PE, maximum
power consumed by the host, energy consumption during the utilization, getting and
setting the power model. Thus, all the power management decisions related to a host
are managed by the PowerHost class.
PowerVmAllocationPolicyAbstract
The above class performs the power allocation policy for a VM. It is a simple class
that instantiates the power allocation policy for a VM. The class is represented by the
public function below.
public PowerVmAllocationPolicyAbstract(List<? extends Host> list)
The only parameter in this function is the host list. According to the list of host
provided as the parameter, the power allocation policy is configured. This function
calls some important methods that process the allocation policy. The methods
include allocating host for a given VM along with its allocation policy, finding host for
the VM, getting the host that is executed by the given VM, and deallocation of the

GREENDC D21 – GREENDC DSS Design Document
Project no: 734273 104 31/10/2017
host for the VM. The allocation policy is abstract in this function, however, other
classes allocate policies such as QuartileRange or LocalRegression.
6.4.3 User Interaction with CloudSim
The flowchart presented below illustrates the user journey in their interaction with the
ClooudSim simulator. A typical user interaction with CloudSim can be described with
the below main steps (Figure 46).
a. The first step is the user selects a scenario to simulate. The scenario can be
pre-designed and provided in the simulator
b. The next step is when the user designs the DC network. This step would
include addition of components such as VMs, routers, switches, softwares,
applications and the sharing of resources within the network
c. The third step is an important one as it involves configuring the input and
output parameters to the DC network. The user here specifies the workload on
each VM, rank the importance of the VM in the network, the minimum or
maximum bandwidth to be allocated and various other such parameters that
defines the functioning of the DC
d. The final steps involve running the simulator. The output of the simulator can
be displayed on a web application where the user can see the running of the
DC, current status, and its output.
e. Finally, the user can reconfigure the parameters to define new scenarios for
the given DC simulation and test the outputs of its simulation

GREENDC D21 – GREENDC DSS Design Document
Project no: 734273 105 31/10/2017
Figure 46. User Interaction with CouldSim
6.4.4 Power Consumption Models
The CloudSim provides various power consumption models. The power models listed
in the CloudSim repository include linear, cubic, square, square root, models based
on SPEC power benchmarks, and models designed for different models of IBM
servers and HP machines.
The consumption of power by a VM configured in a DC depends on the power model
chosen. For instance, if the VM power consumption model is configured to be a linear
model, then the power consumption can be calculated as:
GREENDC D21 – GREENDC DSS Design Document
Project no: 734273 106 31/10/2017
where, 𝑃𝑐 is the power consumption
𝑃𝑚𝑖𝑛 is the minimum power consumed at idle state
𝑃𝑚𝑎𝑥 is the maximum power consumption at peak load
𝑈𝑡𝑖𝑙𝑖𝑧𝑎𝑡𝑖𝑜𝑛 is between 0 and 1 and is the utilization of the VM at a given time
instance.
Using the above equation, the expected power consumed by the VM can be
computed. Different power models can be used based on the requirements of the DC
and the components used. The relevant energy consumption can be calculated using
the associated power consumption equations of the chosen model.
6.4.5 Workload Distribution
In DC environments, the workload distribution may change dynamically according to
the requirements of the application and the deployment methods. CloudSim supports
dynamic modelling and distribution of workloads via several components that are
provided in its framework. In particular, the cloudlet entity has extensions such as
Utilization model that provides the user methods and variables that can be
configured at the time of the deployment by the user to meet the resource and VM
requirements. The Utilization model is an abstract class in the CloudSim framework
that can be used to implement the workload distribution according to the application
requirements. For instance, the CloudSim framework provides a stochastic process
based workload distribution pattern that can be used to simulate the workload
distribution stochastically. Similarly, the user can design the utilization model
according to the application requirements.

GREENDC D21 – GREENDC DSS Design Document
Project no: 734273 107 31/10/2017
6.4.6 User Activity Diagrams for Simulation and Real-time Intervention
User Stories
SR1 (Analyse parameter changes). As a Group Leader, I want to run a simulation
to learn the impact of changing the parameters (such as cooling temperature,
workload, humidity, etc.) in order to find an optimal option to minimise energy
consumption.
Figure 47. User Activity Diagram – Analyse Parameter Change using CloudSim

GREENDC D21 – GREENDC DSS Design Document
Project no: 734273 108 31/10/2017
SRI2 (Analyse VMs configuration). As a Group Leader or Member, I want to run
the simulation to learn the impact of shutting down VMs in order to find an optimal
option to minimise energy consumption.
Figure 48. User Activity Diagram – Analyse VMs Configuration using CloudSim
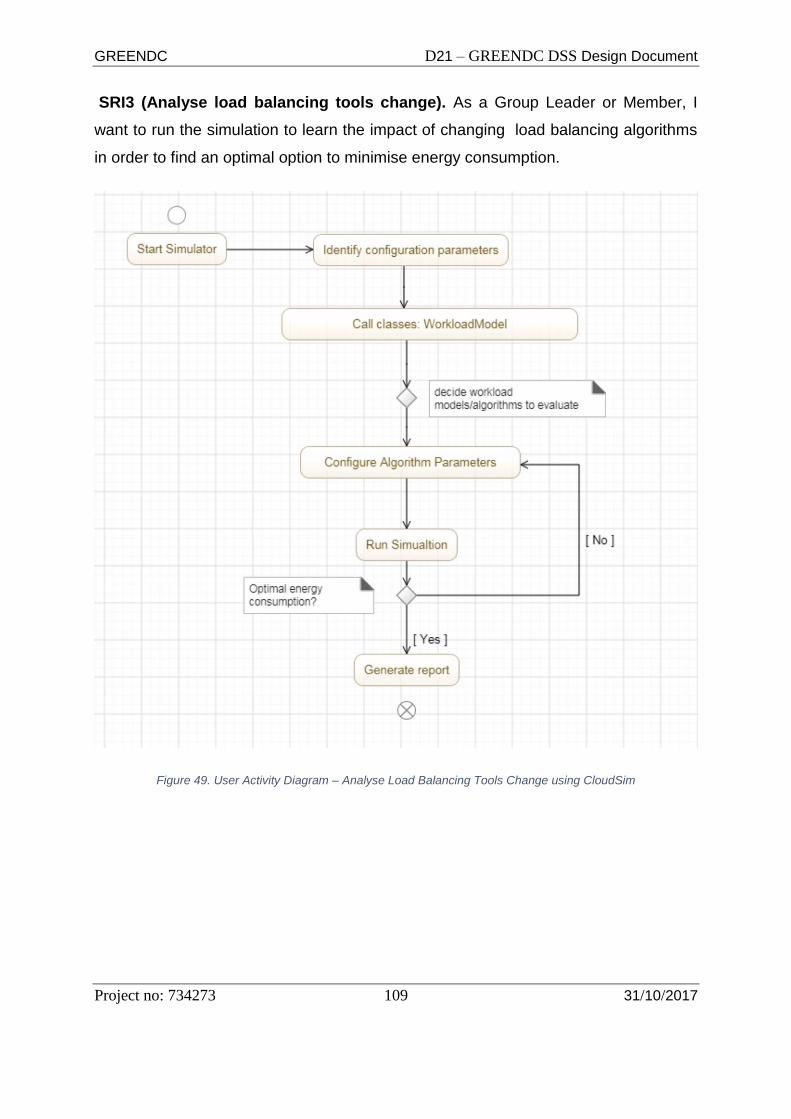
GREENDC D21 – GREENDC DSS Design Document
Project no: 734273 109 31/10/2017
SRI3 (Analyse load balancing tools change). As a Group Leader or Member, I
want to run the simulation to learn the impact of changing load balancing algorithms
in order to find an optimal option to minimise energy consumption.
Figure 49. User Activity Diagram – Analyse Load Balancing Tools Change using CloudSim

GREENDC D21 – GREENDC DSS Design Document
Project no: 734273 110 31/10/2017
SRI4 (Analyse workloads rescheduling). As a Group Leader or Member, I want to
run the simulation for rescheduling of workloads (postponing) energy consumption in
order to find an optimal option to minimise energy consumption.
Figure 50. User Activity Diagram – Analyse Workloads Rescheduling using CloudSim
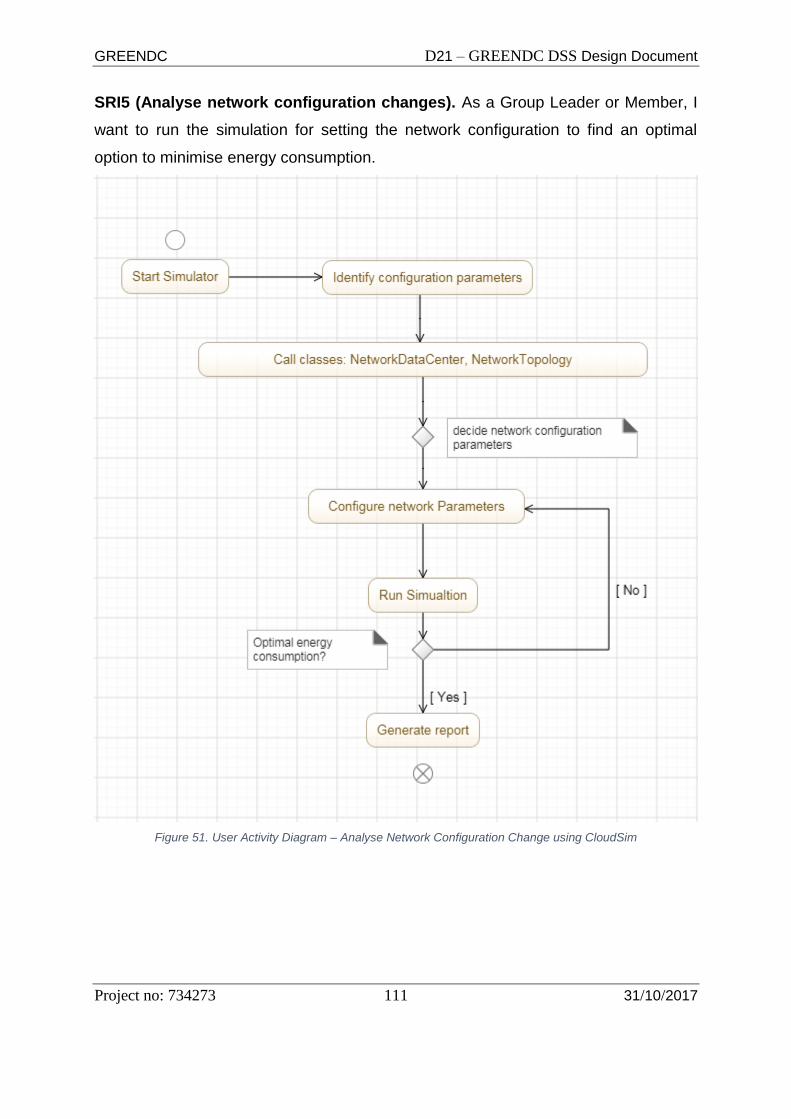
GREENDC D21 – GREENDC DSS Design Document
Project no: 734273 111 31/10/2017
SRI5 (Analyse network configuration changes). As a Group Leader or Member, I
want to run the simulation for setting the network configuration to find an optimal
option to minimise energy consumption.
Figure 51. User Activity Diagram – Analyse Network Configuration Change using CloudSim

GREENDC D21 – GREENDC DSS Design Document
Project no: 734273 112 31/10/2017
7. User Interface - UI
7.1 Basic Interface Principles
The interface of the DSS platform solution is based on those days contemporary
WEB standards for user usability, device independency and lightweight
programming.
The main intention of the UI designers are to keep its simplicity and consistency,
delivering maximum possible results to end-user, with minimum interface
interactions.
7.2 User Interface Structure
Overall look and common elements - ver. 1
1. Login form - see it online
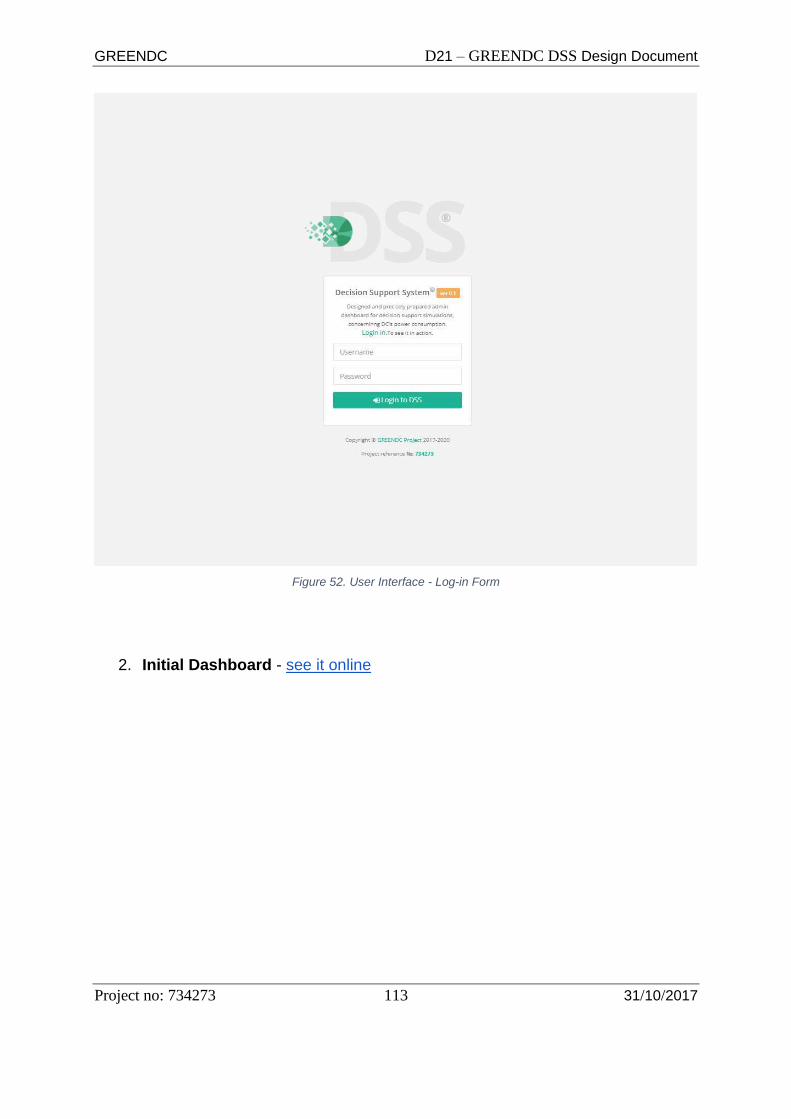
GREENDC D21 – GREENDC DSS Design Document
Project no: 734273 113 31/10/2017
Figure 52. User Interface - Log-in Form
2. Initial Dashboard - see it online
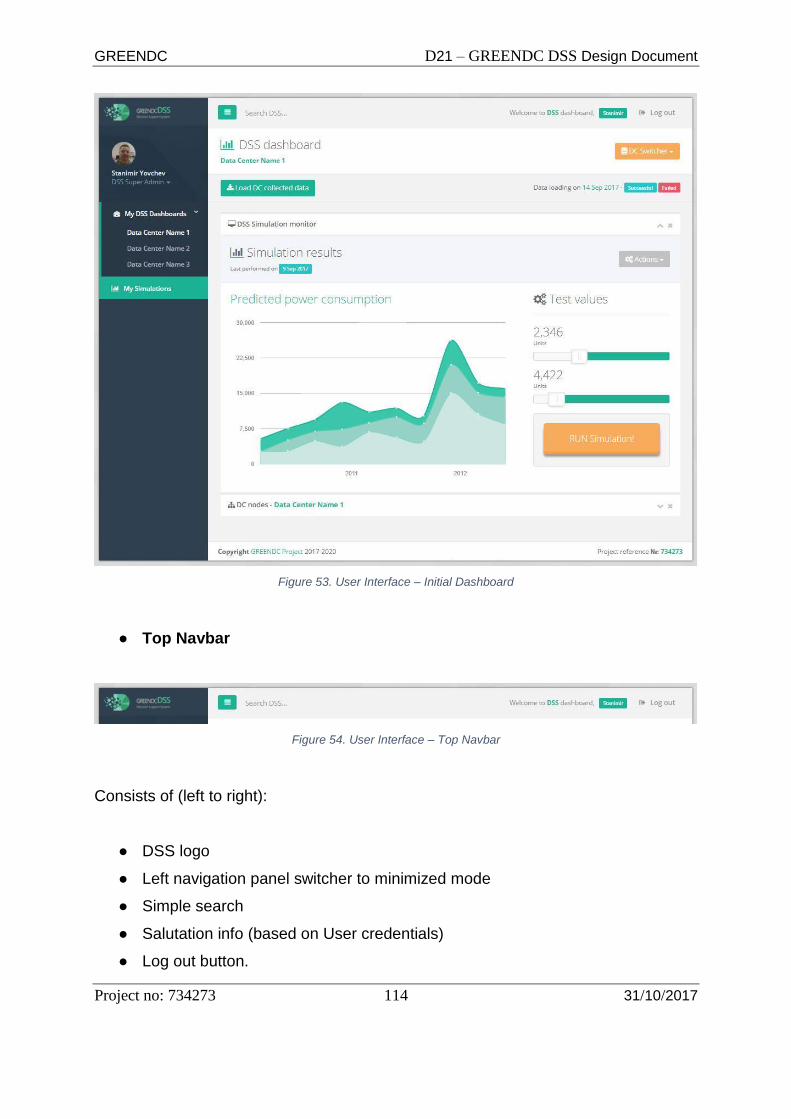
GREENDC D21 – GREENDC DSS Design Document
Project no: 734273 114 31/10/2017
Figure 53. User Interface – Initial Dashboard
● Top Navbar
Figure 54. User Interface – Top Navbar
Consists of (left to right):
● DSS logo
● Left navigation panel switcher to minimized mode
● Simple search
● Salutation info (based on User credentials)
● Log out button.
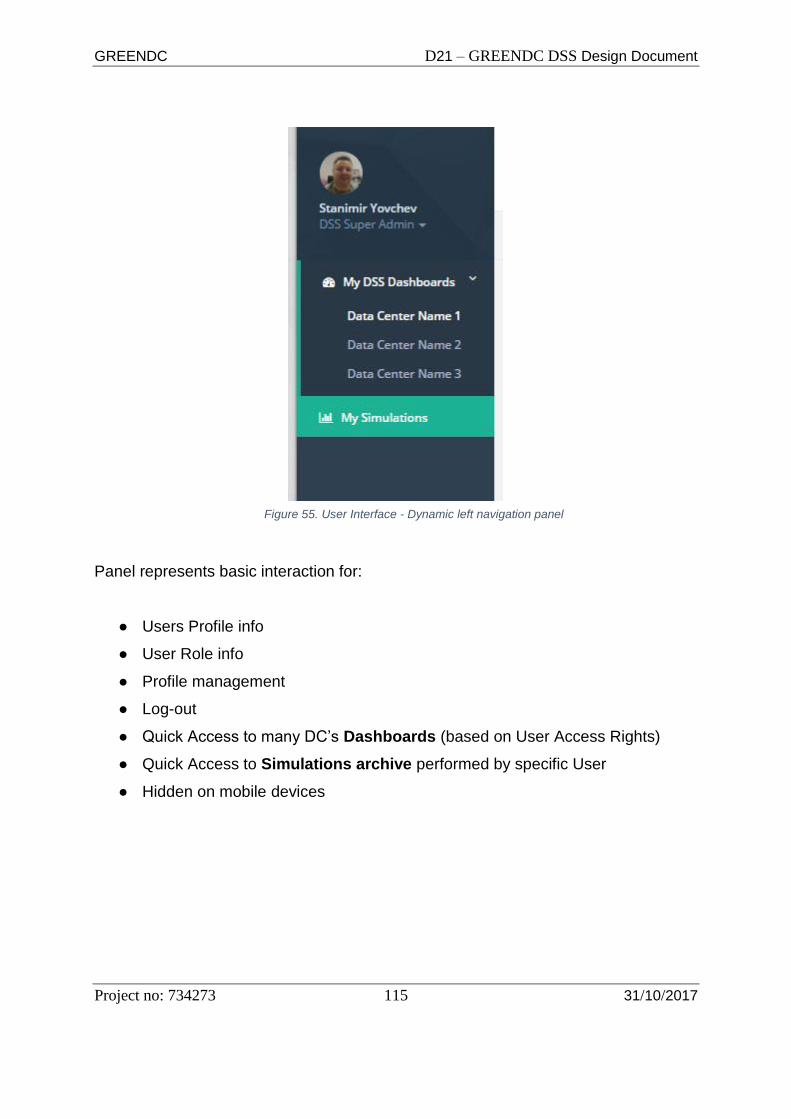
GREENDC D21 – GREENDC DSS Design Document
Project no: 734273 115 31/10/2017
Panel represents basic interaction for:
● Users Profile info
● User Role info
● Profile management
● Log-out
● Quick Access to many DC’s Dashboards (based on User Access Rights)
● Quick Access to Simulations archive performed by specific User
● Hidden on mobile devices
Figure 55. User Interface - Dynamic left navigation panel
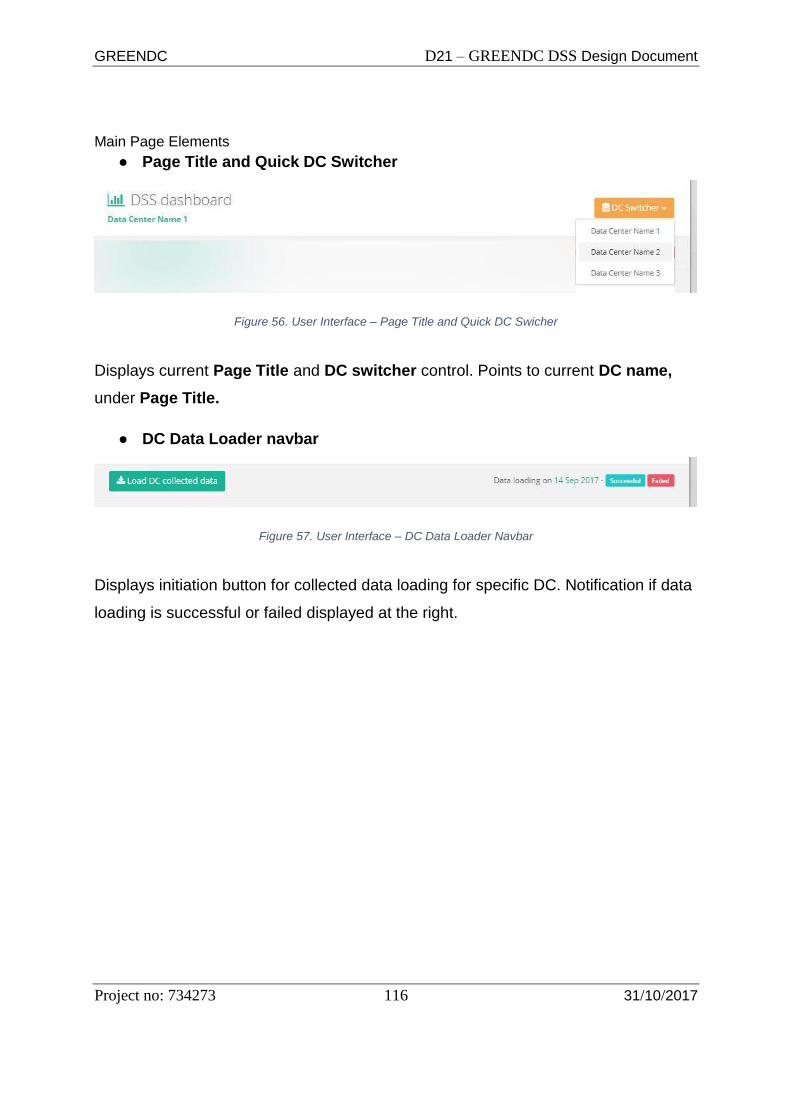
GREENDC D21 – GREENDC DSS Design Document
Project no: 734273 116 31/10/2017
Main Page Elements
● Page Title and Quick DC Switcher
Figure 56. User Interface – Page Title and Quick DC Swicher
Displays current Page Title and DC switcher control. Points to current DC name,
under Page Title.
● DC Data Loader navbar
Figure 57. User Interface – DC Data Loader Navbar
Displays initiation button for collected data loading for specific DC. Notification if data
loading is successful or failed displayed at the right.

GREENDC D21 – GREENDC DSS Design Document
Project no: 734273 117 31/10/2017
DSS Simulation Monitor panel
Figure 58. User Interface – DSS Simulation Monitor Panel
1. Displays information about last performed simulation by date of
performance (if any), otherwise panel appears closed.
2. Visualizes Predicted power consumption based on loaded data.
3. On the right section of the DSS Simulation Monitor the interface
brings tools for loaded data changing values (unlimited number), based
on certain DSS mathematical model requirements for the exact
scenario.
4. Displays RUN Simulation! button to initiate simulation, after changing
the Test values.
5. Displays new graphical results for the performed simulation.
6. Bring to user Actions drop-down selector at the right of the Simulation
results title for Save, Load, Export and Reset actions for the
simulation.
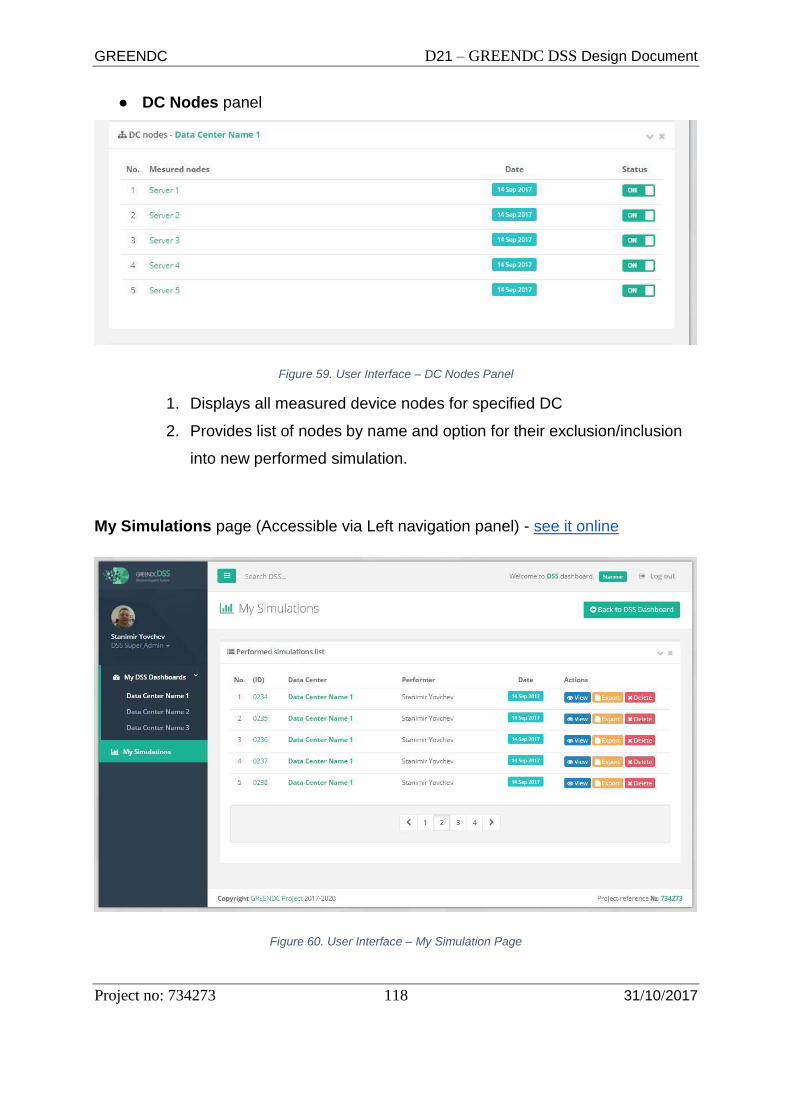
GREENDC D21 – GREENDC DSS Design Document
Project no: 734273 118 31/10/2017
● DC Nodes panel
Figure 59. User Interface – DC Nodes Panel
1. Displays all measured device nodes for specified DC
2. Provides list of nodes by name and option for their exclusion/inclusion
into new performed simulation.
My Simulations page (Accessible via Left navigation panel) - see it online
Figure 60. User Interface – My Simulation Page

GREENDC D21 – GREENDC DSS Design Document
Project no: 734273 119 31/10/2017
1. Displays list of performed simulations by Number, (ID), Performer and date in
standard Data Table.
2. Actions table column provides buttons for performing View (Using DSS
Simulation Monitor), Export and Delete actions.
3. Pagination functionality is provided at the bottom for managing long lists of
records.
7.3. Serving User Stories and Scenarios
Simplified UI interpretation
In terms of “User interface - UI”, the following schema represents the logical
interaction workflow of the DSS UI, concerning User Scenarios and Stories.
Figure 61. User Interaction – Getting Useful Results in 3 Easy Steps

GREENDC D21 – GREENDC DSS Design Document
Project no: 734273 120 31/10/2017
Common example: Getting Useful Results in 3 easy steps (user
interactions)
Step 1. Scenario Chooser - see it online
After successful DC data loading from DC Data Warehouse (DC DW), user should
perform his first interaction with DSS, using simple web control to choose the
scenario/direction of future steps/interactions.
Figure 62. User Interface – Scenario Chooser
Step 2. Scenario option/story selection
The User can make himself familiar with each option details, using More details
button on the right of each option/story. After selecting chosen option the Apply
Scenario button became enabled, instead of disabled.
After performing the Apply Scenario interaction, as a result, the particular Scenario
DASHBOARD appears, based on chosen Scenario + selected User story.

GREENDC D21 – GREENDC DSS Design Document
Project no: 734273 121 31/10/2017
Initial graphical results are displayed, based on DC data, loaded from DC Data
Warehouse (DC DW).
Each selected User Story, uses his own Mathematical Model (MM), as a template
for graphical interpretation of loaded DC data.
Sample Result - Scenario DASHBOARD - see it online
Figure 63. User Interface – Scenario Dashboard
Step 3. Working with test values
Using standard Web controls (sliders, switches, include/exclude controls, etc.), user
can interact with these tools to change available test values and to perform unlimited
number of simulations, based on (MM) for the chosen Scenario + selected User
Story.

GREENDC D21 – GREENDC DSS Design Document
Project no: 734273 122 31/10/2017
Include/Exclude Measured nodes
DC Measured nodes panel under the Scenario dashboard is attended to support the User
with additional functionality. - see it online
Figure 64. DC Measured Nodes Panel
Using DC Measured nodes panel, the User is able to simulate exclusion of a
particular equipment by type, not to be included in performed simulation.
Proceeding with Visualized results
After successfully performed Simulation, user is able
to use “Actions” drop-down menu to proceed with
simulation results further in several different ways:
Figure 65. User Interface – Actions

GREENDC D21 – GREENDC DSS Design Document
Project no: 734273 123 31/10/2017
● Save simulation results
● Load saved simulation results
● Export simulation results (PDF)
● Reset simulation to initial loaded data
7.4. General DASHBOARDS for user scenarios
1. Energy Consumption Forecasting DASHBOARD - see it online
Figure 66. 1. Energy Consumption Forecasting DASHBOARD
Dashboard represents all user tools needed to perform Forecasting scenario,
based on already collected data.

GREENDC D21 – GREENDC DSS Design Document
Project no: 734273 124 31/10/2017
Graphical visualization of the Power consumption is generated by chosen types of
Input parameters, based on what user needs to estimate (in this case: Power
consumption of server).
Using Settings panel on the right, user could perform different combinations of
Included data, Mathematical models, Time period and Time step, to visualize
different estimation results.
ESTIMATION Output! button initiates the calculations, after choices have been
made.
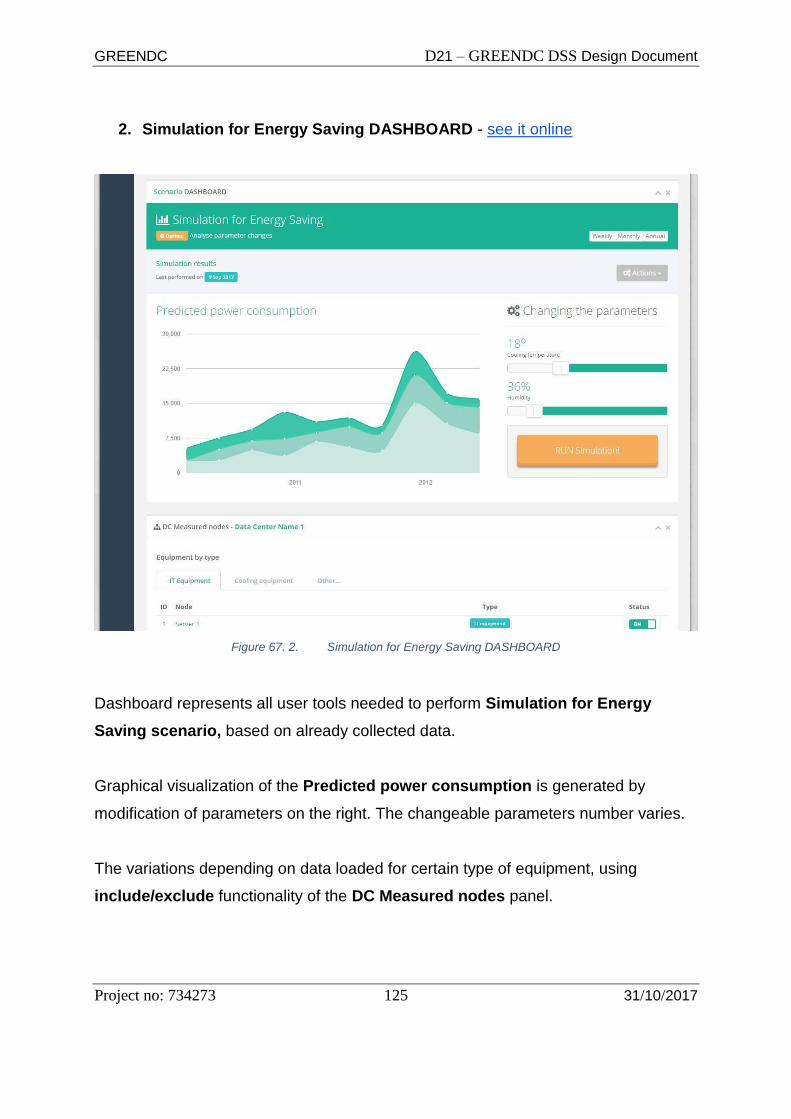
GREENDC D21 – GREENDC DSS Design Document
Project no: 734273 125 31/10/2017
2. Simulation for Energy Saving DASHBOARD - see it online
Figure 67. 2. Simulation for Energy Saving DASHBOARD
Dashboard represents all user tools needed to perform Simulation for Energy
Saving scenario, based on already collected data.
Graphical visualization of the Predicted power consumption is generated by
modification of parameters on the right. The changeable parameters number varies.
The variations depending on data loaded for certain type of equipment, using
include/exclude functionality of the DC Measured nodes panel.

GREENDC D21 – GREENDC DSS Design Document
Project no: 734273 126 31/10/2017
RUN Simulation! button initiates the calculations, after choices and modifications
have been made.
User experience configuration
UI configurator could be reached at the top-right corner of the screen via its
control button.
It allows Users to set the UI parameters for
individual user experience, such as:
● Collapsing menu
● Fixing sidebar
● Top navbar ON/OFF
● Switching from Boxed layout to Full
Screen
● Fixing the footer
● Changing Theme color skins
Figure 68. User Interface – UX configuration

GREENDC D21 – GREENDC DSS Design Document
Project no: 734273 127 31/10/2017
8. Conclusion with Implementation Plan
The purpose of this deliverable was to suggest the blueprint for actual development
of GREENDC DSS within the aim of the work package two. Based on the result of
DSS requirement collection from the work package one, this deliverable designs the
GREENDC DSS in all its aspects to fulfil the minimum functional and technical
requirements for the implementation based on user scenarios that have been
selected and sorted out through the requirement specification process.
The extended findings from D1.1, system requirement definition and user stories
gave us the critical ideas to design the overall architecture, which has three-tier
architecture including data, business logic and user interface layer. The subsection
below presents the summary of the works in this deliverable and implementation plan
for each main layer.
8.1. Data Layer
Data layer has its two sub-layer – data collection and data normalisation layer. Data
collection layer will collect the data from various devices in the data centre as well as
from the third-party software such as Zabbix. Collected data will be normalised so
that the data can be published in to an API or SOA object.
8.2. Math Model Layer
Math model layer will be the core of forecasting and optimisation of energy
consumption. Neural network and/or multiple regression model will be used for the
forecasting process. The optimisation of energy consumption, which is the main
objective of GREENDC DSS tool, will be obtained by resolving sophisticated
objective function regarding cost and profit of data centre.
Mathematical methods will be developed in MATLAB environment. Math Layer will
connect the other layers with python programming language. The key point in the
software development process is the software quality. The main goal of the Software
quality management is to reduce the risks such as the misuse of code by client,
GREENDC D21 – GREENDC DSS Design Document
Project no: 734273 128 31/10/2017
memory leakage, logical errors that cannot be detected by compiler etc. The
requirements of the qualified software are;
· Minimum error
· To satisfy user requirements
· To fix errors as soon as possible
Errors like Syntax or logic error must be avoided in programming. Error handling is a
process to make the program well-written while ensuring that unexpected errors are
eliminated properly. By means of "error handling", unexpected situations are caught
in run time and necessary actions are taken. Due to unpredictable problems
mentioned above, error handling will be taken into account in the DSS code.
Before development process of the software, User requirements should be
determined. It is controlled gradually whether these requirements are satisfied in the
development process. It is necessary to construct a tractable, predictable and easy
understandable code in order to fix errors quickly.
8.3. Business Logic Layer
Business logic layer will deal with the services required by the components of the
user interface layer. Data centre energy consumption monitoring and forecasting will
be the main tasks that will be sorted out by this layer and DC simulation component
will also implemented to allow data centre managers to understand the impacts of
different strategies for energy-efficient data centre operations.
DC Simulator will be implemented using CloudSim
(http://www.cloudbus.org/cloudsim/). CloudSim is a generalized, and extensible
simulation framework that enables seamless modeling, simulation, and
experimentation of emerging Cloud computing infrastructures and application
services. It allows researchers and industry-based developers can focus on specific
system design issues that they want to investigate, without getting concerned about
the low level details related to Cloud-based infrastructures and services.

GREENDC D21 – GREENDC DSS Design Document
Project no: 734273 129 31/10/2017
CloudSim is selected in the GREENDC project as it provides meta data model and
architecture for representing the major components of DCs. It has also been widely
used in the literature for simulating DCs.
Communication between User Interface layer and Business logic layer will use
RestfulAPI and architecture diagram to be included
Outline to discuss:
● RestfulAPI endpoints
● RestfulAPI request/response payload structure
● Status codes and message conventions to declare API content
● Decide data types to generate screens, tables or other objects(graphs,
streams, etc.)
8.4. User Interface
User interface will be realised based on those days’ contemporary WEB standards
for user usability, device independency and lightweight programming. The main
intention of the UI design in GREENDC DSS are to keep its simplicity and
consistency, delivering maximum possible results to end-user, with minimum
interface interactions.
The User Interface Layer will be integrated, using the following technical principles
for implementation of the DSS:
• Usability standards
o Powered by Bootstrap 3.0 web interface library
o Standardized User web controls
o Fully customizable additional User web controls
• Device Independency
o Responsive (screen resolution independent) User views layout
o Dynamical Interaction Panels
o Maximum Browser compatibility

GREENDC D21 – GREENDC DSS Design Document
Project no: 734273 130 31/10/2017
• Lightweight Programming Approach
The technology used, consists of three main web standards:
o HTML5
o CSS 3
o Javascript
These standards allowing the interface developers to deploy any needed additional
interactivity quickly and independently to main business logic.
8.5. Conclusion
With this deliverable, we reached the first small iteration of implementation by
drawing big picture for the real implementation of GREENDC DSS and this will be the
successful starting point to future implementation of the DSS. Though there will be an
evaluation phase for the implemented outcomes of DSS and new improvement
points will be coming out, the proposed architecture in this deliverable will be a
concrete skeleton that enable this project to anchor the right direction for defined
project objectives.

GREENDC D21 – GREENDC DSS Design Document
Project no: 734273 131 31/10/2017
APPENDIX
APPENDIX A : REGISTRATION MAPS(DCIM)
● UPS
Name Category Data Type Value/Unit
UPS Status Status BOOLEAN 1
Load is being powered from
battery
Status BOOLEAN 1
Low-Battery Status BOOLEAN 1
Bypass Status BOOLEAN 1
Self-Test Status BOOLEAN 1
Load not Powered Status BOOLEAN 1
Power Module Failure Status BOOLEAN 1
Battery System Failure Status BOOLEAN 1
Intelligence Module Status BOOLEAN 1
Static Switch Failure Status BOOLEAN 1
Power Supply Unit Failure Status BOOLEAN 1
Informational Alarm Present Status BOOLEAN 1
Warning Alarm Present Status BOOLEAN 1
Critical Alarm Present Status BOOLEAN 1

GREENDC D21 – GREENDC DSS Design Document
Project no: 734273 132 31/10/2017
Lost Local Network
Management Interface
Status BOOLEAN 1
UPS Serial Number Text ASCII
UPS Firmware Version Text ASCII
Time On Battery Values UINT32 Seconds
Runtime Remaining Values UINT32 Seconds
Estimated charge time Values UINT32 Seconds
Estimated charge % Values UINT32 %
Battery (+) Voltage Values UINT16 VDC
Battery (-) Voltage Values UINT16 VDC
Battery (+) Current Values SINT16 amps
Battery (-) Current Values SINT16 amps
Total time on battery Values UINT32 Seconds
Total number of times on
battery
Values UINT16 counts
APC Battery Breaker Status
/User supplied battery
Breaker Status(mutually
exclusive)
Status BOOLEAN 0=Open, 1=
ClosedBit 0 to
Bit 7 represent
Frame 0 to 7
respectivley.Fo
r User supplied

GREENDC D21 – GREENDC DSS Design Document
Project no: 734273 133 31/10/2017
battery bit 0
Battery System Temperature Values UINT16 °C
Battery Power Values INT16 kW
Available Amp Hours Values UINT16 Amp Hours
Frequency (input) Values UINT16 Hz
Voltage L1-2 (input) Values UINT16 Vms
Voltage L2-3 (input) Values UINT16 Vms
Voltage L3-1 (input) Values UINT16 Vms
Current L1 (input) Values UINT16 amps
Current L2 (input) Values UINT16 amps
Current L3 (input) Values UINT16 amps
Active power L1 (input) Values UINT16 kW
Active power L2 (input) Values UINT16 kW
Active power L3 (input) Values UINT16 kW

GREENDC D21 – GREENDC DSS Design Document
Project no: 734273 134 31/10/2017
Apparent power L1 (input) Values UINT16 kVA
Apparent power L2 (input) Values UINT16 kVA
Apparent power L3 (input) Values UINT16 kVA
Total Active Power (input) Values UINT16 kW
Total Apparent power (input) Values UINT16 kVA
Current L1 (parallel input) Values UINT16 amps
Current L2 (parallel input) Values UINT16 amps
Current L3 (parallel input) Values UINT16 amps
Frequency (bypass) Values UINT16 Hz
Voltage L1-2 (bypass) Values UINT16 Vms
Voltage L2-3 (bypass) Values UINT16 Vms
Voltage L3-1 (bypass) Values UINT16 Vms
Current L1 (bypass) Values UINT16 amps
Current L2 (bypass) Values UINT16 amps
Current L3 (bypass) Values UINT16 amps
Active power L1 (bypass) Values UINT16 kW
Active power L2 (bypass) Values UINT16 kW
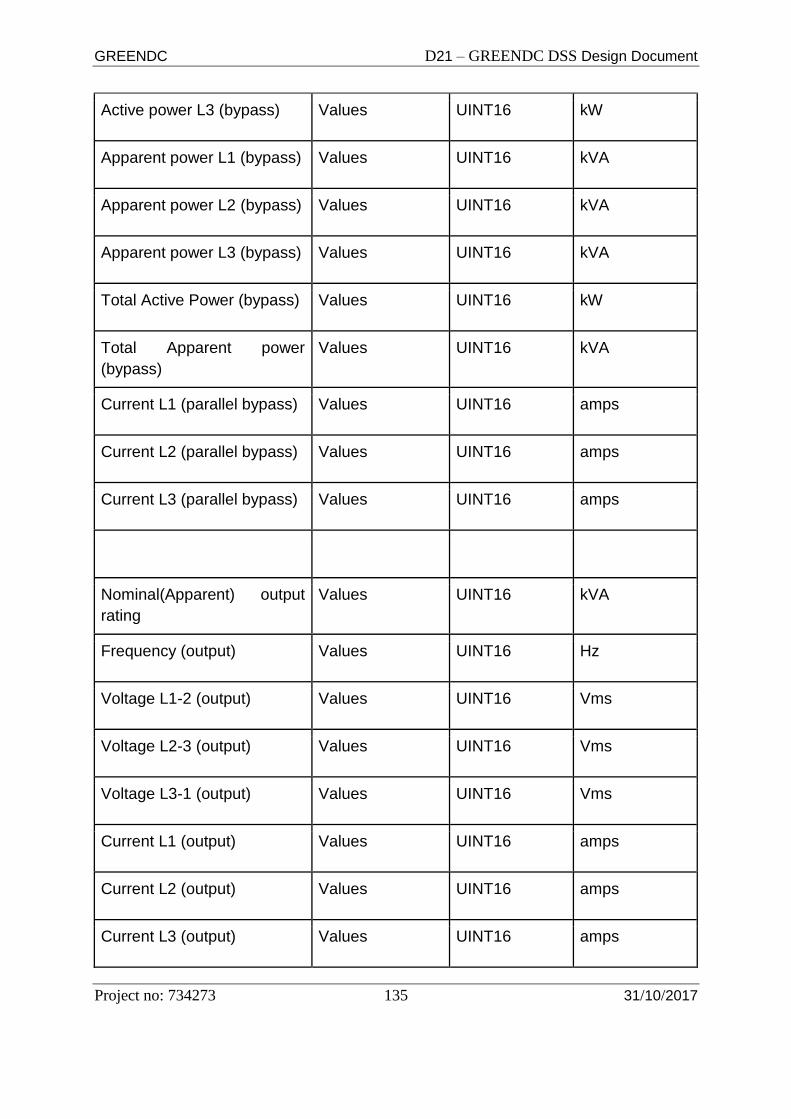
GREENDC D21 – GREENDC DSS Design Document
Project no: 734273 135 31/10/2017
Active power L3 (bypass) Values UINT16 kW
Apparent power L1 (bypass) Values UINT16 kVA
Apparent power L2 (bypass) Values UINT16 kVA
Apparent power L3 (bypass) Values UINT16 kVA
Total Active Power (bypass) Values UINT16 kW
Total Apparent power
(bypass)
Values UINT16 kVA
Current L1 (parallel bypass) Values UINT16 amps
Current L2 (parallel bypass) Values UINT16 amps
Current L3 (parallel bypass) Values UINT16 amps
Nominal(Apparent) output
rating
Values UINT16 kVA
Frequency (output) Values UINT16 Hz
Voltage L1-2 (output) Values UINT16 Vms
Voltage L2-3 (output) Values UINT16 Vms
Voltage L3-1 (output) Values UINT16 Vms
Current L1 (output) Values UINT16 amps
Current L2 (output) Values UINT16 amps
Current L3 (output) Values UINT16 amps

GREENDC D21 – GREENDC DSS Design Document
Project no: 734273 136 31/10/2017
Peak Current L1 (output) Values UINT32 amps
Peak Current L2 (output) Values UINT32 amps
Peak Current L3 (output) Values UINT32 amps
Active power L1 (output) Values UINT16 kW
Active power L2 (output) Values UINT16 kW
Active power L3 (output) Values UINT16 kW
Apparent power L1 (output) Values UINT16 kVA
Apparent power L2 (output) Values UINT16 kVA
Apparent power L3 (output) Values UINT16 kVA
% Load L1 Values UINT16 %
% Load L2 Values UINT16 %
% Load L3 Values UINT16 %
Total Active Power (output) Values UINT16 kW
Total Apparent power
(output)
Values UINT16 kVA
Total Percent Load Values UINT16 %
Power factor L1 (output) Values UINT16 power factor
Power factor L2 (output) Values UINT16 power factor
Power factor L3 (output) Values UINT16 power factor

GREENDC D21 – GREENDC DSS Design Document
Project no: 734273 137 31/10/2017
Current crest factor L1
(output)
Values UINT16 crest factor
Current crest factor L1
(output)
Values UINT16 crest factor
Current crest factor L1
(output)
Values UINT16 crest factor
Parallel System Output
CurrentAC L1
Values UINT16 amps
Parallel System Output
CurrentAC L2
Values UINT16 amps
Parallel System Output
CurrentAC L3
Values UINT16 amps
Parallel System Output
Active Power L1
Values UINT16 kW
Parallel System Output
Active Power L2
Values UINT16 kW
Parallel System Output
Active Power L3
Values UINT16 kW
Parallel System Output
Apparent Power L1
Values UINT16 kVA
Parallel System Output
Apparent Power L2
Values UINT16 kVA
Parallel System Output
Apparent Power L3
Values UINT16 kVA
ParallelSystem Output %
Load L1
Values UINT16 %
ParallelSystem Output %
Load L2
Values UINT16 %
ParallelSystem Output %
Load L3
Values UINT16 %

GREENDC D21 – GREENDC DSS Design Document
Project no: 734273 138 31/10/2017
Parallel System Output
Active Power
Values UINT16 kW
Parallel System Output
Apparent Power
Values UINT16 kVA
ParallelSystem Output %
Load
Values UINT16 %
Energy Meter kWh Values UINT32 kWh
UPS Installation Load %
(Standalone)
Values UINT16 %
UPS Installation Load %
(Parallel )
Values UINT16 %
Ambient temperature Values UINT16 °C
Number of Power Modules Values UINT16 Unitless
Number of Battery Monitor
Boards
Values UINT16 Unitless
Number of Battery Breaker
Motors
Values UINT16 Unitless
Number of Battery Modules Values UINT16 Unitless
Number of Battery
Enclosures
Values UINT16 Unitless
Number of PSUs Values UINT16 Unitless
● PDU

GREENDC D21 – GREENDC DSS Design Document
Project no: 734273 139 31/10/2017
Name Category Data Type Value/Unit
DEVICE_TYPE Status ENUM 10
OVERALL_STATUS Status ENUM 0
COMM_STATUS Status ENUM 0
MODULE_N_SERIAL_NUMBER Status ASCII N/A
MODULE_N_DATE_OF_MANUF
ACTURE
Status ASCII N/A
MODULE_N_MODEL_NUMBER Status ASCII N/A
MODULE_X_BREAKER_Y_RATI
NG
Values INTEGER Amps
MODULE_X_BREAKER_Y_CUR
RENT
Values INTEGER A(Tenths)
MODULE_X_BREAKER_Y_POW
ER
Values INTEGER kW(Hundredths
)
MODULE_X_BREAKER_Y_PER
CENT_CURRENT
Values INTEGER %(Tenths)
MODULE_X_BREAKER_Y_kWh
_ENERGY
Values LONG %(Tenths)
MODULE_X_BREAKER_Y_THR
ESHOLD_MIN
Values INTEGER %
MODULE_X_BREAKER_Y_THR
ESHOLD_LOW
Values INTEGER %
MODULE_X_BREAKER_Y_THR
ESHOLD_HIGH
Values INTEGER %
MODULE_X_BREAKER_Y_THR
ESHOLD_MAX
Values INTEGER %
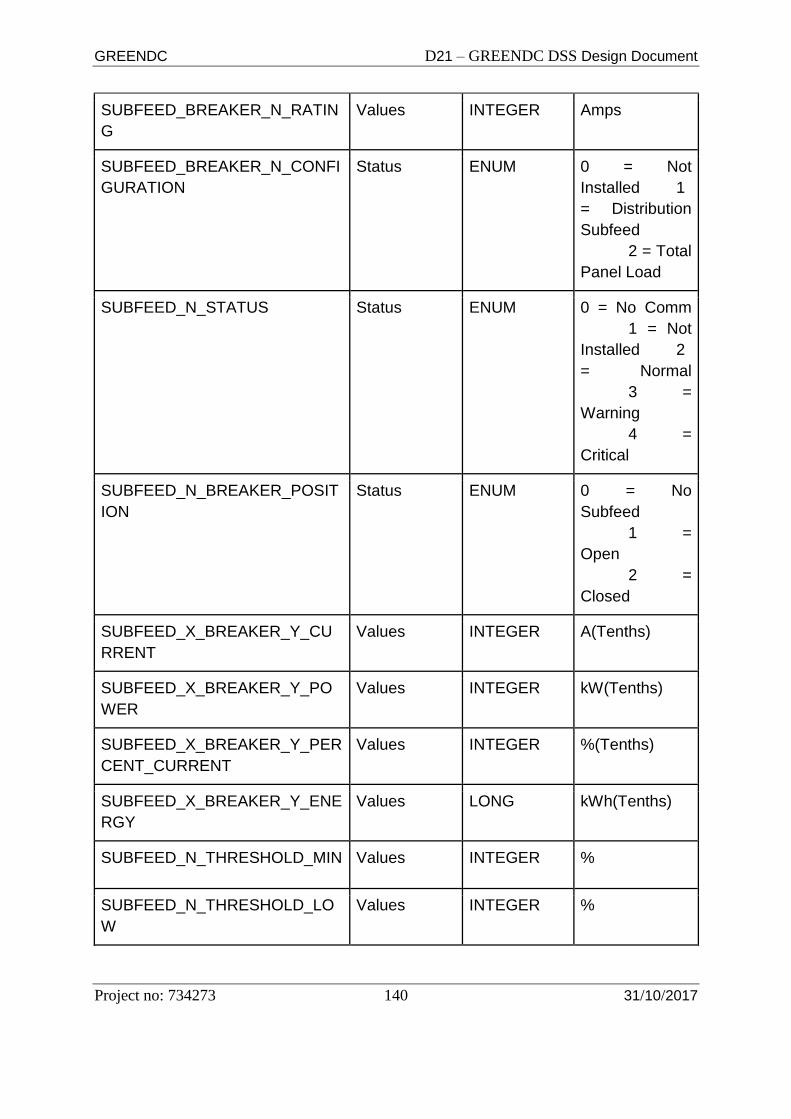
GREENDC D21 – GREENDC DSS Design Document
Project no: 734273 140 31/10/2017
SUBFEED_BREAKER_N_RATIN
G
Values INTEGER Amps
SUBFEED_BREAKER_N_CONFI
GURATION
Status ENUM 0 = Not
Installed 1
= Distribution
Subfeed
2 = Total
Panel Load
SUBFEED_N_STATUS Status ENUM 0 = No Comm
1 = Not
Installed 2
= Normal
3 =
Warning
4 =
Critical
SUBFEED_N_BREAKER_POSIT
ION
Status ENUM 0 = No
Subfeed
1 =
Open
2 =
Closed
SUBFEED_X_BREAKER_Y_CU
RRENT
Values INTEGER A(Tenths)
SUBFEED_X_BREAKER_Y_PO
WER
Values INTEGER kW(Tenths)
SUBFEED_X_BREAKER_Y_PER
CENT_CURRENT
Values INTEGER %(Tenths)
SUBFEED_X_BREAKER_Y_ENE
RGY
Values LONG kWh(Tenths)
SUBFEED_N_THRESHOLD_MIN Values INTEGER %
SUBFEED_N_THRESHOLD_LO
W
Values INTEGER %

GREENDC D21 – GREENDC DSS Design Document
Project no: 734273 141 31/10/2017
SUBFEED_N_THRESHOLD_HIG
H
Values INTEGER %
SUBFEED_N_THRESHOLD_MA
X
Values INTEGER %
OUTPUT_VOLTAGE_L1 Values INTEGER V(Tenths)
OUTPUT_VOLTAGE_L2 Values INTEGER V(Tenths)
OUTPUT_VOLTAGE_L3 Values INTEGER V(Tenths)
OUTPUT_VOLTAGE_L1-2 Values INTEGER V(Tenths)
OUTPUT_VOLTAGE_L2-3 Values INTEGER V(Tenths)
OUTPUT_VOLTAGE_L3-1 Values INTEGER V(Tenths)
NOMINAL_VOLTAGE_L-N Values INTEGER Volts
NOMINAL_VOLTAGE_L-I Values INTEGER Volts
OUTPUT_VOLTAGE_THRESHO
LD_MIN
Values INTEGER % below
normal
OUTPUT_VOLTAGE_THRESHO
LD_LOW
Values INTEGER % below
normal
OUTPUT_VOLTAGE_THRESHO
LD_HIGH
Values INTEGER % above
normal
OUTPUT_VOLTAGE_THRESHO
LD_MAX
Values INTEGER % above
normal
NOMINAL_FREQUENCY Values INTEGER Hz(Tenths)
OUTPUT_FREQUENCY Values INTEGER Hz(Tenths)

GREENDC D21 – GREENDC DSS Design Document
Project no: 734273 142 31/10/2017
● CHILLER
Name Category Data Type Value/Unit
Not used Status DIGITAL
VARIABLES
Compressor 1 ON- 25% step Status DIGITAL
VARIABLES
Compressor 1-50% step Status DIGITAL
VARIABLES
Compressor 1- 75% step Status DIGITAL
VARIABLES
Compressor 1-100% step Status DIGITAL
VARIABLES
Compressor 2 ON-25% step Status DIGITAL
VARIABLES
Compressor 2-50% step Status DIGITAL
VARIABLES
Compressor 2-75% step Status DIGITAL
VARIABLES
Compressor 2-100% step Status DIGITAL
VARIABLES
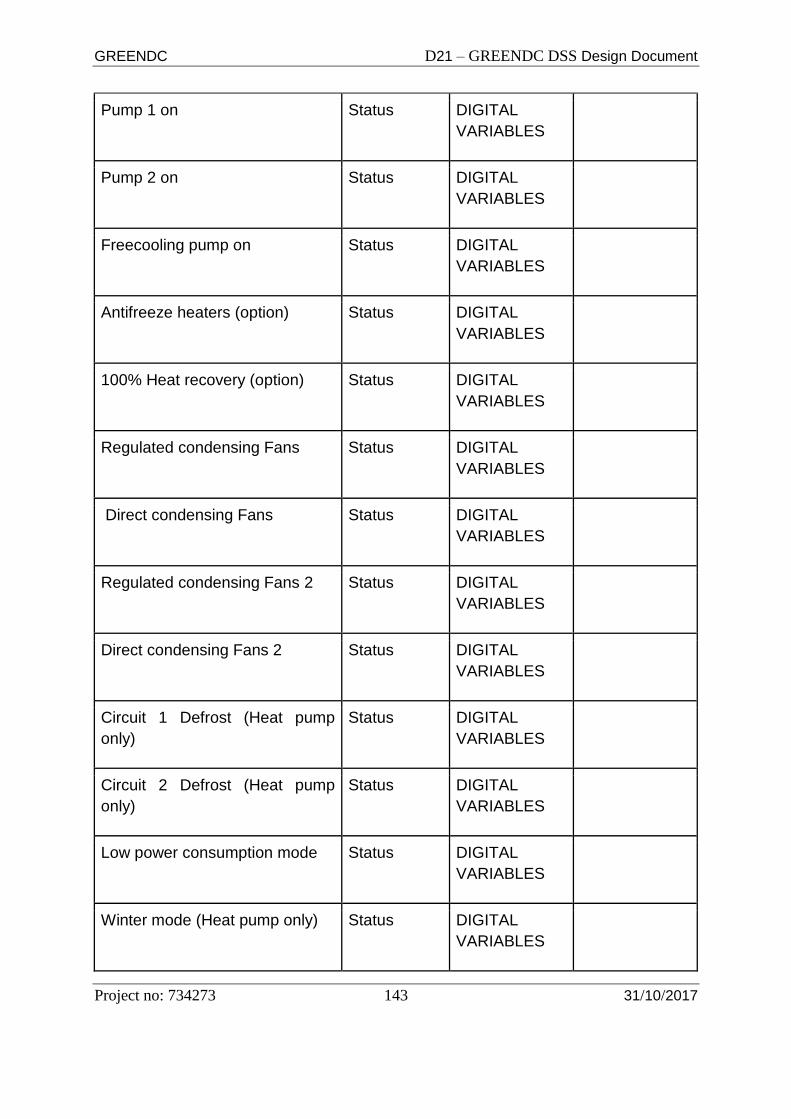
GREENDC D21 – GREENDC DSS Design Document
Project no: 734273 143 31/10/2017
Pump 1 on Status DIGITAL
VARIABLES
Pump 2 on Status DIGITAL
VARIABLES
Freecooling pump on Status DIGITAL
VARIABLES
Antifreeze heaters (option) Status DIGITAL
VARIABLES
100% Heat recovery (option) Status DIGITAL
VARIABLES
Regulated condensing Fans Status DIGITAL
VARIABLES
Direct condensing Fans Status DIGITAL
VARIABLES
Regulated condensing Fans 2 Status DIGITAL
VARIABLES
Direct condensing Fans 2 Status DIGITAL
VARIABLES
Circuit 1 Defrost (Heat pump
only)
Status DIGITAL
VARIABLES
Circuit 2 Defrost (Heat pump
only)
Status DIGITAL
VARIABLES
Low power consumption mode Status DIGITAL
VARIABLES
Winter mode (Heat pump only) Status DIGITAL
VARIABLES

GREENDC D21 – GREENDC DSS Design Document
Project no: 734273 144 31/10/2017
Summer/Winter mode remote
control
Status DIGITAL
VARIABLES
Unit Remote Switch-On/Off
Control
Status DIGITAL
VARIABLES
Buzzer and Alarm Remote Reset
Control
Status DIGITAL
VARIABLES
Pump 1-2 Switch-over remote
control
Status DIGITAL
VARIABLES
Set Back Mode (Sleep Mode) Status DIGITAL
VARIABLES
Reserved variable Status DIGITAL
VARIABLES
Usage of Temp. Values: Local
(0) / Mean (1)
Status DIGITAL
VARIABLES
No. Of Stand-by Units: one (0) /
two (1)
Status DIGITAL
VARIABLES
Water tank range Status DIGITAL
VARIABLES
Presence of the 2nd water pump Status DIGITAL
VARIABLES
Water Outlet Temperature Values ANALOG
VARIABLES
°C
Water Outlet Temp. used by
regulator
Values ANALOG
VARIABLES
°C

GREENDC D21 – GREENDC DSS Design Document
Project no: 734273 145 31/10/2017
Water Inlet Temperature Values ANALOG
VARIABLES
°C
Water Tank Temperature Values ANALOG
VARIABLES
°C
Outdoor Air Temperature Values ANALOG
VARIABLES
°C
Circuit 1 Condensing
Temperature
Values ANALOG
VARIABLES
°C
Circuit 2 Condensing
Temperature
Values ANALOG
VARIABLES
°C
Circuit 1 Evaporating
Temperature
Values ANALOG
VARIABLES
°C
Circuit 2 Evaporating
Temperature
Values ANALOG
VARIABLES
°C
Circuit 1 Condensing Pressure Values ANALOG
VARIABLES
Bar
Circuit 2 Condensing Pressure Values ANALOG
VARIABLES
Bar
Circuit 1 Evaporating Pressure Values ANALOG
VARIABLES
Bar
Circuit 2 Evaporating Pressure Values ANALOG
VARIABLES
Bar
Discharge temperature
compressor 1
Values ANALOG
VARIABLES
°C
Discharge temperature
compressor 2
Values ANALOG
VARIABLES
°C
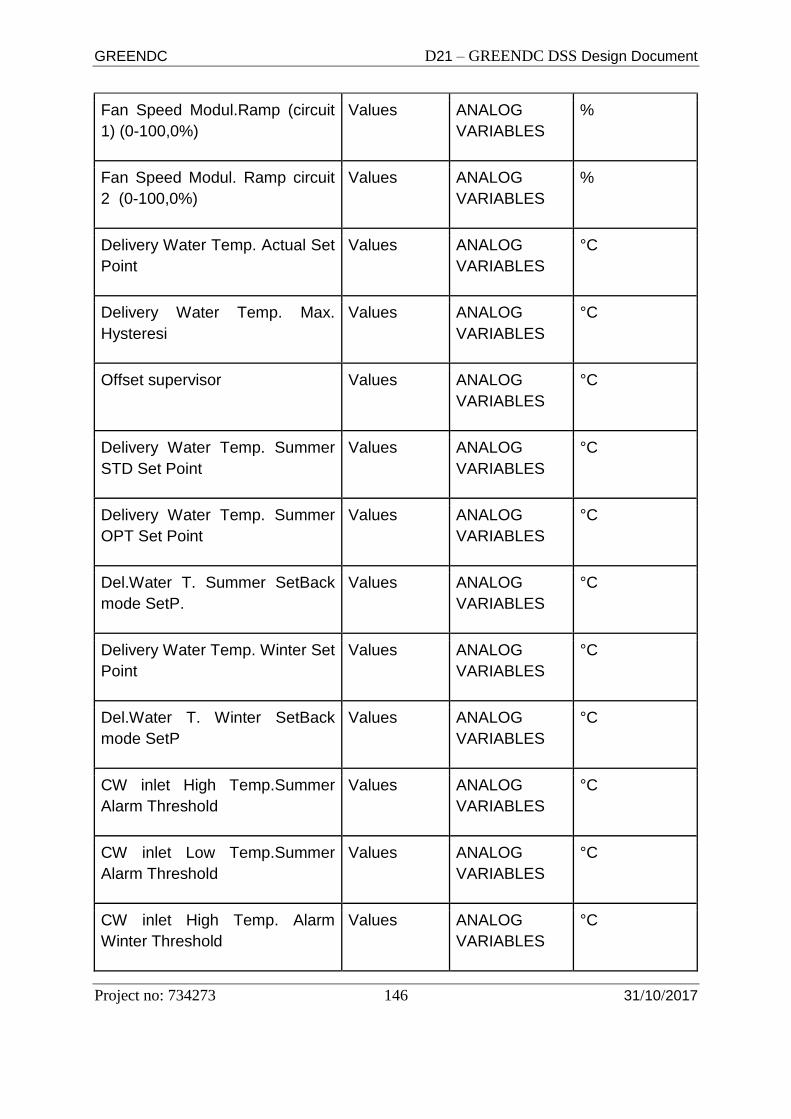
GREENDC D21 – GREENDC DSS Design Document
Project no: 734273 146 31/10/2017
Fan Speed Modul.Ramp (circuit
1) (0-100,0%)
Values ANALOG
VARIABLES
%
Fan Speed Modul. Ramp circuit
2 (0-100,0%)
Values ANALOG
VARIABLES
%
Delivery Water Temp. Actual Set
Point
Values ANALOG
VARIABLES
°C
Delivery Water Temp. Max.
Hysteresi
Values ANALOG
VARIABLES
°C
Offset supervisor Values ANALOG
VARIABLES
°C
Delivery Water Temp. Summer
STD Set Point
Values ANALOG
VARIABLES
°C
Delivery Water Temp. Summer
OPT Set Point
Values ANALOG
VARIABLES
°C
Del.Water T. Summer SetBack
mode SetP.
Values ANALOG
VARIABLES
°C
Delivery Water Temp. Winter Set
Point
Values ANALOG
VARIABLES
°C
Del.Water T. Winter SetBack
mode SetP
Values ANALOG
VARIABLES
°C
CW inlet High Temp.Summer
Alarm Threshold
Values ANALOG
VARIABLES
°C
CW inlet Low Temp.Summer
Alarm Threshold
Values ANALOG
VARIABLES
°C
CW inlet High Temp. Alarm
Winter Threshold
Values ANALOG
VARIABLES
°C

GREENDC D21 – GREENDC DSS Design Document
Project no: 734273 147 31/10/2017
CW inlet Low Temp. Alarm
Winter Threshold
Values ANALOG
VARIABLES
°C
Summer T.ext Compens.: P1
T.ext SetP.
Values ANALOG
VARIABLES
°C
Summer T.ext Compens.: P2
T.wout SetP.
Values ANALOG
VARIABLES
°C
Summer T.ext Compens.: P2
T.ext SetP.
Values ANALOG
VARIABLES
°C
Winter T.ext Compens.: P1 T.ext
SetP.
Values ANALOG
VARIABLES
°C
Winter T.ext Compens.: P2
T.wout SetP.
Values ANALOG
VARIABLES
°C
Winter T.ext Compens.: P2 T.ext
SetP.
Values ANALOG
VARIABLES
°C
Free-Cooling Activation Set
Point
Values ANALOG
VARIABLES
°C
Circuit 1 Superheating Values ANALOG
VARIABLES
°C
Circuit 2 Superheating Values ANALOG
VARIABLES
°C
Circuit 1 Suction Pressure Values ANALOG
VARIABLES
°C
Circuit 2 Suction Pressure Values ANALOG
VARIABLES
°C
Circuit 1 Suction Temperature Values ANALOG
VARIABLES
°C
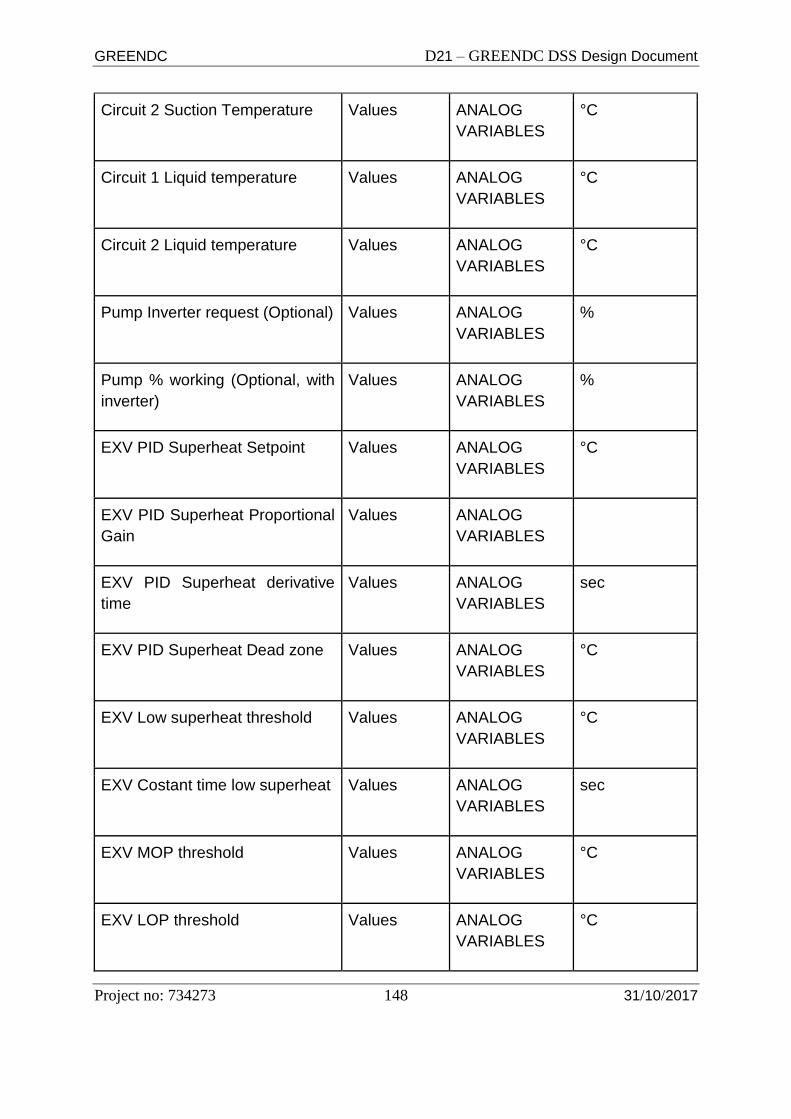
GREENDC D21 – GREENDC DSS Design Document
Project no: 734273 148 31/10/2017
Circuit 2 Suction Temperature Values ANALOG
VARIABLES
°C
Circuit 1 Liquid temperature Values ANALOG
VARIABLES
°C
Circuit 2 Liquid temperature Values ANALOG
VARIABLES
°C
Pump Inverter request (Optional) Values ANALOG
VARIABLES
%
Pump % working (Optional, with
inverter)
Values ANALOG
VARIABLES
%
EXV PID Superheat Setpoint Values ANALOG
VARIABLES
°C
EXV PID Superheat Proportional
Gain
Values ANALOG
VARIABLES
EXV PID Superheat derivative
time
Values ANALOG
VARIABLES
sec
EXV PID Superheat Dead zone Values ANALOG
VARIABLES
°C
EXV Low superheat threshold Values ANALOG
VARIABLES
°C
EXV Costant time low superheat Values ANALOG
VARIABLES
sec
EXV MOP threshold Values ANALOG
VARIABLES
°C
EXV LOP threshold Values ANALOG
VARIABLES
°C
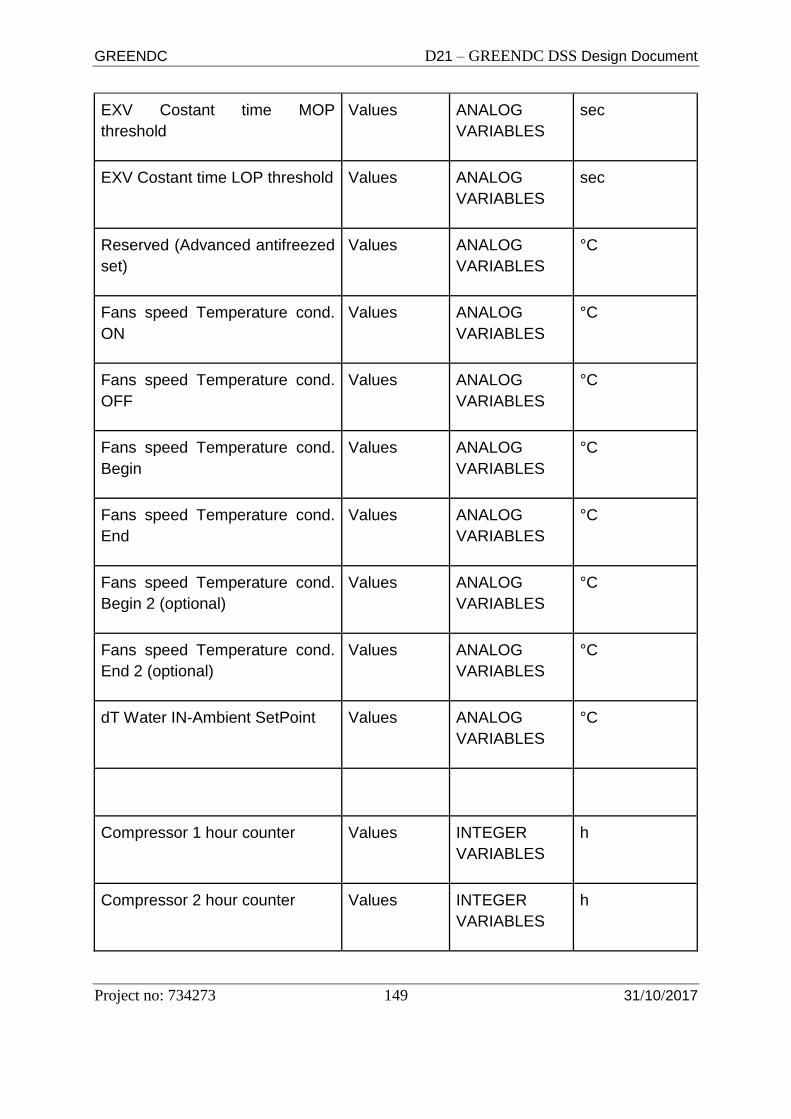
GREENDC D21 – GREENDC DSS Design Document
Project no: 734273 149 31/10/2017
EXV Costant time MOP
threshold
Values ANALOG
VARIABLES
sec
EXV Costant time LOP threshold Values ANALOG
VARIABLES
sec
Reserved (Advanced antifreezed
set)
Values ANALOG
VARIABLES
°C
Fans speed Temperature cond.
ON
Values ANALOG
VARIABLES
°C
Fans speed Temperature cond.
OFF
Values ANALOG
VARIABLES
°C
Fans speed Temperature cond.
Begin
Values ANALOG
VARIABLES
°C
Fans speed Temperature cond.
End
Values ANALOG
VARIABLES
°C
Fans speed Temperature cond.
Begin 2 (optional)
Values ANALOG
VARIABLES
°C
Fans speed Temperature cond.
End 2 (optional)
Values ANALOG
VARIABLES
°C
dT Water IN-Ambient SetPoint Values ANALOG
VARIABLES
°C
Compressor 1 hour counter Values INTEGER
VARIABLES
h
Compressor 2 hour counter Values INTEGER
VARIABLES
h
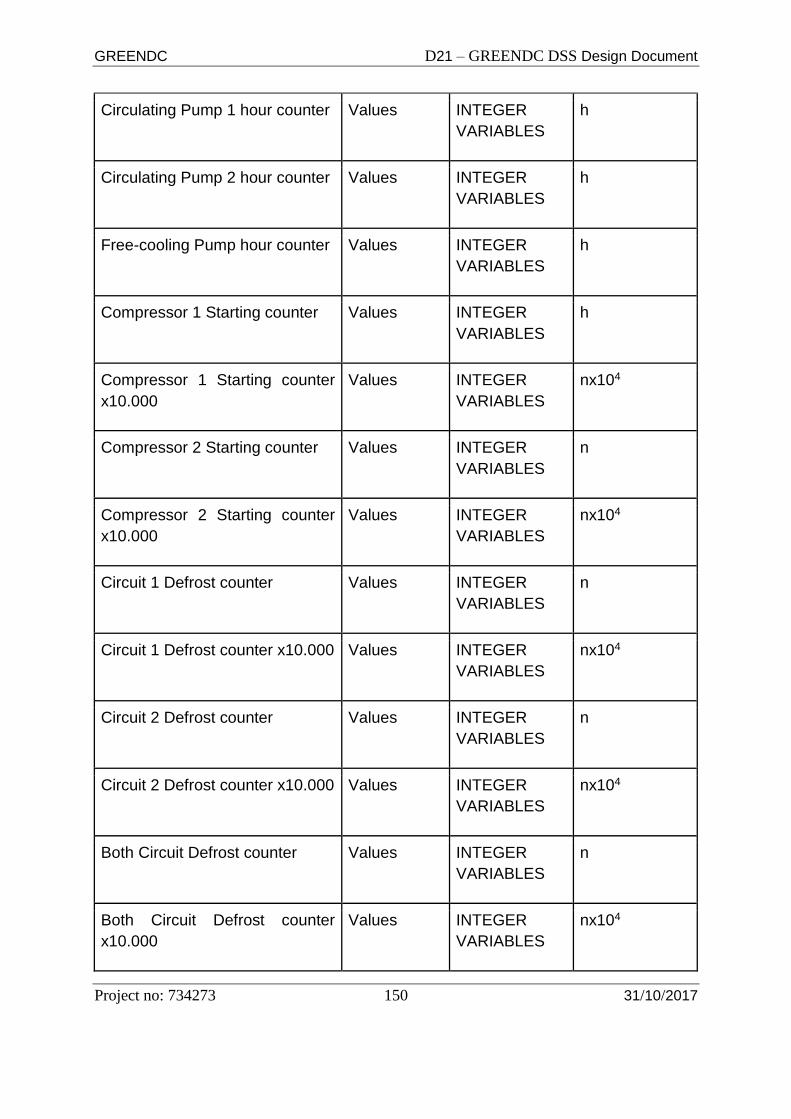
GREENDC D21 – GREENDC DSS Design Document
Project no: 734273 150 31/10/2017
Circulating Pump 1 hour counter Values INTEGER
VARIABLES
h
Circulating Pump 2 hour counter Values INTEGER
VARIABLES
h
Free-cooling Pump hour counter Values INTEGER
VARIABLES
h
Compressor 1 Starting counter Values INTEGER
VARIABLES
h
Compressor 1 Starting counter
x10.000
Values INTEGER
VARIABLES
nx104
Compressor 2 Starting counter Values INTEGER
VARIABLES
n
Compressor 2 Starting counter
x10.000
Values INTEGER
VARIABLES
nx104
Circuit 1 Defrost counter Values INTEGER
VARIABLES
n
Circuit 1 Defrost counter x10.000 Values INTEGER
VARIABLES
nx104
Circuit 2 Defrost counter Values INTEGER
VARIABLES
n
Circuit 2 Defrost counter x10.000 Values INTEGER
VARIABLES
nx104
Both Circuit Defrost counter Values INTEGER
VARIABLES
n
Both Circuit Defrost counter
x10.000
Values INTEGER
VARIABLES
nx104

GREENDC D21 – GREENDC DSS Design Document
Project no: 734273 151 31/10/2017
Non Performing Defrost counter Values INTEGER
VARIABLES
n
Non Performing Defrost counter
x10.000
Values INTEGER
VARIABLES
nx104
Unit Type (0= STD Chiller,
1=Low Temp. Ch., 2=Ch.+Heat
Rec.; 3=Heat Pump, 4=HP+Heat
Rec. 5=Ch.+Energy Saving)
Values INTEGER
VARIABLES
n
Circulating Pump Config. (0,1 or
2 Pumps)
Values INTEGER
VARIABLES
n
Total of units connected in LAN Values INTEGER
VARIABLES
n
Comp.1 Status
(0=Off,1=On,2=AL,3=Pump.Dow
n)
Values INTEGER
VARIABLES
n
Comp.2 Status Values INTEGER
VARIABLES
n
Comp.1 Step Status Values INTEGER
VARIABLES
n
Comp.2 Step Status Values INTEGER
VARIABLES
n
Pump 1 Status Values INTEGER
VARIABLES
n
Pump 2 Status Values INTEGER
VARIABLES
n
FC Pump Status Values INTEGER
VARIABLES
n
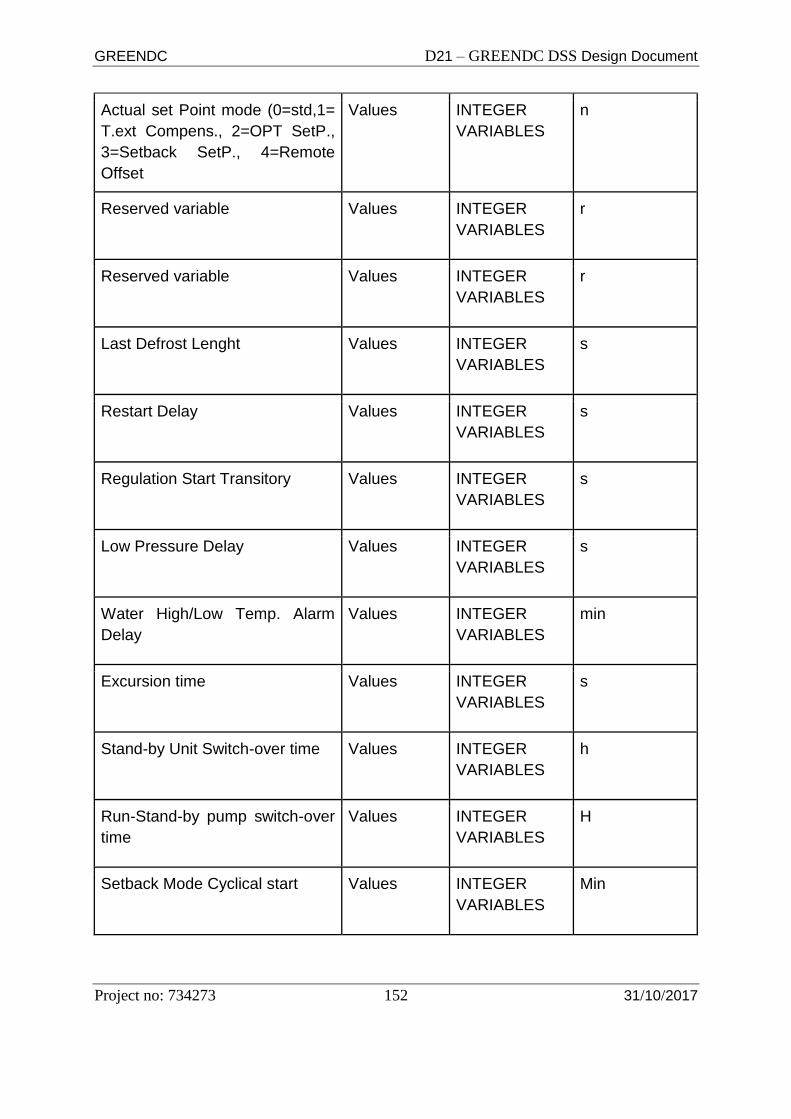
GREENDC D21 – GREENDC DSS Design Document
Project no: 734273 152 31/10/2017
Actual set Point mode (0=std,1=
T.ext Compens., 2=OPT SetP.,
3=Setback SetP., 4=Remote
Offset
Values INTEGER
VARIABLES
n
Reserved variable Values INTEGER
VARIABLES
r
Reserved variable Values INTEGER
VARIABLES
r
Last Defrost Lenght Values INTEGER
VARIABLES
s
Restart Delay Values INTEGER
VARIABLES
s
Regulation Start Transitory Values INTEGER
VARIABLES
s
Low Pressure Delay Values INTEGER
VARIABLES
s
Water High/Low Temp. Alarm
Delay
Values INTEGER
VARIABLES
min
Excursion time Values INTEGER
VARIABLES
s
Stand-by Unit Switch-over time Values INTEGER
VARIABLES
h
Run-Stand-by pump switch-over
time
Values INTEGER
VARIABLES
H
Setback Mode Cyclical start Values INTEGER
VARIABLES
Min

GREENDC D21 – GREENDC DSS Design Document
Project no: 734273 153 31/10/2017
Compr.1 working hours
threshold
Values INTEGER
VARIABLES
h *100
Compr.2 working hours
threshold
Values INTEGER
VARIABLES
h *100
Pump 1 working hours threshold Values INTEGER
VARIABLES
h *100
Pump 2 working hours threshold Values INTEGER
VARIABLES
h *100
FC Pump working hours
threshold
Values INTEGER
VARIABLES
h *100
Reserved Values INTEGER
VARIABLES
Reserved Values INTEGER
VARIABLES
Compressor 1 Current Absorbed Values INTEGER
VARIABLES
A
Compressor 2 Current Absorbed Values INTEGER
VARIABLES
A
Circuit 1 EXV Position Values INTEGER
VARIABLES
Step
Circuit 2 EXV Position Values INTEGER
VARIABLES
Step
Hour Values INTEGER
VARIABLES
H
Minute Values INTEGER
VARIABLES
Min

GREENDC D21 – GREENDC DSS Design Document
Project no: 734273 154 31/10/2017
Day Values INTEGER
VARIABLES
D
Month Values INTEGER
VARIABLES
M
Year Values INTEGER
VARIABLES
Y
Bios release Values INTEGER
VARIABLES
boot release Values INTEGER
VARIABLES
SW release Values INTEGER
VARIABLES
Head pressure setpoint Values INTEGER
VARIABLES
kPa
Head pressure value Values INTEGER
VARIABLES
kPa
Water IN pressure Values INTEGER
VARIABLES
kPa
Water OUT pressure Values INTEGER
VARIABLES
kPa

GREENDC D21 – GREENDC DSS Design Document
Project no: 734273 155 31/10/2017
● AIR CONDITIONER
Name Category Data Type Value/Unit
System On (Fan) Status DIGITAL
Compressor 1 Status DIGITAL
Compressor 2 Status DIGITAL
Compressor 3 Status DIGITAL
Compressor 4 Status DIGITAL
El. Heater 1 Status DIGITAL
El. Heater 2 Status DIGITAL
Hot gas ON Status DIGITAL
Dehumidification Status DIGITAL
Humidification Status DIGITAL
Emergency Working Status DIGITAL
DX/CW Switch on TC Units Status DIGITAL
Summer/Winter Switch Status DIGITAL
Unit ON/OFF Switch Status DIGITAL

GREENDC D21 – GREENDC DSS Design Document
Project no: 734273 156 31/10/2017
Setback Mode (Sleep Mode) Status DIGITAL
Sleep Mode Test Status DIGITAL
Local/Mean Usage of Values Status DIGITAL
Room Temperature Values ANALOG °C
Outdoor Temperature Values ANALOG °C
Delivery Air Temperature Values ANALOG °C
Chilled Water Temperature
(circ.1)
Values ANALOG °C
Hot Water Temperature Values ANALOG °C
Room Relative Humidity Values ANALOG rH%
Outlet Chilled Water
Temperature
Values ANALOG °C
Circuit 1 Evaporating Pressure Values ANALOG bar
Circuit 2 Evaporating Pressure Values ANALOG bar
Circuit 1 Suction Temperature Values ANALOG °C
Circuit 2 Suction Temperature Values ANALOG °C
Circuit 1 Evaporating
Temperature
Values ANALOG °C
Circuit 2 Evaporating
Temperature
Values ANALOG °C

GREENDC D21 – GREENDC DSS Design Document
Project no: 734273 157 31/10/2017
Circuit 1 Superheat Values ANALOG °C
Circuit 2 Superheat Values ANALOG °C
Cold Water Valve Ramp
(circ.1)
Values ANALOG %
Hot Water Valve Ramp Values ANALOG %
Evaporating Fan Speed Values ANALOG %
Cooling Setpoint
Return Air Temperature
Values ANALOG °C
Cooling Setpoint
Delivery Air Temperature
Values ANALOG
Cooling Sensitivity
Return Air Temperature
Values ANALOG °C
Cooling Sensitivity
Delivery Air Temperature
Values ANALOG
Second Cooling Setpoint
Return Air Temperature
Values ANALOG °C
Second Cooling Delivery Air
Temperature
Values ANALOG
Heating Setpoint Values ANALOG °C
Second Heating setpoint Values ANALOG °C
Heating Sensitivity Values ANALOG °C
High Room Temperature
Alarm Threshold
Values ANALOG °C
Low Room Temperature Values ANALOG °C
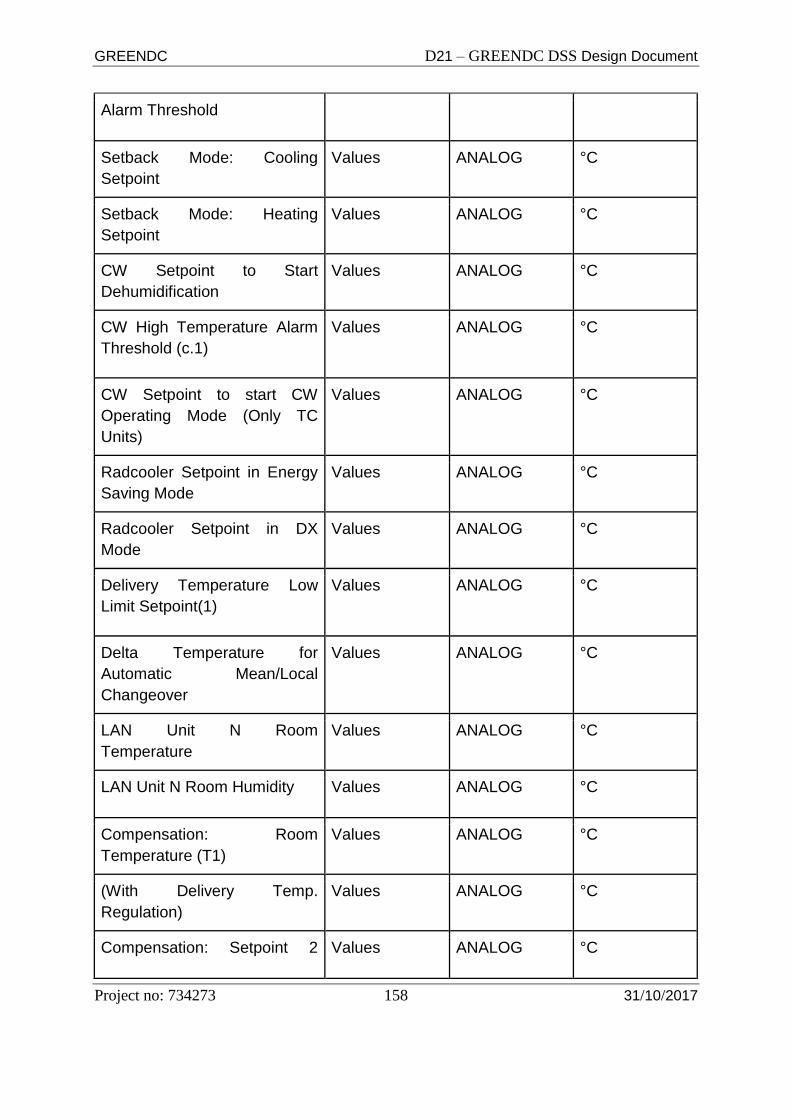
GREENDC D21 – GREENDC DSS Design Document
Project no: 734273 158 31/10/2017
Alarm Threshold
Setback Mode: Cooling
Setpoint
Values ANALOG °C
Setback Mode: Heating
Setpoint
Values ANALOG °C
CW Setpoint to Start
Dehumidification
Values ANALOG °C
CW High Temperature Alarm
Threshold (c.1)
Values ANALOG °C
CW Setpoint to start CW
Operating Mode (Only TC
Units)
Values ANALOG °C
Radcooler Setpoint in Energy
Saving Mode
Values ANALOG °C
Radcooler Setpoint in DX
Mode
Values ANALOG °C
Delivery Temperature Low
Limit Setpoint(1)
Values ANALOG °C
Delta Temperature for
Automatic Mean/Local
Changeover
Values ANALOG °C
LAN Unit N Room
Temperature
Values ANALOG °C
LAN Unit N Room Humidity Values ANALOG °C
Compensation: Room
Temperature (T1)
Values ANALOG °C
(With Delivery Temp.
Regulation)
Values ANALOG °C
Compensation: Setpoint 2 Values ANALOG °C

GREENDC D21 – GREENDC DSS Design Document
Project no: 734273 159 31/10/2017
(SP2)
(With Delivery Temp.
Regulation)
Values ANALOG °C
Compensation: Room
Temperature (T2)
Values ANALOG °C
(With Delivery Temp.
Regulation)
Values ANALOG °C
Cold Water Valve Ramp
(circ.2)
Values ANALOG %
CW High Temperature Alarm
Threshold (c.2)
Values ANALOG °C
Humidifier 0-10V Ramp Values ANALOG %
Chilled Water Temperature
(circ.2)
Values ANALOG °C
Room Temperature Mean
Value
Values ANALOG °C
Room Relative Humidity Mean
Value
Values ANALOG rH%
Room Absolute Humidity Values ANALOG g/Kg
Dehumidification Setpoint Values ANALOG g/Kg
Dehumidification Prop.Band Values ANALOG g/Kg
Setback Mode:
Dehumidification Setpoint
Values ANALOG g/Kg
High Humidity Alarm
Threshold
Values ANALOG g/Kg
Humidification Setpoint Values ANALOG g/Kg

GREENDC D21 – GREENDC DSS Design Document
Project no: 734273 160 31/10/2017
Humidification Prop.Band Values ANALOG g/Kg
Setback Mode: Humidification
Setpoint
Values ANALOG g/Kg
Low Humidity Alarm
Threshold
Values ANALOG g/Kg
Condensing Pressure (Circuit
1)
Values ANALOG bar
Condensing Pressure Circuit 2 Values ANALOG bar
Condensing Temperature
(Circuit 1)
Values ANALOG °C
Condensing Temperature
(Circuit 2)
Values ANALOG °C
Energy Meter: Phase 1
Current
Values ANALOG A
Energy Meter: Phase 2
Current
Values ANALOG A
Energy Meter: Phase 3
Current
Values ANALOG A
Energy Meter: Neutral Current Values ANALOG A
Energy Meter: Line 1 to Line 2
Voltage (PM9C model)
Values ANALOG V
Energy Meter: Line 2 to Line 3
Voltage
Values ANALOG V
Energy Meter: Line 3 to Line 1
Voltage (PM9C model)
Values ANALOG V
Energy Meter: Line 1 to
Neutral Voltage (PM9C
model)
Values ANALOG V

GREENDC D21 – GREENDC DSS Design Document
Project no: 734273 161 31/10/2017
Energy Meter: Line 2 to
Neutral Voltage
Values ANALOG V
Energy Meter: Line 3 to
Neutral Voltage (PM9C
model)
Values ANALOG V
Energy Meter: Frequency
(PM9C model)
Values ANALOG Hz
Energy Meter: Total Active
Power (PM9C model)
Values ANALOG kW
Energy Meter: Total Reactive
Power (PM9C model)
Values ANALOG kvar
Energy Meter: Total Apparent
Power (PM9C model)
Values ANALOG kVA
Energy Meter: Total Power
Factor (PM9C model)
Values ANALOG -
Outlet Chilled Water
Temperature (circ.2)
Values ANALOG °C
Freecooling Air Damper Ramp Values ANALOG %
Return Air Damper Ramp Values ANALOG %
Freecooling Sensitivity Values ANALOG °C
Air Filter Run Hours Values INTEGER h
Unit Run Hours Values INTEGER h
Compressor 1 Run Hours Values INTEGER h
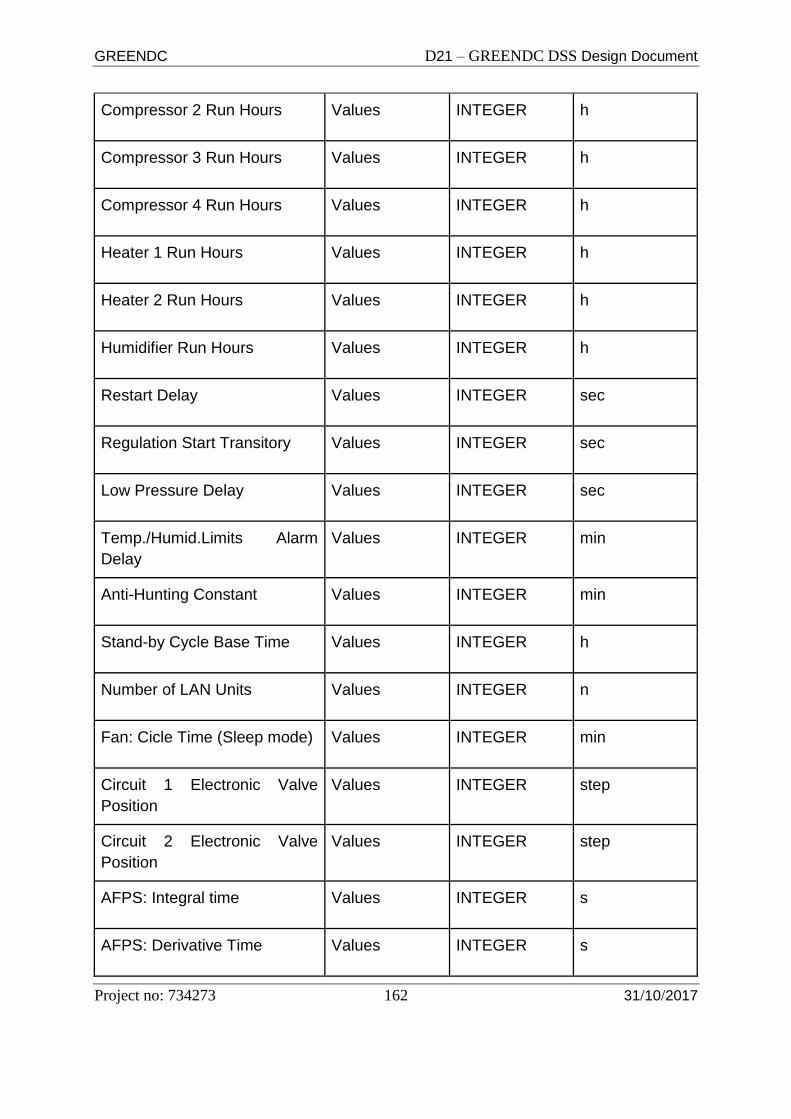
GREENDC D21 – GREENDC DSS Design Document
Project no: 734273 162 31/10/2017
Compressor 2 Run Hours Values INTEGER h
Compressor 3 Run Hours Values INTEGER h
Compressor 4 Run Hours Values INTEGER h
Heater 1 Run Hours Values INTEGER h
Heater 2 Run Hours Values INTEGER h
Humidifier Run Hours Values INTEGER h
Restart Delay Values INTEGER sec
Regulation Start Transitory Values INTEGER sec
Low Pressure Delay Values INTEGER sec
Temp./Humid.Limits Alarm
Delay
Values INTEGER min
Anti-Hunting Constant Values INTEGER min
Stand-by Cycle Base Time Values INTEGER h
Number of LAN Units Values INTEGER n
Fan: Cicle Time (Sleep mode) Values INTEGER min
Circuit 1 Electronic Valve
Position
Values INTEGER step
Circuit 2 Electronic Valve
Position
Values INTEGER step
AFPS: Integral time Values INTEGER s
AFPS: Derivative Time Values INTEGER s

GREENDC D21 – GREENDC DSS Design Document
Project no: 734273 163 31/10/2017
AFPS: Fan Min. Speed (mode
CW)
Values INTEGER %
AFPS: Fan Max Speed Values INTEGER %
AFPS: Alarm Delay Values INTEGER s
High Delivery Temp. Alarm
Threshold
Values INTEGER °C
Day Values INTEGER
Month Values INTEGER
Year Values INTEGER
Reserved Values INTEGER
Reserved Values INTEGER
Hour Values INTEGER
Minute Values INTEGER
AFPS: Fan Min. Speed (mode
DX)
Values INTEGER %
MODE CW+DX Run Hours Values INTEGER h
MODE DX Run Hours Values INTEGER h
MODE CW Run Hours Values INTEGER h
Dehumidification Run Hours Values INTEGER h
Stand-By Mode Run Hours Values INTEGER h

GREENDC D21 – GREENDC DSS Design Document
Project no: 734273 164 31/10/2017
Ultracapacitor Status (UCAP) Status INTEGER 0=Power
Supply
Fail.(UCAP on
working);
1=UCAP in
charge;
2=UCAP Full
Charge
Power Supply Fail.(UCAP on
working) Time
Values INTEGER s
UCAP Charge Time Values INTEGER s
Status Energy Saving Status INTEGER
Energy Meter: Active Energy
Total Counter part 1
Values INTEGER kWh
Energy Meter: Active Energy
Total Counter part 2
Values INTEGER kWh
Energy Meter: Reactive
Energy Total Counter part 1
Values INTEGER kvarh
Energy Meter: Reactive
Energy Total Counter part 2
Values INTEGER kvarh
Energy Meter: Emissions of
CO2 part 1
Values INTEGER g
Energy Meter: Emissions of
CO2 part 2
Values INTEGER g
Water flow rate Values INTEGER l/min
Total cooling capacity Values INTEGER kW
Freecooling Run Hours Values INTEGER h

GREENDC D21 – GREENDC DSS Design Document
Project no: 734273 165 31/10/2017
Freecooling Limits:
Max.Rel.Humid.
Values INTEGER rH%
Freecooling Limits:
Min.Rel.Humid.
Values INTEGER rH%
Freecooling Status
( 0=Off; 1=waiting to
start; 2=On)
Status INTEGER -
Double Power Supply: Active
Line
( 0=A;1=B )
Status INTEGER -
Energy Meter: Line 1 to Line 2
Voltage
Values INTEGER V
Energy Meter: Line 2 to Line 3
Voltage
Values INTEGER V
Energy Meter: Line 3 to Line 1
Voltage
Values INTEGER V
Energy Meter: Line 1 to
Neutral Voltage
Values INTEGER V
Energy Meter: Line 2 to
Neutral Voltage
Values INTEGER V
Energy Meter: Line 3 to
Neutral Voltage
Values INTEGER V
Energy Meter: Frequency Values INTEGER Hz
Energy Meter: Total Active
Power
Values INTEGER kW
Energy Meter: Total Reactive
Power
Values INTEGER kVAr
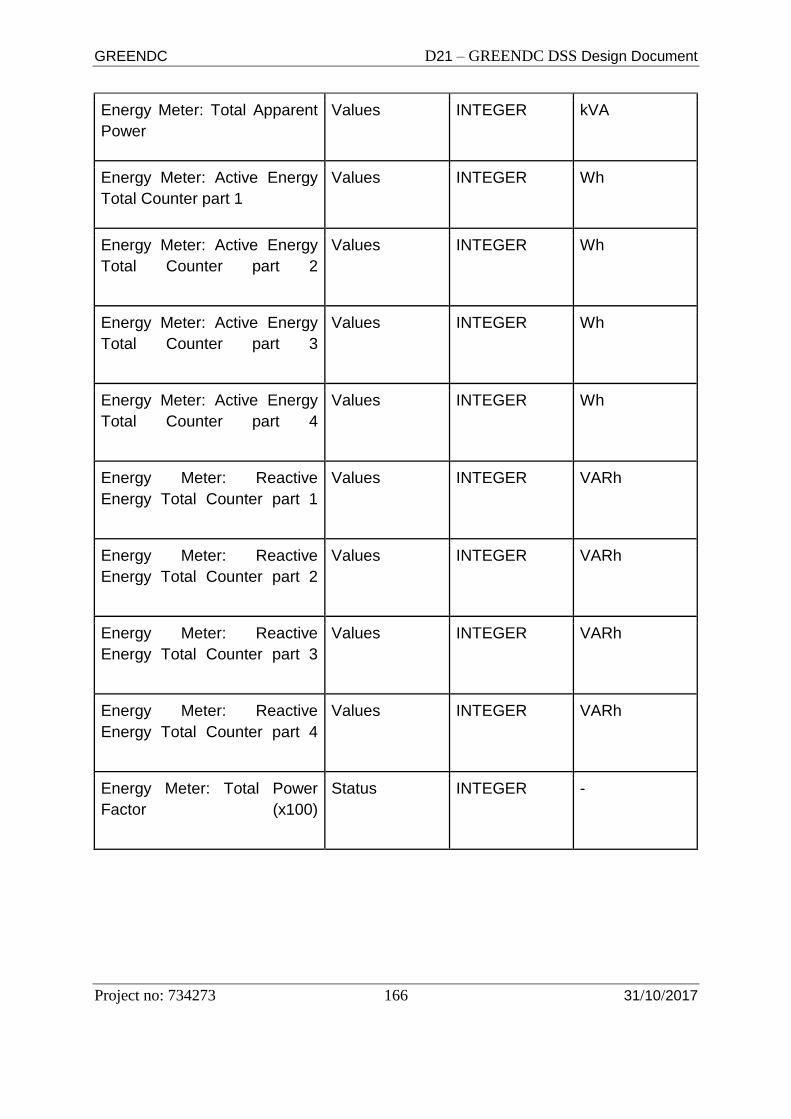
GREENDC D21 – GREENDC DSS Design Document
Project no: 734273 166 31/10/2017
Energy Meter: Total Apparent
Power
Values INTEGER kVA
Energy Meter: Active Energy
Total Counter part 1
Values INTEGER Wh
Energy Meter: Active Energy
Total Counter part 2
Values INTEGER Wh
Energy Meter: Active Energy
Total Counter part 3
Values INTEGER Wh
Energy Meter: Active Energy
Total Counter part 4
Values INTEGER Wh
Energy Meter: Reactive
Energy Total Counter part 1
Values INTEGER VARh
Energy Meter: Reactive
Energy Total Counter part 2
Values INTEGER VARh
Energy Meter: Reactive
Energy Total Counter part 3
Values INTEGER VARh
Energy Meter: Reactive
Energy Total Counter part 4
Values INTEGER VARh
Energy Meter: Total Power
Factor (x100)
Status INTEGER -