delaware electric utilities multi-pollutant regulation ... · pdf filemulti-pollutant...
TRANSCRIPT

Delaware Electric Generation Multi-Pollutant Regulation
Development
Meeting #5June 6, 2006

2
AgendaGoal and Reasons for RegulationThoughts on Information PresentedProposed Multi-P Requirements
Pollutants CoveredAffected UnitsControl Requirements (NOX, SO2, Hg)
Related Initiatives (CAIR, CAMR, Haze, RACT, RGGI)Regulatory Development TimelineNext Meeting
3
Goal of Regulation
To require a significant reduction in air emissions from Delaware’s coal and residual oil fired power plants.
4
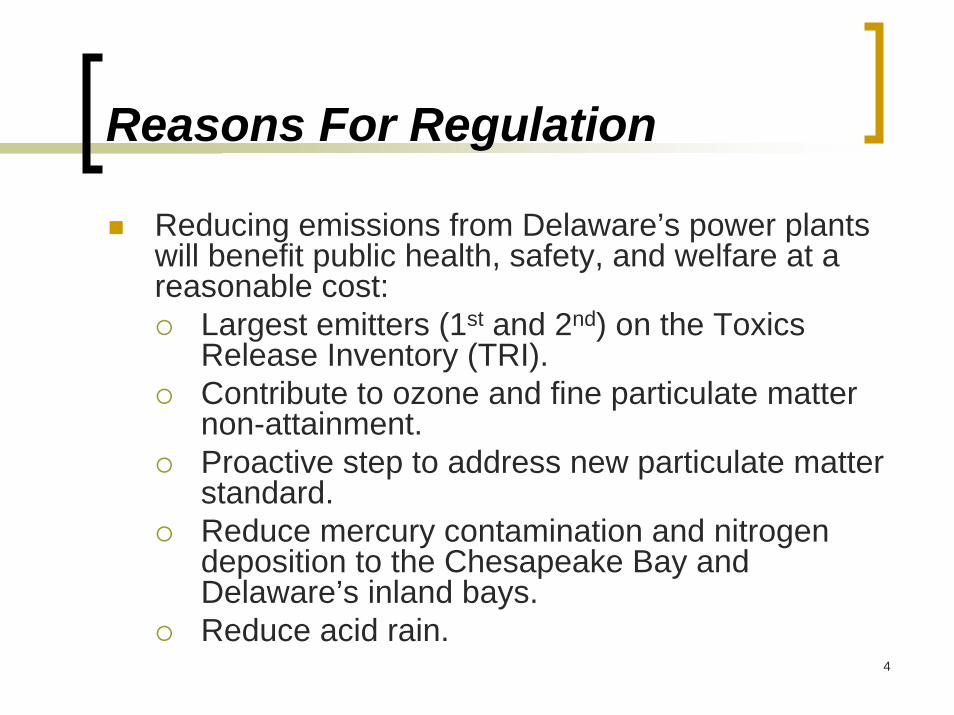
Reasons For Regulation
Reducing emissions from Delaware’s power plants will benefit public health, safety, and welfare at a reasonable cost:
Largest emitters (1st and 2nd) on the Toxics Release Inventory (TRI).Contribute to ozone and fine particulate matter non-attainment. Proactive step to address new particulate matter standard. Reduce mercury contamination and nitrogen deposition to the Chesapeake Bay and Delaware’s inland bays. Reduce acid rain.

5
Reasons For Regulation (cont’d)
Aid in achievement of regional haze goals.Reduce any local health impacts near the plants.Level the field with surrounding statesWithout this action mass emissions from Delaware’s power plants will likely not decrease.
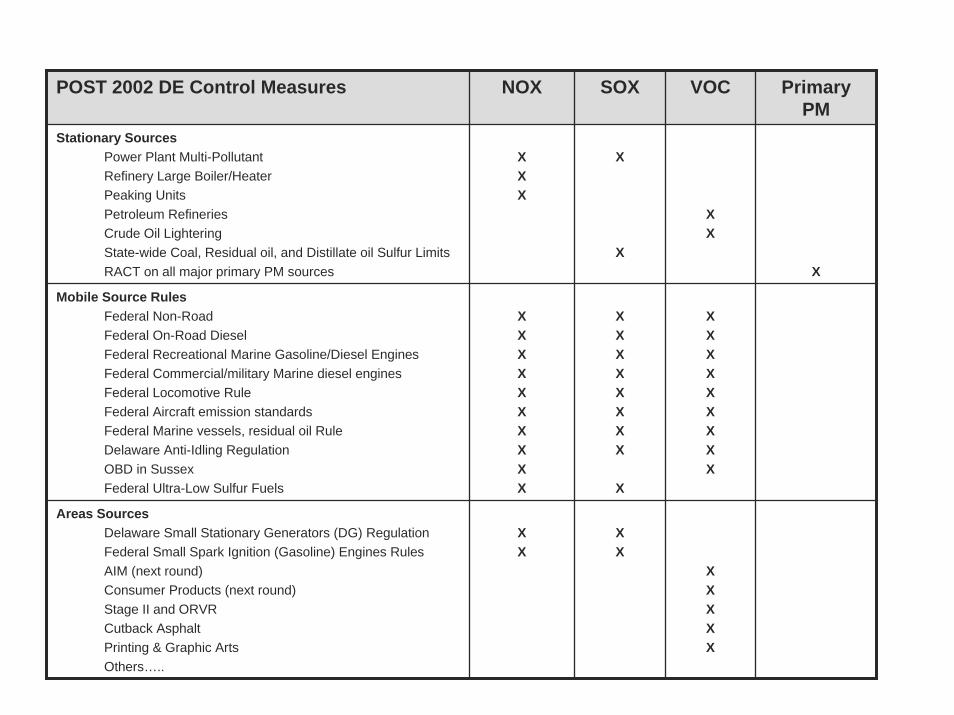
POST 2002 DE Control Measures NOX SOX VOC Primary PM
Stationary SourcesPower Plant Multi-PollutantRefinery Large Boiler/Heater Peaking UnitsPetroleum RefineriesCrude Oil LighteringState-wide Coal, Residual oil, and Distillate oil Sulfur LimitsRACT on all major primary PM sources
XXX
X
X
XX
XXXXXXXXX
XXXXX
X
Mobile Source RulesFederal Non-RoadFederal On-Road DieselFederal Recreational Marine Gasoline/Diesel EnginesFederal Commercial/military Marine diesel enginesFederal Locomotive RuleFederal Aircraft emission standardsFederal Marine vessels, residual oil RuleDelaware Anti-Idling RegulationOBD in Sussex Federal Ultra-Low Sulfur Fuels
XXXXXXXXXX
XXXXXXXX
X
Areas SourcesDelaware Small Stationary Generators (DG) Regulation Federal Small Spark Ignition (Gasoline) Engines RulesAIM (next round)Consumer Products (next round)Stage II and ORVRCutback AsphaltPrinting & Graphic ArtsOthers…..
XX
XX

7
95% of DE 2002 VOC Equivalent Emissions (TPD)
010203040506070
On-
Roa
d M
obile
Non
road
Coa
l/Oil E
lect
ric U
tilitie
s
Com
mer
cial
Mar
ine
Vess
els
AIM
and
Con
sum
er P
rodu
cts
Ligh
terin
g
Gas
olin
e D
istri
butio
n
Ref
iner
y Bo
ilers
& H
eat E
xcha
nger
s
Deg
reas
ing
Larg
e N
on-R
efin
ery
Boile
rs
Auto
Ass
embl
y
Peak
ing
Turb
ines
Airc
raft
Woo
d C
ombu
stio
n
Com
m, I
nd.,
Res
. Fue
l Com
bust
ion
Gra
phic
Arts
Stat
iona
ry G
ener
ator
s
Trai
ns
Pest
icid
es (A
gric
ultu
ral)
Larg
e "R
eg. 4
2" B
oile
rs
Auto
body
Ref
inis
hing
CPI
/API
Sep
arat
or
Ref
iner
y W
aste
wat
er
DuP
ont E
x. S
tatio
n Bo
ilers
2002 Emissions 2009 Emissions

8
2002 Base Year Emissions - NOX
Delaware’s power plants are among the largest NOXemitting sources in the state. In 2002 they accounted for
about 55% of the total stationary source NOXemissions, and about 16% of Delaware’s overall NOXinventory.
NOX - tons per year
Point (less EGUs) Area On-road Off-road EGU's

9
2002 Base Year Emissions – SO2
Delaware’s power plants are the largest SO2 emitting sources in the state. After the Premcor CD reductions, they account for about 74% of the total stationary source SO2 emissions, and about 65% of Delaware’s overall SO2 inventory.
SO2 - tons per year
Point (less EGUs) Area On-road Off-road EGU's

10
2004 TRI Emissions – Hg
Based on the 2004 TRI data, after the shutdown of occidental chemical, 77% of all of the mercury (HG) emissions in Delaware come from Delaware’s six coal fired power plants.
Mercury - pounds per year
citisteel Edge Moor Indian River
Invista NRG Dover Premcor

11
Thoughts on Information Presented to Date
Ten Areas:1. Air Quality2. Cost3. Reliability4. Technology/Timing5. Clean Air Interstate Rule (CAIR)6. Clean Air Mercury Rule (CAMR)7. Form of Standard8. Other local factors9. Direct Particulate Matter10. Generators Proposals

12
Thoughts on Information Presented to Date
1. Air Quality:Real reductions from current actual emission rates neededFuture allowable NOX, SO2 and Hg emissions can not exceed current actual levels
2. Cost:o Should be reasonable when compared to
costs to control other sources. o Health costs should be considered. Based on
EPA CAIR analysis, health and economic benefits of air pollution reduction outweigh costs by nearly 9:1.

13
Thoughts on Information Presented to Date
Deregulated market does not provide for direct cost recovery for Generators
Economic viability of individual units should not be a deciding factor.Relative to the age of units, less stringent, interim control measures should only be considered only as a part of enforceable, near-term shutdown commitments.Costs to rate-payers will not be directly passed on to rate-payers as market is deregulated. Future electric rates cannot be estimated

14
Thoughts on Information Presented to Date
3. Reliability:DNREC should not require any unit to shutdown. Regulation should focus on controls only.Electric demand is increasing at ~2-3% per yearNew 230kv North-South transmission line.
Conectiv Power Delivery is nearing completion of a new 90-mile, north-south 230kV transmission line.The line will run from the Red Lion substation in New Castle County to Milford and the Indian River substation.The line is designed to transport enough electricity to serve about 300,000 customers.
PJM is in charge of grid reliability, and is actively pursuing additional major transmission upgrades in DE.

15
Thoughts on Information Presented to Date
4. Technology/Timing:Reduction targets and timelines should be reasonable and achievableAll units should have technology based NOX, SO2 and Hg controls
SCR is a proven NOX technology, able to reduce NOXemissions from all impacted units to 0.1 lb/mmbtu or less.FGD is a proven SO2 technology, able to reduce SO2emissions from all impacted units to 0.18 lb/mmbtu or less.Activated Carbon Injection is a proven Hg technology able to reduce Hg emissions from all impacted units to 0.6 lb/tbtu or less.
A phased-in schedule giving adequate time to meet new requirements is necessary.

16
Thoughts on Information Presented to Date
5) Federal Clean Air Interstate Rule (CAIR):CAIR was designed to mitigate transportCAIR was not designed to solve Delaware’s NAAQS and local air quality problems.Multi-P requirements should not interfere with the CAIR program.
6) Federal Clean Air Mercury Rule (CAMR): o Studies since CAMR developed show that local
mercury emissions impact local area the most.o Goal of Regulation is to reduce mercury emissions from
DE unitso CAMR credits should not be used to allow increased Hg
emissions in Delaware

17
Thoughts on Information Presented to Date
7) Form of standard:Specific technology should be left to the sources Rate based requirements alone may not meet goal of regulation:
Need actual reductions in mass emissions from current levels.Actual mass reductions plus low historical unit capacity factor would lead to very low allowable emission rates.Setting both long term and short term requirements may be most cost effective.
Monitoring based on 40 CFR Part 75 requirements, with modification

18
Thoughts on Information Presented to Date
8) Other local factors:Requirements should encourage cogeneration, use of otherwise flared fuels, and zero emitting technologiesOther impacts should be considered (e.g., water impacts of Wet Scrubbers)
9) Direct Particulate Matter:Total DE PM2.5 emissions are 1564 tons per year (about 18% of total PM2.5 inventory)All units except McKee Run 3 emit more than 100 TPY.BART and RACT Options:
Existing ESPs?Require additional PM2.5 control technology?Reg. should prohibit any increase in PM2.5 emissions from 2002 levels?Over control of secondary PM2.5 versus control of both primary and secondary PM2.5?

19
Thoughts on Information Presented to Date
10) Generators Proposals:Appreciate NRG, Conectiv, and City of Dover’s participation to date. NOX
Proposals based on utilization of Low NOXBurners, overfire air, and SNCRResultant emission rate approximately 0.2 lb/mmbtuNo commitment to hold mass emissions below current levels
20
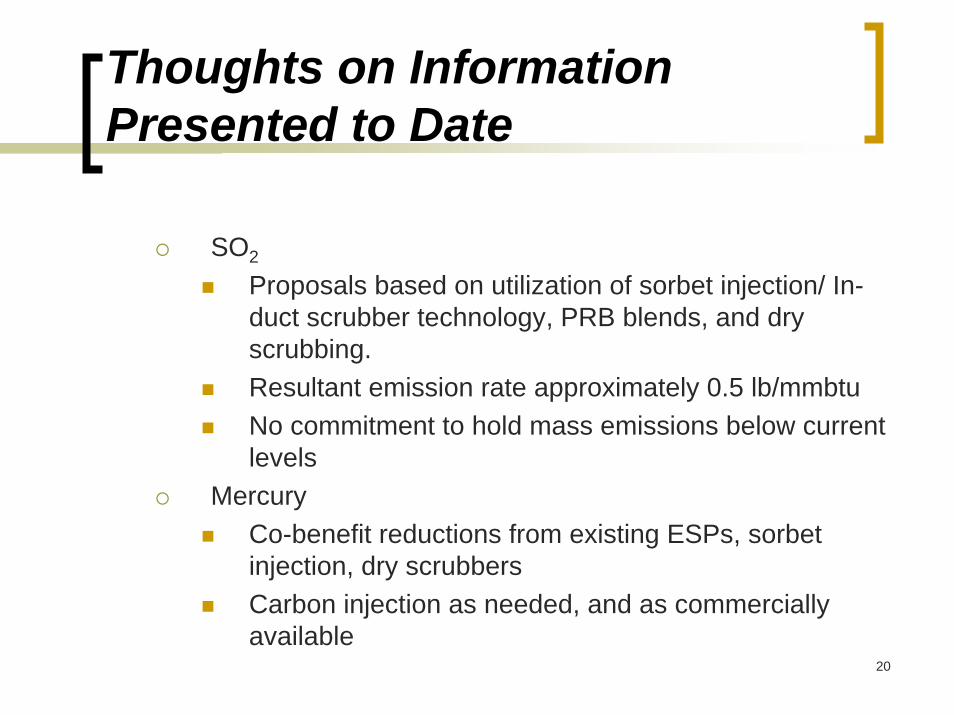
Thoughts on Information Presented to Date
SO2
Proposals based on utilization of sorbet injection/ In-duct scrubber technology, PRB blends, and dry scrubbing.Resultant emission rate approximately 0.5 lb/mmbtuNo commitment to hold mass emissions below current levels
MercuryCo-benefit reductions from existing ESPs, sorbet injection, dry scrubbersCarbon injection as needed, and as commercially available

21
Proposal: Pollutants Covered
Multi-P Approach:Nitrogen Oxides (NOX). One of the key air pollutants that cause Delaware’s ground level ozone problem, and an associated larger regional ozone problem that covers much of the eastern United States. Sulfur Dioxide (SO2). Both NOX and SO2 are significant contributors to Delaware’s fine particulate matter problem, the associated larger regional fine particulate matter problem and the regional haze problem. Mercury (Hg). Hg is a toxic heavy metal, which, when ingested, can cause serious neurological damage, particularly to developing fetuses, infants, and children.

22
Proposal: Affected Units
Applicability:Criteria 1: Coal and Residual oil fired electric utility unitsCriteria 2: Nameplate capacity equal to or greater than 25 megawatts

Unit (year built) AgeMW/Fuel
NOX Controls – Emission data from 2003/4
SO2 Controls –Current Emission
Rate
Mercury Controls – Current
Emission RateIndian River 1
(1957) 48 82 MWCoal
First generation low NOX burners & overfire air –Annual/Ozone Season NOX 0.36/0.36lb/mmbtu
Uncontrolled –2.03 lb/mmbtu ESP Co-benefit
Indian River 2 (1959) 46 82 MW
Coal
First generation low NOX burners & overfire air –Annual/Ozone Season NOX 0.35/0.35lb/mmbtu
Uncontrolled –1.94 lb/mmbtu
ESP Co-benefit
Indian River 3 (1970)
35 177 MWCoal
First generation low NOX burners, overfireair, & selective non-catalytic reduction –Annual/Ozone Season NOX 0.32/0.29lb/mmbtu
Uncontrolled –1.96 lb/mmbtu
ESP Co-benefit
Indian River 4 (1980)
25 442 MWCoal
First generation low NOX burners, overfireair, & selective non-catalytic reduction –Annual/Ozone Season NOX 0.33/0.30 lb/mmbtu
< 0.75% S Coal, Tall Stack-0.98 lb/mmbtu
ESP Co-benefit
EdgeMoor 3 (1954)51 84MW Coal
Low NOX burners, Selective non-catalytic reduction – Annual/Ozone Season NOX0.22/0.17 lb/mmbtu
< 1% S Coal –1.01 lb/mmbtu ESP Co-benefit
EdgeMoor 4 (1966)
39 154 MWCoal
First generation low NOX burners, OverfireAir & gas reburn –0 Annual/Ozone Season NOX 0.25/0.19 lb/mmbtu
< 1% S Coal –1.06 lb/mmbtu ESP Co-benefit
EdgeMoor 5 (1973)32 415 MW
Residual Oil
First generation low NOX burners, OverfireAir – Annual/Ozone Season NOX0.34/0.24 lb/mmbtu
< 1% S Oil –0.64 lb/mmbtu NA
Mckee Run 3 (1975)
30 114 MWResidual Oil
Burner modifications & Fan Boost Overfire Air –Annual/Ozone Season NOX 0.29/0.27 lb/mmbtu
< 1% S Oil Uncontrolled –0.74 lb/mmbtu NA

24
Proposal: NOX Control Requirements
• January 1, 2009:o 0.15 lb/MMBTU, 24-hour rolling averageo NOX emissions from subject units at a common
facility may be averaged on a heat input basis.• January 1, 2012 and beyond
o 0.125 lb/MMBTU, 24-hour rolling averageo No averaging between units.
• Compliance demonstrated with 40 CFR Part 75 CEMs, or other method approved by the Department.

25
Proposal: SO2 Control Requirements
• Oil: Beginning January 1, 2009, oil-fired units shall combust only fuel with a sulfur content of 0.5% or less, by weight.
• Coal:o January 1, 2009:
0.37 lb/MMBTU heat input, 24-hour rolling averageSO2 Emissions from subject units at a common facility may be averaged on a heat input basis.
o January 1, 2012 and beyond:0.26 lb/MMBTU heat input, 24-hour rolling averageNo averaging between units
o Compliance demonstrated with 40 CFR Part 75 CEMs, or other method approved by the Department

26
Proposal: NOX and SO2 Control Requirements
• Proposed short-term limits:o Ensure all affected units install controlso Emission rates are clean relative to highly cost
effective technology
• Short term limits alone do not meet goal of Regulation – allowable emissions are not reduced significantly below current levels

27
Emission Rate Comparison
0
20000
40000
60000
80000
100000
120000
NOX SO2
Current Allow able
2002 Actual
2009 Allow able -Proposed Rates
2012 Allow able -Proposed Rates
• Capacity factors on coal units projected to increase significantly
• Under proposed short-term limits mass NOXemissions can increase to greater than current levels
• Under proposed short-term limits mass SO2emissions may only decrease marginally compared to current levels

28
Proposal: NOX and SO2 Control Requirements
• In addition to short-term limits, AQM proposal is to set an annual allowable based mass caps based on “retrofit BACT” emission levels:
o NOX – cap based on 0.10 lb/mmbtu and 100% capacity factor
o SO2 – cap based on 0.18 lb/mmbtu and 100% capacity factor

29
Emission Rate Comparison• Short-term limits:
•Control at lower capacity factors•60% NOX and 80% SO2 reduction in actual emissions from 2002 levels (fleet weighted heat input basis)
• Allowable limits:•NOX – significant reduction from current allowable, and marginal reduction from current actual levels•SO2 - significant reduction from both current allowable and actual levels•Mass caps represent a 76% NOXand 87% SO2 reduction in allowable emissions
• At higher capacity factors rate reductions are driven by mass caps
-5000
15000
35000
55000
75000
95000
115000
NOX SO2
Current Allowable
2002 Actual
2012 Allowable -Proposed Mass Caps
Unit Capacity Factor
Allo
wab
le N
OX
Emis
sion
R
ate
0.15
0.10
0 100

30
Cost/Benefit
DNREC Estimate (based on target emission rates 0.1 lb/MMBTU NOX, 0.18 lb/MMBTU SO2, and 0.6 lb/TBTU Hg)
Total capital costs between $500 to $750 million.Between $1,200 and $2,600 per ton of NOX removed for coal, and between $2,400 and $5,000 per ton for oil units.Between $600 and $1,600 per ton of SO2 removed for coal, and about $7,000 per ton for the oil units. Between $14,000 and $19,000 per pound of mercury reduced.
Generation costs:Estimated to increase between $6.72 and $11.21 per mega watt generated for the coal units, and $18.90 to $23.87 for oil units.About 25% increase for both coal and oil.

31
Cost/BenefitDNREC Estimate (based on target emission rates 0.125 lb/MMBTU NOX, 0.26 lb/MMBTU SO2)
Total capital costs between $100 to $175 million.Between $1,200 and $2,500 per ton of NOX removed for coal, and between $2,400 and $4,500 per ton for oil units. Between $200 and $1,200 per ton of SO2 removed for coal, and about $7,000 per ton for the oil units.
Generation costs: Estimated to increase between $4.55 and $9.23 per mega watt generated for the coal units, and $18.50 to $20.75 for oil units.About 20% increase for both coal and oil
DNREC believes long-term costs are similar, with the trade-off being capital versus operating costs.

32
Cost/Benefit
• 0.10 NOX and 0.18 SO2• Capital cost of 500 to 750 MM • Allows up to 7,941 tons of NOX
and 14,294 tons of SO2. • Maximum capital investment only
required at higher capacity factors.• 0.125 NOX and 0.26 SO2
• Capital cost of 100 to 175 MM• Significant reduction in actual
emission rates from current levels• Same allowable mass emissions
and emission rate at high capacity factors as 0.10 NOX/0.18 SO2limits
• Similar environmental protection
0
5000
10000
15000
20000
25000
NOX SO2
$500-$750 MM
$100-$175 MM
Employing both long term and short term requirements should significantly reduce emissions at lower capital cost

33
Cost/BenefitBased on a Maryland Department of the Environment (MDE) analysis of the Regulatory Impact Analysis (RIA) EPA performed for CAIR:
Maryland estimates its regulations will annually reduce premature mortality by approximately 400 cases, nonfatal heart attacks by approximately 550 cases, chronic bronchitis by 200 cases, acute bronchitis by 500 cases, and hospital admissions and emergency room visits by 600 cases. DE proposed requirements are similar to Maryland's.EPA conservatively estimated that nationally, every $1 spent on power plant controls produces $10 in annual health benefits.
Summary: DNREC believes target emission rates are achievable and cost effective:
0.1 lb/MMBTU NOX, 0.18 lb/MMBTU SO2, and 0.6 lb/TBTU Hg are cost effective; and 0.125 lb/MMBTU NOX, 0.26 lb/MMBTU SO2 are highly cost effective.

34
Summary: Proposed NOX and SO2 Control Requirements
-5000
15000
35000
55000
75000
95000
115000
NOX SO2
Current "Allow able"
2002 Actual
2012 Allow able -Proposed Mass Caps
Estimated Actual(short-term rates plushistorical utilization)
NOX - 0.15 lb/MMBTU, and 0.125 lb/MMBTU, 24-hour rolling average for 2009 and 2012, respectively. Mass cap based on 0.10 lb/mmbtu and 100% capacity factor beginning 2009.
SO2 – Coal: 0.37 lb/MMBTU, and 0.26 lb/MMBTU, 24-hour rolling average for 2009 and 2012, respectively. Oil:Beginning 2009, sulfur content of 0.5% or less. All: mass cap based on 0.18 lb/mmbtu and 100% capacity factor beginning 2009.

35
Proposal: Hg Control Requirement
•January 1, 2009:o Mercury emissions shall not exceed 1.0 lb/TBTU
heat input, oro Be reduced by a minimum 80% capture and
control of inlet mercuryo quarterly average basis
•January 1, 2013 and beyond:o Mercury emissions shall not exceed 0.6 lb/TBTU
heat input, or o Be reduced by a minimum 90% capture and
control of inlet mercuryo quarterly average basis

36
Proposal: Hg Control Requirement
• Annual mass cap to satisfy CAMR:o CAMR 2010 Hg cap is 0.072 ton (144 lb, or 2304 oz).o CAMR 2018 and beyond cap is 0.028 ton (56 lb or 896 oz).
• Allowable annual unit level mercury mass emissions using CAMR allocation methodology:
2010 – 2017 2018 and BeyondEdge Moor 3 266 oz 99 ozEdge Moor 4 462 oz 172 ozIndian River 1 207 oz 77 ozIndian River 2 216 oz 81 ozIndian River 3 337 oz 125 ozIndian River 4 700 oz 261 oz
• No trading/averaging

37
Proposal: Hg Control Requirement
•Compliance with mercury emission rate limits demonstrated with 40 CFR Part 75 CEMS.
•Compliance with the percentage reduction of inlet mercury provisions shall be demonstrated through quarterly stack tests

Leveling the Playing Field
Pollutant
Delaware Proposed Multi-P
Regulation
New Jersey Mercury
RuleMD Clean Power
Regulation MassachusettsPA Mercury Rule (Draft)
STAPPA/ALAPCO Mercury Model Rule
SO2
Short term rates (0.37 lb/MMBTU 2009, 0.26 lb/MMBTU 2012)
Mass cap (based on 0.18 lb/MMBTU and 100% capacity factor)
0.15 lb/MMBTU
Mass caps (~0.37 lb/MMBTU 2010, ~0.26 lb/MMBTU 2012)
1.5 lb/MWh or 95% sulfur capture (2013)
NOx
Short term rates (0.15 lb/MMBTU 2009, 0.125 lb/MMBTU 2012)
Mass cap (based on 0.1 lb/MMBTU and 100% capacity factor)
0.1 lb/MMBTU
Mass caps (~0.15 lb/MMBTU 2009, ~0.125 lb/MMBTU 2012)
1.0 - 0.7 lb/MWh (2013)
Mercury
Short term rates (1.0 lb/TBTU or 80% removal 2009, 0.6 lb/TBTU or 90% removal 2012)
CAMR mass caps
3 mg/MWh
23 oz/TBTU (or 80% removal) 2010, 12 oz/MMBTU (or 90% removal) 2013
0.0075 lb/GWhor 85% contorl(2008), 0.0025 lb/GWh or 95% control (2012)
0.024 lb/GWh or 80% control (2010), 0.12 lb/GWh or 90% control (2015)
0.01lb/GWh or 80% capture (2009), 0.006-0.0025 lb/GWh or 90-95% capture (2013)
Particulate Being Evaluated 0.03 lb/MMBTU
0.03 - 0.15 lb/MMBTU (2013)

39
Proposal: Additional Provisions
Repowering IncentiveUnits with enforceable commitments to repower in the near termAlternative interim emission rates
Otherwise Flared Fuel Credit - emissions that would have been flared may be deducted from actual emissions

40
Proposal: Additional Provisions
Combined Heat and Power Credit - thermal output may be subtracted from actual emissions
Non-emitting Resource Credit - the generating capacity of the simultaneous non-emitting resource may be added to the generating source when calculating its effective emission rate

41
Related Initiatives
CAIR will be a separate requirementMulti-P Reg. ensures reductions occur in DECAIR FIP/SIP to address regional reductionsOTC is assisting DE in evaluating need for tighter than CAIR NOX and SO2 caps based on regional attainment modeling.

42
Related Initiatives
CAMRDE will not participate in CAMR program Multi-P Reg. will be satisfy CAMR requirements
Regional Haze and Direct PM2.5 RACT. Need to consider how to address direct PM emissions further.Regional Greenhouse Gas Initiative ( RGGI) will be developed under a separate regulation at a later date.

43
Regulatory Development Timeline
Public Workshop/Information Sessions: Late July/August 2006Proposal: In September 1st 2006 DE RegisterPublic Hearing: end of SeptemberEffective Date: November 11, 2006Compliance Date: January 2009/12

44
Next Meeting
At this time we anticipate holding one or two additional committee meetings to discuss:
Treatment of particulate matterThe details of the regulatory language.