del monte pacific limited strengthening our core
TRANSCRIPT

c o r eo u r
AnnuAl
RepoRt
FY2017
S t r e n g t h e n i n g
Del Monte Pacific liMiteD
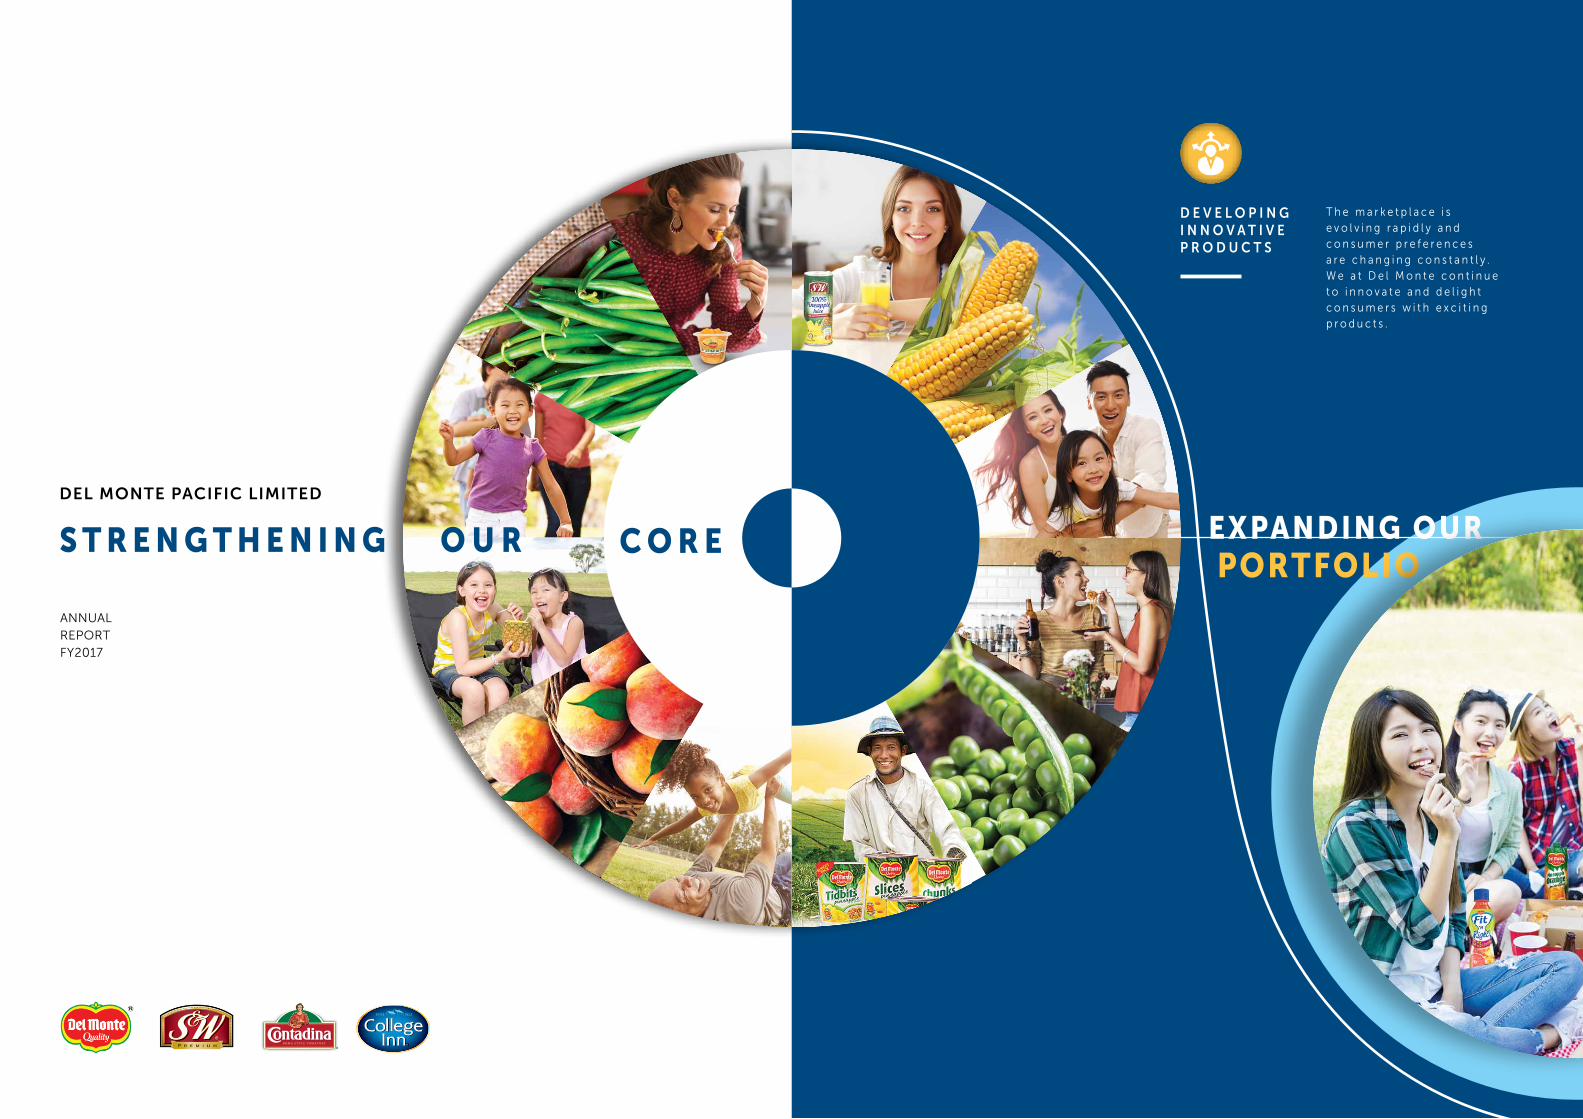
expanding ourportfolio
D e v e l o P i n g i n n o v a t i v e P r o D u c t s
t h e m a r k e t p l a c e i s e v o l v i n g r a p i d l y a n d c o n s u m e r p r e f e r e n c e s a r e c h a n g i n g c o n s t a n t l y . W e a t D e l M o n t e c o n t i n u e t o i n n o v a t e a n d d e l i g h t c o n s u m e r s w i t h e x c i t i n g p r o d u c t s .
c o r eo u r
AnnuAl
RepoRt
FY2017
S t r e n g t h e n i n g
Del Monte Pacific liMiteD
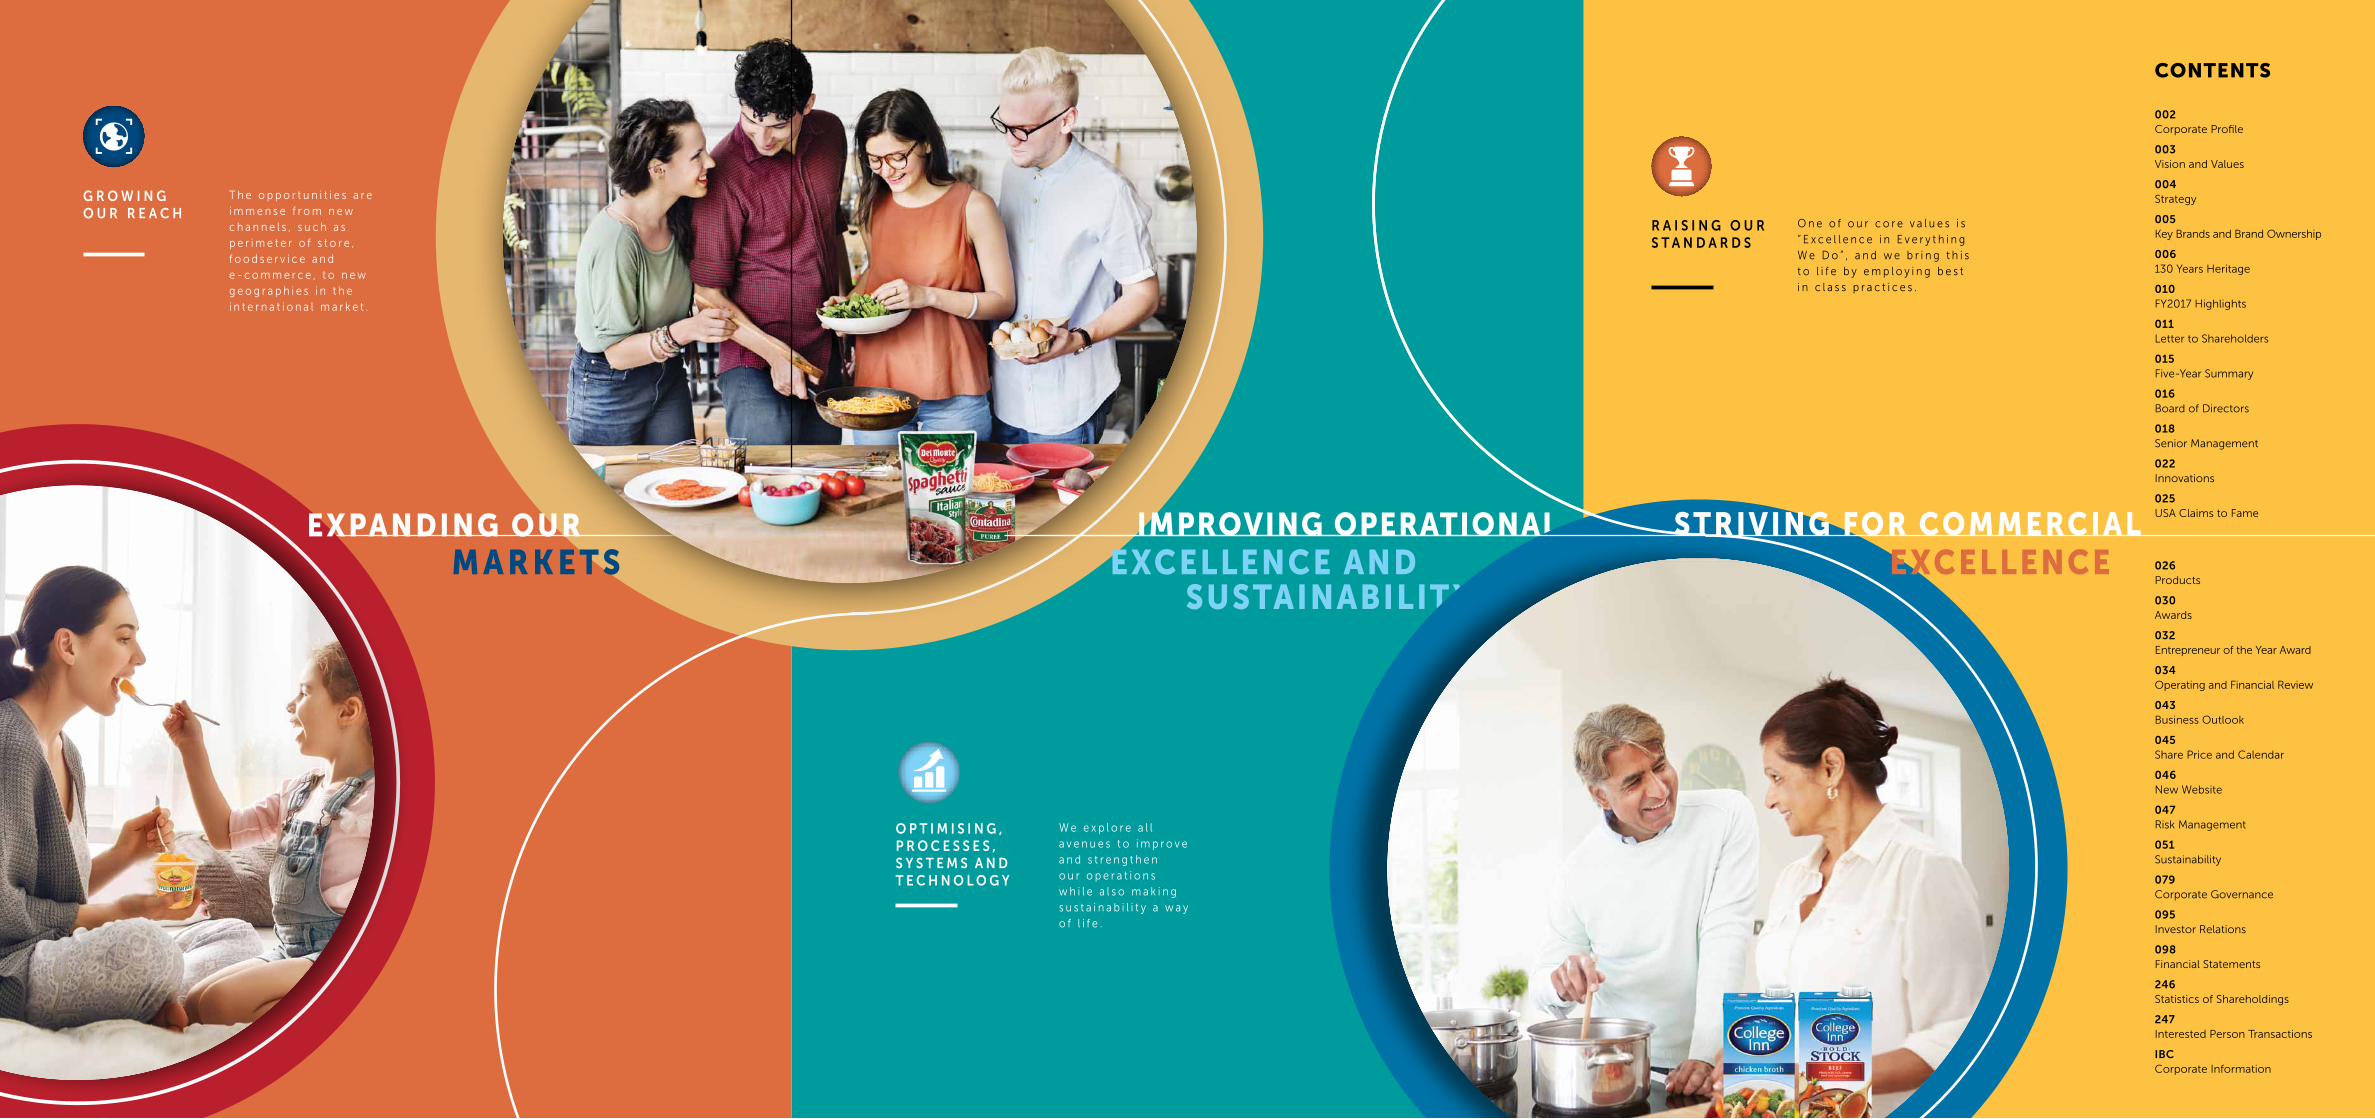
o p t i M i s i n g , p r o c e s s e s , s Y s t e M s a n D t e c H n o l o g Y
excellence andimproVing operational
W e e x p l o r e a l l a v e n u e s t o i m p r o v e a n d s t r e n g t h e n o u r o p e r a t i o n s w h i l e a l s o m a k i n g s u s t a i n a b i l i t y a w a y o f l i f e .
g r o W i n g o u r r e a c H
expanding ourm a r K e t S
T h e o p p o r t u n i t i e s a r e i m m e n s e f r o m n e w c h a n n e l s , s u c h a s p e r i m e t e r o f s t o r e , f o o d s e r v i c e a n d e - c o m m e r c e , t o n e w g e o g r a p h i e s i n t h e i n t e r n a t i o n a l m a r k e t .
SuStainabilit y
r a i s i n g o u r s t a n D a r D s
StriVing for commercialexcellence
o n e o f o u r c o r e v a l u e s i s “ e x c e l l e n c e i n e v e r y t h i n g W e D o ” , a n d w e b r i n g t h i s t o l i f e b y e m p l o y i n g b e s t i n c l a s s p r a c t i c e s .
contentS
002 Corporate profile
003 Vision and Values
004 Strategy
005 Key Brands and Brand ownership
006 130 Years Heritage
010 FY2017 Highlights
011 letter to Shareholders
015 Five-Year Summary
016 Board of Directors
018 Senior Management
022 Innovations
025 uSA Claims to Fame
026 products
030 Awards
032 entrepreneur of the Year Award
034 operating and Financial Review
043 Business outlook
045 Share price and Calendar
046 new Website
047 Risk Management
051 Sustainability
079 Corporate Governance
095 Investor Relations
098 Financial Statements
246 Statistics of Shareholdings
247 Interested person Transactions
iBc Corporate Information
vision & ValueS
corPorateprofile
www.delmonte.com
www.delmontepacific.com
www.swpremiumfood.com
www.contadina.com
www.collegeinn.com
www.lifegetsbetter.ph
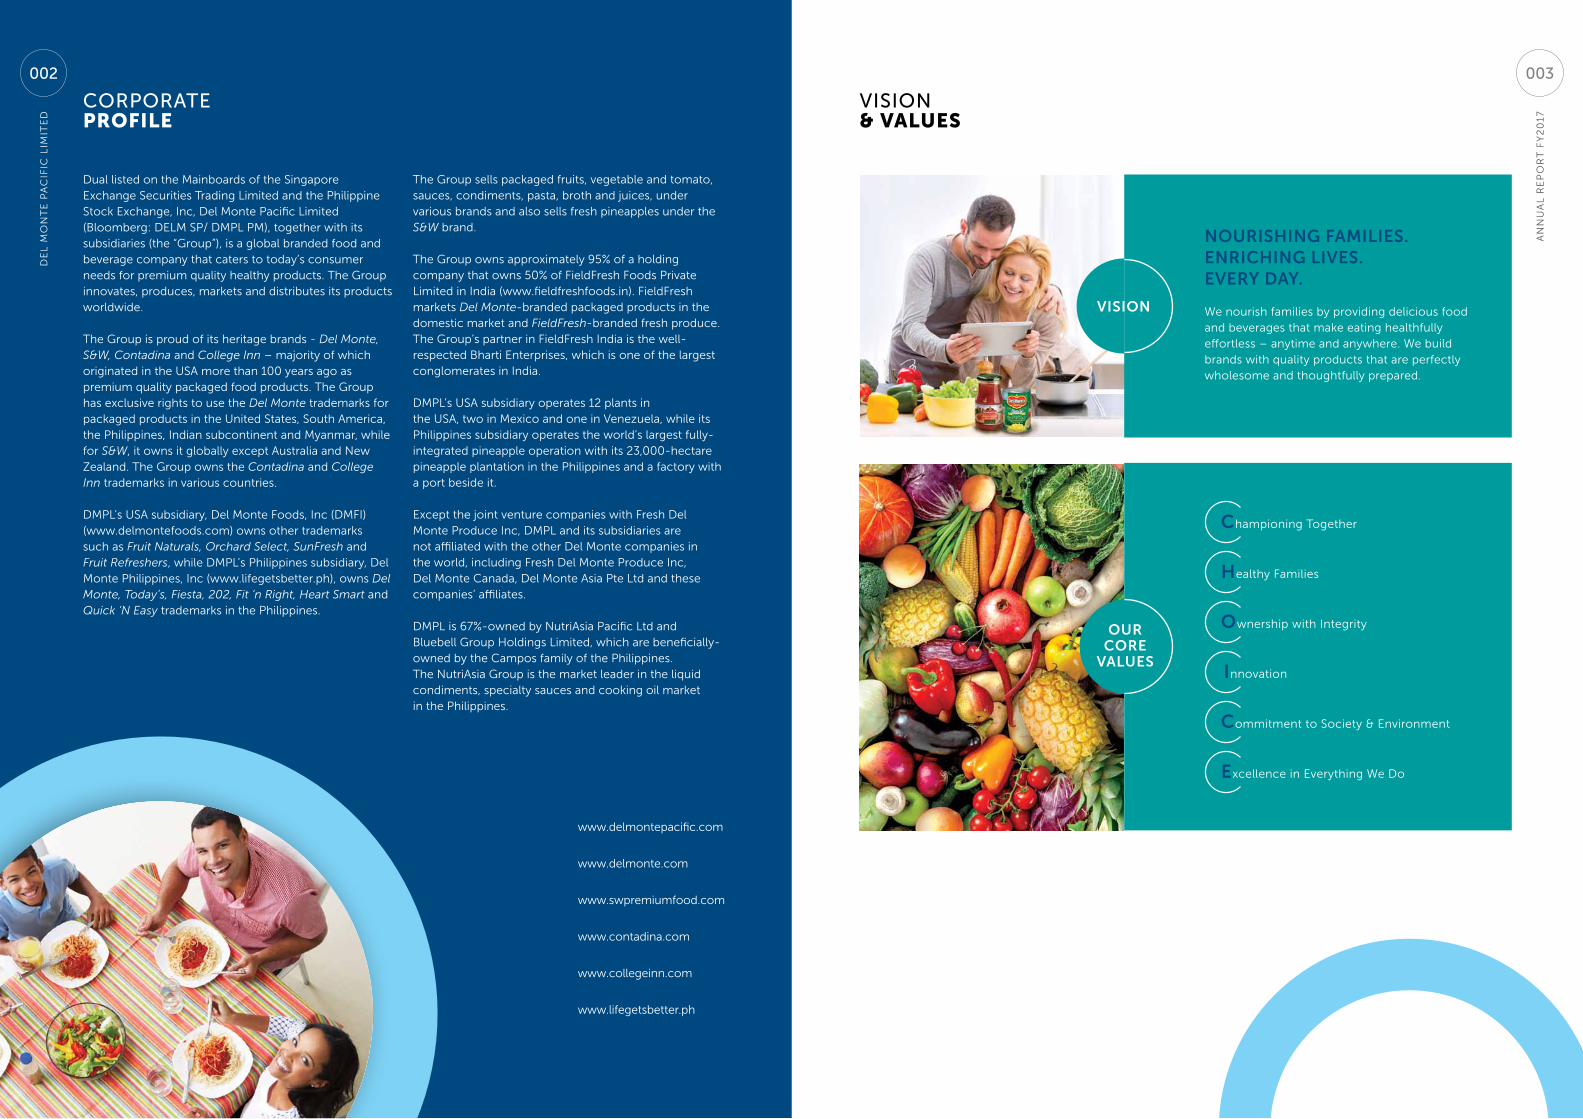
Dual listed on the Mainboards of the Singapore exchange Securities Trading limited and the philippine Stock exchange, Inc, Del Monte pacific limited (Bloomberg: DelM Sp/ DMpl pM), together with its subsidiaries (the “Group”), is a global branded food and beverage company that caters to today’s consumer needs for premium quality healthy products. The Group innovates, produces, markets and distributes its products worldwide.
The Group is proud of its heritage brands - Del Monte, S&W, Contadina and College Inn – majority of which originated in the uSA more than 100 years ago as premium quality packaged food products. The Group has exclusive rights to use the Del Monte trademarks for packaged products in the united States, South America, the philippines, Indian subcontinent and Myanmar, while for S&W, it owns it globally except Australia and new Zealand. The Group owns the Contadina and College Inn trademarks in various countries.
DMpl’s uSA subsidiary, Del Monte Foods, Inc (DMFI) (www.delmontefoods.com) owns other trademarks such as Fruit Naturals, Orchard Select, SunFresh and Fruit Refreshers, while DMpl’s philippines subsidiary, Del Monte philippines, Inc (www.lifegetsbetter.ph), owns Del Monte, Today’s, Fiesta, 202, Fit ‘n Right, Heart Smart and Quick ‘N Easy trademarks in the philippines.
The Group sells packaged fruits, vegetable and tomato, sauces, condiments, pasta, broth and juices, under various brands and also sells fresh pineapples under the S&W brand.
The Group owns approximately 95% of a holding company that owns 50% of FieldFresh Foods private limited in India (www.fieldfreshfoods.in). FieldFresh markets Del Monte-branded packaged products in the domestic market and FieldFresh-branded fresh produce. The Group’s partner in FieldFresh India is the well-respected Bharti enterprises, which is one of the largest conglomerates in India.
DMpl’s uSA subsidiary operates 12 plants in the uSA, two in Mexico and one in Venezuela, while its philippines subsidiary operates the world’s largest fully-integrated pineapple operation with its 23,000-hectare pineapple plantation in the philippines and a factory with a port beside it.
except the joint venture companies with Fresh Del Monte produce Inc, DMpl and its subsidiaries are not affiliated with the other Del Monte companies in the world, including Fresh Del Monte produce Inc, Del Monte Canada, Del Monte Asia pte ltd and these companies’ affiliates.
DMpl is 67%-owned by nutriAsia pacific ltd and Bluebell Group Holdings limited, which are beneficially-owned by the Campos family of the philippines. The nutriAsia Group is the market leader in the liquid condiments, specialty sauces and cooking oil market in the philippines.
nourisHing faMilies.enricHing lives.everY DaY.
We nourish families by providing delicious food and beverages that make eating healthfully effortless – anytime and anywhere. We build brands with quality products that are perfectly wholesome and thoughtfully prepared.
championing Together
Healthy Families
ownership with Integrity
innovation
commitment to Society & environment
excellence in everything We Do
our core
values
vision
An
nu
Al
Re
po
RT
FY
20
17
003
De
l M
on
Te
pA
CIF
IC l
IMIT
eD
002
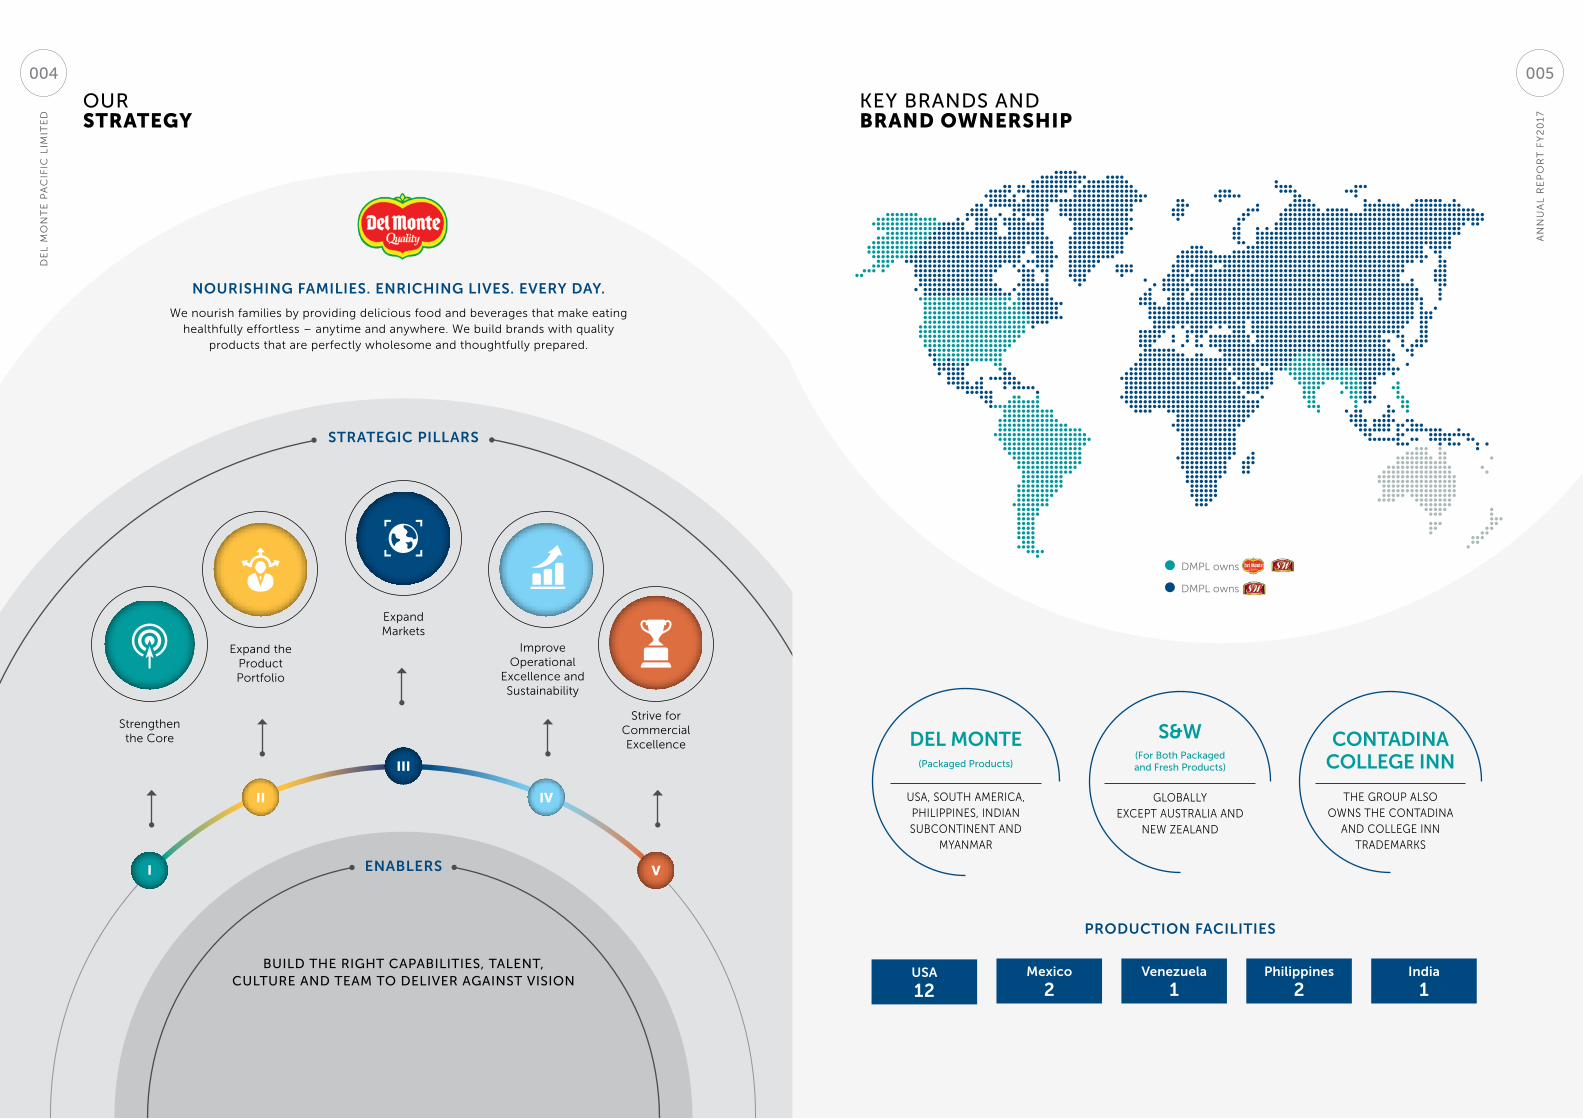
key BranDs anDbrand ownerShip
ourStrategy
key BranDs anDbrand ownerShip
nourisHing faMilies. enricHing lives. everY DaY.
We nourish families by providing delicious food and beverages that make eating healthfully effortless – anytime and anywhere. We build brands with quality
products that are perfectly wholesome and thoughtfully prepared.
i
ii
iii
iV
VenaBlers
BuilD the right caPaBilities, talent, culture anD teaM to Deliver against vision
strategic pillars
Strengthen the Core
Strive for Commercial excellence
expand the product portfolio
Improve operational
excellence and Sustainability
expand Markets
DMpl owns
DMpl owns
uSA, SouTH AMeRICA, pHIlIppIneS, InDIAn SuBConTInenT AnD
MYAnMAR
(Packaged Products)
Del Monte
THe GRoup AlSo oWnS THe ConTADInA
AnD ColleGe Inn TRADeMARKS
contaDinacollege inn
GloBAllY eXCepT AuSTRAlIA AnD
neW ZeAlAnD
(for Both Packaged and fresh Products)
s&W
proDuction facilities
usa
12venezuela
1Mexico
2philippines
2india
1
An
nu
Al
Re
po
RT
FY
20
17
De
l M
on
Te
pA
CIF
IC l
IMIT
eD
005004

1886 The Del Monte name premieres. Del Monte is used by an oakland, California food distributor on premium coffee prepared for the Hotel Del Monte on the Monterey peninsula.
1940 Fruits and vegetables in glass are introduced in the united States.
1907 The Cannery is built. one of San Francisco’s treasured landmarks, the Cannery was built in 1907 and by 1909 was the largest fruit and vegetable cannery in the world.
1892 Del Monte is first introduced as a trademarked brand.
1945Calpak begins expansion. use of pallets for storage improves distribution.
1909 The Del Monte Shield is introduced on labels. Del Monte puts Quality at the centre of its brand promise. early ads assure customers that the brand’s seal is “not a label – but a guarantee.”
1898 eighteen west coast canning companies merge to form California Fruit Canners Association (CFCA). Del Monte is one of several premium brands marketed by the new company.
1955 Del Monte pineapple grapefruit drink and stewed tomatoes are introduced.
1967 Calpak changes its name to Del Monte Corporation (DMC).
2017 DMFI and Fresh Del Monte produce create new joint ventures in retail dining, chilled beverages, chilled fruit snacks and refrigerated avocado products.
2017 DMpl lists its preference Shares on the pSe.
1999 DMC lists on the new York Stock exchange.
1979 Tobacco giant RJ Reynolds (RJR) acquires DMC.
1971 leaders in nutritional labeling - DMC becomes the first major uS food producer to voluntarily adopt nutritional labeling on all its food products.
today Del Monte sustains its quality promise for a new generation of consumers.
1999 Del Monte pacific limited (DMpl) is incorporated as parent of Del Monte philippines; DMpl lists on the Singapore exchange.
1911 packaging innovation - the sanitary three-piece can replaces hand-soldered containers to better preserve product integrity.
1916 CFCA merges with three other large canners to create California packing Corporation (Calpak), with Del Monte as the primary brand.
1996DMC fully divests from Del Monte philippines to philippines-based Macondray & Co, Inc and europe-based Del Monte International.
1917 Calpak becomes the first uS fruit and vegetable processor to advertise nationally.
1983 Biscuit-maker nabisco buys RJR. DMC becomes part of the RJR nabisco business.
2001 DMC acquires the S&W brand.
1988 KKR acquires RJR nabisco in an event touted by Time magazine as the biggest leveraged buyout at the time.
2002 DMC acquires pet food, baby food, Star*Kist tuna, College Inn broth, and private label soup businesses of HJ Heinz.
2011 KKR investor group reacquires DMC and takes it private.
1989 DMC divides into two separate entities - Del Monte Tropical Fruit (fresh division) and Del Monte Foods (processed division).
2006 nutriAsia pacific limited acquires 85% of DMpl.
2013 DMpl lists on the philippine Stock exchange (pSe).
1993 A new owner of Del Monte Tropical Fruit changes name to Fresh Del Monte produce.
2007 DMpl buys the S&W brand for Asia and eMeA from DMC.
2014 KKR sells the consumer food business of DMC to DMpl Group. The uS company that now owns this business is Del Monte Foods, Inc (DMFI). DMpl is re-united with the uS Del Monte. KKR changes the name of the old company from DMC to Big Heart pet Brands.
2007 DMpl enters into a joint venture with the Bharti group in India to form FieldFresh Foods private ltd.
1997 Texas pacific Group purchases DMC.
1997 DMC buys the Contadina brand.
1926 Calpak sets up operations in the philippines.
our Passion for quality goes Back generations.
the Del Monte® name has been synonymous with premium foods since its debut in 1886. for generations, our company has proudly earned our reputation with a series of innovations and a singular dedication to quality.
today that commitment to quality is deeply embedded in our culture. at Del Monte, we will always strive to cultivate the best wholesome vegetables, fruits, and tomatoes to help you and your family live a life full of vitality and enjoyment.
h e r i t a g e130 Years 1900 19801880 19401920 1960 2000 today
An
nu
Al
Re
po
RT
FY
20
17
De
l M
on
Te
pA
CIF
IC l
IMIT
eD
009006
letter toShareholderS
fy2017highlightS
e X C l u D I n G T H e o n e - o F F I T e M S , T H e G R o u p ’ S R e C u R R I n G n e T p R o F I T W o u l D H A V e B e e n u S $ 4 5 . 5 M I l l I o n , S I G n I F I C A n T l Y H I G H e R V e R S u S T H e p R I o R Y e A R ’ S R e C u R R I n G n e T p R o F I T o F u S $ 2 5 . 2 M I l l I o n M A I n l Y D R I V e n B Y T H e R o B u S T p e R F o R M A n C e o F T H e A S I A n B u S I n e S S . ”
“
Dear shareholDers,
last year we launched Del Monte pacific’s vision: Nourishing families. Enriching lives. Every day. This is supported by five strategic pillars, the first of which is to strengthen the core business.
Strengthening our Core is indeed important to us as we continue to build a solid foundation to strengthen our business in the united States,
our largest market which accounts for 75% of Group sales. We continue to strengthen our business in Asia as we delivered higher results for the second year in a row.
While our business in Asia performed well in FY2017, we faced some challenges in the uSA. our Company generated sales of uS$2.3 billion in FY2017, slightly lower by 0.9% versus the prior year as higher sales from the philippines and S&W in Asia and the Middle east were offset by lower sales in the united States.
Del Monte pacific delivered a net profit of uS$24.4 million, lower than prior year period’s net profit of
uS$57.0 million as FY2017 included one-off expenses while FY2016 included a one-time net gain. More details on the one-off items are provided in the operating and Financial Review section of this report.
excluding the one-off items, the Group’s recurring net profit would have been uS$45.5 million, significantly higher versus the prior year’s recurring net profit of uS$25.2 million mainly driven by the robust performance of the Asian business.
our subsidiary in the uSA, Del Monte Foods, Inc (DMFI), achieved sales of uS$1.7 billion, down by 5% due to reduced sales in foodservice and private label business lines as well as the impact of unsuccessful low-margin uS Department of Agriculture bids.
DMFI has been focused on strengthening its leading share positions amidst canned vegetable and fruit industry contraction. For the full year, it increased its retail market share in the canned vegetable segment and maintained its share for canned fruit.
To meet the unique snacking needs of on-the-go adults, we introduced Del Monte® Fruit Refreshers™ in June 2016, the first-ever adult fruit cup. Del Monte® Fruit Refreshers™ won
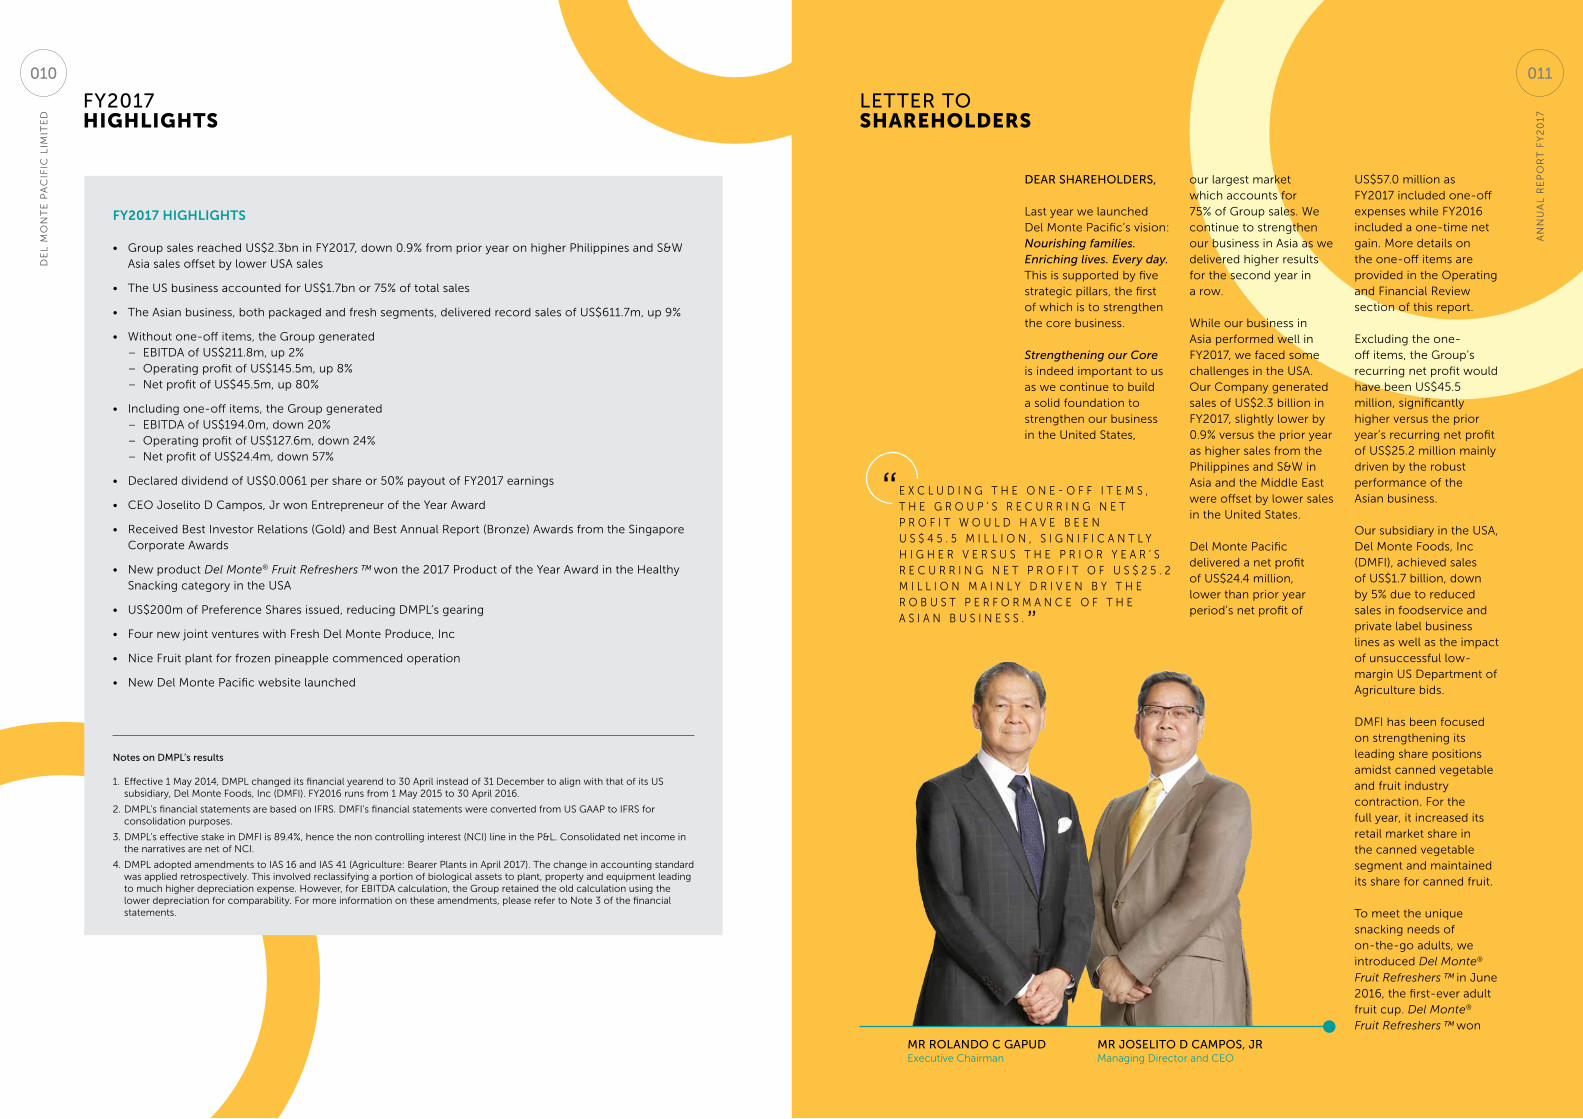
Mr Joselito D caMPos, JrManaging Director and Ceo
Mr rolanDo c gaPuDexecutive Chairman
fY2017 HigHligHts
• Group sales reached uS$2.3bn in FY2017, down 0.9% from prior year on higher philippines and S&W Asia sales offset by lower uSA sales
• The uS business accounted for uS$1.7bn or 75% of total sales
• The Asian business, both packaged and fresh segments, delivered record sales of uS$611.7m, up 9%
• Without one-off items, the Group generated– eBITDA of uS$211.8m, up 2% – operating profit of uS$145.5m, up 8%– net profit of uS$45.5m, up 80%
• Including one-off items, the Group generated– eBITDA of uS$194.0m, down 20%– operating profit of uS$127.6m, down 24%– net profit of uS$24.4m, down 57%
• Declared dividend of uS$0.0061 per share or 50% payout of FY2017 earnings
• Ceo Joselito D Campos, Jr won entrepreneur of the Year Award
• Received Best Investor Relations (Gold) and Best Annual Report (Bronze) Awards from the Singapore Corporate Awards
• new product Del Monte® Fruit Refreshers™ won the 2017 product of the Year Award in the Healthy Snacking category in the uSA
• uS$200m of preference Shares issued, reducing DMpl’s gearing
• Four new joint ventures with Fresh Del Monte produce, Inc
• nice Fruit plant for frozen pineapple commenced operation
• new Del Monte pacific website launched
notes on DMPl’s results
1. effective 1 May 2014, DMpl changed its financial yearend to 30 April instead of 31 December to align with that of its uS subsidiary, Del Monte Foods, Inc (DMFI). FY2016 runs from 1 May 2015 to 30 April 2016.
2. DMpl’s financial statements are based on IFRS. DMFI’s financial statements were converted from uS GAAp to IFRS for consolidation purposes.
3. DMpl’s effective stake in DMFI is 89.4%, hence the non controlling interest (nCI) line in the p&l. Consolidated net income in the narratives are net of nCI.
4. DMpl adopted amendments to IAS 16 and IAS 41 (Agriculture: Bearer plants in April 2017). The change in accounting standard was applied retrospectively. This involved reclassifying a portion of biological assets to plant, property and equipment leading to much higher depreciation expense. However, for eBITDA calculation, the Group retained the old calculation using the lower depreciation for comparability. For more information on these amendments, please refer to note 3 of the financial statements.
An
nu
Al
Re
po
RT
FY
20
17
De
l M
on
Te
pA
CIF
IC l
IMIT
eD
011010
letter toShareholderS
the 2017 product of the Year Award in the Healthy Snacking category in the uSA.
our business outside the uSA delivered record sales of uS$611.7 million, 9% higher against the prior year. The philippine market posted record sales of uS$329.2 million, up 6% in peso terms as all product categories – packaged fruit, beverage and culinary – generated higher sales in both retail and foodservice channels.
our Company strengthened its culinary portfolio with the launch of the Contadina brand in the philippines with nigella lawson, best-selling cookbook author, food enthusiast and TV host as brand ambassador. Contadina is a brand name known to American families for 100 years and is one of four key brands that the Group markets in the united States. DMpl brought the brand to the philippines with an exciting array of new products, including olive oil, pasta and pasta sauces.
We entered a new category - the isotonic segment – with the launch of Del Monte Fit ‘n Right Active, the first 2-in-1 Isotonic drink with electrolytes for rehydration and l-Carnitine for fat reduction.
Moreover, the foodservice channel in the philippines performed strongly on the back of expanded juice dispenser coverage and
meal tie-ups with major convenience stores and fast food chains.
Sales of the S&W business in Asia and the Middle east reached uS$120.2 million in FY2017, a record for this brand since Del Monte pacific acquired it in 2007. Sales were significantly higher by 33% on higher volume and favourable mix. S&W partnered with Goodfarmer, one of China’s leading suppliers of fruits and vegetables, through a co-branding programme. It also pursued e-commerce in China’s JD.com for its key S&W packaged products. S&W also tied up with Burger King in China and with McDonald’s in China, Hong Kong and Singapore.
Sales at our Indian joint venture FieldFresh Foods, which are equity accounted, were uS$72.9 million in FY2017, 13% stronger in rupee terms. In retail, growth was driven by the culinary category with the relaunch of an expanded mayonnaise glass bottle range as well as good traction in the olive oil portfolio. It also launched the Del Monte Dried Blueberries and Del Monte Baked Beans. The year also saw the Group extend its partnership with Kikkoman with the introduction of soy sauce in the Indian market.
FieldFresh sustained its positive eBITDA while DMpl’s share of loss in the FieldFresh joint venture in India remained flat at uS$1.6 million.
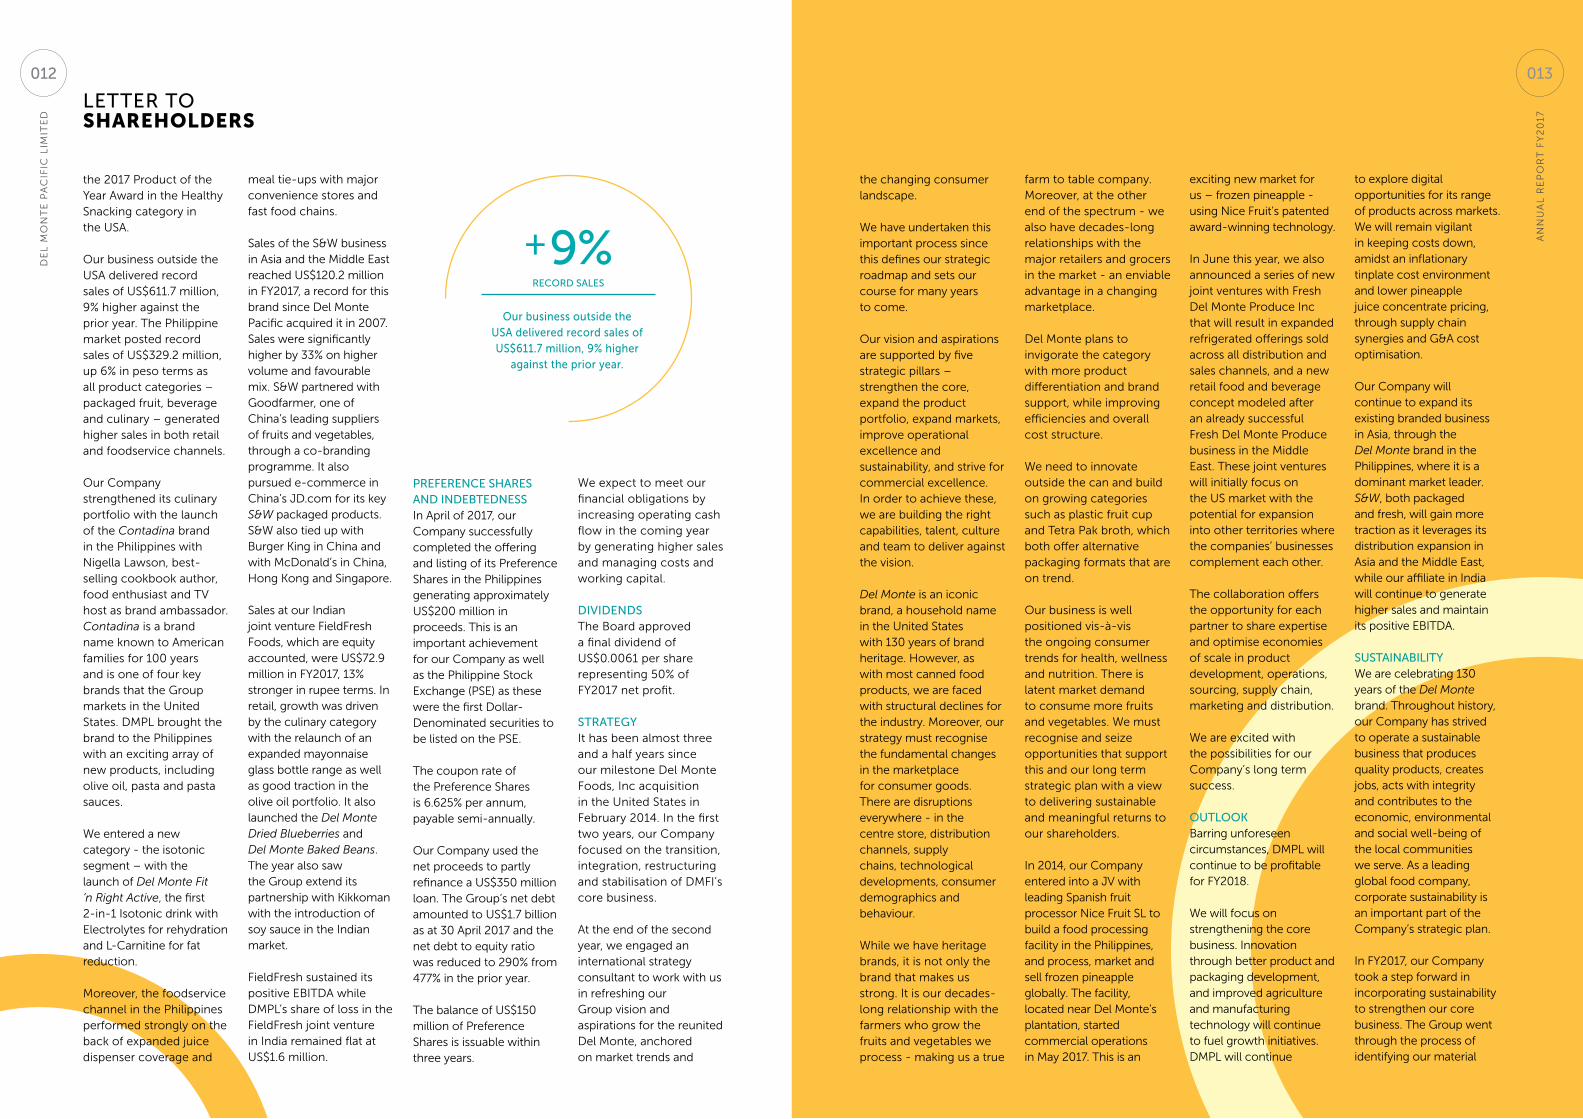
our business outside the usa delivered record sales of us$611.7 million, 9% higher
against the prior year.
recorD sales
+9%
Preference shares anD inDeBteDnessIn April of 2017, our Company successfully completed the offering and listing of its preference Shares in the philippines generating approximately uS$200 million in proceeds. This is an important achievement for our Company as well as the philippine Stock exchange (pSe) as these were the first Dollar-Denominated securities to be listed on the pSe.
The coupon rate of the preference Shares is 6.625% per annum, payable semi-annually.
our Company used the net proceeds to partly refinance a uS$350 million loan. The Group’s net debt amounted to uS$1.7 billion as at 30 April 2017 and the net debt to equity ratio was reduced to 290% from 477% in the prior year.
The balance of uS$150 million of preference Shares is issuable within three years.
the changing consumer landscape.
We have undertaken this important process since this defines our strategic roadmap and sets our course for many years to come.
our vision and aspirations are supported by five strategic pillars – strengthen the core, expand the product portfolio, expand markets, improve operational excellence and sustainability, and strive for commercial excellence. In order to achieve these, we are building the right capabilities, talent, culture and team to deliver against the vision.
Del Monte is an iconic brand, a household name in the united States with 130 years of brand heritage. However, as with most canned food products, we are faced with structural declines for the industry. Moreover, our strategy must recognise the fundamental changes in the marketplace for consumer goods. There are disruptions everywhere - in the centre store, distribution channels, supply chains, technological developments, consumer demographics and behaviour.
While we have heritage brands, it is not only the brand that makes us strong. It is our decades-long relationship with the farmers who grow the fruits and vegetables we process - making us a true
farm to table company. Moreover, at the other end of the spectrum - we also have decades-long relationships with the major retailers and grocers in the market - an enviable advantage in a changing marketplace.
Del Monte plans to invigorate the category with more product differentiation and brand support, while improving efficiencies and overall cost structure.
We need to innovate outside the can and build on growing categories such as plastic fruit cup and Tetra pak broth, which both offer alternative packaging formats that are on trend.
our business is well positioned vis-à-vis the ongoing consumer trends for health, wellness and nutrition. There is latent market demand to consume more fruits and vegetables. We must recognise and seize opportunities that support this and our long term strategic plan with a view to delivering sustainable and meaningful returns to our shareholders.
In 2014, our Company entered into a JV with leading Spanish fruit processor nice Fruit Sl to build a food processing facility in the philippines, and process, market and sell frozen pineapple globally. The facility, located near Del Monte’s plantation, started commercial operations in May 2017. This is an
exciting new market for us – frozen pineapple - using nice Fruit’s patented award-winning technology.
In June this year, we also announced a series of new joint ventures with Fresh Del Monte produce Inc that will result in expanded refrigerated offerings sold across all distribution and sales channels, and a new retail food and beverage concept modeled after an already successful Fresh Del Monte produce business in the Middle east. These joint ventures will initially focus on the uS market with the potential for expansion into other territories where the companies’ businesses complement each other.
The collaboration offers the opportunity for each partner to share expertise and optimise economies of scale in product development, operations, sourcing, supply chain, marketing and distribution.
We are excited with the possibilities for our Company’s long term success.
outlookBarring unforeseen circumstances, DMpl will continue to be profitable for FY2018.
We will focus on strengthening the core business. Innovation through better product and packaging development, and improved agriculture and manufacturing technology will continue to fuel growth initiatives. DMpl will continue
to explore digital opportunities for its range of products across markets. We will remain vigilant in keeping costs down, amidst an inflationary tinplate cost environment and lower pineapple juice concentrate pricing, through supply chain synergies and G&A cost optimisation.
our Company will continue to expand its existing branded business in Asia, through the Del Monte brand in the philippines, where it is a dominant market leader. S&W, both packaged and fresh, will gain more traction as it leverages its distribution expansion in Asia and the Middle east, while our affiliate in India will continue to generate higher sales and maintain its positive eBITDA.
sustainaBilityWe are celebrating 130 years of the Del Monte brand. Throughout history, our Company has strived to operate a sustainable business that produces quality products, creates jobs, acts with integrity and contributes to the economic, environmental and social well-being of the local communities we serve. As a leading global food company, corporate sustainability is an important part of the Company’s strategic plan.
In FY2017, our Company took a step forward in incorporating sustainability to strengthen our core business. The Group went through the process of identifying our material
We expect to meet our financial obligations by increasing operating cash flow in the coming year by generating higher sales and managing costs and working capital.
DiviDenDsThe Board approved a final dividend of uS$0.0061 per share representing 50% of FY2017 net profit.
strategyIt has been almost three and a half years since our milestone Del Monte Foods, Inc acquisition in the united States in February 2014. In the first two years, our Company focused on the transition, integration, restructuring and stabilisation of DMFI’s core business.
At the end of the second year, we engaged an international strategy consultant to work with us in refreshing our Group vision and aspirations for the reunited Del Monte, anchored on market trends and
An
nu
Al
Re
po
RT
FY
20
17
De
l M
on
Te
pA
CIF
IC l
IMIT
eD
012 013
letter toShareholderS
environmental, Social and Governance factors to prioritise the most important issues of our stakeholders. This is one of the five primary components of the Singapore exchange’s guidelines on sustainability reporting.
We are pleased to share our achievements in the united States. We were recognised as a 2016 Fruits & Veggies—More Matters® Role Model by produce for Better Health Foundation, and were awarded the leadership partner status by Feeding America.
In the philippines, we were awarded Best Industry partner in northern Mindanao from the Technical education and Skills Development Authority, while in India, our affiliate FieldFresh Foods, has been certified as a Great place To Work by the namesake organisation.
our Company stands by its commitment to grow its business in a manner that sustains a healthy
balance among diverse interests of all stakeholders – our employees and their families, business partners, customers and host communities.
awarDsSince the Singapore Corporate Awards (SCA) began in 2006, we are truly honoured to have received 4 distinct awards -- Best Managed Board, Best Chief Financial officer, Best Investor Relations and Best Annual Report – and to be one of only 14 companies who have achieved this from about 750 companies listed in Singapore.
DMpl has also won 2 Gold awards each for the Best Managed Board and Best Investor Relations, and is one of only less than 10 companies to have achieved this.
In the recent SCA in July 2017, we won the Best Investor Relations (Gold) and Best Annual Report (Bronze) Awards.
our Company has won a total of 12 awards for 8 consecutive years
since 2010, a significant achievement amongst companies listed in Singapore.
DMpl also ranked 32nd or top 5% amongst 631 Singapore-listed companies in the Singapore Governance and Transparency Index in August 2016.
We are also proud to share that our Ceo, Joselito D Campos, Jr, won the entrepreneur of the Year Award in the Asia pacific entrepreneurship Awards held in Singapore in August 2016.
We are humbled and inspired to continuously uphold and advance best in class practices, corporate governance, innovation, and excellent service.
weBsiteWe have recently revamped our corporate
website which features our four key brands – Del Monte, S&W, Contadina and College Inn, and our international F&B business. Do explore our brand heritage, trusted quality products, healthy recipes, advertisements, sustainability, governance and investor relations, plus more at www.delmontepacific.com.
aPPreciationWe thank our employees for their hard work and dedication, as we forge ahead in Strengthening our Core.
We are grateful to you, our shareholders, bankers, business partners and customers for your sustained support. And finally, we thank the Chairmen of our Board Committees and the rest of the Board members for their invaluable wise counsel.
Mr rolanDo c gaPuDexecutive Chairman
Mr Joselito D caMPos, JrManaging Director and Ceo
28 July 2017
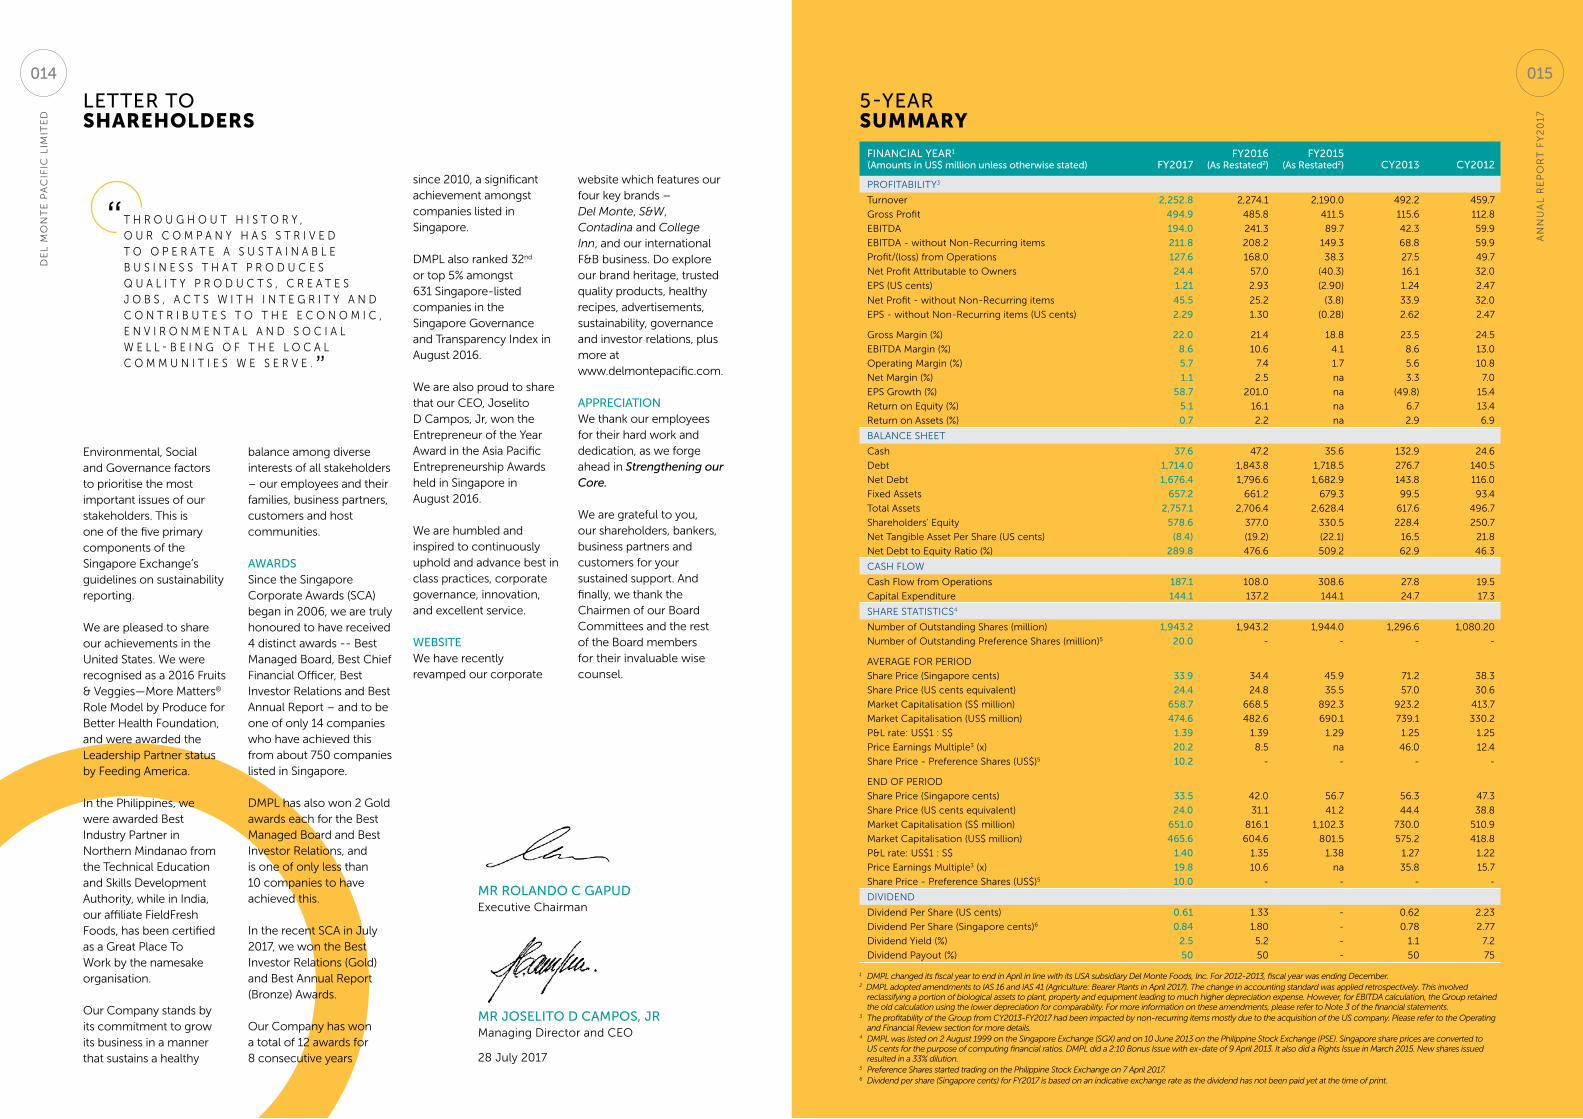
financial year1
(amounts in us$ million unless otherwise stated) fy2017fy2016
(as restated2)fy2015
(as restated2) cy2013 cy2012
pRoFITABIlITY3
Turnover 2,252.8 2,274.1 2,190.0 492.2 459.7
Gross profit 494.9 485.8 411.5 115.6 112.8
eBITDA 194.0 241.3 89.7 42.3 59.9
eBITDA - without non-Recurring items 211.8 208.2 149.3 68.8 59.9
profit/(loss) from operations 127.6 168.0 38.3 27.5 49.7
net profit Attributable to owners 24.4 57.0 (40.3) 16.1 32.0
epS (uS cents) 1.21 2.93 (2.90) 1.24 2.47
net profit - without non-Recurring items 45.5 25.2 (3.8) 33.9 32.0
epS - without non-Recurring items (uS cents) 2.29 1.30 (0.28) 2.62 2.47
Gross Margin (%) 22.0 21.4 18.8 23.5 24.5
eBITDA Margin (%) 8.6 10.6 4.1 8.6 13.0
operating Margin (%) 5.7 7.4 1.7 5.6 10.8
net Margin (%) 1.1 2.5 na 3.3 7.0
epS Growth (%) 58.7 201.0 na (49.8) 15.4
Return on equity (%) 5.1 16.1 na 6.7 13.4
Return on Assets (%) 0.7 2.2 na 2.9 6.9
BAlAnCe SHeeT
Cash 37.6 47.2 35.6 132.9 24.6
Debt 1,714.0 1,843.8 1,718.5 276.7 140.5
net Debt 1,676.4 1,796.6 1,682.9 143.8 116.0
Fixed Assets 657.2 661.2 679.3 99.5 93.4
Total Assets 2,757.1 2,706.4 2,628.4 617.6 496.7
Shareholders' equity 578.6 377.0 330.5 228.4 250.7
net Tangible Asset per Share (uS cents) (8.4) (19.2) (22.1) 16.5 21.8
net Debt to equity Ratio (%) 289.8 476.6 509.2 62.9 46.3
CASH FloW
Cash Flow from operations 187.1 108.0 308.6 27.8 19.5
Capital expenditure 144.1 137.2 144.1 24.7 17.3
SHARe STATISTICS4
number of outstanding Shares (million) 1,943.2 1,943.2 1,944.0 1,296.6 1,080.20
number of outstanding preference Shares (million)5 20.0 - - - -
AVeRAGe FoR peRIoD
Share price (Singapore cents) 33.9 34.4 45.9 71.2 38.3
Share price (uS cents equivalent) 24.4 24.8 35.5 57.0 30.6
Market Capitalisation (S$ million) 658.7 668.5 892.3 923.2 413.7
Market Capitalisation (uS$ million) 474.6 482.6 690.1 739.1 330.2
p&l rate: uS$1 : S$ 1.39 1.39 1.29 1.25 1.25
price earnings Multiple3 (x) 20.2 8.5 na 46.0 12.4
Share price - preference Shares (uS$)5 10.2 - - - -
enD oF peRIoD
Share price (Singapore cents) 33.5 42.0 56.7 56.3 47.3
Share price (uS cents equivalent) 24.0 31.1 41.2 44.4 38.8
Market Capitalisation (S$ million) 651.0 816.1 1,102.3 730.0 510.9
Market Capitalisation (uS$ million) 465.6 604.6 801.5 575.2 418.8
p&l rate: uS$1 : S$ 1.40 1.35 1.38 1.27 1.22
price earnings Multiple3 (x) 19.8 10.6 na 35.8 15.7
Share price - preference Shares (uS$)5 10.0 - - - -
DIVIDenD
Dividend per Share (uS cents) 0.61 1.33 - 0.62 2.23
Dividend per Share (Singapore cents)6 0.84 1.80 - 0.78 2.77
Dividend Yield (%) 2.5 5.2 - 1.1 7.2
Dividend payout (%) 50 50 - 50 75
1 DMPL changed its fiscal year to end in April in line with its USA subsidiary Del Monte Foods, Inc. For 2012-2013, fiscal year was ending December.2 DMPL adopted amendments to IAS 16 and IAS 41 (Agriculture: Bearer Plants in April 2017). The change in accounting standard was applied retrospectively. This involved
reclassifying a portion of biological assets to plant, property and equipment leading to much higher depreciation expense. However, for EBITDA calculation, the Group retained the old calculation using the lower depreciation for comparability. For more information on these amendments, please refer to Note 3 of the financial statements.
3 The profitability of the Group from CY2013-FY2017 had been impacted by non-recurring items mostly due to the acquisition of the US company. Please refer to the Operating and Financial Review section for more details.
4 DMPL was listed on 2 August 1999 on the Singapore Exchange (SGX) and on 10 June 2013 on the Philippine Stock Exchange (PSE). Singapore share prices are converted to US cents for the purpose of computing financial ratios. DMPL did a 2:10 Bonus Issue with ex-date of 9 April 2013. It also did a Rights Issue in March 2015. New shares issued resulted in a 33% dilution.
5 Preference Shares started trading on the Philippine Stock Exchange on 7 April 2017.6 Dividend per share (Singapore cents) for FY2017 is based on an indicative exchange rate as the dividend has not been paid yet at the time of print.
5-yearSummary
T H R o u G H o u T H I S T o R Y , o u R C o M p A n Y H A S S T R I V e D T o o p e R A T e A S u S T A I n A B l e B u S I n e S S T H A T p R o D u C e S Q u A l I T Y p R o D u C T S , C R e A T e S J o B S , A C T S W I T H I n T e G R I T Y A n D C o n T R I B u T e S T o T H e e C o n o M I C , e n V I R o n M e n T A l A n D S o C I A l W e l l - B e I n G o F T H e l o C A l C o M M u n I T I e S W e S e R V e . ”
“
An
nu
Al
Re
po
RT
FY
20
17
De
l M
on
Te
pA
CIF
IC l
IMIT
eD
015014
BoarD ofdirectorS
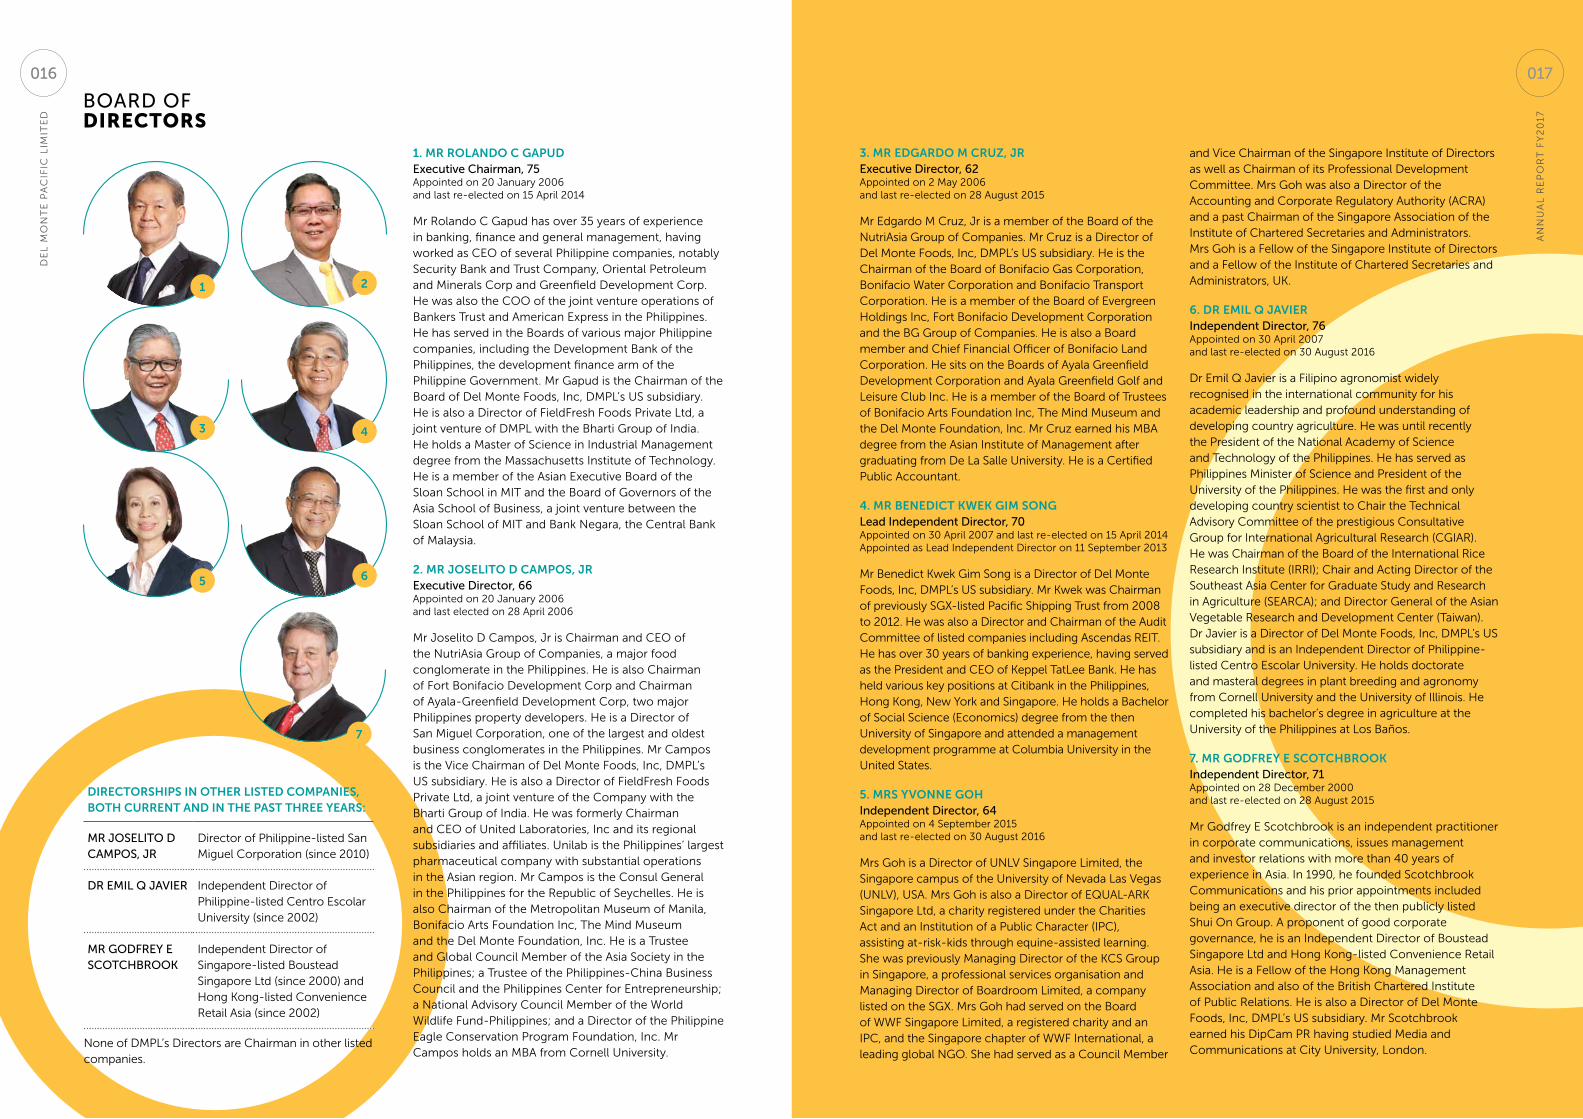
1. Mr rolanDo c gapuDexecutive chairman, 75Appointed on 20 January 2006 and last re-elected on 15 April 2014
Mr Rolando C Gapud has over 35 years of experience in banking, finance and general management, having worked as Ceo of several philippine companies, notably Security Bank and Trust Company, oriental petroleum and Minerals Corp and Greenfield Development Corp. He was also the Coo of the joint venture operations of Bankers Trust and American express in the philippines. He has served in the Boards of various major philippine companies, including the Development Bank of the philippines, the development finance arm of the philippine Government. Mr Gapud is the Chairman of the Board of Del Monte Foods, Inc, DMpl’s uS subsidiary. He is also a Director of FieldFresh Foods private ltd, a joint venture of DMpl with the Bharti Group of India. He holds a Master of Science in Industrial Management degree from the Massachusetts Institute of Technology. He is a member of the Asian executive Board of the Sloan School in MIT and the Board of Governors of the Asia School of Business, a joint venture between the Sloan School of MIT and Bank negara, the Central Bank of Malaysia.
2. Mr Joselito D caMpos, Jrexecutive Director, 66 Appointed on 20 January 2006 and last elected on 28 April 2006
Mr Joselito D Campos, Jr is Chairman and Ceo of the nutriAsia Group of Companies, a major food conglomerate in the philippines. He is also Chairman of Fort Bonifacio Development Corp and Chairman of Ayala-Greenfield Development Corp, two major philippines property developers. He is a Director of San Miguel Corporation, one of the largest and oldest business conglomerates in the philippines. Mr Campos is the Vice Chairman of Del Monte Foods, Inc, DMpl’s uS subsidiary. He is also a Director of FieldFresh Foods private ltd, a joint venture of the Company with the Bharti Group of India. He was formerly Chairman and Ceo of united laboratories, Inc and its regional subsidiaries and affiliates. unilab is the philippines’ largest pharmaceutical company with substantial operations in the Asian region. Mr Campos is the Consul General in the philippines for the Republic of Seychelles. He is also Chairman of the Metropolitan Museum of Manila, Bonifacio Arts Foundation Inc, The Mind Museum and the Del Monte Foundation, Inc. He is a Trustee and Global Council Member of the Asia Society in the philippines; a Trustee of the philippines-China Business Council and the philippines Center for entrepreneurship; a national Advisory Council Member of the World Wildlife Fund-philippines; and a Director of the philippine eagle Conservation program Foundation, Inc. Mr Campos holds an MBA from Cornell university.
3. Mr eDgarDo M cruz, Jrexecutive Director, 62Appointed on 2 May 2006 and last re-elected on 28 August 2015
Mr edgardo M Cruz, Jr is a member of the Board of the nutriAsia Group of Companies. Mr Cruz is a Director of Del Monte Foods, Inc, DMpl’s uS subsidiary. He is the Chairman of the Board of Bonifacio Gas Corporation, Bonifacio Water Corporation and Bonifacio Transport Corporation. He is a member of the Board of evergreen Holdings Inc, Fort Bonifacio Development Corporation and the BG Group of Companies. He is also a Board member and Chief Financial officer of Bonifacio land Corporation. He sits on the Boards of Ayala Greenfield Development Corporation and Ayala Greenfield Golf and leisure Club Inc. He is a member of the Board of Trustees of Bonifacio Arts Foundation Inc, The Mind Museum and the Del Monte Foundation, Inc. Mr Cruz earned his MBA degree from the Asian Institute of Management after graduating from De la Salle university. He is a Certified public Accountant.
4. Mr BeneDict KWeK giM songlead independent Director, 70Appointed on 30 April 2007 and last re-elected on 15 April 2014 Appointed as lead Independent Director on 11 September 2013
Mr Benedict Kwek Gim Song is a Director of Del Monte Foods, Inc, DMpl’s uS subsidiary. Mr Kwek was Chairman of previously SGX-listed pacific Shipping Trust from 2008 to 2012. He was also a Director and Chairman of the Audit Committee of listed companies including Ascendas ReIT. He has over 30 years of banking experience, having served as the president and Ceo of Keppel Tatlee Bank. He has held various key positions at Citibank in the philippines, Hong Kong, new York and Singapore. He holds a Bachelor of Social Science (economics) degree from the then university of Singapore and attended a management development programme at Columbia university in the united States.
5. Mrs Yvonne goHindependent Director, 64Appointed on 4 September 2015 and last re-elected on 30 August 2016
Mrs Goh is a Director of unlV Singapore limited, the Singapore campus of the university of nevada las Vegas (unlV), uSA. Mrs Goh is also a Director of eQuAl-ARK Singapore ltd, a charity registered under the Charities Act and an Institution of a public Character (IpC), assisting at-risk-kids through equine-assisted learning. She was previously Managing Director of the KCS Group in Singapore, a professional services organisation and Managing Director of Boardroom limited, a company listed on the SGX. Mrs Goh had served on the Board of WWF Singapore limited, a registered charity and an IpC, and the Singapore chapter of WWF International, a leading global nGo. She had served as a Council Member
and Vice Chairman of the Singapore Institute of Directors as well as Chairman of its professional Development Committee. Mrs Goh was also a Director of the Accounting and Corporate Regulatory Authority (ACRA) and a past Chairman of the Singapore Association of the Institute of Chartered Secretaries and Administrators. Mrs Goh is a Fellow of the Singapore Institute of Directors and a Fellow of the Institute of Chartered Secretaries and Administrators, uK.
6. Dr eMil Q Javierindependent Director, 76 Appointed on 30 April 2007 and last re-elected on 30 August 2016
Dr emil Q Javier is a Filipino agronomist widely recognised in the international community for his academic leadership and profound understanding of developing country agriculture. He was until recently the president of the national Academy of Science and Technology of the philippines. He has served as philippines Minister of Science and president of the university of the philippines. He was the first and only developing country scientist to Chair the Technical Advisory Committee of the prestigious Consultative Group for International Agricultural Research (CGIAR). He was Chairman of the Board of the International Rice Research Institute (IRRI); Chair and Acting Director of the Southeast Asia Center for Graduate Study and Research in Agriculture (SeARCA); and Director General of the Asian Vegetable Research and Development Center (Taiwan). Dr Javier is a Director of Del Monte Foods, Inc, DMpl’s uS subsidiary and is an Independent Director of philippine-listed Centro escolar university. He holds doctorate and masteral degrees in plant breeding and agronomy from Cornell university and the university of Illinois. He completed his bachelor’s degree in agriculture at the university of the philippines at los Baños.
7. Mr goDfreY e scotcHBrooKindependent Director, 71Appointed on 28 December 2000 and last re-elected on 28 August 2015
Mr Godfrey e Scotchbrook is an independent practitioner in corporate communications, issues management and investor relations with more than 40 years of experience in Asia. In 1990, he founded Scotchbrook Communications and his prior appointments included being an executive director of the then publicly listed Shui on Group. A proponent of good corporate governance, he is an Independent Director of Boustead Singapore ltd and Hong Kong-listed Convenience Retail Asia. He is a Fellow of the Hong Kong Management Association and also of the British Chartered Institute of public Relations. He is also a Director of Del Monte Foods, Inc, DMpl’s uS subsidiary. Mr Scotchbrook earned his DipCam pR having studied Media and Communications at City university, london.
1 2
4
6
3
5
7
DirectorsHips in otHer listeD coMpanies, BotH current anD in tHe past tHree Years:
Mr Joselito D caMPos, Jr
Director of philippine-listed San Miguel Corporation (since 2010)
Dr eMil q Javier Independent Director of philippine-listed Centro escolar university (since 2002)
Mr goDfrey e scotchBrook
Independent Director of Singapore-listed Boustead Singapore ltd (since 2000) and Hong Kong-listed Convenience Retail Asia (since 2002)
none of DMpl’s Directors are Chairman in other listed companies.
An
nu
Al
Re
po
RT
FY
20
17
De
l M
on
Te
pA
CIF
IC l
IMIT
eD
016 017
seniormanagement
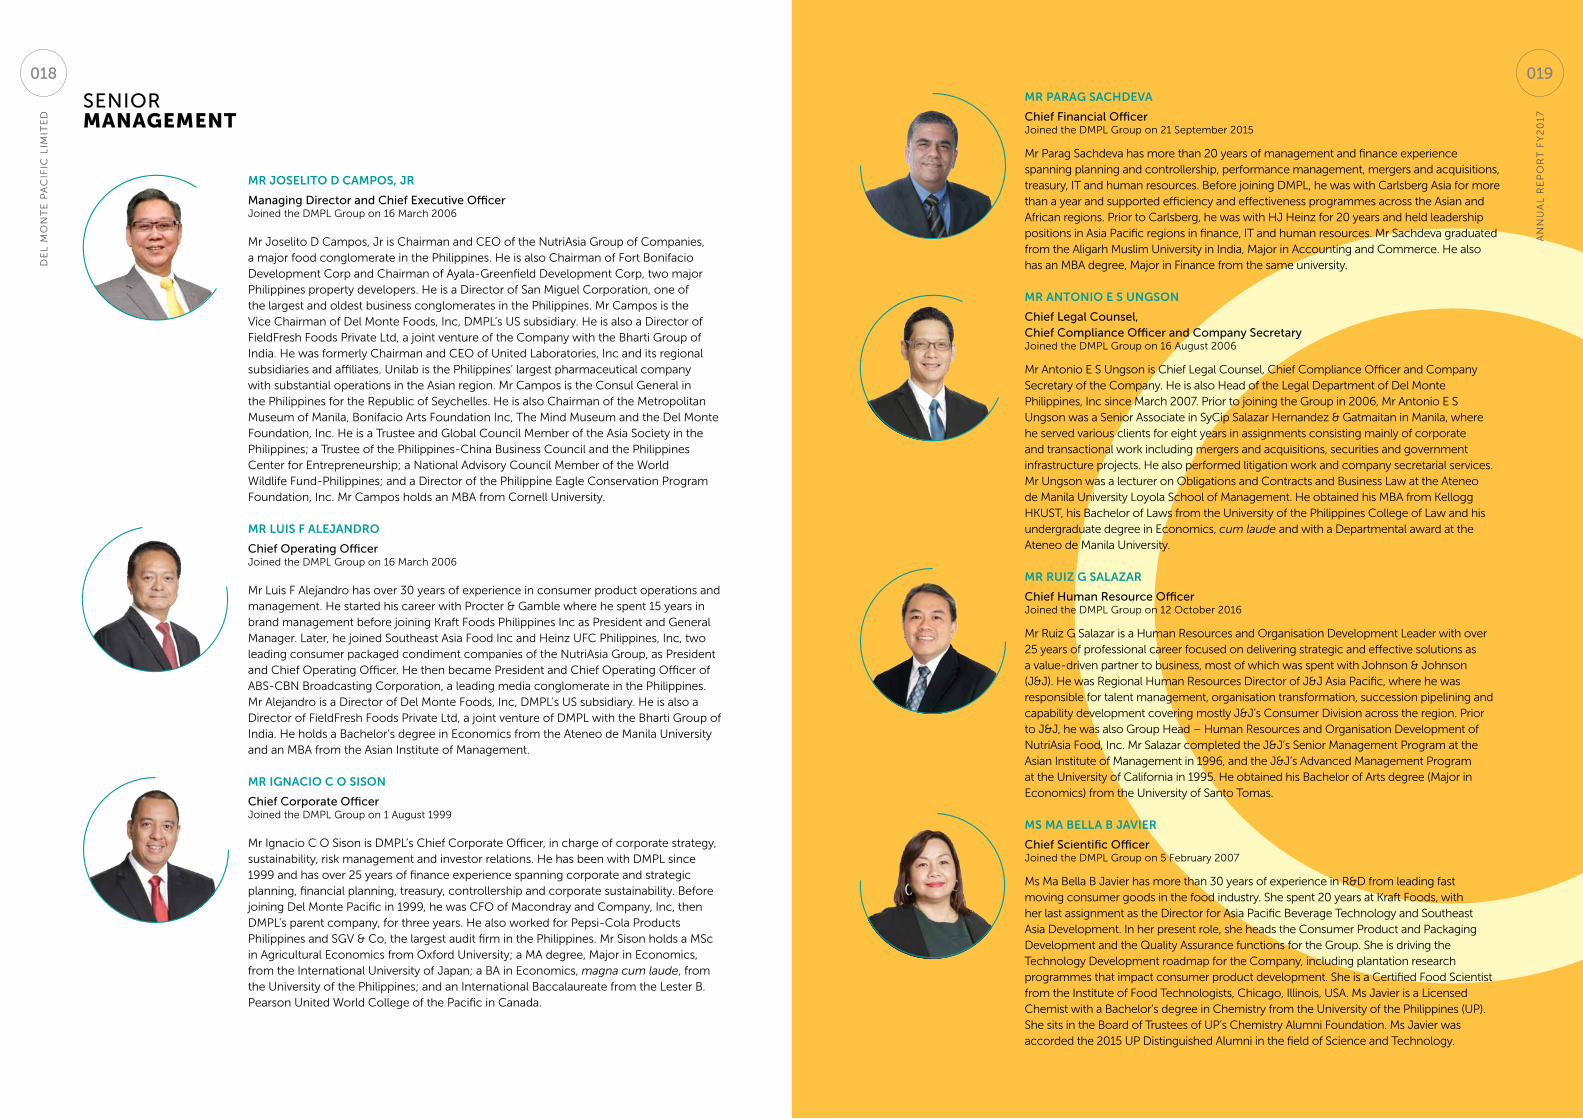
Mr Joselito D caMpos, Jr
Managing Director and chief executive officerJoined the DMpl Group on 16 March 2006
Mr Joselito D Campos, Jr is Chairman and Ceo of the nutriAsia Group of Companies, a major food conglomerate in the philippines. He is also Chairman of Fort Bonifacio Development Corp and Chairman of Ayala-Greenfield Development Corp, two major philippines property developers. He is a Director of San Miguel Corporation, one of the largest and oldest business conglomerates in the philippines. Mr Campos is the Vice Chairman of Del Monte Foods, Inc, DMpl’s uS subsidiary. He is also a Director of FieldFresh Foods private ltd, a joint venture of the Company with the Bharti Group of India. He was formerly Chairman and Ceo of united laboratories, Inc and its regional subsidiaries and affiliates. unilab is the philippines’ largest pharmaceutical company with substantial operations in the Asian region. Mr Campos is the Consul General in the philippines for the Republic of Seychelles. He is also Chairman of the Metropolitan Museum of Manila, Bonifacio Arts Foundation Inc, The Mind Museum and the Del Monte Foundation, Inc. He is a Trustee and Global Council Member of the Asia Society in the philippines; a Trustee of the philippines-China Business Council and the philippines Center for entrepreneurship; a national Advisory Council Member of the World Wildlife Fund-philippines; and a Director of the philippine eagle Conservation program Foundation, Inc. Mr Campos holds an MBA from Cornell university.
Mr luis f aleJanDro
chief operating officerJoined the DMpl Group on 16 March 2006
Mr luis F Alejandro has over 30 years of experience in consumer product operations and management. He started his career with procter & Gamble where he spent 15 years in brand management before joining Kraft Foods philippines Inc as president and General Manager. later, he joined Southeast Asia Food Inc and Heinz uFC philippines, Inc, two leading consumer packaged condiment companies of the nutriAsia Group, as president and Chief operating officer. He then became president and Chief operating officer of ABS-CBn Broadcasting Corporation, a leading media conglomerate in the philippines. Mr Alejandro is a Director of Del Monte Foods, Inc, DMpl’s uS subsidiary. He is also a Director of FieldFresh Foods private ltd, a joint venture of DMpl with the Bharti Group of India. He holds a Bachelor’s degree in economics from the Ateneo de Manila university and an MBA from the Asian Institute of Management.
Mr ignacio c o sison
chief corporate officerJoined the DMpl Group on 1 August 1999
Mr Ignacio C o Sison is DMpl’s Chief Corporate officer, in charge of corporate strategy, sustainability, risk management and investor relations. He has been with DMpl since 1999 and has over 25 years of finance experience spanning corporate and strategic planning, financial planning, treasury, controllership and corporate sustainability. Before joining Del Monte pacific in 1999, he was CFo of Macondray and Company, Inc, then DMpl’s parent company, for three years. He also worked for pepsi-Cola products philippines and SGV & Co, the largest audit firm in the philippines. Mr Sison holds a MSc in Agricultural economics from oxford university; a MA degree, Major in economics, from the International university of Japan; a BA in economics, magna cum laude, from the university of the philippines; and an International Baccalaureate from the lester B. pearson united World College of the pacific in Canada.
Mr parag sacHDeva
chief financial officerJoined the DMpl Group on 21 September 2015
Mr parag Sachdeva has more than 20 years of management and finance experience spanning planning and controllership, performance management, mergers and acquisitions, treasury, IT and human resources. Before joining DMpl, he was with Carlsberg Asia for more than a year and supported efficiency and effectiveness programmes across the Asian and African regions. prior to Carlsberg, he was with HJ Heinz for 20 years and held leadership positions in Asia pacific regions in finance, IT and human resources. Mr Sachdeva graduated from the Aligarh Muslim university in India, Major in Accounting and Commerce. He also has an MBA degree, Major in Finance from the same university.
Mr antonio e s ungson
chief legal counsel, chief compliance officer and company secretaryJoined the DMpl Group on 16 August 2006
Mr Antonio e S ungson is Chief legal Counsel, Chief Compliance officer and Company Secretary of the Company. He is also Head of the legal Department of Del Monte philippines, Inc since March 2007. prior to joining the Group in 2006, Mr Antonio e S ungson was a Senior Associate in SyCip Salazar Hernandez & Gatmaitan in Manila, where he served various clients for eight years in assignments consisting mainly of corporate and transactional work including mergers and acquisitions, securities and government infrastructure projects. He also performed litigation work and company secretarial services. Mr ungson was a lecturer on obligations and Contracts and Business law at the Ateneo de Manila university loyola School of Management. He obtained his MBA from Kellogg HKuST, his Bachelor of laws from the university of the philippines College of law and his undergraduate degree in economics, cum laude and with a Departmental award at the Ateneo de Manila university.
Mr ruiz g salazar
chief human resource officerJoined the DMpl Group on 12 october 2016
Mr Ruiz G Salazar is a Human Resources and organisation Development leader with over 25 years of professional career focused on delivering strategic and effective solutions as a value-driven partner to business, most of which was spent with Johnson & Johnson (J&J). He was Regional Human Resources Director of J&J Asia pacific, where he was responsible for talent management, organisation transformation, succession pipelining and capability development covering mostly J&J’s Consumer Division across the region. prior to J&J, he was also Group Head – Human Resources and organisation Development of nutriAsia Food, Inc. Mr Salazar completed the J&J’s Senior Management program at the Asian Institute of Management in 1996, and the J&J’s Advanced Management program at the university of California in 1995. He obtained his Bachelor of Arts degree (Major in economics) from the university of Santo Tomas.
Ms Ma Bella B Javier
chief scientific officerJoined the DMpl Group on 5 February 2007
Ms Ma Bella B Javier has more than 30 years of experience in R&D from leading fast moving consumer goods in the food industry. She spent 20 years at Kraft Foods, with her last assignment as the Director for Asia pacific Beverage Technology and Southeast Asia Development. In her present role, she heads the Consumer product and packaging Development and the Quality Assurance functions for the Group. She is driving the Technology Development roadmap for the Company, including plantation research programmes that impact consumer product development. She is a Certified Food Scientist from the Institute of Food Technologists, Chicago, Illinois, uSA. Ms Javier is a licensed Chemist with a Bachelor’s degree in Chemistry from the university of the philippines (up). She sits in the Board of Trustees of up’s Chemistry Alumni Foundation. Ms Javier was accorded the 2015 up Distinguished Alumni in the field of Science and Technology.
An
nu
Al
Re
po
RT
FY
20
17
De
l M
on
Te
pA
CIF
IC l
IMIT
eD
019018

seniormanagement
Del Monte fooDs, inc
Del Monte PhiliPPines, inc
s&w fine fooDs international ltD
1
1
1
2
2
2
3
3
3
4
4
4
5
5
5
6
6
6 7 8 9
7 8 9
Del Monte fooDs, inc
1. John clark
SVp, Chief Human Resources officer
2. gene allen
SVp, Chief Financial officer
3. DaviD Meyers
Interim Ceo and Chief operating officer
4. eMManuel nisPeros
SVp, office of the executive Committee
5. williaM sawyers
SVp, General Counsel, Chief Compliance officer, Secretary
6. DaviD withycoMBe
SVp, Chief operations officer
Del Monte pHilippines, inc
1. Patrick Dino
Group Head, Customer Development
2. aMante aguilar
Group Head, Supply Chain
3. eileen asuncion
Group Head, Marketing
4. francisco Molas
Group Head, Mindanao operations
5. Joselito caMPos, Jr
president and Ceo
6. luis aleJanDro
General Manager and Coo
7. cesar canlas
Group Head, Information Technology
8. gerarD Bautista
Group Head, Corporate Human Resources
9. lana Parungao
Group Head, Food Service
10. angel gatchalian, Jr
Group Head, Corporate procurement
s&W fine fooDs international ltD
1. Marco verDeflor
Commercial Manager, China, Korea and Taiwan(Fresh)
2. fritz Matti
Commercial Manager, Japan(Fresh and packaged)
3. suMarleki aMJah
Head, ASeAn, MenA and Indian subcontinent (packaged)
4. sharin reBolliDo
Commercial Manager, China, Korea, Hong Kong and Taiwan (packaged)
5. tan chooi khiM
General Manager
6. MuDasir tak
Commercial Manager, Middle east, Africa and South Asia(Fresh and packaged)
7. richarD lin
Commercial Manager, China (Fresh and packaged)
8. warunee ‘gaye’ karnasuta
Commercial Manager, europe, Middle east and Africa (packaged)
9. yaP siew ling ‘ison’
Commercial Manager, europe, Middle east and Africa (packaged)
10
An
nu
Al
Re
po
RT
FY
20
17
De
l M
on
Te
pA
CIF
IC l
IMIT
eD
021020

innoVationS
nourisHing faMilies. enricHing lives. everY DaY.With our vision, we would like to share our Innovations journey across our markets. Innovation is at the heart of being able to nourish families with delicious food and beverages that make eating healthfully effortless – anytime and anywhere. It is our hope that, by doing so, we are able to enrich lives every day.
Del Monte, s&w, contaDina anD college inn in usaIn the three years since Del Monte pacific acquired the Del Monte consumer food business in the uS, significant strides have been made in introducing new, more convenient and environment-friendly products to the American public. DMpl’s uS subsidiary, Del Monte Foods, has taken a leadership role in meeting consumer preferences.
To meet the unique snacking needs of on-the-go adults, Del Monte Foods introduced Del Monte® Fruit Refreshers™ in June 2016. Fruit Refreshers are the first-ever adult fruit cup, bringing unexpected fruit flavours and exciting combinations in refreshing fruit waters. each 7oz adult-sized cup provides 1 full serving of fruit and is less than 100 calories. Fruit Refreshers are available in four delicious flavours - pineapple in passion Fruit Water, Mandarin oranges in Coconut Water, Grapefruit & oranges in pomegranate Fruit Water, and Grapefruit in pink Guava Fruit Water. Del
Monte® Fruit Refreshers™ won the 2017 product of the Year Award in the Healthy Snacking category in the uSA. The product of the Year Award is the world’s largest consumer-voted award for product innovation where winners are backed by the votes of 40,000 consumers in a national representative survey conducted by research firm Kantar TnS.
To address developing culinary trends amongst its loyal consumer-base, the Group launched College Inn Bold Stock in Beef and Chicken flavours.
Del Monte also forged ahead to meet consumer demand for organic products with 9 new Del Monte® Organic Cut Tomato items and 3 new Contadina® organic SKus.
Del Monte has met American consumer expectations for transparency in labeling and for non-GMo products by certifying that the majority of Del Monte® brand vegetable products, 95% of Del Monte® brand tomato products, and all Del Monte® Fruit Cup® snacks are made without genetically engineered ingredients. The vegetables, tomatoes, and fruits used in Del Monte products have always been non-GMo, but other ingredients like sweeteners, thickeners, seasonings, and the like were not. It took innovative product development and supply chain assurance programmes to make this happen.
Del Monte has also been an innovation leader in working with our packaging suppliers to develop, qualify through rigorous testing, and commercially implement BpA-nI (BpA non Intent) packaging. These programmes now permit 100% of Del Monte® tomato products, and nearly all of Del Monte® vegetable and fruit products, to be packaged in containers that do not use BpA in the packaging production. This packaging innovation helps ensure that Del Monte is a trusted source of high-quality food products and satisfies evolving regulatory requirements.
Del Monte anD contaDina in the PhiliPPinesIn the past ten years, the Group has launched a slew of new products using breakthrough technologies in ingredients, packaging and processes. Health and wellness has been the anchor for new product introductions, with the consumers’ health needs in mind. Finding solutions to address emerging health issues has led to a host of innovative products that offer clinically-proven benefits, from promoting weight management and body fat reduction, to cholesterol lowering and bone health advantage.
The beverage portfolio in the philippines offers a range of Del Monte Fit ‘n Right Juice Drinks with Green Coffee extract and l-Carnitine proven to result in body fat reduction with diet and exercise; 100% Pineapple Juice HeartSmart with Reducol™, a special blend of plant sterols and stanols that help lower bad cholesterol; and 100% Pineapple Juice BoneSmart™, a calcium-fortified juice that has twice the level of calcium than a glass of milk, designed to provide the same benefit to the lactose-intolerant consumers.
The Group entered the isotonic segment, a new category – with the launch of Del Monte Fit ‘n Right Active, the first
2-in-1 Isotonic drink with electrolytes for rehydration and l-Carnitine for fat reduction. The Group also launched Del Monte Fizzy Juice Drinks in select foodservice accounts. These are carbonated juices to tap into new consumer segments and new consumption occasions.
From a study, it was established that consumption of a small can of Del Monte Pineapple Tidbits a day increased the production of granulocytes, which make up 60% of the body’s white blood cells, known as the body’s first line of defence against infection. In order to make the product more accessible everyday for consumers, a low-cash outlay pack format was developed. Del Monte Pineapple Tidbits was introduced in a Stand-up pouch (Sup) format, the first in the market to offer an affordable format that encourages increased consumption, not only for enjoyment but also for better immunity.
The portfolio of products that offer healthier choices has expanded: 100% Pineapple Juice fortified with vitamins A, C & e, 100% Fiber-Enriched Pineapple Juice, 100-Calorie Fruit Cups, lycopene-rich tomato sauces and ketchup; no-MSG culinary sauces and cooking aids.
We have a selection of Quick ‘n Easy cooking aids that provide easy-to-prepare everyday dishes for novice cooks, while Del Monte Creamy & Cheesy Spaghetti Sauce is our creamiest and cheesiest ever. This red sauce is made from lycopene-rich and naturally sweet California tomatoes, now made even more delicious with added real cream and cheddar cheese.
We launched Contadina olive oil, pasta, pasta sauces and canned tomatoes. Contadina takes to heart the Mediterranean philosophy of cooking with passion, using only the finest ingredients to deliver rich and authentic flavours. Grown and hand-picked from the most fertile regions of the world, our premium quality products boast flavours worth savouring.
The Group also re-introduced Del Monte Extra-Rich Tomato Ketchup and Del Monte Extra-Rich Banana Ketchup, now noticeably thicker and richer in flavour and colour, because they are made with high quality ingredients to boost their deliciously genuine and tangy taste.
Del Monte® Fruit Refreshers™, the first-ever adult fruit cup, won the 2017 Product of the Year Award in the Healthy Snacking category in the USA
Shift to non-GMO and non-BPA cans
Healthier range of College Inn broth and stock products
Culinary aids for great-tasting dishesInnovative Del Monte juices
An
nu
Al
Re
po
RT
FY
20
17
De
l M
on
Te
pA
CIF
IC l
IMIT
eD
023022
innoVationS
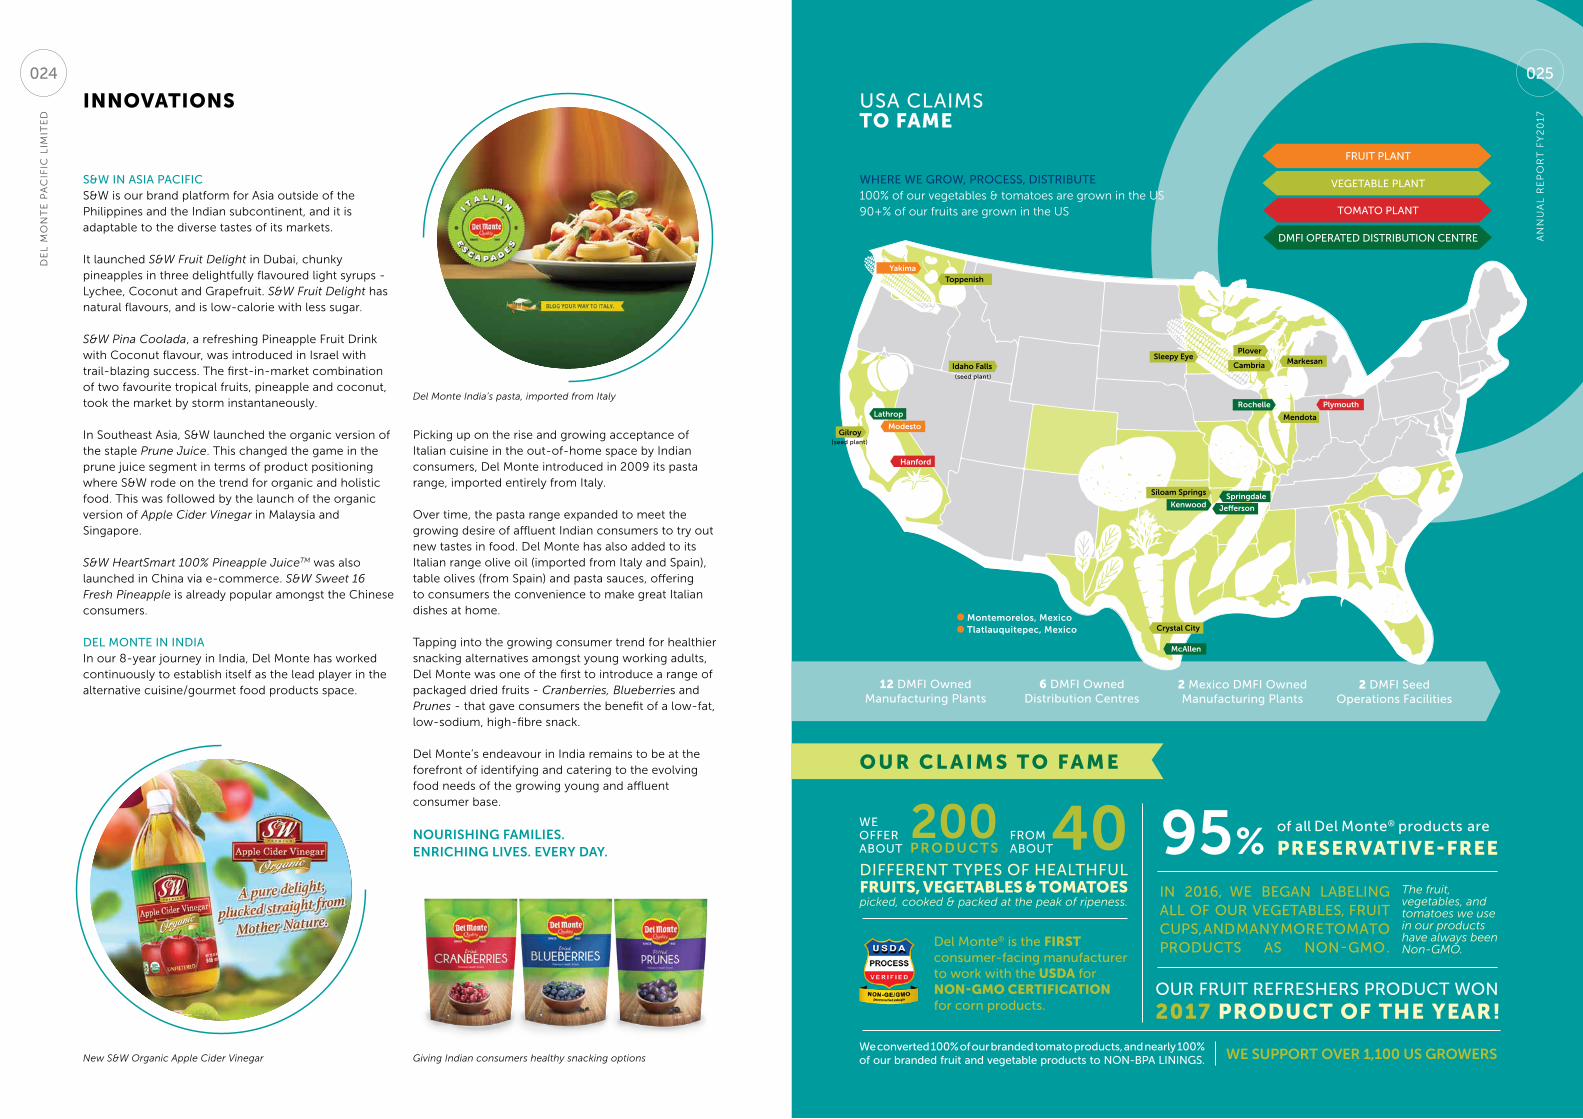
s&w in asia PacificS&W is our brand platform for Asia outside of the philippines and the Indian subcontinent, and it is adaptable to the diverse tastes of its markets.
It launched S&W Fruit Delight in Dubai, chunky pineapples in three delightfully flavoured light syrups - lychee, Coconut and Grapefruit. S&W Fruit Delight has natural flavours, and is low-calorie with less sugar.
S&W Pina Coolada, a refreshing pineapple Fruit Drink with Coconut flavour, was introduced in Israel with trail-blazing success. The first-in-market combination of two favourite tropical fruits, pineapple and coconut, took the market by storm instantaneously. In Southeast Asia, S&W launched the organic version of the staple Prune Juice. This changed the game in the prune juice segment in terms of product positioning where S&W rode on the trend for organic and holistic food. This was followed by the launch of the organic version of Apple Cider Vinegar in Malaysia and Singapore.
S&W HeartSmart 100% Pineapple JuiceTM was also launched in China via e-commerce. S&W Sweet 16 Fresh Pineapple is already popular amongst the Chinese consumers.
Del Monte in inDiaIn our 8-year journey in India, Del Monte has worked continuously to establish itself as the lead player in the alternative cuisine/gourmet food products space.
picking up on the rise and growing acceptance of Italian cuisine in the out-of-home space by Indian consumers, Del Monte introduced in 2009 its pasta range, imported entirely from Italy. over time, the pasta range expanded to meet the growing desire of affluent Indian consumers to try out new tastes in food. Del Monte has also added to its Italian range olive oil (imported from Italy and Spain), table olives (from Spain) and pasta sauces, offering to consumers the convenience to make great Italian dishes at home.
Tapping into the growing consumer trend for healthier snacking alternatives amongst young working adults, Del Monte was one of the first to introduce a range of packaged dried fruits - Cranberries, Blueberries and Prunes - that gave consumers the benefit of a low-fat, low-sodium, high-fibre snack.
Del Monte’s endeavour in India remains to be at the forefront of identifying and catering to the evolving food needs of the growing young and affluent consumer base.
nourisHing faMilies. enricHing lives. everY DaY.
New S&W Organic Apple Cider Vinegar Giving Indian consumers healthy snacking options
Del Monte India’s pasta, imported from Italy
usa claiMsto fame
Montemorelos, Mexicotlatlauquitepec, Mexico
Yakima
toppenish
idaho falls
gilroy
lathrop
Modesto
Hanford
sleepy eyeplover
Markesan
siloam springs
Kenwoodspringdale
Jefferson
Mcallen
plymouth
Mendota
rochelle
cambria
crystal city
(seed plant)
(seed plant)
fruit Plant
toMato Plant
DMfi oPerateD DistriBution centre
vegetaBle Plantwhere we grow, Process, DistriBute100% of our vegetables & tomatoes are grown in the uS 90+% of our fruits are grown in the uS
12 DMfi owned Manufacturing Plants
40 95%p r o D u c t s200
we offer aBout
froM aBout
of all Del Monte® products are
The fruit, vegetables, and tomatoes we use in our products have always been Non-GMO.
Del Monte® is the firSt consumer-facing manufacturer to work with the uSda for non-gmo certification for corn products.
in 2016, we Began laBeling all of our vegetaBles, fruit cuPs, anD Many More toMato ProDucts as non-gMo.
We support over 1,100 us groWers
o u r c l a i m S t o fa m e
Different tyPes of healthful fruitS, VegetableS & tomatoeSpicked, cooked & packed at the peak of ripeness.
preSerVatiVe-free
our fruit refreshers ProDuct won
2017 product of the year!
we converted 100% of our branded tomato products, and nearly 100% of our branded fruit and vegetable products to non-BPa linings.
6 DMfi owned Distribution centres
2 Mexico DMfi owned Manufacturing Plants
2 DMfi seed operations facilities
An
nu
Al
Re
po
RT
FY
20
17
025
De
l M
on
Te
pA
CIF
IC l
IMIT
eD
024
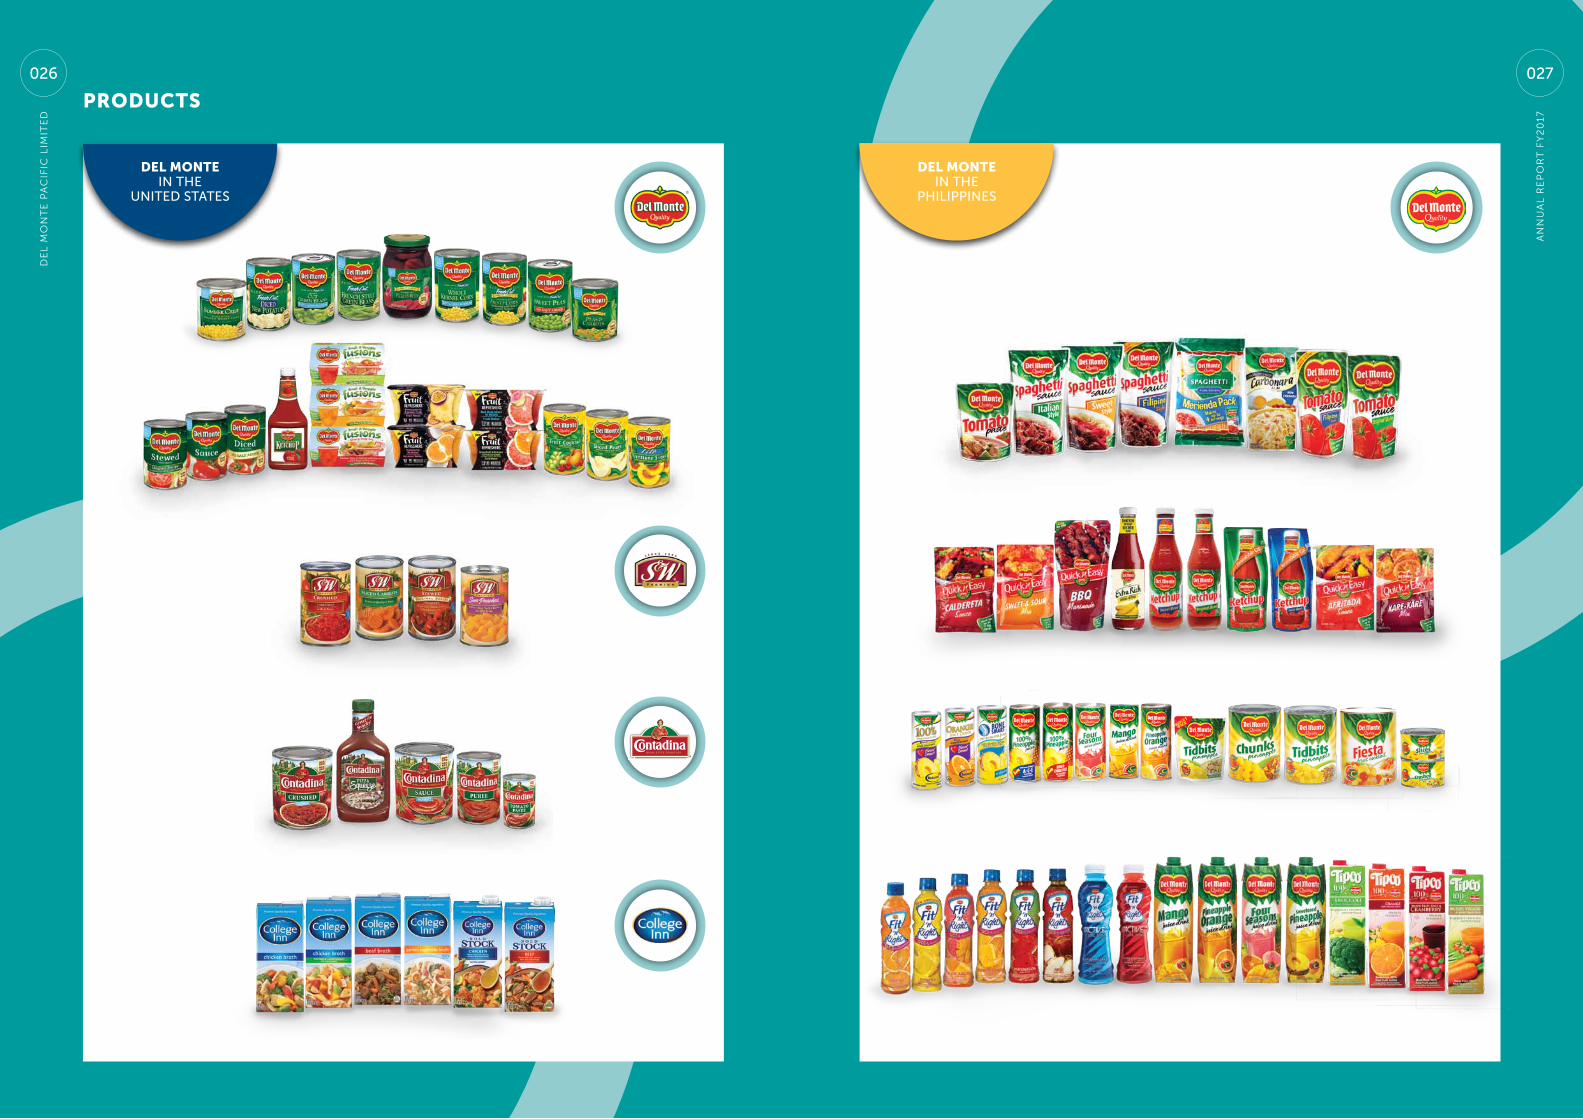
productS
del monte in the
PhiliPPines
del monte in the
uniteD states
An
nu
Al
Re
po
RT
FY
20
17
027
De
l M
on
Te
pA
CIF
IC l
IMIT
eD
026
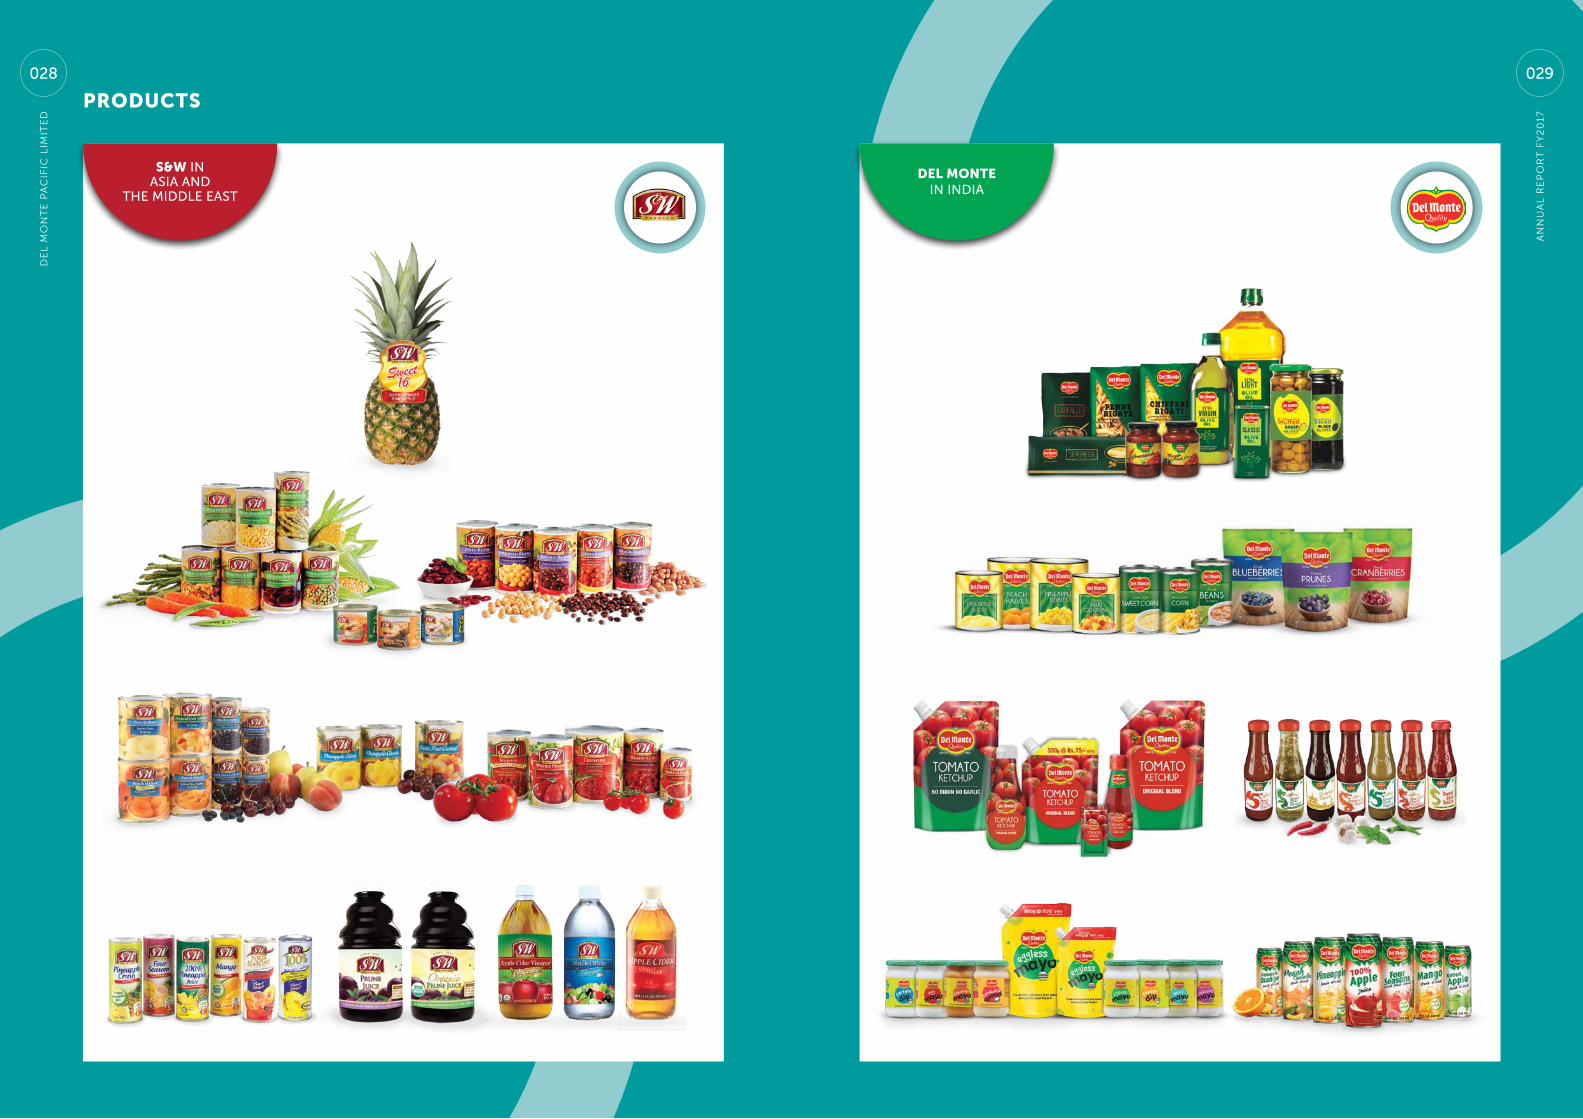
productS
del monte in inDia
S&w in asia anD
the MiDDle east
029
De
l M
on
Te
pA
CIF
IC l
IMIT
eD
028
An
nu
Al
Re
po
RT
FY
20
17
awardS
governance
Del Monte Pacific wins at the singaPore corPorate awarDsSince the Singapore Corporate Awards (SCA) began in 2006, Del Monte pacific ltd has received 4 distinct awards - Best Managed Board, Best CFo, Best Investor Relations and Best Annual Report – and is one of only 14 companies to have achieved this from about 750 companies listed in Singapore.
DMpl has also won 2 Gold awards each for the Best Managed Board and Best Investor Relations, and is one of only less than 10 companies to have achieved this.
In the recent SCA on 18 July 2017, DMpl was honoured to receive the Best Investor Relations (Gold) and Best Annual Report (Bronze) Awards.
listed companies in the Singapore Governance and Transparency Index in August 2016
• Ranked #28 amongst Top 100 largest Singapore-listed companies in the ASeAn Corporate Governance Scorecard in April 2016
coMMercial
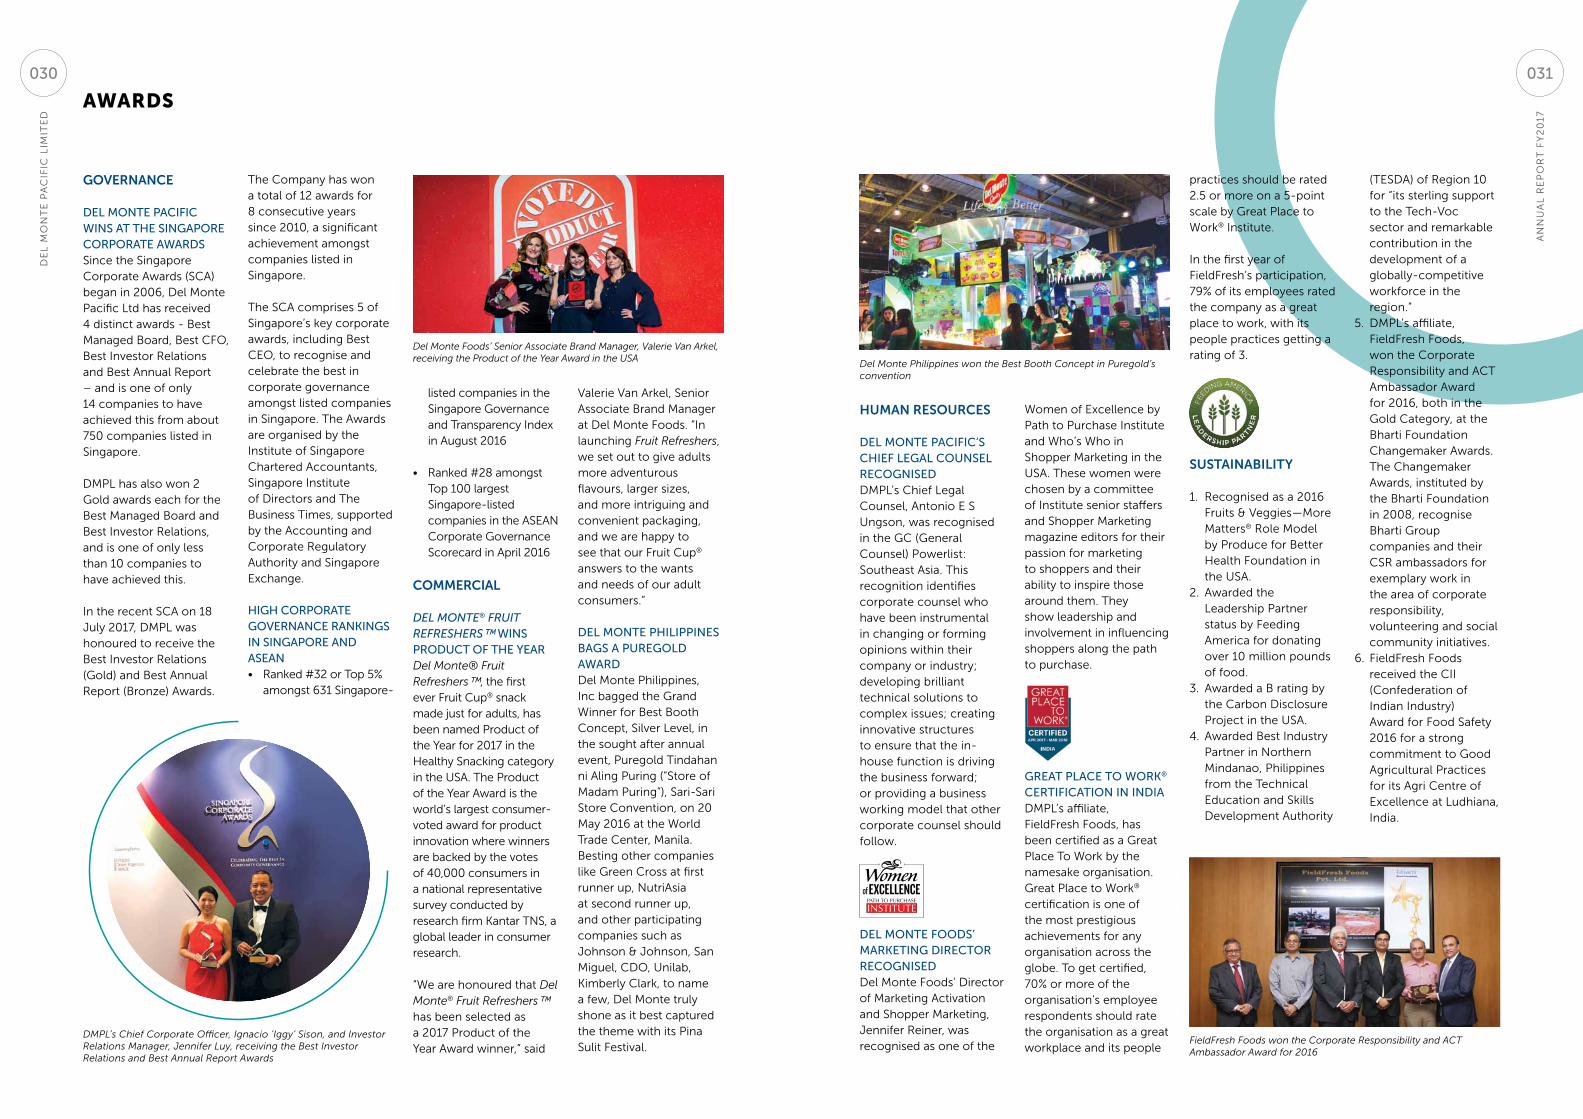
DEl MoNtE® Fruit rEFrEShErS™ wins ProDuct of the yearDel Monte® Fruit Refreshers™, the first ever Fruit Cup® snack made just for adults, has been named product of the Year for 2017 in the Healthy Snacking category in the uSA. The product of the Year Award is the world’s largest consumer-voted award for product innovation where winners are backed by the votes of 40,000 consumers in a national representative survey conducted by research firm Kantar TnS, a global leader in consumer research.
“We are honoured that Del Monte® Fruit Refreshers™ has been selected as a 2017 product of the Year Award winner,” said
Valerie Van Arkel, Senior Associate Brand Manager at Del Monte Foods. “In launching Fruit Refreshers, we set out to give adults more adventurous flavours, larger sizes, and more intriguing and convenient packaging, and we are happy to see that our Fruit Cup® answers to the wants and needs of our adult consumers.”
Del Monte PhiliPPines Bags a PuregolD awarDDel Monte philippines, Inc bagged the Grand Winner for Best Booth Concept, Silver level, in the sought after annual event, puregold Tindahan ni Aling puring (“Store of Madam puring”), Sari-Sari Store Convention, on 20 May 2016 at the World Trade Center, Manila. Besting other companies like Green Cross at first runner up, nutriAsia at second runner up, and other participating companies such as Johnson & Johnson, San Miguel, CDo, unilab, Kimberly Clark, to name a few, Del Monte truly shone as it best captured the theme with its pina Sulit Festival.
HuMan resources
Del Monte Pacific’s chief legal counsel recogniseDDMpl’s Chief legal Counsel, Antonio e S ungson, was recognised in the GC (General Counsel) powerlist: Southeast Asia. This recognition identifies corporate counsel who have been instrumental in changing or forming opinions within their company or industry; developing brilliant technical solutions to complex issues; creating innovative structures to ensure that the in-house function is driving the business forward; or providing a business working model that other corporate counsel should follow.
Del Monte fooDs’ Marketing Director recogniseDDel Monte Foods’ Director of Marketing Activation and Shopper Marketing, Jennifer Reiner, was recognised as one of the
Women of excellence by path to purchase Institute and Who’s Who in Shopper Marketing in the uSA. These women were chosen by a committee of Institute senior staffers and Shopper Marketing magazine editors for their passion for marketing to shoppers and their ability to inspire those around them. They show leadership and involvement in influencing shoppers along the path to purchase.
great Place to work® certification in inDiaDMpl’s affiliate, FieldFresh Foods, has been certified as a Great place To Work by the namesake organisation. Great place to Work® certification is one of the most prestigious achievements for any organisation across the globe. To get certified, 70% or more of the organisation’s employee respondents should rate the organisation as a great workplace and its people
DMPL’s Chief Corporate Officer, Ignacio ‘Iggy’ Sison, and Investor Relations Manager, Jennifer Luy, receiving the Best Investor Relations and Best Annual Report Awards
practices should be rated 2.5 or more on a 5-point scale by Great place to Work® Institute.
In the first year of FieldFresh’s participation, 79% of its employees rated the company as a great place to work, with its people practices getting a rating of 3.
sustainaBilitY
1. Recognised as a 2016 Fruits & Veggies—More Matters® Role Model by produce for Better Health Foundation in the uSA.
2. Awarded the leadership partner status by Feeding America for donating over 10 million pounds of food.
3. Awarded a B rating by the Carbon Disclosure project in the uSA.
4. Awarded Best Industry partner in northern Mindanao, philippines from the Technical education and Skills Development Authority
(TeSDA) of Region 10 for “its sterling support to the Tech-Voc sector and remarkable contribution in the development of a globally-competitive workforce in the region.”
5. DMpl’s affiliate, FieldFresh Foods, won the Corporate Responsibility and ACT Ambassador Award for 2016, both in the Gold Category, at the Bharti Foundation Changemaker Awards.The Changemaker Awards, instituted by the Bharti Foundation in 2008, recognise Bharti Group companies and their CSR ambassadors for exemplary work in the area of corporate responsibility, volunteering and social community initiatives.
6. FieldFresh Foods received the CII (Confederation of Indian Industry) Award for Food Safety 2016 for a strong commitment to Good Agricultural practices for its Agri Centre of excellence at ludhiana, India.
Del Monte Foods’ Senior Associate Brand Manager, Valerie Van Arkel, receiving the Product of the Year Award in the USA
Del Monte Philippines won the Best Booth Concept in Puregold’s convention
FieldFresh Foods won the Corporate Responsibility and ACT Ambassador Award for 2016
The Company has won a total of 12 awards for 8 consecutive years since 2010, a significant achievement amongst companies listed in Singapore.
The SCA comprises 5 of Singapore’s key corporate awards, including Best Ceo, to recognise and celebrate the best in corporate governance amongst listed companies in Singapore. The Awards are organised by the Institute of Singapore Chartered Accountants, Singapore Institute of Directors and The Business Times, supported by the Accounting and Corporate Regulatory Authority and Singapore exchange.
high corPorate governance rankings in singaPore anD asean• Ranked #32 or Top 5%
amongst 631 Singapore-
An
nu
Al
Re
po
RT
FY
20
17
De
l M
on
Te
pA
CIF
IC l
IMIT
eD
031030
entrepreneur of tHe Year aWarD
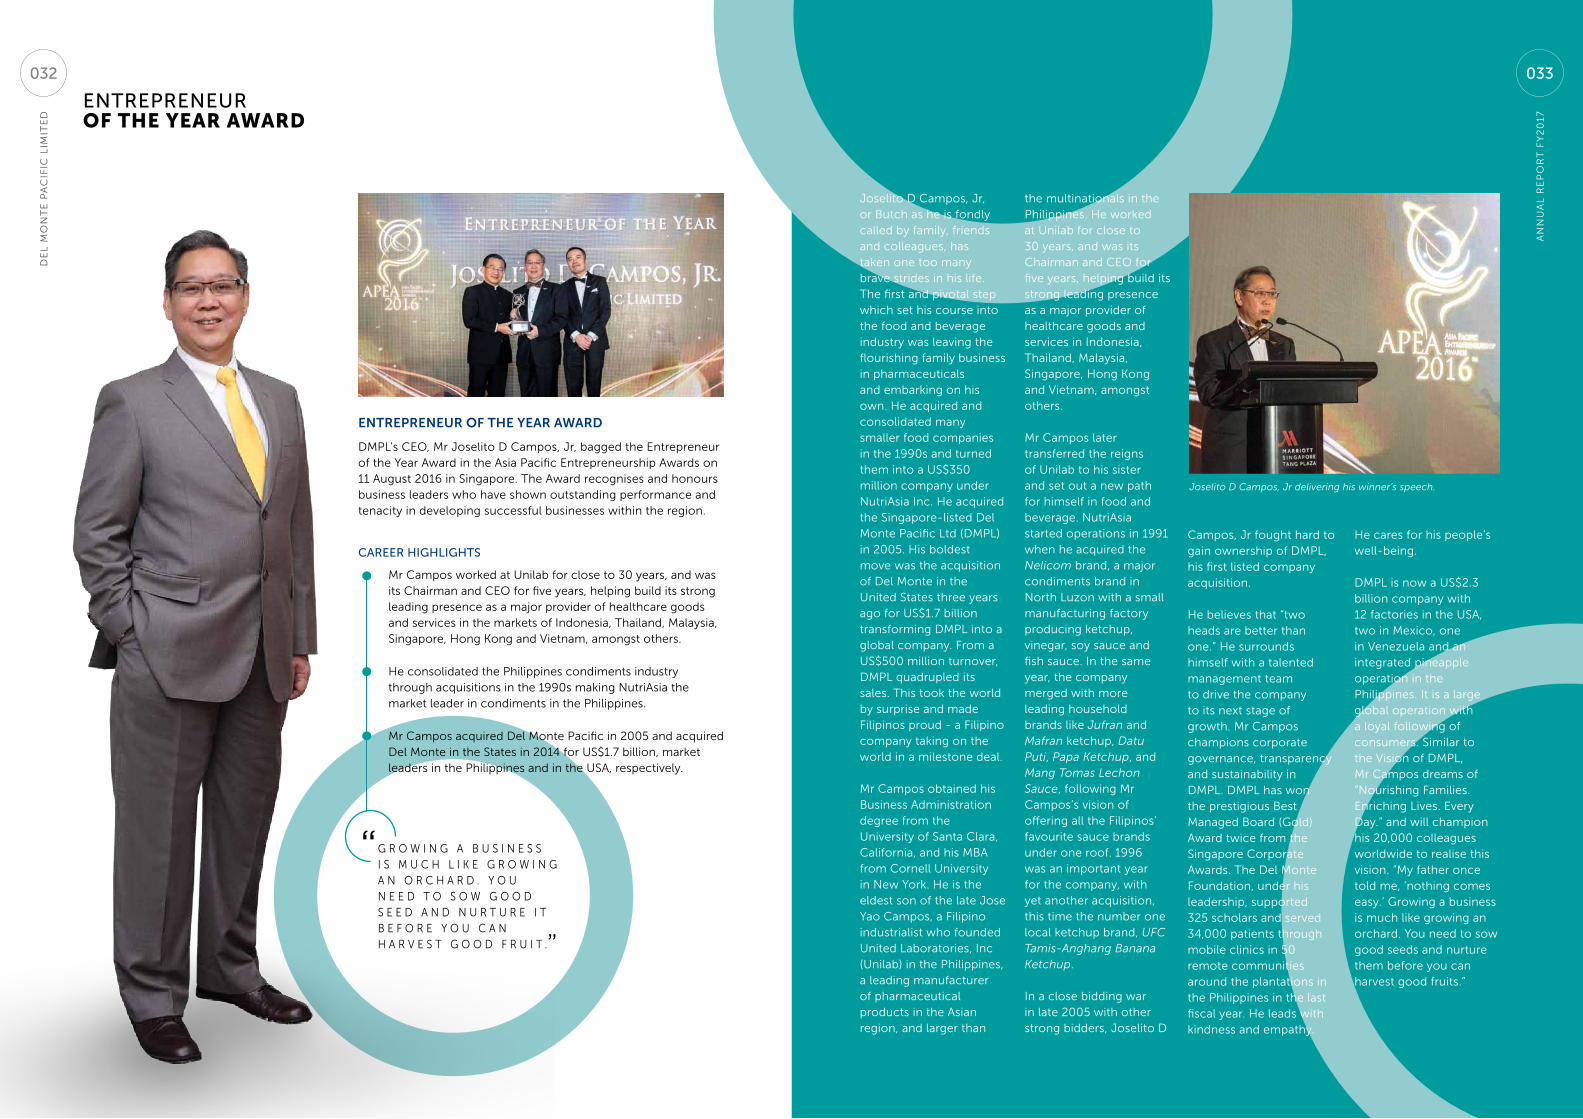
DMpl’s Ceo, Mr Joselito D Campos, Jr, bagged the entrepreneur of the Year Award in the Asia pacific entrepreneurship Awards on 11 August 2016 in Singapore. The Award recognises and honours business leaders who have shown outstanding performance and tenacity in developing successful businesses within the region.
Joselito D Campos, Jr, or Butch as he is fondly called by family, friends and colleagues, has taken one too many brave strides in his life. The first and pivotal step which set his course into the food and beverage industry was leaving the flourishing family business in pharmaceuticals and embarking on his own. He acquired and consolidated many smaller food companies in the 1990s and turned them into a uS$350 million company under nutriAsia Inc. He acquired the Singapore-listed Del Monte pacific ltd (DMpl)in 2005. His boldest move was the acquisition of Del Monte in the united States three years ago for uS$1.7 billion transforming DMpl into a global company. From a uS$500 million turnover, DMpl quadrupled its sales. This took the world by surprise and made Filipinos proud - a Filipino company taking on the world in a milestone deal.
Mr Campos obtained his Business Administration degree from the university of Santa Clara, California, and his MBA from Cornell university in new York. He is the eldest son of the late Jose Yao Campos, a Filipino industrialist who founded united laboratories, Inc (unilab) in the philippines, a leading manufacturer of pharmaceutical products in the Asian region, and larger than
Mr Campos worked at unilab for close to 30 years, and was its Chairman and Ceo for five years, helping build its strong leading presence as a major provider of healthcare goods and services in the markets of Indonesia, Thailand, Malaysia, Singapore, Hong Kong and Vietnam, amongst others.
He consolidated the philippines condiments industry through acquisitions in the 1990s making nutriAsia the market leader in condiments in the philippines.
Mr Campos acquired Del Monte pacific in 2005 and acquired Del Monte in the States in 2014 for uS$1.7 billion, market leaders in the philippines and in the uSA, respectively.
career highlights
entrePreneur of the year award
G R o W I n G A B u S I n e S S I S M u C H l I K e G R o W I n G A n o R C H A R D . Y o u n e e D T o S o W G o o D S e e D A n D n u R T u R e I TB e F o R e Y o u C A n H A R V e S T G o o D F R u I T .
“
the multinationals in the philippines. He worked at unilab for close to 30 years, and was its Chairman and Ceo for five years, helping build its strong leading presence as a major provider of healthcare goods and services in Indonesia, Thailand, Malaysia, Singapore, Hong Kong and Vietnam, amongst others.
Mr Campos later transferred the reigns of unilab to his sister and set out a new path for himself in food and beverage. nutriAsia started operations in 1991 when he acquired the Nelicom brand, a major condiments brand in north luzon with a small manufacturing factory producing ketchup, vinegar, soy sauce and fish sauce. In the same year, the company merged with moreleading household brands like Jufran and Mafran ketchup, Datu Puti, Papa Ketchup, and Mang Tomas Lechon Sauce, following Mr Campos’s vision of offering all the Filipinos’ favourite sauce brands under one roof. 1996 was an important year for the company, with yet another acquisition, this time the number one local ketchup brand, UFC Tamis-Anghang Banana Ketchup.
In a close bidding war in late 2005 with other strong bidders, Joselito D
Joselito D Campos, Jr delivering his winner’s speech.
”
Campos, Jr fought hard to gain ownership of DMpl, his first listed company acquisition.
He believes that “two heads are better than one.” He surrounds himself with a talented management team to drive the company to its next stage of growth. Mr Campos champions corporate governance, transparency and sustainability in DMpl. DMpl has won the prestigious Best Managed Board (Gold) Award twice from the Singapore Corporate Awards. The Del Monte Foundation, under his leadership, supported 325 scholars and served 34,000 patients through mobile clinics in 50 remote communities around the plantations in the philippines in the last fiscal year. He leads with kindness and empathy.
He cares for his people’s well-being.
DMpl is now a uS$2.3 billion company with 12 factories in the uSA, two in Mexico, one in Venezuela and an integrated pineapple operation in the philippines. It is a large global operation with a loyal following of consumers. Similar to the Vision of DMpl, Mr Campos dreams of “nourishing Families. enriching lives. every Day.” and will champion his 20,000 colleagues worldwide to realise this vision. “My father once told me, ‘nothing comes easy.’ Growing a business is much like growing an orchard. You need to sow good seeds and nurture them before you can harvest good fruits.”
De
l M
on
Te
pA
CIF
IC l
IMIT
eD
032 033
An
nu
Al
Re
po
RT
FY
20
17
oPerating anD financial reView
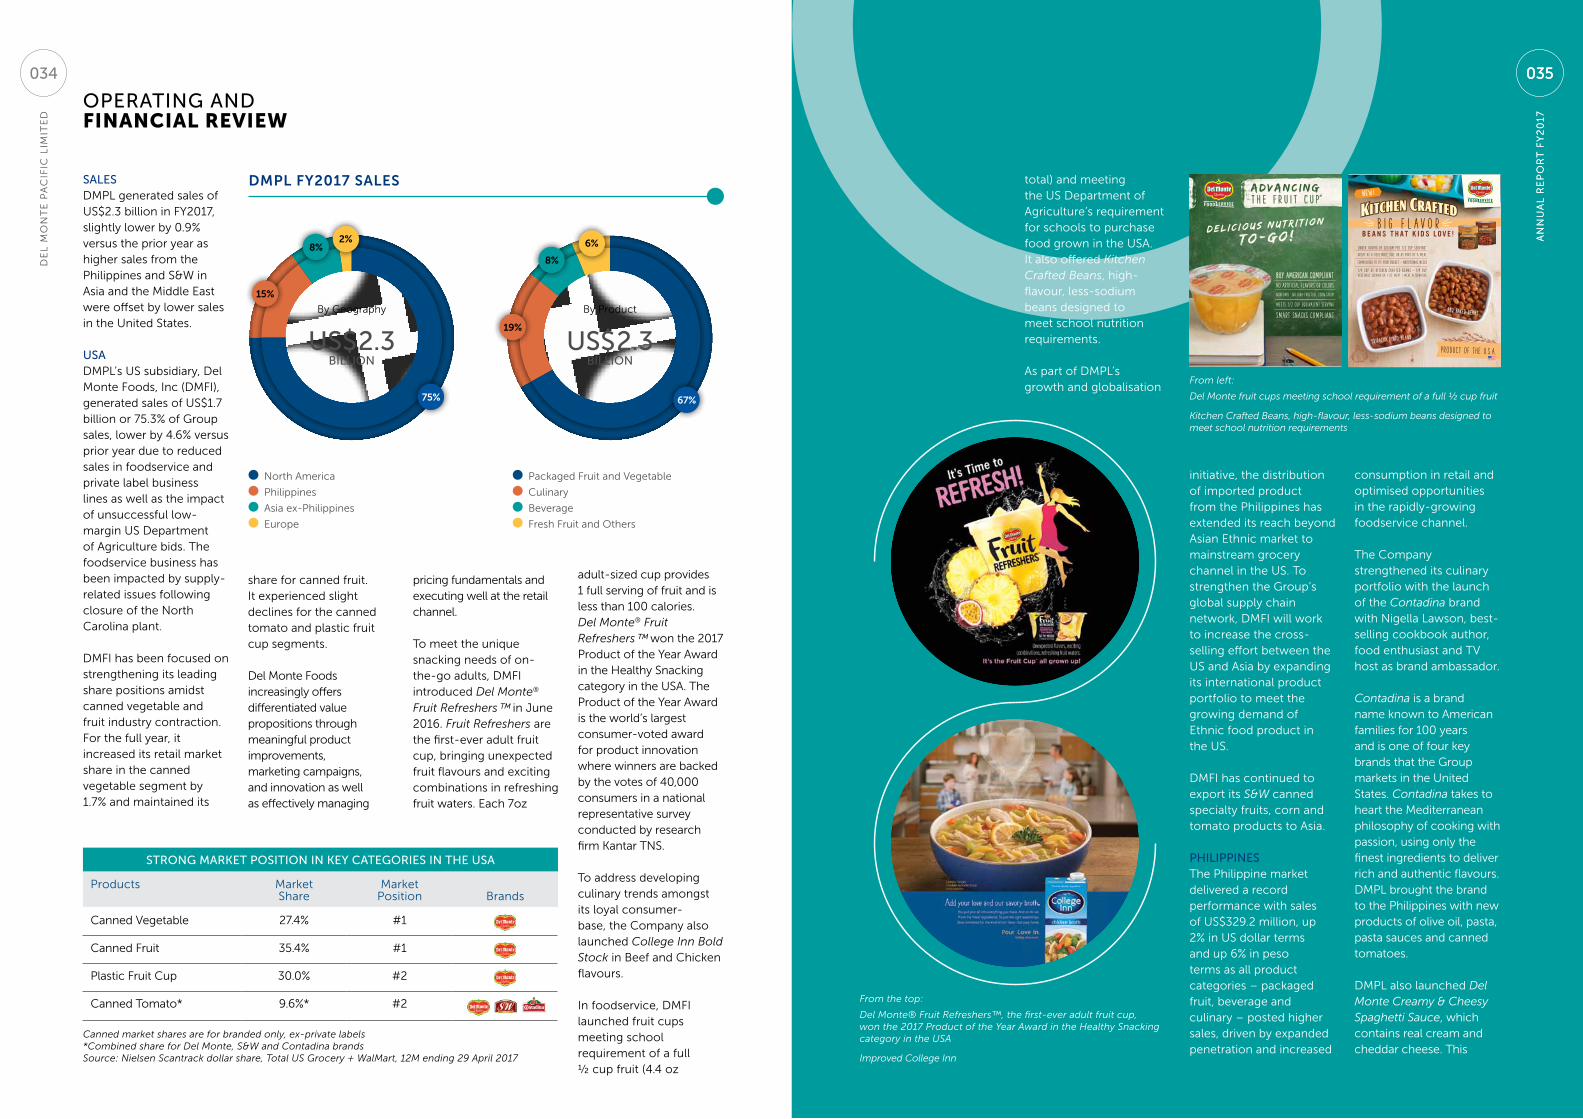
salesDMpl generated sales of uS$2.3 billion in FY2017, slightly lower by 0.9% versus the prior year as higher sales from the philippines and S&W in Asia and the Middle east were offset by lower sales in the united States.
usaDMpl’s uS subsidiary, Del Monte Foods, Inc (DMFI), generated sales of uS$1.7 billion or 75.3% of Group sales, lower by 4.6% versus prior year due to reduced sales in foodservice and private label business lines as well as the impact of unsuccessful low-margin uS Department of Agriculture bids. The foodservice business has been impacted by supply-related issues following closure of the north Carolina plant.
DMFI has been focused on strengthening its leading share positions amidst canned vegetable and fruit industry contraction. For the full year, it increased its retail market share in the canned vegetable segment by 1.7% and maintained its
share for canned fruit. It experienced slight declines for the canned tomato and plastic fruit cup segments.
Del Monte Foods increasingly offers differentiated value propositions through meaningful product improvements, marketing campaigns, and innovation as well as effectively managing
pricing fundamentals and executing well at the retail channel.
To meet the unique snacking needs of on-the-go adults, DMFI introduced Del Monte® Fruit Refreshers™ in June 2016. Fruit Refreshers are the first-ever adult fruit cup, bringing unexpected fruit flavours and exciting combinations in refreshing fruit waters. each 7oz
By Geography
us$2.3Billion
By product
us$2.3Billion
DMpl fY2017 sales
north America
philippines
Asia ex-philippines
europe
packaged Fruit and Vegetable
Culinary
Beverage
Fresh Fruit and others
adult-sized cup provides 1 full serving of fruit and is less than 100 calories. Del Monte® Fruit Refreshers™ won the 2017 product of the Year Award in the Healthy Snacking category in the uSA. The product of the Year Award is the world’s largest consumer-voted award for product innovation where winners are backed by the votes of 40,000 consumers in a national representative survey conducted by research firm Kantar TnS.
To address developing culinary trends amongst its loyal consumer-base, the Company also launched College Inn Bold Stock in Beef and Chicken flavours.
In foodservice, DMFI launched fruit cups meeting school requirement of a full ½ cup fruit (4.4 oz
total) and meeting the uS Department of Agriculture’s requirement for schools to purchase food grown in the uSA. It also offered Kitchen Crafted Beans, high-flavour, less-sodium beans designed to meet school nutrition requirements.
As part of DMpl’s growth and globalisation
75% 67%
15%
19%
2% 6%8%8%
strong Market Position in key categories in the usa
products MarketShare
Marketposition Brands
Canned Vegetable 27.4% #1
Canned Fruit 35.4% #1
plastic Fruit Cup 30.0% #2
Canned Tomato* 9.6%* #2
Canned market shares are for branded only, ex-private labels*Combined share for Del Monte, S&W and Contadina brands Source: Nielsen Scantrack dollar share, Total US Grocery + WalMart, 12M ending 29 April 2017
From the top:
Del Monte® Fruit Refreshers™, the first-ever adult fruit cup, won the 2017 Product of the Year Award in the Healthy Snacking category in the USA
Improved College Inn
From left:
Del Monte fruit cups meeting school requirement of a full ½ cup fruit
Kitchen Crafted Beans, high-flavour, less-sodium beans designed to meet school nutrition requirements
initiative, the distribution of imported product from the philippines has extended its reach beyond Asian ethnic market to mainstream grocery channel in the uS. To strengthen the Group’s global supply chain network, DMFI will work to increase the cross-selling effort between the uS and Asia by expanding its international product portfolio to meet the growing demand of ethnic food product in the uS.
DMFI has continued to export its S&W canned specialty fruits, corn and tomato products to Asia.
PhiliPPinesThe philippine market delivered a record performance with sales of uS$329.2 million, up 2% in uS dollar terms and up 6% in peso terms as all product categories – packaged fruit, beverage and culinary – posted higher sales, driven by expanded penetration and increased
consumption in retail and optimised opportunities in the rapidly-growing foodservice channel.
The Company strengthened its culinary portfolio with the launch of the Contadina brand with nigella lawson, best-selling cookbook author, food enthusiast and TV host as brand ambassador.
Contadina is a brand name known to American families for 100 years and is one of four key brands that the Group markets in the united States. Contadina takes to heart the Mediterranean philosophy of cooking with passion, using only the finest ingredients to deliver rich and authentic flavours. DMpl brought the brand to the philippines with new products of olive oil, pasta, pasta sauces and canned tomatoes.
DMpl also launched Del Monte Creamy & Cheesy Spaghetti Sauce, which contains real cream and cheddar cheese. This
non-gmo • no h igh-fructos e corn syrup
ADVANC INGT H E F R U I T C U P®
No artificial flavors or colors
meets 1/2 cup equ ivalent s erv ing
smart snacks compl iant
d e l i c i o u s n u t r i t i o n
t o - g o !
buy american compl iant
b i g f l a v o rB E A N S T H AT K I D S L OV E !
PRODUCT O F TH E U. S . A .s r i rac h a p i nto b e an s
b b q ba k e d b e an s
* BBQ Baked Beans and Sriracha Pinto Bean sodium per serving 360mg and 380mg respectively”
new!
UNDER 400MG OF SOD I UM P ER 1 / 2 CUP S ERV ING *G R E AT A S A V EG E TA B L E S I D E O R A S PA RT O F A M E A L
FORMULATED TO FIT YOUR BUDGET + NUTRITIONAL NEEDS
1 /4 C U P O F K I TC H EN C RA FT E D B E A N S = 1 /4 C U P V EG E TA B L E S ERV I N G O R 1 O Z . M E AT / M E AT A LT ER N AT I V E
© 2016 Del Monte Foods, Inc. All Rights Reserved.
An
nu
Al
Re
po
RT
FY
20
17
035
De
l M
on
Te
pA
CIF
IC l
IMIT
eD
034 035
An
nu
Al
Re
po
RT
FY
20
17
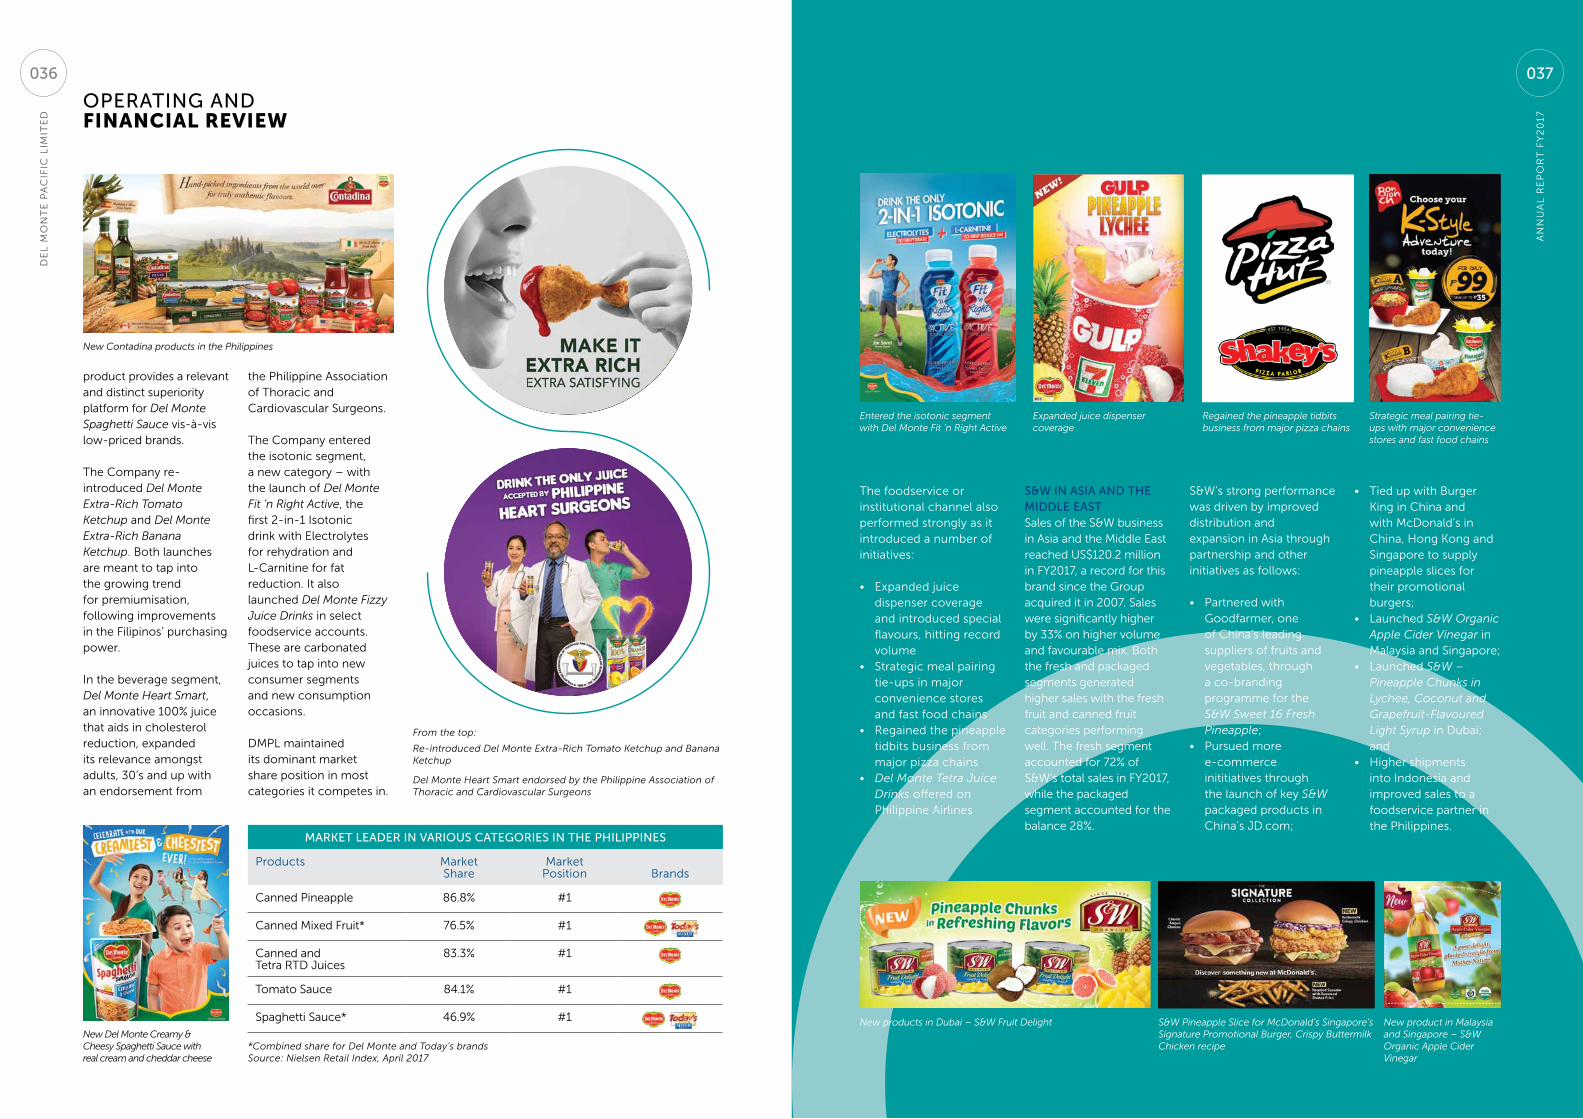
oPerating anD financial reView
product provides a relevant and distinct superiority platform for Del Monte Spaghetti Sauce vis-à-vis low-priced brands.
The Company re-introduced Del Monte Extra-Rich Tomato Ketchup and Del Monte Extra-Rich Banana Ketchup. Both launches are meant to tap into the growing trend for premiumisation, following improvements in the Filipinos’ purchasing power.
In the beverage segment, Del Monte Heart Smart, an innovative 100% juice that aids in cholesterol reduction, expanded its relevance amongst adults, 30’s and up with an endorsement from
New Contadina products in the Philippines
New Del Monte Creamy & Cheesy Spaghetti Sauce with real cream and cheddar cheese
the philippine Association of Thoracic and Cardiovascular Surgeons.
The Company entered the isotonic segment, a new category – with the launch of Del Monte Fit ‘n Right Active, the first 2-in-1 Isotonic drink with electrolytes for rehydration and l-Carnitine for fat reduction. It also launched Del Monte Fizzy Juice Drinks in select foodservice accounts. These are carbonated juices to tap into new consumer segments and new consumption occasions.
DMpl maintained its dominant market share position in most categories it competes in.
Market leaDer in various categories in the PhiliPPines
products MarketShare
Marketposition Brands
Canned pineapple 86.8% #1
Canned Mixed Fruit* 76.5% #1
Canned and Tetra RTD Juices
83.3% #1
Tomato Sauce 84.1% #1
Spaghetti Sauce* 46.9% #1
*Combined share for Del Monte and Today’s brandsSource: Nielsen Retail Index, April 2017
From the top:
Re-introduced Del Monte Extra-Rich Tomato Ketchup and Banana Ketchup
Del Monte Heart Smart endorsed by the Philippine Association of Thoracic and Cardiovascular Surgeons
The foodservice or institutional channel also performed strongly as it introduced a number of initiatives:
• expanded juice dispenser coverage and introduced special flavours, hitting record volume
• Strategic meal pairing tie-ups in major convenience stores and fast food chains
• Regained the pineapple tidbits business from major pizza chains
• Del Monte Tetra Juice Drinks offered on philippine Airlines
s&w in asia anD the MiDDle eastSales of the S&W business in Asia and the Middle east reached uS$120.2 million in FY2017, a record for this brand since the Group acquired it in 2007. Sales were significantly higher by 33% on higher volume and favourable mix. Both the fresh and packaged segments generated higher sales with the fresh fruit and canned fruit categories performing well. The fresh segment accounted for 72% of S&W’s total sales in FY2017, while the packaged segment accounted for the balance 28%.
S&W’s strong performance was driven by improved distribution and expansion in Asia through partnership and other initiatives as follows:
• partnered with Goodfarmer, one of China’s leading suppliers of fruits and vegetables, through a co-branding programme for the S&W Sweet 16 Fresh Pineapple;
• pursued more e-commerce inititiatives through the launch of key S&W packaged products in China’s JD.com;
Expanded juice dispenser coverage
Entered the isotonic segment with Del Monte Fit ‘n Right Active
New products in Dubai – S&W Fruit Delight S&W Pineapple Slice for McDonald’s Singapore’s Signature Promotional Burger, Crispy Buttermilk Chicken recipe
New product in Malaysia and Singapore – S&W Organic Apple Cider Vinegar
Regained the pineapple tidbits business from major pizza chains
Strategic meal pairing tie-ups with major convenience stores and fast food chains
• Tied up with Burger King in China and with McDonald’s in China, Hong Kong and Singapore to supply pineapple slices for their promotional burgers;
• launched S&W Organic Apple Cider Vinegar in Malaysia and Singapore;
• launched S&W – Pineapple Chunks in Lychee, Coconut and Grapefruit-Flavoured Light Syrup in Dubai; and
• Higher shipments into Indonesia and improved sales to a foodservice partner in the philippines.
An
nu
Al
Re
po
RT
FY
20
17
037
De
l M
on
Te
pA
CIF
IC l
IMIT
eD
036
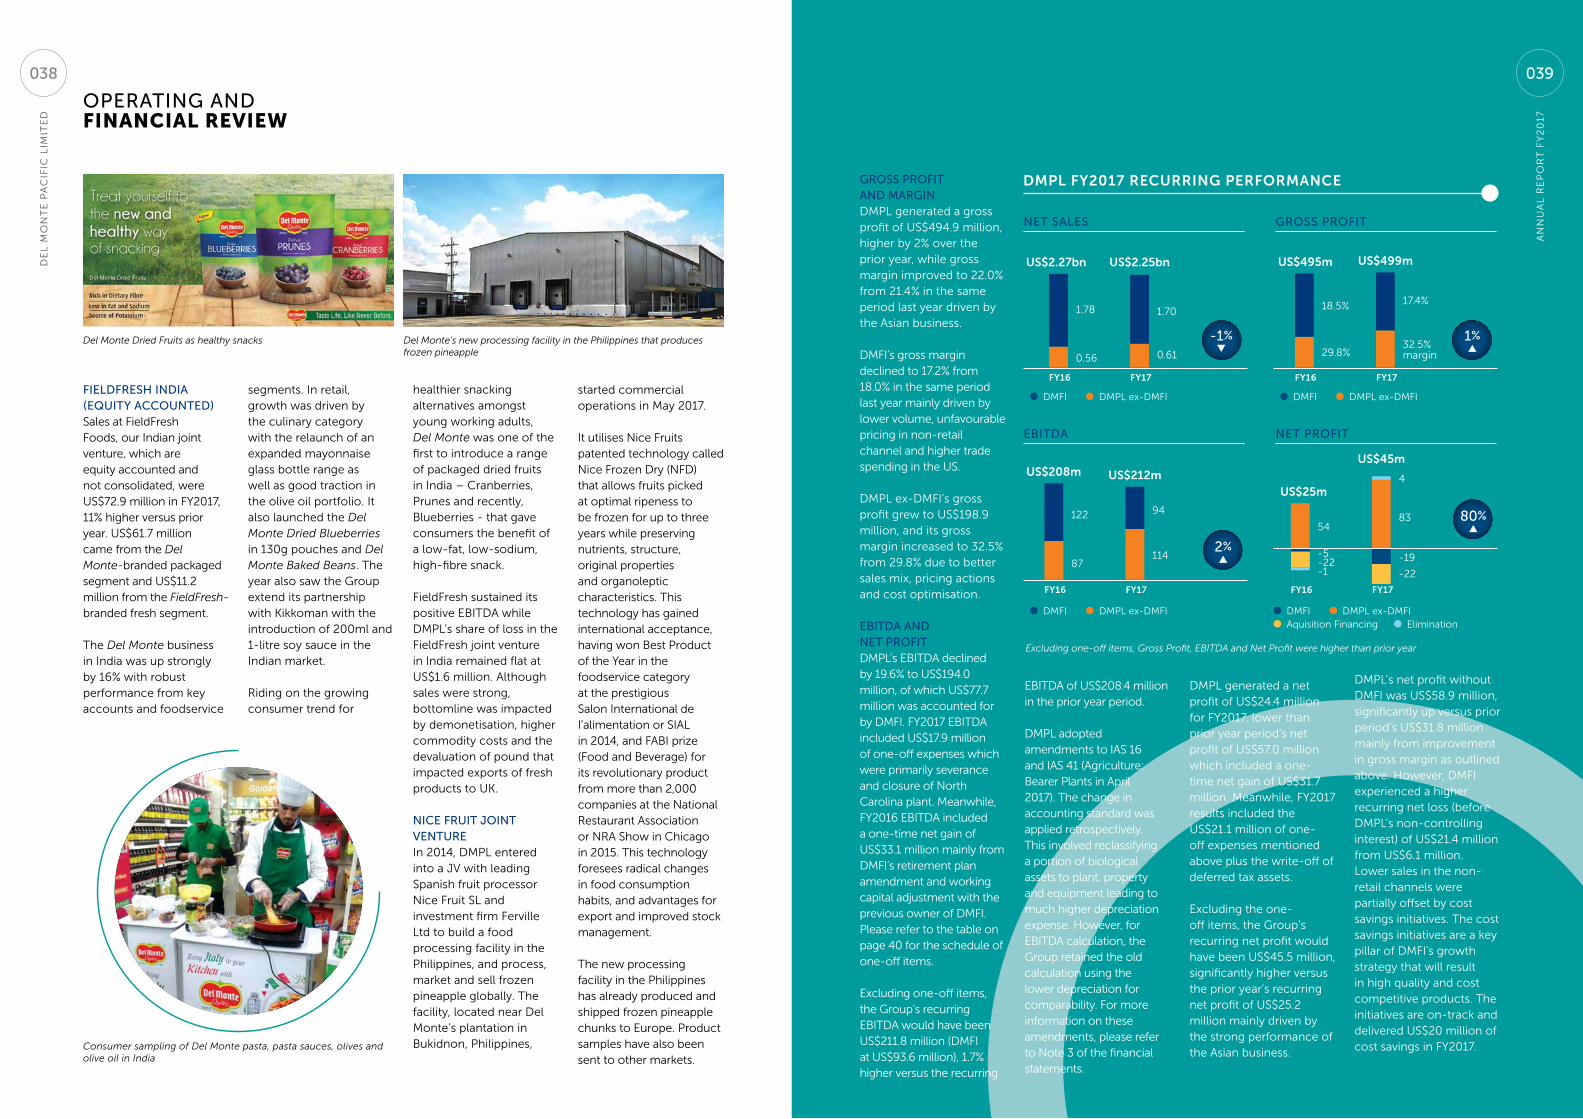
oPerating anD financial reView
fielDfresh inDia (equity accounteD)Sales at FieldFresh Foods, our Indian joint venture, which are equity accounted and not consolidated, were uS$72.9 million in FY2017, 11% higher versus prior year. uS$61.7 million came from the Del Monte-branded packaged segment and uS$11.2 million from the FieldFresh-branded fresh segment.
The Del Monte business in India was up strongly by 16% with robust performance from key accounts and foodservice
segments. In retail, growth was driven by the culinary category with the relaunch of an expanded mayonnaise glass bottle range as well as good traction in the olive oil portfolio. It also launched the Del Monte Dried Blueberries in 130g pouches and Del Monte Baked Beans. The year also saw the Group extend its partnership with Kikkoman with the introduction of 200ml and 1-litre soy sauce in the Indian market.
Riding on the growing consumer trend for
healthier snacking alternatives amongst young working adults, Del Monte was one of the first to introduce a range of packaged dried fruits in India – Cranberries, prunes and recently, Blueberries - that gave consumers the benefit of a low-fat, low-sodium, high-fibre snack.
FieldFresh sustained its positive eBITDA while DMpl’s share of loss in the FieldFresh joint venture in India remained flat at uS$1.6 million. Although sales were strong, bottomline was impacted by demonetisation, higher commodity costs and the devaluation of pound that impacted exports of fresh products to uK.
nice fruit Joint ventureIn 2014, DMpl entered into a JV with leading Spanish fruit processor nice Fruit Sl and investment firm Ferville ltd to build a food processing facility in the philippines, and process, market and sell frozen pineapple globally. The facility, located near Del Monte’s plantation in Bukidnon, philippines, Consumer sampling of Del Monte pasta, pasta sauces, olives and
olive oil in India
started commercial operations in May 2017.
It utilises nice Fruits patented technology called nice Frozen Dry (nFD) that allows fruits picked at optimal ripeness to be frozen for up to three years while preserving nutrients, structure, original properties and organoleptic characteristics. This technology has gained international acceptance, having won Best product of the Year in the foodservice category at the prestigious Salon International de I’alimentation or SIAl in 2014, and FABI prize (Food and Beverage) for its revolutionary product from more than 2,000 companies at the national Restaurant Association or nRA Show in Chicago in 2015. This technology foresees radical changes in food consumption habits, and advantages for export and improved stock management. The new processing facility in the philippines has already produced and shipped frozen pineapple chunks to europe. product samples have also been sent to other markets.
gross Profit anD MarginDMpl generated a gross profit of uS$494.9 million, higher by 2% over the prior year, while gross margin improved to 22.0% from 21.4% in the same period last year driven by the Asian business.
DMFI’s gross margin declined to 17.2% from 18.0% in the same period last year mainly driven by lower volume, unfavourable pricing in non-retail channel and higher trade spending in the uS.
DMpl ex-DMFI’s gross profit grew to uS$198.9 million, and its gross margin increased to 32.5% from 29.8% due to better sales mix, pricing actions and cost optimisation.
eBitDa anD net ProfitDMpl’s eBITDA declined by 19.6% to uS$194.0 million, of which uS$77.7 million was accounted for by DMFI. FY2017 eBITDA included uS$17.9 million of one-off expenses which were primarily severance and closure of north Carolina plant. Meanwhile, FY2016 eBITDA included a one-time net gain of uS$33.1 million mainly from DMFI’s retirement plan amendment and working capital adjustment with the previous owner of DMFI. please refer to the table on page 40 for the schedule of one-off items.
excluding one-off items, the Group’s recurring eBITDA would have been uS$211.8 million (DMFI at uS$93.6 million), 1.7% higher versus the recurring
Del Monte Dried Fruits as healthy snacks Del Monte’s new processing facility in the Philippines that produces frozen pineapple
Excluding one-off items, Gross Profit, EBITDA and Net Profit were higher than prior year
eBITDA of uS$208.4 million in the prior year period.
DMpl adopted amendments to IAS 16 and IAS 41 (Agriculture: Bearer plants in April 2017). The change in accounting standard was applied retrospectively. This involved reclassifying a portion of biological assets to plant, property and equipment leading to much higher depreciation expense. However, for eBITDA calculation, the Group retained the old calculation using the lower depreciation for comparability. For more information on these amendments, please refer to note 3 of the financial statements.
DMpl generated a net profit of uS$24.4 million for FY2017, lower than prior year period’s net profit of uS$57.0 million which included a one-time net gain of uS$31.7 million. Meanwhile, FY2017 results included the uS$21.1 million of one-off expenses mentioned above plus the write-off of deferred tax assets.
excluding the one-off items, the Group’s recurring net profit would have been uS$45.5 million, significantly higher versus the prior year’s recurring net profit of uS$25.2 million mainly driven by the strong performance of the Asian business.
DMpl’s net profit without DMFI was uS$58.9 million, significantly up versus prior period’s uS$31.8 million mainly from improvement in gross margin as outlined above. However, DMFI experienced a higher recurring net loss (before DMpl’s non-controlling interest) of uS$21.4 million from uS$6.1 million. lower sales in the non-retail channels were partially offset by cost savings initiatives. The cost savings initiatives are a key pillar of DMFI’s growth strategy that will result in high quality and cost competitive products. The initiatives are on-track and delivered uS$20 million of cost savings in FY2017.
fY16
1.78
0.56
us$2.27bn
fY16
122
87
us$208m
fY16
18.5%
29.8%
us$495m
fY17
1.70
0.61
us$2.25bn
fY17
94
114
us$212m
fY17
17.4%
32.5% margin
us$499m
fY16
54
-5-22-1
us$25m
fY17
4
83
-19
-22
us$45m
net sales
eBitDa
gross Profit
net Profit
DMFI DMpl ex-DMFI
DMFI DMpl ex-DMFI
DMFI DMpl ex-DMFI
DMFI DMpl ex-DMFI Aquisition Financing elimination
-1%
2%
1%
80%
DMpl fY2017 recurring perforMance
An
nu
Al
Re
po
RT
FY
20
17
039
De
l M
on
Te
pA
CIF
IC l
IMIT
eD
038
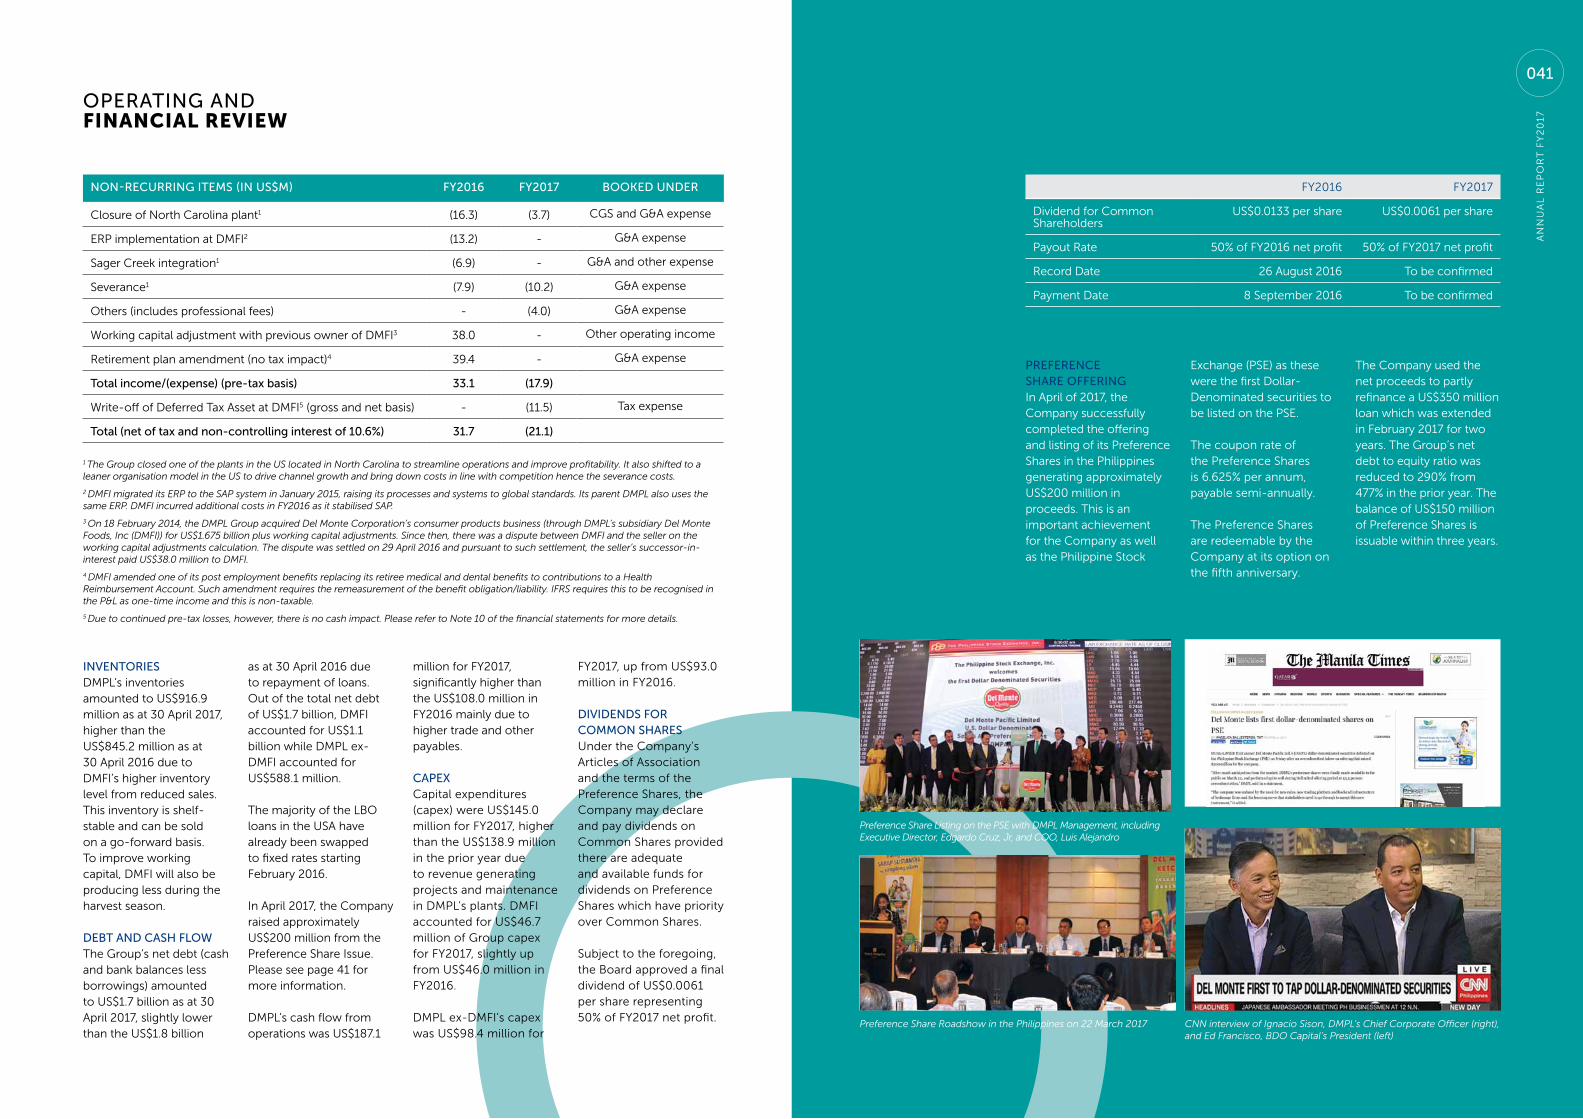
oPerating anD financial reView
non-recurring iteMs (in us$M) fy2016 fy2017 BookeD unDer
Closure of north Carolina plant1 (16.3) (3.7) CGS and G&A expense
eRp implementation at DMFI2 (13.2) - G&A expense
Sager Creek integration1 (6.9) - G&A and other expense
Severance1 (7.9) (10.2) G&A expense
others (includes professional fees) - (4.0) G&A expense
Working capital adjustment with previous owner of DMFI3 38.0 - other operating income
Retirement plan amendment (no tax impact)4 39.4 - G&A expense
total income/(expense) (pre-tax basis) 33.1 (17.9)
Write-off of Deferred Tax Asset at DMFI5 (gross and net basis) - (11.5) Tax expense
total (net of tax and non-controlling interest of 10.6%) 31.7 (21.1)
1 The Group closed one of the plants in the US located in North Carolina to streamline operations and improve profitability. It also shifted to a leaner organisation model in the US to drive channel growth and bring down costs in line with competition hence the severance costs.
2 DMFI migrated its ERP to the SAP system in January 2015, raising its processes and systems to global standards. Its parent DMPL also uses the same ERP. DMFI incurred additional costs in FY2016 as it stabilised SAP.
3 On 18 February 2014, the DMPL Group acquired Del Monte Corporation’s consumer products business (through DMPL’s subsidiary Del Monte Foods, Inc (DMFI)) for US$1.675 billion plus working capital adjustments. Since then, there was a dispute between DMFI and the seller on the working capital adjustments calculation. The dispute was settled on 29 April 2016 and pursuant to such settlement, the seller’s successor-in-interest paid US$38.0 million to DMFI.
4 DMFI amended one of its post employment benefits replacing its retiree medical and dental benefits to contributions to a Health Reimbursement Account. Such amendment requires the remeasurement of the benefit obligation/liability. IFRS requires this to be recognised in the P&L as one-time income and this is non-taxable.
5 Due to continued pre-tax losses, however, there is no cash impact. Please refer to Note 10 of the financial statements for more details.
inventoriesDMpl’s inventories amounted to uS$916.9 million as at 30 April 2017, higher than the uS$845.2 million as at 30 April 2016 due to DMFI’s higher inventory level from reduced sales. This inventory is shelf-stable and can be sold on a go-forward basis. To improve working capital, DMFI will also be producing less during the harvest season.
DeBt anD cash flowThe Group’s net debt (cash and bank balances less borrowings) amounted to uS$1.7 billion as at 30 April 2017, slightly lower than the uS$1.8 billion
as at 30 April 2016 due to repayment of loans. out of the total net debt of uS$1.7 billion, DMFI accounted for uS$1.1 billion while DMpl ex-DMFI accounted for uS$588.1 million.
The majority of the lBo loans in the uSA have already been swapped to fixed rates starting February 2016.
In April 2017, the Company raised approximately uS$200 million from the preference Share Issue. please see page 41 for more information.
DMpl’s cash flow from operations was uS$187.1
million for FY2017, significantly higher than the uS$108.0 million in FY2016 mainly due to higher trade and other payables.
caPexCapital expenditures (capex) were uS$145.0 million for FY2017, higher than the uS$138.9 million in the prior year due to revenue generating projects and maintenance in DMpl’s plants. DMFI accounted for uS$46.7 million of Group capex for FY2017, slightly up from uS$46.0 million in FY2016.
DMpl ex-DMFI’s capex was uS$98.4 million for
FY2017, up from uS$93.0 million in FY2016.
DiviDenDs for coMMon sharesunder the Company’s Articles of Association and the terms of the preference Shares, the Company may declare and pay dividends on Common Shares provided there are adequate and available funds for dividends on preference Shares which have priority over Common Shares.
Subject to the foregoing, the Board approved a final dividend of uS$0.0061 per share representing 50% of FY2017 net profit.
FY2016 FY2017
Dividend for Common Shareholders
uS$0.0133 per share uS$0.0061 per share
payout Rate 50% of FY2016 net profit 50% of FY2017 net profit
Record Date 26 August 2016 To be confirmed
payment Date 8 September 2016 To be confirmed
Preference share offeringIn April of 2017, the Company successfully completed the offering and listing of its preference Shares in the philippines generating approximately uS$200 million in proceeds. This is an important achievement for the Company as well as the philippine Stock
exchange (pSe) as these were the first Dollar-Denominated securities to be listed on the pSe.
The coupon rate of the preference Shares is 6.625% per annum, payable semi-annually.
The preference Shares are redeemable by the Company at its option on the fifth anniversary.
Preference Share Listing on the PSE with DMPL Management, including Executive Director, Edgardo Cruz, Jr, and COO, Luis Alejandro
The Company used the net proceeds to partly refinance a uS$350 million loan which was extended in February 2017 for two years. The Group’s net debt to equity ratio was reduced to 290% from 477% in the prior year. The balance of uS$150 million of preference Shares is issuable within three years.
Preference Share Roadshow in the Philippines on 22 March 2017 CNN interview of Ignacio Sison, DMPL’s Chief Corporate Officer (right), and Ed Francisco, BDO Capital’s President (left)
An
nu
Al
Re
po
RT
FY
20
17
De
l M
on
Te
pA
CIF
IC l
IMIT
eD
041040

oPerating anD financial reView
Business outlooK
DMPL’s and Fresh Del Monte Produce’s products
In April 2017, the Company successfully completed the offering and listing of its preference Shares in the philippines generating approximately uS$200 million in proceeds. The Company used the net proceeds to partly refinance a uS$350 million loan. This reduced the Group’s net debt to equity ratio to 290% from 477% last year. The balance preference Shares of uS$150 million is issuable within three years.
usa
The Group faces headwinds from the long-term structural decline in several categories in which it competes. While remaining relevant, the centre-of-store is eroding at slow-and-steady pace due to shifts in consumer demographics, shifts in the way American consumers are eating and shopping, as well as shifts in consumer preferences.
The Company’s commercial strategy builds upon its brand heritage and will realign its business (and ultimately the categories in which it competes) with those consumer trends over time. Its plan focuses on select attractive business segments in which it will invest in marketing to strengthen its leadership positions, pursue innovation to address growing consumer needs for more convenient, healthy and flavourful solutions, as well as build its distribution base in the
Barring unforeseen circumstances, DMpl will continue to be profitable for FY2018.
The Group will focus on strengthening its core business. Innovation through better product and packaging development, and improved agriculture and manufacturing technology will continue to fuel growth initiatives. DMpl will continue to explore digital opportunities for its range of products across markets. It will remain vigilant in keeping costs down, amidst an inflationary tinplate cost environment and lower pineapple juice concentrate pricing, through supply chain synergies and G&A cost optimisation.
growing store perimeter and emerging channels. At the same time, it will rationalise non-profitable businesses, in particular the non-branded segment.
The Company will continue to optimise its cost structure by driving spending efficiencies and productivity improvements annually as well as by investing in a multiyear restructuring project for its operations and supply chain footprint to more efficiently support its commercial strategy.
paving the way to its long-term strategy, the Group announced a formal agreement with Fresh Del Monte produce to collaborate on four new joint ventures (more on page 42) which has the potential to greatly extend the reach of the Del Monte brand to the growing store perimeter while
allowing both companies to optimise economies of scale.
asia
DMpl will continue to expand its existing branded business in Asia, through the Del Monte brand in the philippines, where it is a dominant market leader. S&W, both packaged and fresh, will gain more traction as it leverages its distribution expansion in Asia and the Middle east, while its affiliate in India will continue to generate higher sales and maintain its positive eBITDA.
PhiliPPinesIn the philippines, the Group will continue to drive increased consumption frequency amongst a wider base of consumers through sustained investments in relevant advertising,
New Del Monte® Fruit Refreshers™, the first-ever adult fruit cup
suBsequent event – Joint venture with fresh Del Monte ProDuce incDMpl announced a series of new joint ventures with Fresh Del Monte produce Inc. (nYSe: FDp) that will result in expanded refrigerated offerings sold across all distribution and sales channels, and a new retail food and beverage concept modeled after
an already successful Fresh Del Monte produce business in the Middle east. These joint ventures will initially focus on the uS market with the potential for expansion into other territories where the companies’ businesses complement each other.
The collaboration offers the opportunity for each partner to share expertise and optimise economies of scale in product development, operations, sourcing, supply chain, marketing and distribution.
The joint ventures are facilitated by the full and
DMPL’s Executive Chairman Rolando Gapud (left) and Fresh Del Monte Produce’s Chairman and CEO Mohammad Abu-Ghazaleh (right)
final settlement of all active litigation between Del Monte pacific limited and its subsidiary Del Monte Foods Inc on the one hand, and Fresh Del Monte produce Inc, on the other hand, effective immediately. For more details, please refer to the announcement on 28 June 2017, the FAQs and conference call playback posted on http://www.delmontepacific.com/investors/news-and-filings.
An
nu
Al
Re
po
RT
FY
20
17
043
De
l M
on
Te
pA
CIF
IC l
IMIT
eD
042
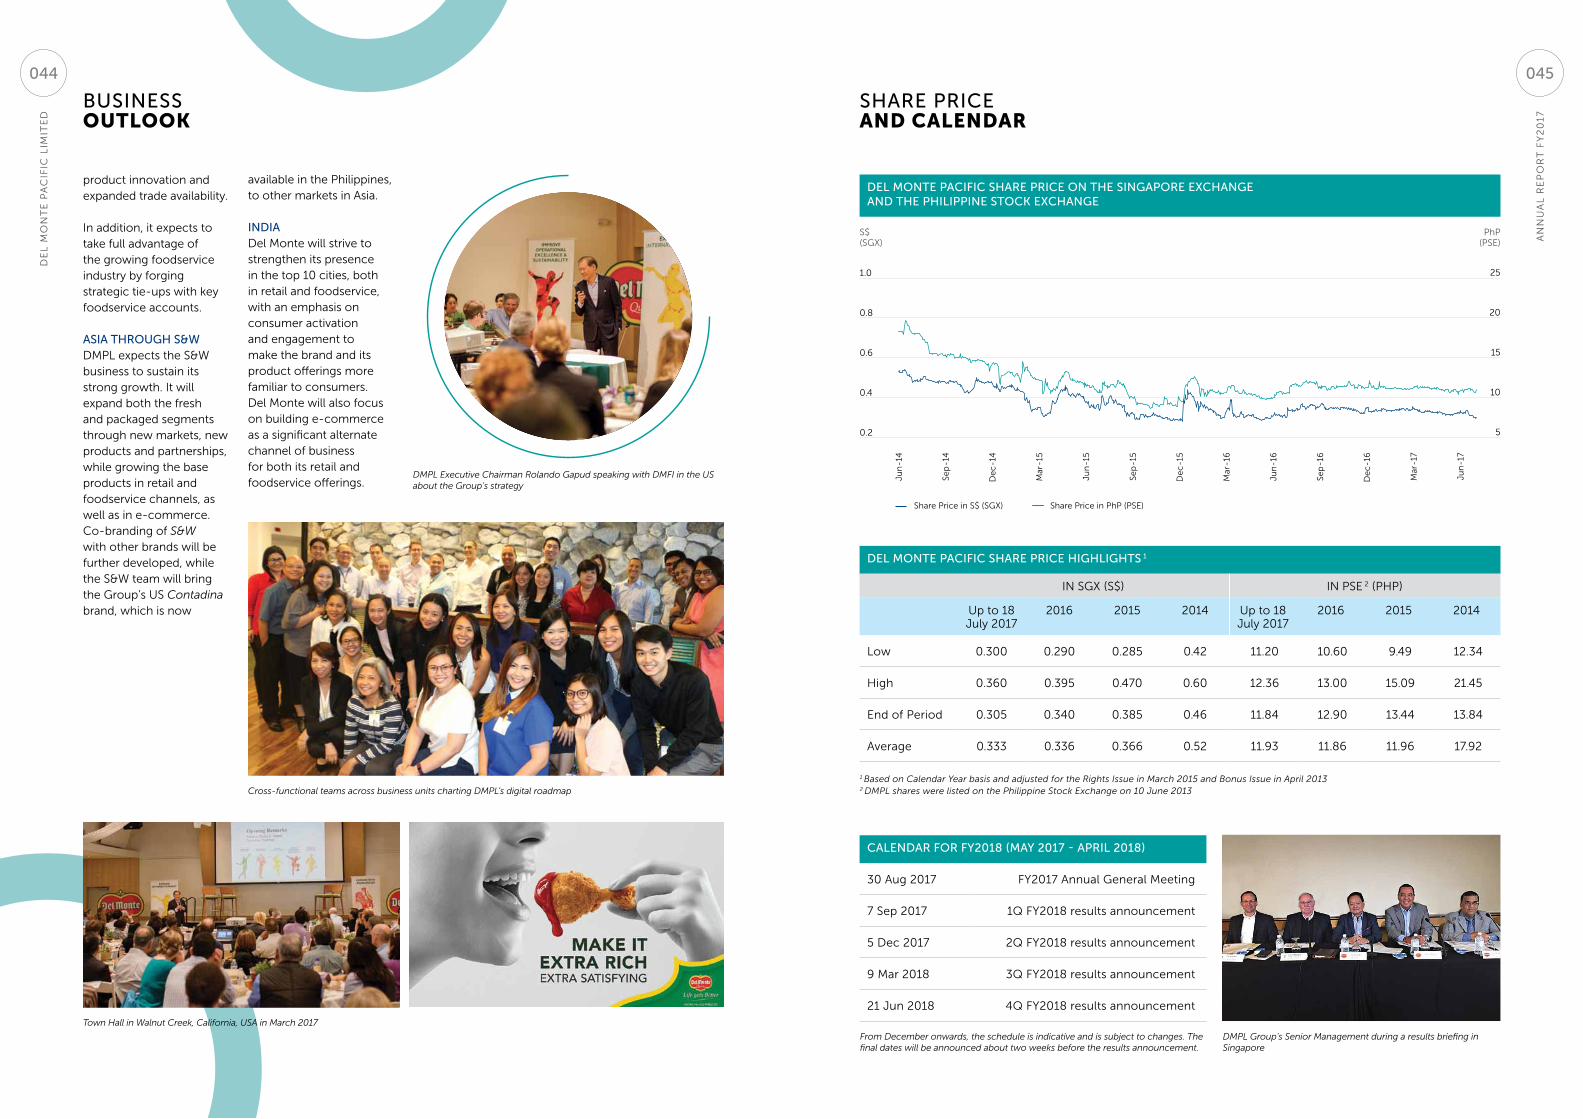
Business outlooK
share Priceand calendar
Del Monte Pacific share Price on the singaPore exchange anD the PhiliPPine stock exchange
Mar
-15
Mar
-16
Mar
-17
Sep
-14
Sep
-15
Sep
-16
Jun
-14
Jun
-15
Jun
-16
Jun
-17
De
c-1
4
De
c-1
5
De
c-1
6
S$ (SGX)
Del Monte Pacific share Price highlights 1
In SGX (S$) In pSe 2 (pHp)
up to 18 July 2017
2016 2015 2014 up to 18 July 2017
2016 2015 2014
low 0.300 0.290 0.285 0.42 11.20 10.60 9.49 12.34
High 0.360 0.395 0.470 0.60 12.36 13.00 15.09 21.45
end of period 0.305 0.340 0.385 0.46 11.84 12.90 13.44 13.84
Average 0.333 0.336 0.366 0.52 11.93 11.86 11.96 17.92
calenDar for fy2018 (May 2017 - aPril 2018)
30 Aug 2017 FY2017 Annual General Meeting
7 Sep 2017 1Q FY2018 results announcement
5 Dec 2017 2Q FY2018 results announcement
9 Mar 2018 3Q FY2018 results announcement
21 Jun 2018 4Q FY2018 results announcement
php (pSe)
Share price in S$ (SGX) Share price in php (pSe)
From December onwards, the schedule is indicative and is subject to changes. The final dates will be announced about two weeks before the results announcement.
DMPL Executive Chairman Rolando Gapud speaking with DMFI in the US about the Group’s strategy
Cross-functional teams across business units charting DMPL’s digital roadmap
Town Hall in Walnut Creek, California, USA in March 2017
DMPL Group’s Senior Management during a results briefing in Singapore
1 Based on Calendar Year basis and adjusted for the Rights Issue in March 2015 and Bonus Issue in April 20132 DMPL shares were listed on the Philippine Stock Exchange on 10 June 2013
1.0
0.8
0.6
0.4
0.2
25
20
15
10
5
product innovation and expanded trade availability. In addition, it expects to take full advantage of the growing foodservice industry by forging strategic tie-ups with key foodservice accounts.
asia through s&wDMpl expects the S&W business to sustain its strong growth. It will expand both the fresh and packaged segments through new markets, new products and partnerships, while growing the base products in retail and foodservice channels, as well as in e-commerce. Co-branding of S&W with other brands will be further developed, while the S&W team will bring the Group’s uS Contadina brand, which is now
available in the philippines, to other markets in Asia.
inDiaDel Monte will strive to strengthen its presence in the top 10 cities, both in retail and foodservice, with an emphasis on consumer activation and engagement to make the brand and its product offerings more familiar to consumers. Del Monte will also focus on building e-commerce as a significant alternate channel of business for both its retail and foodservice offerings.
An
nu
Al
Re
po
RT
FY
20
17
De
l M
on
Te
pA
CIF
IC l
IMIT
eD
045044
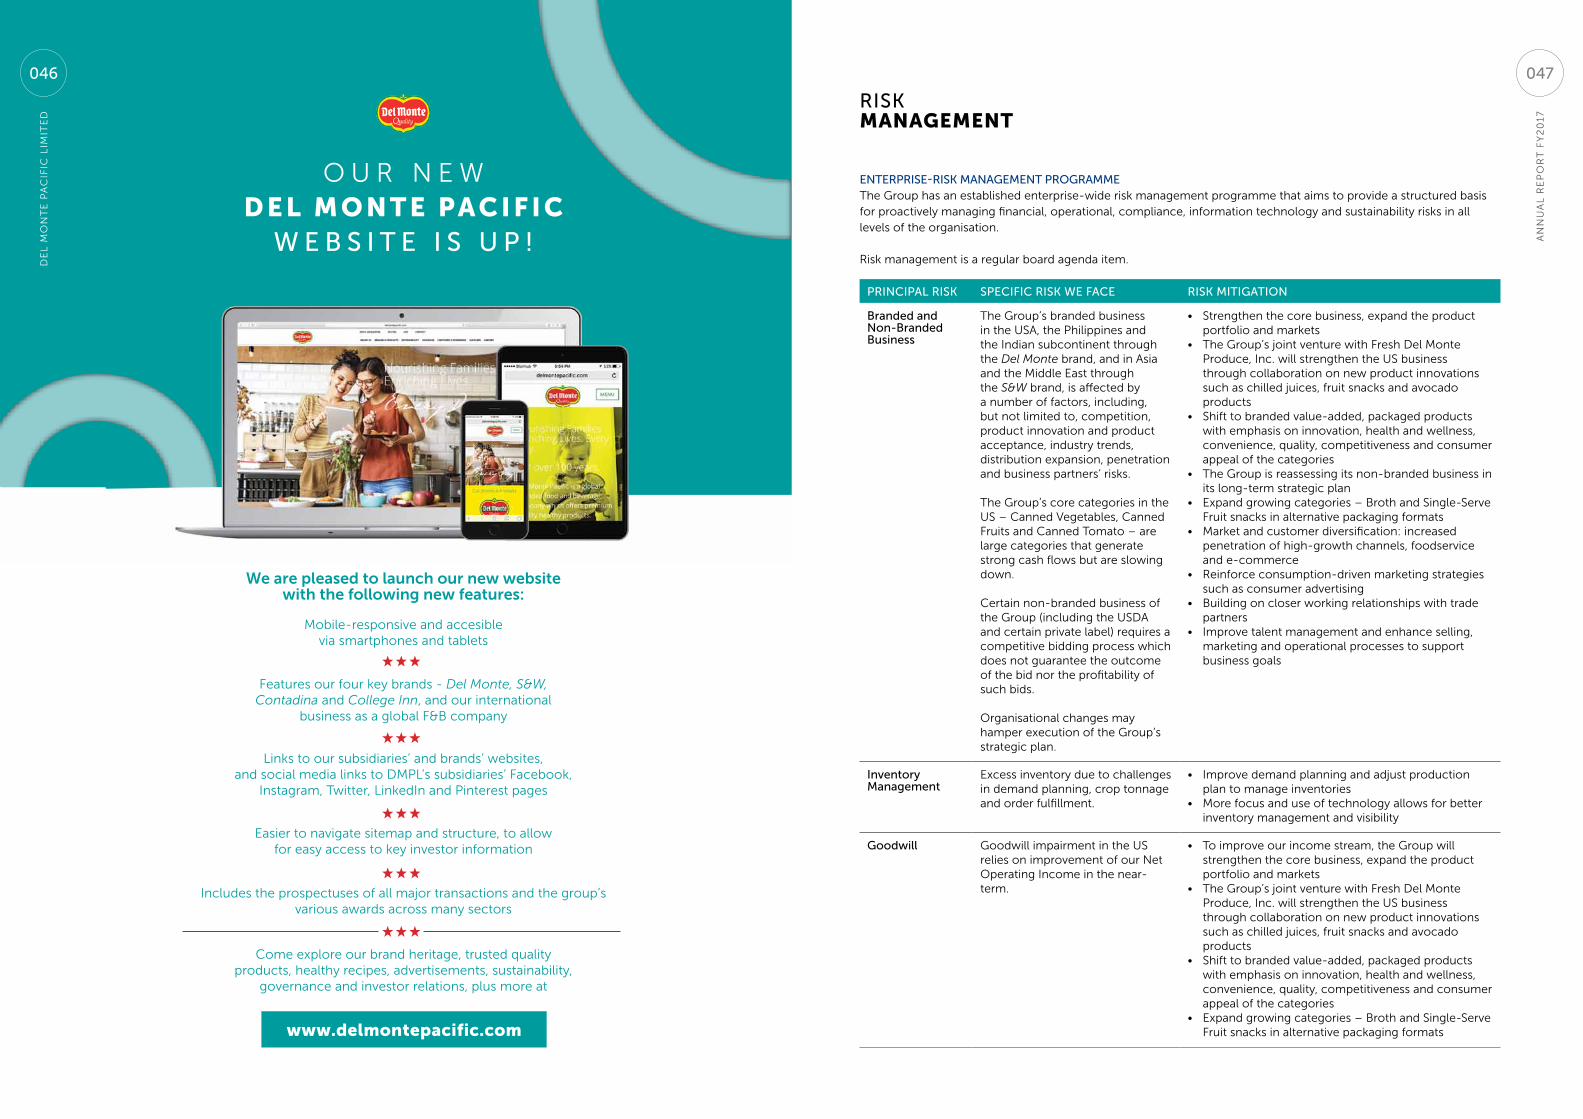
risk management
PrinciPal risk sPecific risk we face risk Mitigation
Branded and non-Branded Business
The Group’s branded business in the uSA, the philippines and the Indian subcontinent through the Del Monte brand, and in Asia and the Middle east through the S&W brand, is affected by a number of factors, including, but not limited to, competition, product innovation and product acceptance, industry trends, distribution expansion, penetration and business partners’ risks.
The Group’s core categories in the uS – Canned Vegetables, Canned Fruits and Canned Tomato – are large categories that generate strong cash flows but are slowing down.
Certain non-branded business of the Group (including the uSDA and certain private label) requires a competitive bidding process which does not guarantee the outcome of the bid nor the profitability of such bids.
organisational changes may hamper execution of the Group’s strategic plan.
• Strengthen the core business, expand the product portfolio and markets
• The Group’s joint venture with Fresh Del Monte produce, Inc. will strengthen the uS business through collaboration on new product innovations such as chilled juices, fruit snacks and avocado products
• Shift to branded value-added, packaged products with emphasis on innovation, health and wellness, convenience, quality, competitiveness and consumer appeal of the categories
• The Group is reassessing its non-branded business in its long-term strategic plan
• expand growing categories – Broth and Single-Serve Fruit snacks in alternative packaging formats
• Market and customer diversification: increased penetration of high-growth channels, foodservice and e-commerce
• Reinforce consumption-driven marketing strategies such as consumer advertising
• Building on closer working relationships with trade partners
• Improve talent management and enhance selling, marketing and operational processes to support business goals
inventory Management
excess inventory due to challenges in demand planning, crop tonnage and order fulfillment.
• Improve demand planning and adjust production plan to manage inventories
• More focus and use of technology allows for better inventory management and visibility
goodwill Goodwill impairment in the uS relies on improvement of our net operating Income in the near-term.
• To improve our income stream, the Group will strengthen the core business, expand the product portfolio and markets
• The Group’s joint venture with Fresh Del Monte produce, Inc. will strengthen the uS business through collaboration on new product innovations such as chilled juices, fruit snacks and avocado products
• Shift to branded value-added, packaged products with emphasis on innovation, health and wellness, convenience, quality, competitiveness and consumer appeal of the categories
• expand growing categories – Broth and Single-Serve Fruit snacks in alternative packaging formats
enterPrise-risk ManageMent PrograMMeThe Group has an established enterprise-wide risk management programme that aims to provide a structured basis for proactively managing financial, operational, compliance, information technology and sustainability risks in all levels of the organisation.
Risk management is a regular board agenda item.
o u R n e W d e l m o n t e pa c i f i c
w e B s i t e i s u P !
We are pleased to launch our new websitewith the following new features:
Mobile-responsive and accesiblevia smartphones and tablets
Features our four key brands - Del Monte, S&W, Contadina and College Inn, and our international
business as a global F&B company
links to our subsidiaries’ and brands’ websites, and social media links to DMpl’s subsidiaries’ Facebook,
Instagram, Twitter, linkedIn and pinterest pages
easier to navigate sitemap and structure, to allow for easy access to key investor information
Includes the prospectuses of all major transactions and the group’s various awards across many sectors
Come explore our brand heritage, trusted quality products, healthy recipes, advertisements, sustainability,
governance and investor relations, plus more at
www.delmontepacific.com
An
nu
Al
Re
po
RT
FY
20
17
047
De
l M
on
Te
pA
CIF
IC l
IMIT
eD
046
PrinciPal risk sPecific risk we face risk Mitigation
goodwill (continued)
• Market and customer diversification: increased penetration of high-growth channels, foodservice and e-commerce
• Reinforce consumption-driven marketing strategies such as consumer advertising
• Improved cash flow in the uS, which accounts for approximately 75% of Group sales
• expected cost savings from selling, general and administrative expense reduction initiatives, managing working capital, production levels and capital spending, productivity enhancements and operational efficiencies
trade spending In the uS, a large portion of sales expense is for trade promotion activities. Management of trade promotion activity is important.
• In the uS, the Group will explore various programmes and tools to better manage trade promotion
• The Group will leverage the SAp software to address these challenges
financial leverage
The Group has long-term acquisition financing resulting in a leveraged balance sheet.
Risks would arise if there is a general economic or industry slowdown that may impact the Group’s performance, which subsequently may affect the Group’s ability to service its interest and principal obligations.
• The Group successfully completed the offering and listing of about uS$200 million preference Shares in the philippines in April with a coupon rate of 6.625% p.a.
• net proceeds were used to partly refinance the uS$350 million loan which was extended until February 2019
• Remaining balance of uS$ 150 million of preference Shares are issuable within 3 years
• The Group previously raised approximately uS$150 million in March 2015 from the Rights Issue in Singapore and the philippines, and used the proceeds to partially pay down the acquisition bridge financing
• The Group also expects to meet its financial obligation by generating more cash flows through the following: – Improved cash flows in the uS, which accounts
for approximately 75% of Group sales– expected cost savings from selling, general and
administrative expense reduction initiatives, managing working capital, production levels, productivity enhancements and operational efficiencies
– expected sales and profit growth in the Asian business with the continuous expansion of the S&W brand in Asia and the Middle east both in packaged and fresh products, and growth of the philippine business through its market leadership position
• The Group manages its interest rate risk by swapping variable with fixed interest rates– The majority of the term acquisition loans in the
uSA have already been swapped to fixed rates in February 2014, which took effect beginning February 2016 until 2021
talent Management
The Group’s capability to acquire and retain talent has an impact on the execution of the strategic plan.
• employee engagement is one of the strategies used to attract and retain talent by the Group
• In the philippines, we continue to monitor new legislations that affect labour and operations, and proactively develop strategies to reduce the impact of these regulations
risk management
PrinciPal risk sPecific risk we face risk Mitigation
erP/saP optimisation in usa
In January 2015, the Group implemented a new enterprise Resource planning system, SAp, in the uS and outsourced its finance and accounting functions to a reputable global service provider in the philippines.
Given the new systems and processes involved, there are risks to timely and accurate processing of documents, monitoring of expenditures, along with the change of service provider and decision-making associated with the steady flow of detailed quality information.
• The Group has transitioned to a new global service provider for finance and accounting
• The Group is managing the transition by retaining existing staff in its back office for a certain period, managing knowledge transfer to key members of the new staff, and solid training for all staff involved
• Refocus IT support to effectively manage the project implementation which includes prioritising SAp enhancements and alignment of key business processes with functional groups
• SAp enhancements were prioritised by management and a number of projects are underway
tax The Group may be exposed to additional losses from write-offs of deferred tax credits and impairment of goodwill should our operations in the uS continue to incur losses.
The Group may lose certain tax incentives should it fail to comply with the conditions for the tax incentive.
• proper execution of the Group’s strategic and annual operating plan to meet its projected income in the uS
• Implement measures to comply with conditions related to the tax incentive
• ensure the Group’s compliance with rules and regulations
operations As an integrated producer of packaged and fresh fruit products for the world market, the Group’s earnings are inevitably subject to certain other risk factors, which include general economic and business conditions, change in business strategy or development plans, international business operations, production efficiencies, input costs and availability, disruption of logistics and transportation facilities, litigious counterparties, insurgent activities and changes in government regulations, including, without limitation, environmental regulations.
• The Group develops and executes a long-term strategic plan and annual operating plan, supported by a business continuity plan, risk management and a corporate sustainability programme
• It also pursues productivity-enhancing and efficiency-generating work practices and capital projects
• To manage security risks in its operating units in the philippines, the Group has strengthened security measures and improved its stakeholder relations in the communities where it operates
environmental risks
production output is subject to certain risk factors relating to weather conditions, catastrophes, crop yields, contract growers and service providers’ performance, and leasehold arrangements.
• The Group develops and executes a long-term strategic plan and annual operating plan, supported by a contingency plan and risk management measures
• The Group also has in place disaster recovery plans and business continuity plans to mitigate these incidents, and has implemented programmes and initiatives to mitigate the effects of el nĩno and la niña
• The Group has Global Agricultural practices (GAp) certifications, and complies with proven agricultural practices
An
nu
Al
Re
po
RT
FY
20
17
De
l M
on
Te
pA
CIF
IC l
IMIT
eD
049048
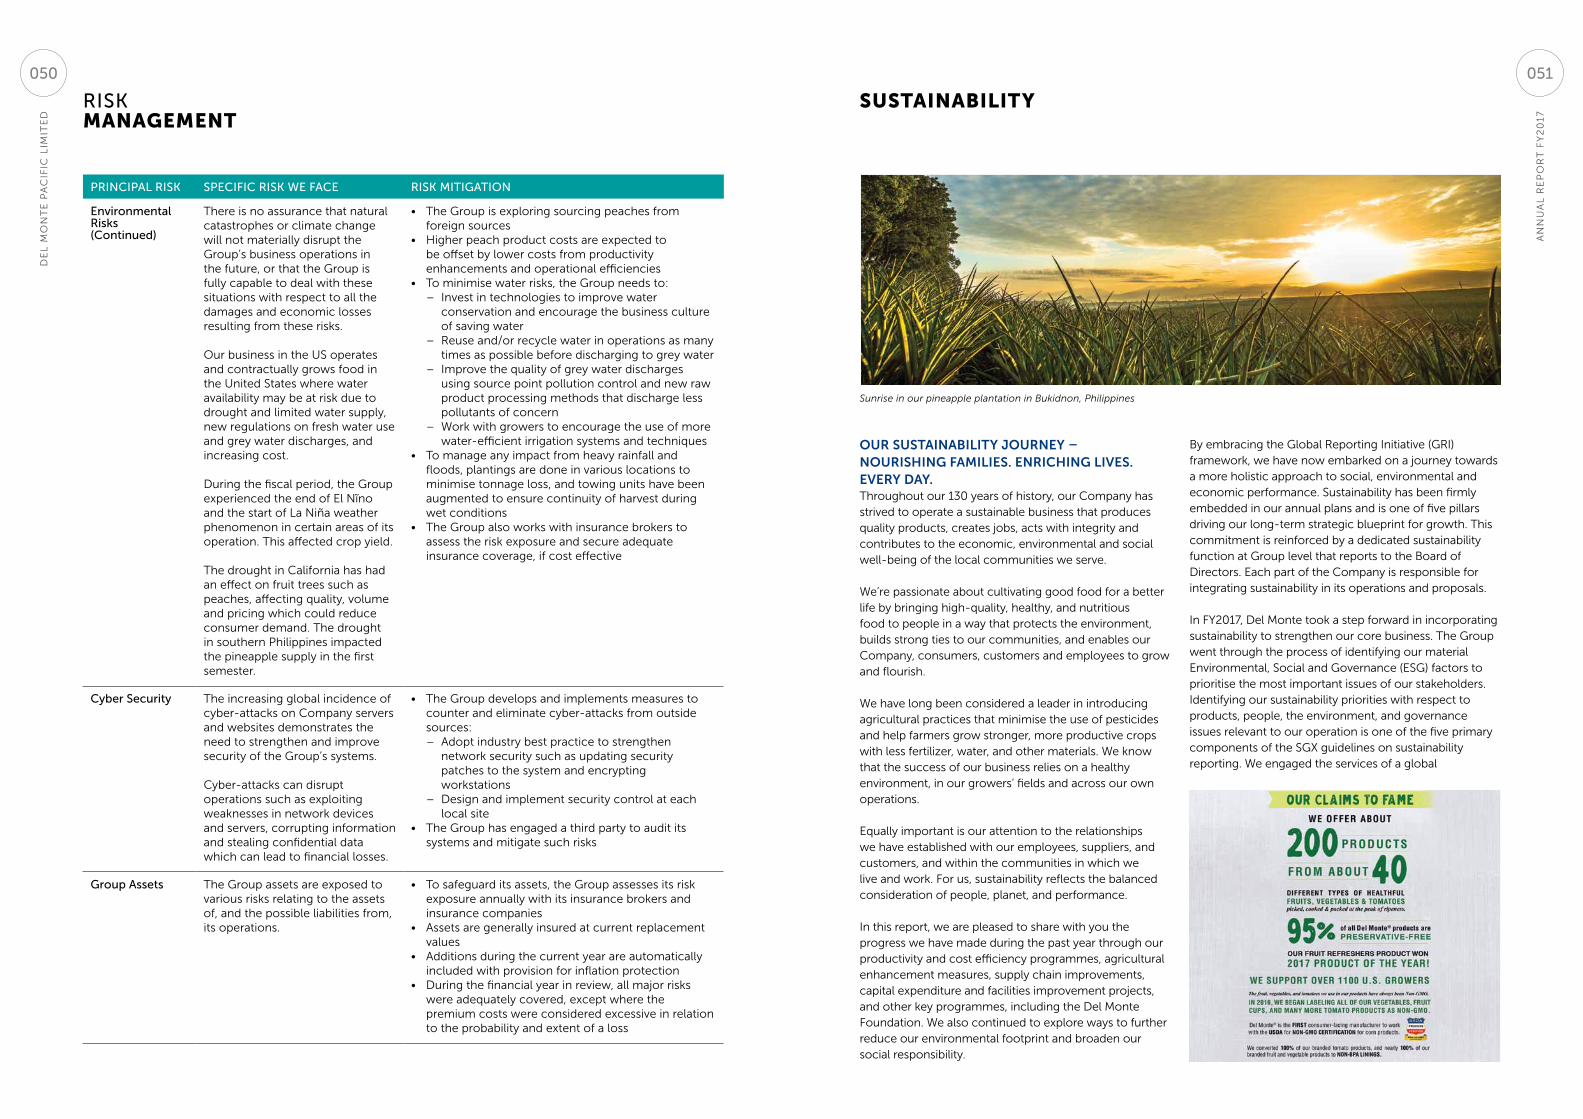
risk management
PrinciPal risk sPecific risk we face risk Mitigation
environmental risks (continued)
There is no assurance that natural catastrophes or climate change will not materially disrupt the Group’s business operations in the future, or that the Group is fully capable to deal with these situations with respect to all the damages and economic losses resulting from these risks.
our business in the uS operates and contractually grows food in the united States where water availability may be at risk due to drought and limited water supply, new regulations on fresh water use and grey water discharges, and increasing cost.
During the fiscal period, the Group experienced the end of el nĩno and the start of la niña weather phenomenon in certain areas of its operation. This affected crop yield.
The drought in California has had an effect on fruit trees such as peaches, affecting quality, volume and pricing which could reduce consumer demand. The drought in southern philippines impacted the pineapple supply in the first semester.
• The Group is exploring sourcing peaches from foreign sources
• Higher peach product costs are expected to be offset by lower costs from productivity enhancements and operational efficiencies
• To minimise water risks, the Group needs to: – Invest in technologies to improve water
conservation and encourage the business culture of saving water
– Reuse and/or recycle water in operations as many times as possible before discharging to grey water
– Improve the quality of grey water discharges using source point pollution control and new raw product processing methods that discharge less pollutants of concern
– Work with growers to encourage the use of more water-efficient irrigation systems and techniques
• To manage any impact from heavy rainfall and floods, plantings are done in various locations to minimise tonnage loss, and towing units have been augmented to ensure continuity of harvest during wet conditions
• The Group also works with insurance brokers to assess the risk exposure and secure adequate insurance coverage, if cost effective
cyber security The increasing global incidence of cyber-attacks on Company servers and websites demonstrates the need to strengthen and improve security of the Group’s systems.
Cyber-attacks can disrupt operations such as exploiting weaknesses in network devices and servers, corrupting information and stealing confidential data which can lead to financial losses.
• The Group develops and implements measures to counter and eliminate cyber-attacks from outside sources:– Adopt industry best practice to strengthen
network security such as updating security patches to the system and encrypting workstations
– Design and implement security control at each local site
• The Group has engaged a third party to audit its systems and mitigate such risks
group assets The Group assets are exposed to various risks relating to the assets of, and the possible liabilities from, its operations.
• To safeguard its assets, the Group assesses its risk exposure annually with its insurance brokers and insurance companies
• Assets are generally insured at current replacement values
• Additions during the current year are automatically included with provision for inflation protection
• During the financial year in review, all major risks were adequately covered, except where the premium costs were considered excessive in relation to the probability and extent of a loss
SuStainability
our sustainaBilitY JourneY – nourisHing faMilies. enricHing lives. everY DaY.Throughout our 130 years of history, our Company has strived to operate a sustainable business that produces quality products, creates jobs, acts with integrity and contributes to the economic, environmental and social well-being of the local communities we serve.
We’re passionate about cultivating good food for a better life by bringing high-quality, healthy, and nutritious food to people in a way that protects the environment, builds strong ties to our communities, and enables our Company, consumers, customers and employees to grow and flourish.
We have long been considered a leader in introducing agricultural practices that minimise the use of pesticides and help farmers grow stronger, more productive crops with less fertilizer, water, and other materials. We know that the success of our business relies on a healthy environment, in our growers’ fields and across our own operations.
equally important is our attention to the relationships we have established with our employees, suppliers, and customers, and within the communities in which we live and work. For us, sustainability reflects the balanced consideration of people, planet, and performance.
In this report, we are pleased to share with you the progress we have made during the past year through our productivity and cost efficiency programmes, agricultural enhancement measures, supply chain improvements, capital expenditure and facilities improvement projects, and other key programmes, including the Del Monte Foundation. We also continued to explore ways to further reduce our environmental footprint and broaden our social responsibility.
By embracing the Global Reporting Initiative (GRI) framework, we have now embarked on a journey towards a more holistic approach to social, environmental and economic performance. Sustainability has been firmly embedded in our annual plans and is one of five pillars driving our long-term strategic blueprint for growth. This commitment is reinforced by a dedicated sustainability function at Group level that reports to the Board of Directors. each part of the Company is responsible for integrating sustainability in its operations and proposals.
In FY2017, Del Monte took a step forward in incorporating sustainability to strengthen our core business. The Group went through the process of identifying our material environmental, Social and Governance (eSG) factors to prioritise the most important issues of our stakeholders. Identifying our sustainability priorities with respect to products, people, the environment, and governance issues relevant to our operation is one of the five primary components of the SGX guidelines on sustainability reporting. We engaged the services of a global
Sunrise in our pineapple plantation in Bukidnon, Philippines
An
nu
Al
Re
po
RT
FY
20
17
De
l M
on
Te
pA
CIF
IC l
IMIT
eD
051050
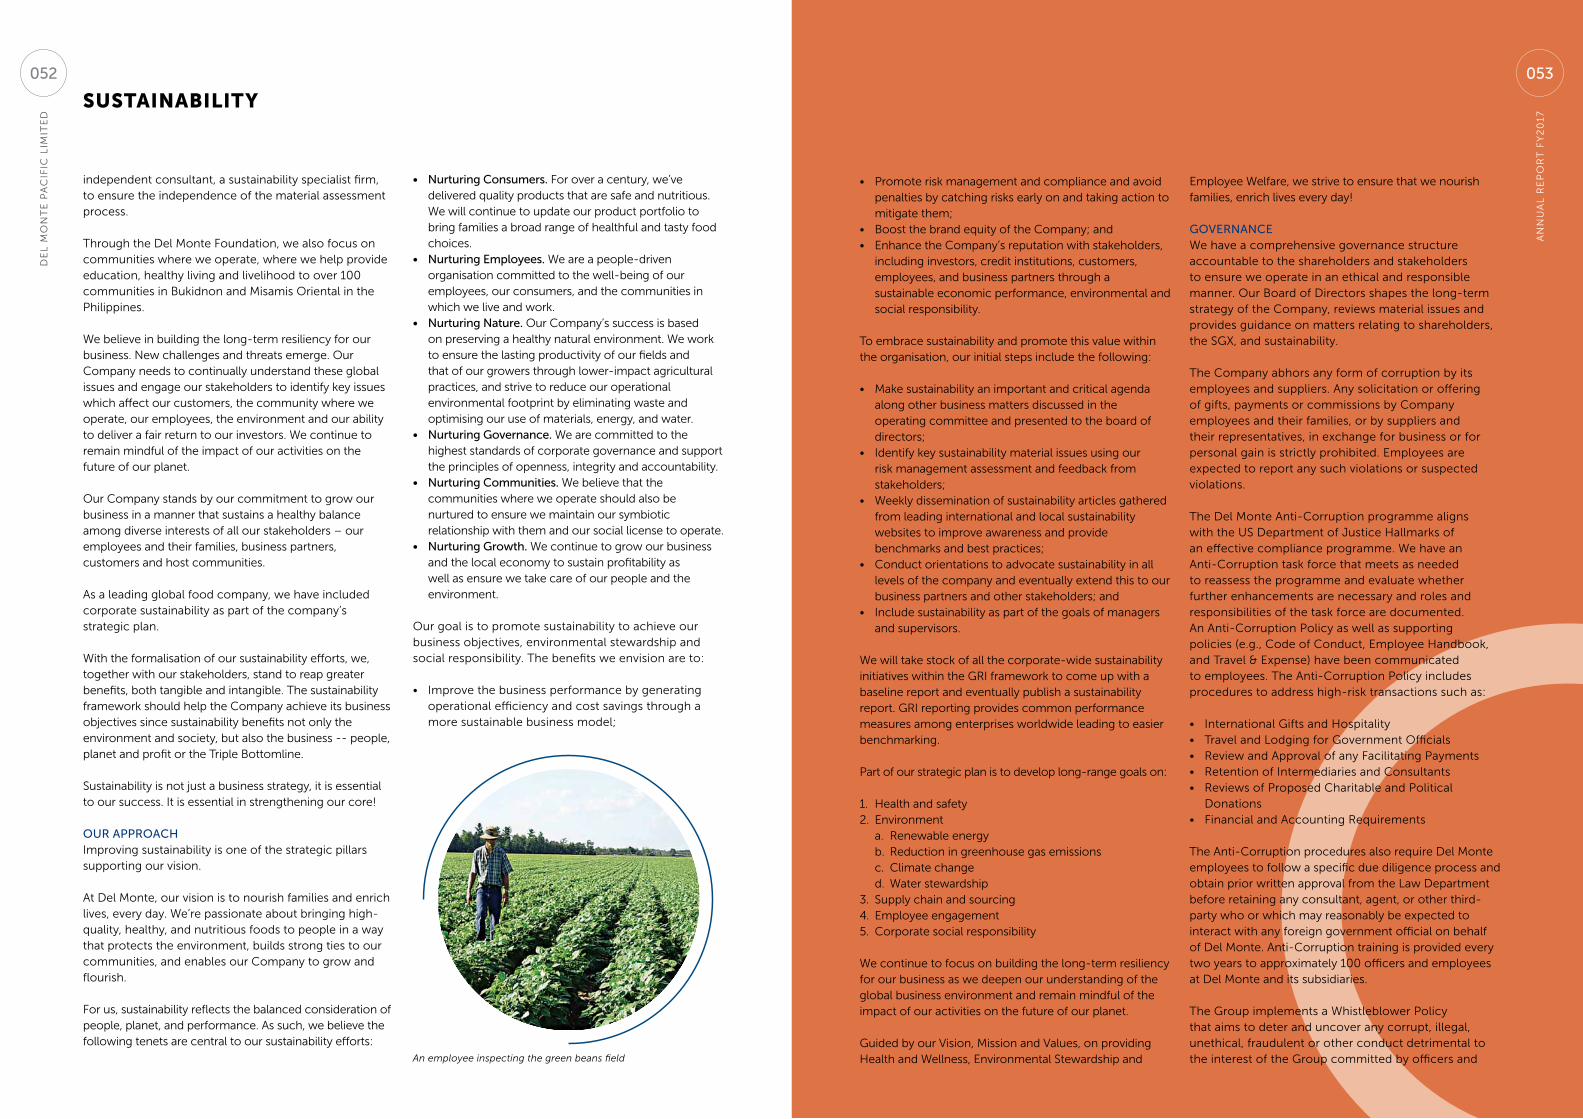
independent consultant, a sustainability specialist firm, to ensure the independence of the material assessment process.
Through the Del Monte Foundation, we also focus on communities where we operate, where we help provide education, healthy living and livelihood to over 100 communities in Bukidnon and Misamis oriental in the philippines.
We believe in building the long-term resiliency for our business. new challenges and threats emerge. our Company needs to continually understand these global issues and engage our stakeholders to identify key issues which affect our customers, the community where we operate, our employees, the environment and our ability to deliver a fair return to our investors. We continue to remain mindful of the impact of our activities on the future of our planet.
our Company stands by our commitment to grow our business in a manner that sustains a healthy balance among diverse interests of all our stakeholders – our employees and their families, business partners, customers and host communities.
As a leading global food company, we have included corporate sustainability as part of the company’s strategic plan.
With the formalisation of our sustainability efforts, we, together with our stakeholders, stand to reap greater benefits, both tangible and intangible. The sustainability framework should help the Company achieve its business objectives since sustainability benefits not only the environment and society, but also the business -- people, planet and profit or the Triple Bottomline.
Sustainability is not just a business strategy, it is essential to our success. It is essential in strengthening our core!
our aPProachImproving sustainability is one of the strategic pillars supporting our vision.
At Del Monte, our vision is to nourish families and enrich lives, every day. We’re passionate about bringing high-quality, healthy, and nutritious foods to people in a way that protects the environment, builds strong ties to our communities, and enables our Company to grow and flourish.
For us, sustainability reflects the balanced consideration of people, planet, and performance. As such, we believe the following tenets are central to our sustainability efforts:
• nurturing consumers. For over a century, we’ve delivered quality products that are safe and nutritious. We will continue to update our product portfolio to bring families a broad range of healthful and tasty food choices.
• nurturing employees. We are a people-driven organisation committed to the well-being of our employees, our consumers, and the communities in which we live and work.
• nurturing nature. our Company’s success is based on preserving a healthy natural environment. We work to ensure the lasting productivity of our fields and that of our growers through lower-impact agricultural practices, and strive to reduce our operational environmental footprint by eliminating waste and optimising our use of materials, energy, and water.
• nurturing governance. We are committed to the highest standards of corporate governance and support the principles of openness, integrity and accountability.
• nurturing communities. We believe that the communities where we operate should also be nurtured to ensure we maintain our symbiotic relationship with them and our social license to operate.
• nurturing growth. We continue to grow our business and the local economy to sustain profitability as well as ensure we take care of our people and the environment.
our goal is to promote sustainability to achieve our business objectives, environmental stewardship and social responsibility. The benefits we envision are to:
• Improve the business performance by generating operational efficiency and cost savings through a more sustainable business model;
An employee inspecting the green beans field
SuStainability
• promote risk management and compliance and avoid penalties by catching risks early on and taking action to mitigate them;
• Boost the brand equity of the Company; and• enhance the Company’s reputation with stakeholders,
including investors, credit institutions, customers, employees, and business partners through a sustainable economic performance, environmental and social responsibility.
To embrace sustainability and promote this value within the organisation, our initial steps include the following:
• Make sustainability an important and critical agenda along other business matters discussed in the operating committee and presented to the board of directors;
• Identify key sustainability material issues using our risk management assessment and feedback from stakeholders;
• Weekly dissemination of sustainability articles gathered from leading international and local sustainability websites to improve awareness and provide benchmarks and best practices;
• Conduct orientations to advocate sustainability in all levels of the company and eventually extend this to our business partners and other stakeholders; and
• Include sustainability as part of the goals of managers and supervisors.
We will take stock of all the corporate-wide sustainability initiatives within the GRI framework to come up with a baseline report and eventually publish a sustainability report. GRI reporting provides common performance measures among enterprises worldwide leading to easier benchmarking.
part of our strategic plan is to develop long-range goals on:
1. Health and safety2. environment
a. Renewable energyb. Reduction in greenhouse gas emissionsc. Climate changed. Water stewardship
3. Supply chain and sourcing4. employee engagement 5. Corporate social responsibility
We continue to focus on building the long-term resiliency for our business as we deepen our understanding of the global business environment and remain mindful of the impact of our activities on the future of our planet.
Guided by our Vision, Mission and Values, on providing Health and Wellness, environmental Stewardship and
employee Welfare, we strive to ensure that we nourish families, enrich lives every day!
governanceWe have a comprehensive governance structure accountable to the shareholders and stakeholders to ensure we operate in an ethical and responsible manner. our Board of Directors shapes the long-term strategy of the Company, reviews material issues and provides guidance on matters relating to shareholders, the SGX, and sustainability.
The Company abhors any form of corruption by its employees and suppliers. Any solicitation or offering of gifts, payments or commissions by Company employees and their families, or by suppliers and their representatives, in exchange for business or for personal gain is strictly prohibited. employees are expected to report any such violations or suspected violations.
The Del Monte Anti-Corruption programme aligns with the uS Department of Justice Hallmarks of an effective compliance programme. We have an Anti-Corruption task force that meets as needed to reassess the programme and evaluate whether further enhancements are necessary and roles and responsibilities of the task force are documented. An Anti-Corruption policy as well as supporting policies (e.g., Code of Conduct, employee Handbook, and Travel & expense) have been communicated to employees. The Anti-Corruption policy includes procedures to address high-risk transactions such as:
• International Gifts and Hospitality• Travel and lodging for Government officials• Review and Approval of any Facilitating payments• Retention of Intermediaries and Consultants• Reviews of proposed Charitable and political
Donations• Financial and Accounting Requirements
The Anti-Corruption procedures also require Del Monte employees to follow a specific due diligence process and obtain prior written approval from the law Department before retaining any consultant, agent, or other third-party who or which may reasonably be expected to interact with any foreign government official on behalf of Del Monte. Anti-Corruption training is provided every two years to approximately 100 officers and employees at Del Monte and its subsidiaries.
The Group implements a Whistleblower policy that aims to deter and uncover any corrupt, illegal, unethical, fraudulent or other conduct detrimental to the interest of the Group committed by officers and
An
nu
Al
Re
po
RT
FY
20
17
053
De
l M
on
Te
pA
CIF
IC l
IMIT
eD
052
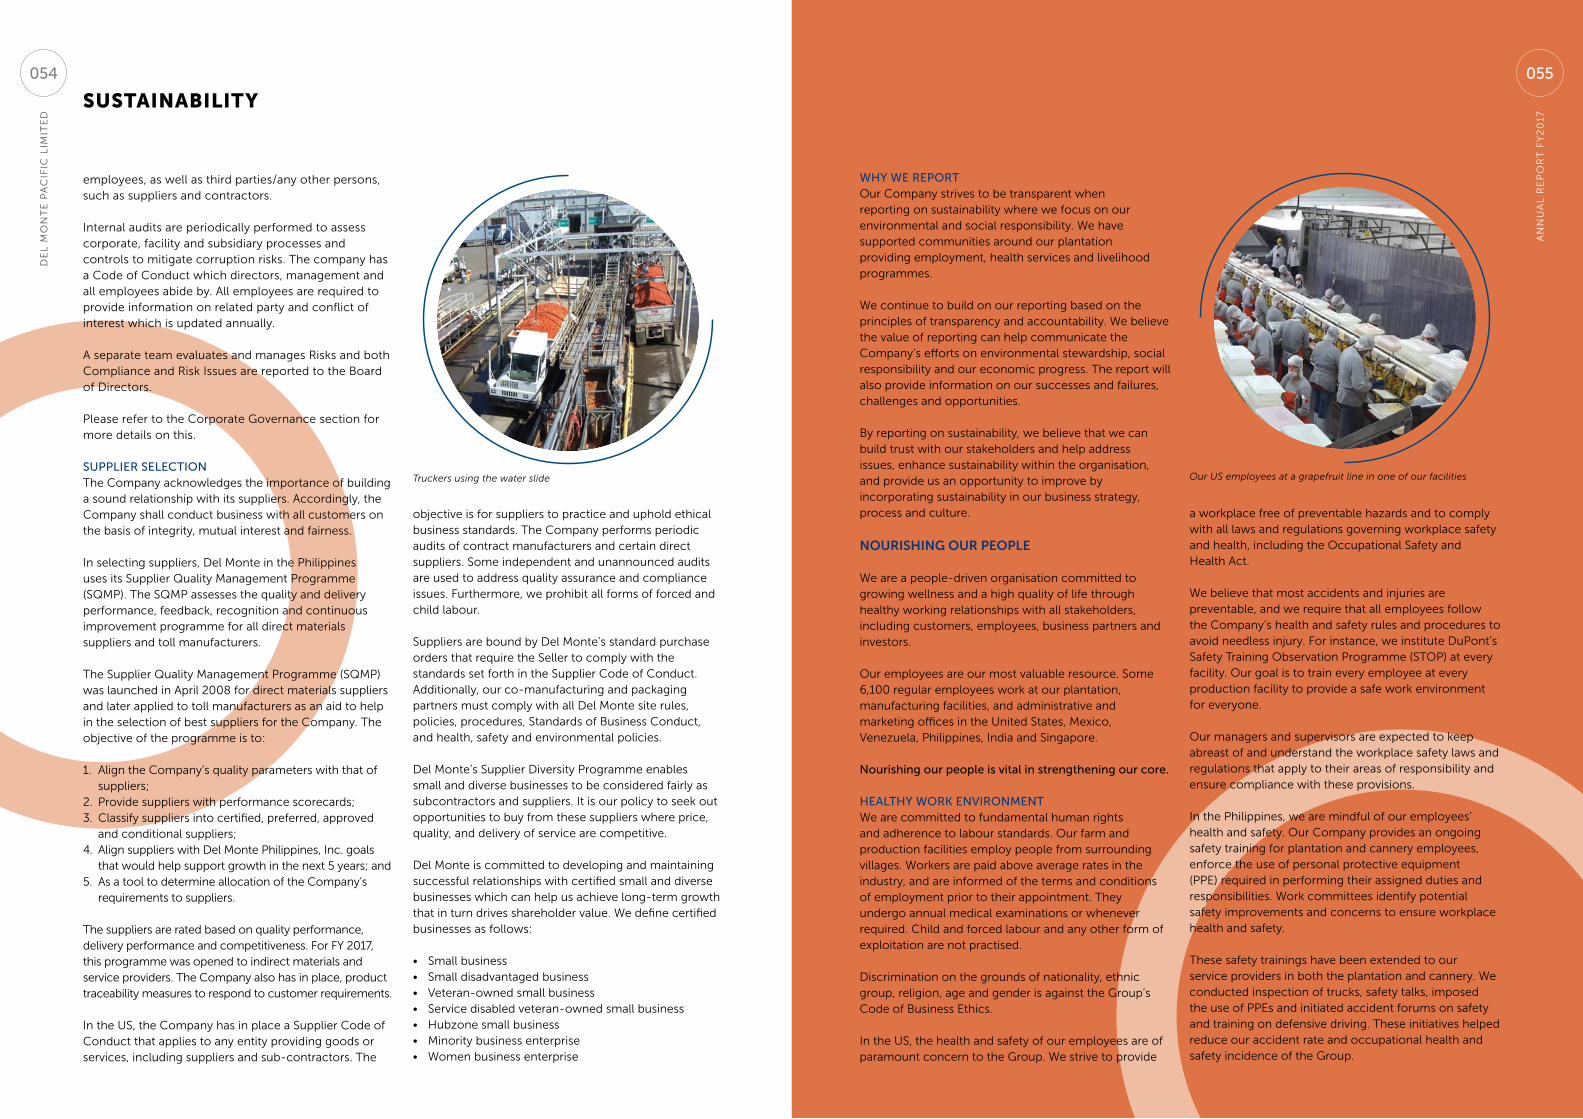
SuStainability
employees, as well as third parties/any other persons, such as suppliers and contractors.
Internal audits are periodically performed to assess corporate, facility and subsidiary processes and controls to mitigate corruption risks. The company has a Code of Conduct which directors, management and all employees abide by. All employees are required to provide information on related party and conflict of interest which is updated annually.
A separate team evaluates and manages Risks and both Compliance and Risk Issues are reported to the Board of Directors.
please refer to the Corporate Governance section for more details on this.
suPPlier selectionThe Company acknowledges the importance of building a sound relationship with its suppliers. Accordingly, the Company shall conduct business with all customers on the basis of integrity, mutual interest and fairness.
In selecting suppliers, Del Monte in the philippines uses its Supplier Quality Management programme (SQMp). The SQMp assesses the quality and delivery performance, feedback, recognition and continuous improvement programme for all direct materials suppliers and toll manufacturers.
The Supplier Quality Management programme (SQMp) was launched in April 2008 for direct materials suppliers and later applied to toll manufacturers as an aid to help in the selection of best suppliers for the Company. The objective of the programme is to:
1. Align the Company’s quality parameters with that of suppliers;
2. provide suppliers with performance scorecards; 3. Classify suppliers into certified, preferred, approved
and conditional suppliers; 4. Align suppliers with Del Monte philippines, Inc. goals
that would help support growth in the next 5 years; and5. As a tool to determine allocation of the Company’s
requirements to suppliers.
The suppliers are rated based on quality performance, delivery performance and competitiveness. For FY 2017, this programme was opened to indirect materials and service providers. The Company also has in place, product traceability measures to respond to customer requirements.
In the uS, the Company has in place a Supplier Code of Conduct that applies to any entity providing goods or services, including suppliers and sub-contractors. The
objective is for suppliers to practice and uphold ethical business standards. The Company performs periodic audits of contract manufacturers and certain direct suppliers. Some independent and unannounced audits are used to address quality assurance and compliance issues. Furthermore, we prohibit all forms of forced and child labour.
Suppliers are bound by Del Monte’s standard purchase orders that require the Seller to comply with the standards set forth in the Supplier Code of Conduct. Additionally, our co-manufacturing and packaging partners must comply with all Del Monte site rules, policies, procedures, Standards of Business Conduct, and health, safety and environmental policies.
Del Monte’s Supplier Diversity programme enables small and diverse businesses to be considered fairly as subcontractors and suppliers. It is our policy to seek out opportunities to buy from these suppliers where price, quality, and delivery of service are competitive.
Del Monte is committed to developing and maintaining successful relationships with certified small and diverse businesses which can help us achieve long-term growth that in turn drives shareholder value. We define certified businesses as follows:
• Small business• Small disadvantaged business• Veteran-owned small business• Service disabled veteran-owned small business• Hubzone small business• Minority business enterprise • Women business enterprise
Truckers using the water slide
why we rePortour Company strives to be transparent when reporting on sustainability where we focus on our environmental and social responsibility. We have supported communities around our plantation providing employment, health services and livelihood programmes.
We continue to build on our reporting based on the principles of transparency and accountability. We believe the value of reporting can help communicate the Company’s efforts on environmental stewardship, social responsibility and our economic progress. The report will also provide information on our successes and failures, challenges and opportunities.
By reporting on sustainability, we believe that we can build trust with our stakeholders and help address issues, enhance sustainability within the organisation, and provide us an opportunity to improve by incorporating sustainability in our business strategy, process and culture.
nourisHing our people
We are a people-driven organisation committed to growing wellness and a high quality of life through healthy working relationships with all stakeholders, including customers, employees, business partners and investors.
our employees are our most valuable resource. Some 6,100 regular employees work at our plantation, manufacturing facilities, and administrative and marketing offices in the united States, Mexico, Venezuela, philippines, India and Singapore.
nourishing our people is vital in strengthening our core.
healthy work environMentWe are committed to fundamental human rights and adherence to labour standards. our farm and production facilities employ people from surrounding villages. Workers are paid above average rates in the industry, and are informed of the terms and conditions of employment prior to their appointment. They undergo annual medical examinations or whenever required. Child and forced labour and any other form of exploitation are not practised.
Discrimination on the grounds of nationality, ethnic group, religion, age and gender is against the Group’s Code of Business ethics.
In the uS, the health and safety of our employees are of paramount concern to the Group. We strive to provide
Our US employees at a grapefruit line in one of our facilities
a workplace free of preventable hazards and to comply with all laws and regulations governing workplace safety and health, including the occupational Safety and Health Act.
We believe that most accidents and injuries are preventable, and we require that all employees follow the Company’s health and safety rules and procedures to avoid needless injury. For instance, we institute Dupont’s Safety Training observation programme (STop) at every facility. our goal is to train every employee at every production facility to provide a safe work environment for everyone.
our managers and supervisors are expected to keep abreast of and understand the workplace safety laws and regulations that apply to their areas of responsibility and ensure compliance with these provisions.
In the philippines, we are mindful of our employees’ health and safety. our Company provides an ongoing safety training for plantation and cannery employees, enforce the use of personal protective equipment (ppe) required in performing their assigned duties and responsibilities. Work committees identify potential safety improvements and concerns to ensure workplace health and safety.
These safety trainings have been extended to our service providers in both the plantation and cannery. We conducted inspection of trucks, safety talks, imposed the use of ppes and initiated accident forums on safety and training on defensive driving. These initiatives helped reduce our accident rate and occupational health and safety incidence of the Group.
An
nu
Al
Re
po
RT
FY
20
17
055
De
l M
on
Te
pA
CIF
IC l
IMIT
eD
054

SuStainability
The Jose Y. Campos Centre building, where our office in Manila is located, was certified leeD Silver by the uSGBC. The building provides employees with a safe and healthy work environment. The building boasts itself as energy and water efficient and uses materials safe for building occupants. our office design promotes collaboration and better communication among employees.
training anD DeveloPMentour Company cultivates a culture of excellence as we continue to encourage our people to innovate and strive for continuous improvement.
professional development is an integral part of our performance system and links to our core values and competencies for Del Monte in the uS. employees are encouraged to participate in opportunities and programmes that will contribute to their ability to deliver value and ensure further growth and success for themselves and the Company.
We offer specific developmental programmes to help employees meet organisational objectives, enhance their careers, and maintain a consistently high level of performance. These opportunities include:
• Managers provide internal learning opportunities by working closely with employees to structure appropriate on-the-job activities to meet identified developmental needs.
• external programmes and professional certifications are provided at seminars, conferences or other specialized workshops.
• external university courses are available through the Del Monte employee education Assistance programme. under the provisions of this programme, eligible employees may receive up to $5,250 annually in financial assistance for approved courses of study at accredited educational institutions.
In the philippines, our Roadmap to Global Competitiveness starts with building on the capabilities of each employee on the ground. With the Centre of excellence on Talent Management, key leaders at the plantation, Cannery and philippine Market, we have developed a Competency Framework that will guide their teams towards achieving the Company’s Strategic Roadmap. The Framework that each team drafted
pinpoints the specific technical and operational skill set each team member must develop to deliver high performance. each Competency Framework also serves as a foundation for broad-range people programme on recruitment, learning, career development, succession planning, and performance management.
Training facilities on-site help employees upgrade technical and other skills. At “pineu” (pineapple university), plantation personnel hone farming expertise through formal sessions and benchmarking trips. “Manu” (Manufacturing university) is a breakthrough for cannery staff to reorient on processes and adapt to new technologies. Manu also administers two-year
Del Monte Manila Office First Aid Team
FY2017InCIDenCe
FY2016%
CHAnGe
Injury Rate 1.28 1.34 -4.4%
lost Work Days 2,533 2,682 -5.6%
supervisory and trade-traineeship programmes for high-potential applicants and long-serving employees. on the faculty are our senior managers who count among leading experts in their respective fields. Similar development programmes are implemented in Finance through its Finance university and Marketing’s Brand leadership university (Blu). The objective of these programmes is to improve and enhance development in their respective fields. other training programmes include safety training and orientation, first aid and emergency response training.
A management succession plan is fully in place, with a deep bench of candidates trained among our ranks to be able to immediately assume responsibilities of key management positions in the event of vacancy.
Benefitsour employees in the uS have benefits designed to provide employees the flexibility to select a package of coverage that meets their unique needs. Benefits are available to employees and their dependents, including children, spouses, and domestic partners. Benefits may include: medical, dental, and vision insurance; short and long-term disability insurance; life insurance; paid time off for vacation and holidays; savings plans; and employee assistance programmes.
In addition, we offer additional benefits that we believe help our employees improve their quality of life including an adoption assistance programme, community service day allocation (one volunteer day time-off per year), matching gifts donations, and floating holidays (at designated locations).
our workforce enjoys one of the most attractive compensation and benefit packages granted to agro-industrial workers in the philippines. Complementing government-mandated privileges for all employees and qualified dependents is a broad range of free medical and dental services, a comprehensive retirement package, and voluntary plans for providential and insurance benefits.
plantation employees live with their families in Group-owned houses and dormitories (for unmarried employees) within housing camps complete with a social hall, chapel, playground and plaza, day care centre, primary and secondary schools, camp clinics and a 100-bed hospital managed by a medical service provider. employee-organised cooperatives provide our workers with services that enhance economic benefits for their families. Cooperative members enjoy annual dividends and patronage refunds.
Children of cannery employees enjoy free year-round weekend tutorials on basketball and, as scheduled, other sports (tennis, swimming, martial arts) and creative skills (photography, theatre arts). Core values are introduced through learning exposure that helps them grow a strong sense of community and family life.
coMMunicationThe Group’s strategies and accomplishments as presented to the operations Committee during the Annual State-of-the-Business Meeting are cascaded to all employee levels through various forms of formal and informal information sharing in divisional, departmental and team assemblies.
Del Monte Mountaineers with Del Monte Fit ‘n Right Active Del Monte’s Tidbits news magazine
training prograMMes
Supervisor up
Monthlies
Hourlies
191 programmesAverage of 4 programmes per employee
16 programmesAverage of 2 programmes per employee
265 programmesAverage of 2 programmes per employee
37%
12%
51%
training PrograMMes
An
nu
Al
Re
po
RT
FY
20
17
057
De
l M
on
Te
pA
CIF
IC l
IMIT
eD
056
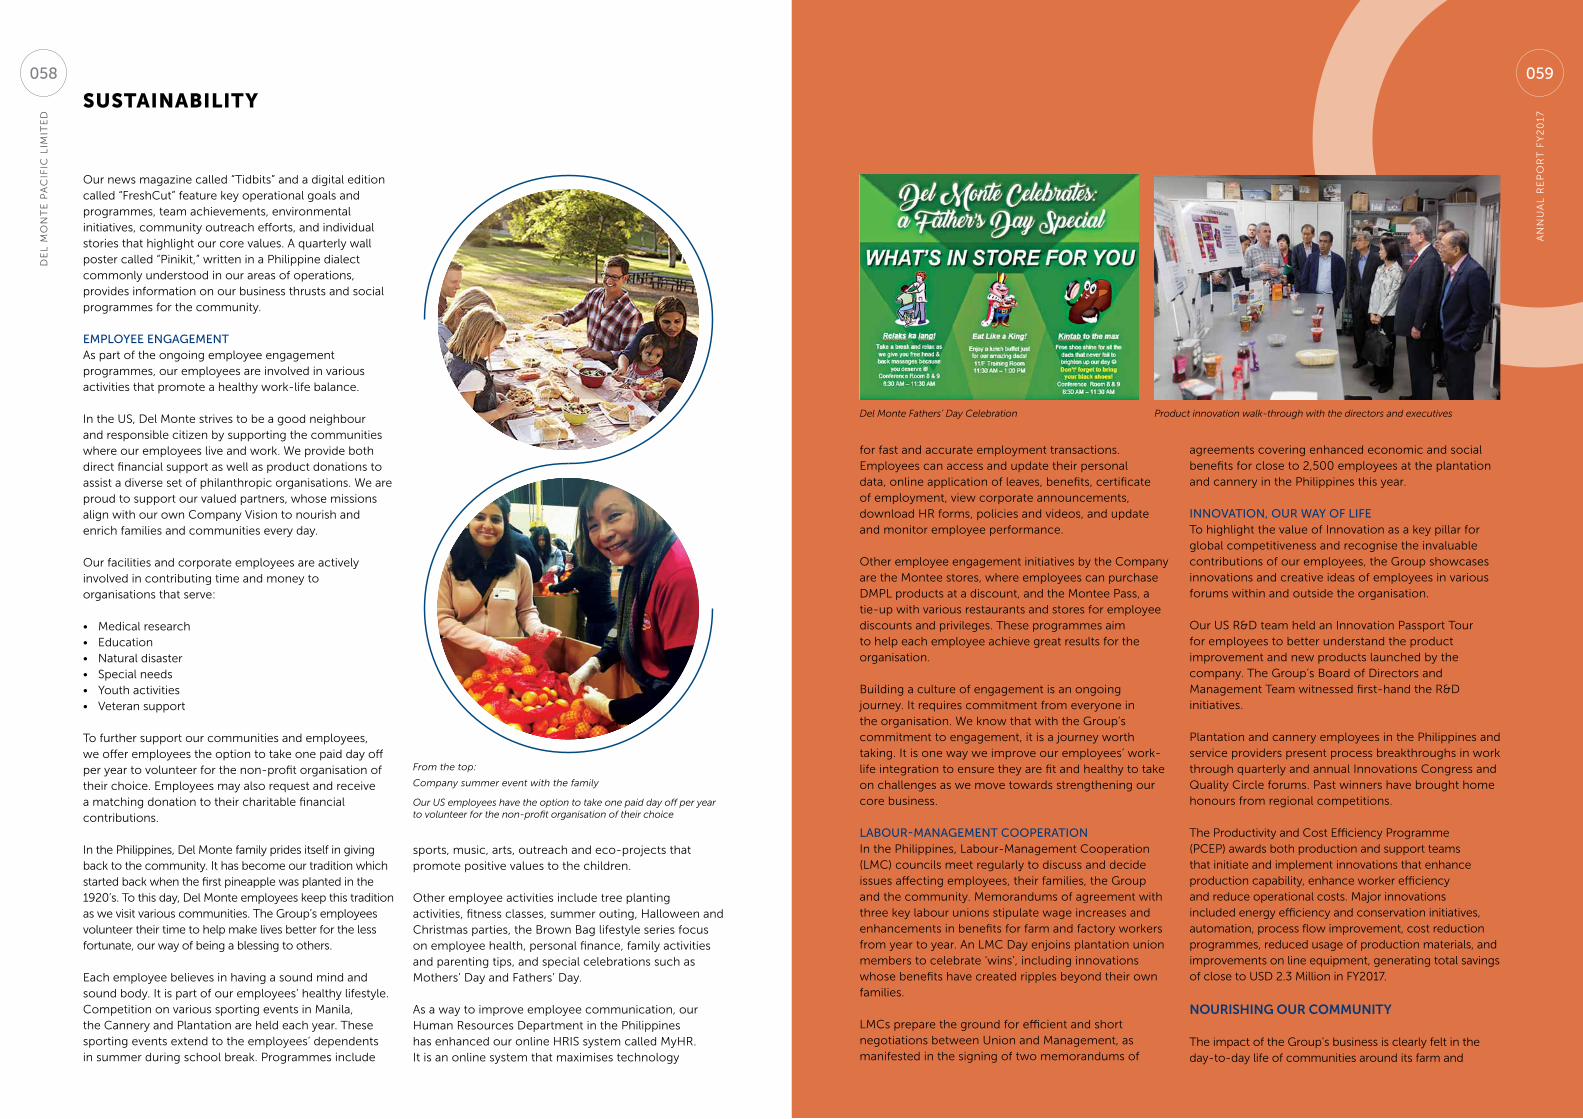
SuStainability
From the top:
Company summer event with the family
Our US employees have the option to take one paid day off per year to volunteer for the non-profit organisation of their choice
our news magazine called “Tidbits” and a digital edition called “FreshCut” feature key operational goals and programmes, team achievements, environmental initiatives, community outreach efforts, and individual stories that highlight our core values. A quarterly wall poster called “pinikit,” written in a philippine dialect commonly understood in our areas of operations, provides information on our business thrusts and social programmes for the community.
eMPloyee engageMentAs part of the ongoing employee engagement programmes, our employees are involved in various activities that promote a healthy work-life balance.
In the uS, Del Monte strives to be a good neighbour and responsible citizen by supporting the communities where our employees live and work. We provide both direct financial support as well as product donations to assist a diverse set of philanthropic organisations. We are proud to support our valued partners, whose missions align with our own Company Vision to nourish and enrich families and communities every day.
our facilities and corporate employees are actively involved in contributing time and money to organisations that serve:
• Medical research• education• natural disaster• Special needs• Youth activities• Veteran support
To further support our communities and employees, we offer employees the option to take one paid day off per year to volunteer for the non-profit organisation of their choice. employees may also request and receive a matching donation to their charitable financial contributions.
In the philippines, Del Monte family prides itself in giving back to the community. It has become our tradition which started back when the first pineapple was planted in the 1920’s. To this day, Del Monte employees keep this tradition as we visit various communities. The Group’s employees volunteer their time to help make lives better for the less fortunate, our way of being a blessing to others.
each employee believes in having a sound mind and sound body. It is part of our employees’ healthy lifestyle. Competition on various sporting events in Manila, the Cannery and plantation are held each year. These sporting events extend to the employees’ dependents in summer during school break. programmes include
sports, music, arts, outreach and eco-projects that promote positive values to the children.
other employee activities include tree planting activities, fitness classes, summer outing, Halloween and Christmas parties, the Brown Bag lifestyle series focus on employee health, personal finance, family activities and parenting tips, and special celebrations such as Mothers’ Day and Fathers’ Day.
As a way to improve employee communication, our Human Resources Department in the philippines has enhanced our online HRIS system called MyHR. It is an online system that maximises technology
for fast and accurate employment transactions. employees can access and update their personal data, online application of leaves, benefits, certificate of employment, view corporate announcements, download HR forms, policies and videos, and update and monitor employee performance.
other employee engagement initiatives by the Company are the Montee stores, where employees can purchase DMpl products at a discount, and the Montee pass, a tie-up with various restaurants and stores for employee discounts and privileges. These programmes aim to help each employee achieve great results for the organisation.
Building a culture of engagement is an ongoing journey. It requires commitment from everyone in the organisation. We know that with the Group’s commitment to engagement, it is a journey worth taking. It is one way we improve our employees’ work-life integration to ensure they are fit and healthy to take on challenges as we move towards strengthening our core business.
laBour-ManageMent cooPerationIn the philippines, labour-Management Cooperation (lMC) councils meet regularly to discuss and decide issues affecting employees, their families, the Group and the community. Memorandums of agreement with three key labour unions stipulate wage increases and enhancements in benefits for farm and factory workers from year to year. An lMC Day enjoins plantation union members to celebrate ‘wins’, including innovations whose benefits have created ripples beyond their own families.
lMCs prepare the ground for efficient and short negotiations between union and Management, as manifested in the signing of two memorandums of
agreements covering enhanced economic and social benefits for close to 2,500 employees at the plantation and cannery in the philippines this year.
innovation, our way of lifeTo highlight the value of Innovation as a key pillar for global competitiveness and recognise the invaluable contributions of our employees, the Group showcases innovations and creative ideas of employees in various forums within and outside the organisation.
our uS R&D team held an Innovation passport Tour for employees to better understand the product improvement and new products launched by the company. The Group’s Board of Directors and Management Team witnessed first-hand the R&D initiatives.
plantation and cannery employees in the philippines and service providers present process breakthroughs in work through quarterly and annual Innovations Congress and Quality Circle forums. past winners have brought home honours from regional competitions.
The productivity and Cost efficiency programme (pCep) awards both production and support teams that initiate and implement innovations that enhance production capability, enhance worker efficiency and reduce operational costs. Major innovations included energy efficiency and conservation initiatives, automation, process flow improvement, cost reduction programmes, reduced usage of production materials, and improvements on line equipment, generating total savings of close to uSD 2.3 Million in FY2017.
nourisHing our coMMunitY
The impact of the Group’s business is clearly felt in the day-to-day life of communities around its farm and
Del Monte Fathers’ Day Celebration Product innovation walk-through with the directors and executives
An
nu
Al
Re
po
RT
FY
20
17
059
De
l M
on
Te
pA
CIF
IC l
IMIT
eD
058
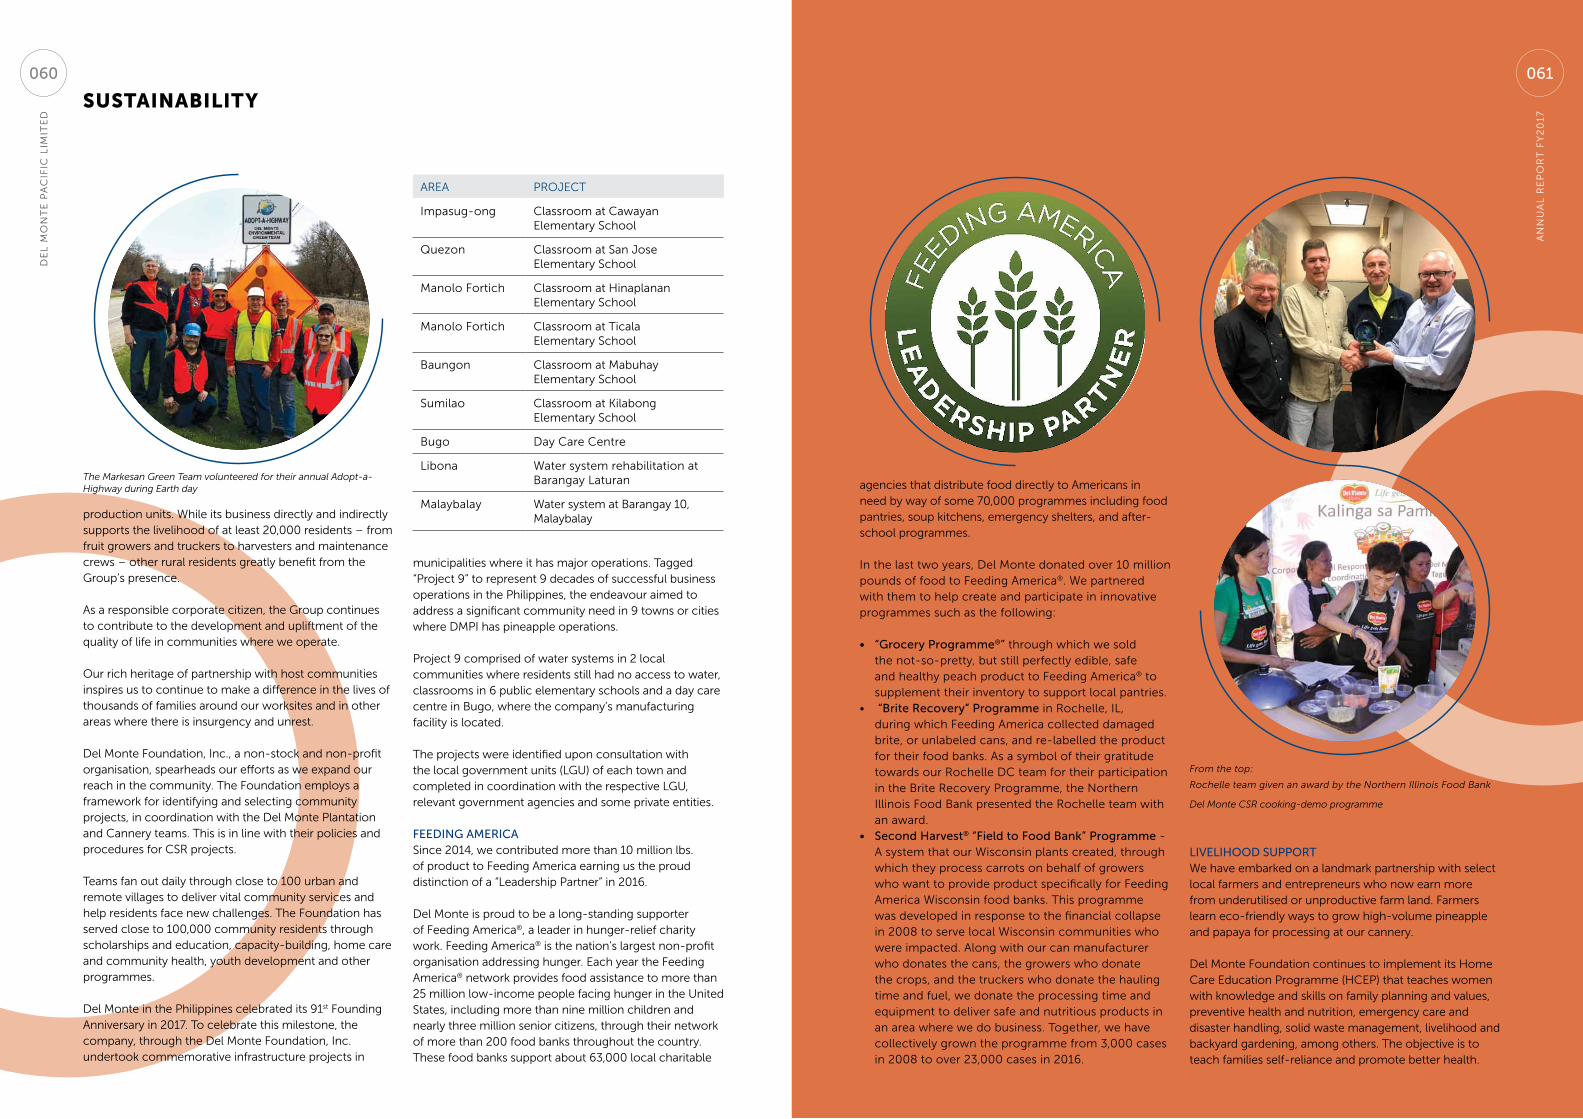
SuStainability
production units. While its business directly and indirectly supports the livelihood of at least 20,000 residents – from fruit growers and truckers to harvesters and maintenance crews – other rural residents greatly benefit from the Group’s presence.
As a responsible corporate citizen, the Group continues to contribute to the development and upliftment of the quality of life in communities where we operate.
our rich heritage of partnership with host communities inspires us to continue to make a difference in the lives of thousands of families around our worksites and in other areas where there is insurgency and unrest.
Del Monte Foundation, Inc., a non-stock and non-profit organisation, spearheads our efforts as we expand our reach in the community. The Foundation employs a framework for identifying and selecting community projects, in coordination with the Del Monte plantation and Cannery teams. This is in line with their policies and procedures for CSR projects.
Teams fan out daily through close to 100 urban and remote villages to deliver vital community services and help residents face new challenges. The Foundation has served close to 100,000 community residents through scholarships and education, capacity-building, home care and community health, youth development and other programmes.
Del Monte in the philippines celebrated its 91st Founding Anniversary in 2017. To celebrate this milestone, the company, through the Del Monte Foundation, Inc. undertook commemorative infrastructure projects in
municipalities where it has major operations. Tagged “project 9” to represent 9 decades of successful business operations in the philippines, the endeavour aimed to address a significant community need in 9 towns or cities where DMpI has pineapple operations.
project 9 comprised of water systems in 2 local communities where residents still had no access to water, classrooms in 6 public elementary schools and a day care centre in Bugo, where the company’s manufacturing facility is located.
The projects were identified upon consultation with the local government units (lGu) of each town and completed in coordination with the respective lGu, relevant government agencies and some private entities.
feeDing aMericaSince 2014, we contributed more than 10 million lbs. of product to Feeding America earning us the proud distinction of a “leadership partner” in 2016.
Del Monte is proud to be a long-standing supporter of Feeding America®, a leader in hunger-relief charity work. Feeding America® is the nation’s largest non-profit organisation addressing hunger. each year the Feeding America® network provides food assistance to more than 25 million low-income people facing hunger in the united States, including more than nine million children and nearly three million senior citizens, through their network of more than 200 food banks throughout the country. These food banks support about 63,000 local charitable
AReA pRoJeCT
Impasug-ong Classroom at Cawayan elementary School
Quezon Classroom at San Jose elementary School
Manolo Fortich Classroom at Hinaplanan elementary School
Manolo Fortich Classroom at Ticala elementary School
Baungon Classroom at Mabuhay elementary School
Sumilao Classroom at Kilabong elementary School
Bugo Day Care Centre
libona Water system rehabilitation at Barangay laturan
Malaybalay Water system at Barangay 10, Malaybalay
agencies that distribute food directly to Americans in need by way of some 70,000 programmes including food pantries, soup kitchens, emergency shelters, and after-school programmes.
In the last two years, Del Monte donated over 10 million pounds of food to Feeding America®. We partnered with them to help create and participate in innovative programmes such as the following:
• “grocery Programme®” through which we sold the not-so-pretty, but still perfectly edible, safe and healthy peach product to Feeding America® to supplement their inventory to support local pantries.
• “Brite recovery” Programme in Rochelle, Il, during which Feeding America collected damaged brite, or unlabeled cans, and re-labelled the product for their food banks. As a symbol of their gratitude towards our Rochelle DC team for their participation in the Brite Recovery programme, the northern Illinois Food Bank presented the Rochelle team with an award.
• second harvest® “field to food Bank” Programme - A system that our Wisconsin plants created, through which they process carrots on behalf of growers who want to provide product specifically for Feeding America Wisconsin food banks. This programme was developed in response to the financial collapse in 2008 to serve local Wisconsin communities who were impacted. Along with our can manufacturer who donates the cans, the growers who donate the crops, and the truckers who donate the hauling time and fuel, we donate the processing time and equipment to deliver safe and nutritious products in an area where we do business. Together, we have collectively grown the programme from 3,000 cases in 2008 to over 23,000 cases in 2016.
livelihooD suPPortWe have embarked on a landmark partnership with select local farmers and entrepreneurs who now earn more from underutilised or unproductive farm land. Farmers learn eco-friendly ways to grow high-volume pineapple and papaya for processing at our cannery.
Del Monte Foundation continues to implement its Home Care education programme (HCep) that teaches women with knowledge and skills on family planning and values, preventive health and nutrition, emergency care and disaster handling, solid waste management, livelihood and backyard gardening, among others. The objective is to teach families self-reliance and promote better health.
From the top:
Rochelle team given an award by the Northern Illinois Food Bank
Del Monte CSR cooking-demo programme
The Markesan Green Team volunteered for their annual Adopt-a-Highway during Earth day
An
nu
Al
Re
po
RT
FY
20
17
061
De
l M
on
Te
pA
CIF
IC l
IMIT
eD
060

SuStainability
over 230 women and heads of families completed the 5-month Home Care education programme in 5 local communities in the company’s newly-opened pineapple operations. In 23 local communities across 5 municipalities, refresher courses were conducted for over 2,000 former HCep beneficiaries. The sessions were a follow-through on the graduates’ retention and application of the principles and lessons learned when they took the course in past years.
earlier in the year, the Foundation received recognition and appreciation from the Department of Social Welfare and Development (DSWD) Region-10 as a valued partner in its Sustainable livelihood programme. This was due to the Foundation’s inclusion of members of DSWD’s financial assistance programme among its programme beneficiaries to help them become self-reliant.
technical eDucationWe promote short-term technical skills courses as an alternative to college education as we introduce community leaders, family heads, women and out-of-school youth and families of employees to agro-technical skills.
our main Community education Centre received official accreditation from the philippine Technical education and Skills Development Authority (TeSDA), highlighting public-private sector cooperation for community education. The Group has channelled funds for enhanced learning in five centres, all satellite training centres of the government. Fully-equipped workshops welcome students in food processing, commercial cooking, baking, electronics, welding and woodworking. A computer centre, with 15 computer units and internet access, also serves
Beauty care services, one of the technical skills programme offered by the Foundation
the community. Continuing partnership with TeSDA ensures that training standards comply with government requirements. local governments help us select training participants, identify skills needed by the community, and find jobs for its graduates.
The Foundation conducted 22 community-based technical skills trainings across 15 municipalities which equipped around 900 beneficiaries with skills that could help them find employment or start a livelihood. The trainings were conducted in cooperation with TeSDA, DSWD and the respective local government units.
Following were the courses offered:
CouRSe no. oF GRADuATeS
Blacksmithing 23
Cosmetology/ Beauty Care Services
144
Defensive Driving 200
electrical Installation & Maintenance
238
Housekeeping 38
Massage Therapy 48
Shielded Metal Arc Welding 107
Small engine Servicing 95
The Foundation’s centre in Camp phillips continues to offer technical and vocational training on shielded metal arc welding, bread and pastry production and basic driving. In the past year, 106 enrollees completed courses and passed the assessment of TeSDA. The Foundation likewise continues to operate Community education Centres in libona and Manolo Fortich, Bukidnon. These centres serve as headquarters for the community health workers’ federation in Manolo Fortich and as a venue for the Alternative learning System for out-of-school youth in libona. The facilities are being used year-round.
An educational session was conducted for Foundation high school scholars in March 2017 to provide additional information and encourage the scholars to consider taking the technical-vocational track in senior high school due to better employment opportunities and high industry demand in technical courses. The activity was made possible through the cooperation of selected high schools and the Technical Skills Development Authority (TeSDA). Del Monte Foundation president Mr. Joselito D Campos, Jr and Foundation trustee Mrs. olivia M Campos were able to grace the occasion.
Del Monte Foundation received recognition as “Best Industry partner in Region-X” by TeSDA. The award was given during the 22nd TeSDA Anniversary Celebration held in Cagayan de oro City on August 31, 2016. From the provincial office of the same agency, it also received the 2016 provincial Kabalikat Award in December 2016. The Foundation is recognized for its promotion of technical-vocational education and the development of competitive skilled workforce by reaching out to and extensively providing skills training in rural communities.
scholarshiPs anD eDucationGifted children earn quality education from pre-school and primary levels up to post-graduate studies through our academic scholarships, grants-in-aid and sports scholarships. The Jose Yao Campos College Grants-in-Aid Scholarships, launched in 2008, is funded through the personal contribution of Group Ceo Joselito D Campos, Jr.
For the school year 2016-2017, 325 Del Monte scholars were enrolled in different schools in the region under academic, barrio and sports scholarships and the Jose Yao Campos Grants-in-Aid for children of Del Monte employees and from the community. 130 were in the tertiary level, 183 were in high school and 12 in elementary. The scholars come from the different areas where the company has operations with only 8% from among dependents of employees. A total of 30 scholars completed college education when the school year ended in March and April 2017. The Foundation produced six licensed professionals from among its scholars who graduated in March 2016.
The Foundation initiated a gathering of its Scholarship programme alumni and alumnae. This aimed to create linkages among them and to facilitate their formal
organisation so that they may concretise the “return of service” pursuant to the scholarship agreement. About 50 alumni attended from among which they elected a set of officers. They also crafted their mission and goals.
over 1,000 alumni of Del Monte’s college scholarship programme started in 1956 are now key contributors to community growth in the philippines. Among Del Monte’s former scholars are:
• Cayetano paderanga, Jr, former member of the Cabinet (of former philippine president Benigno C Aquino III), who served as Secretary for economic planning and Director-General of the national economic and Development Authority;
• Attorney Rufus Rodriquez, a prominent member of the philippine House of Representatives representing Cagayan de oro City, who initiates and supports legislative proposals for enhanced government support to community education;
Our Chairman, Mr Joselito D Campos, Jr, with the Del Monte Foundation ScholarsKabalikat Award given by TESDA
Del Monte Pacific Group COO, Mr Luis F Alejandro, and Ms Bella Quimpo of the Foundation, with some of the Del Monte Foundation scholars
An
nu
Al
Re
po
RT
FY
20
17
063
De
l M
on
Te
pA
CIF
IC l
IMIT
eD
062
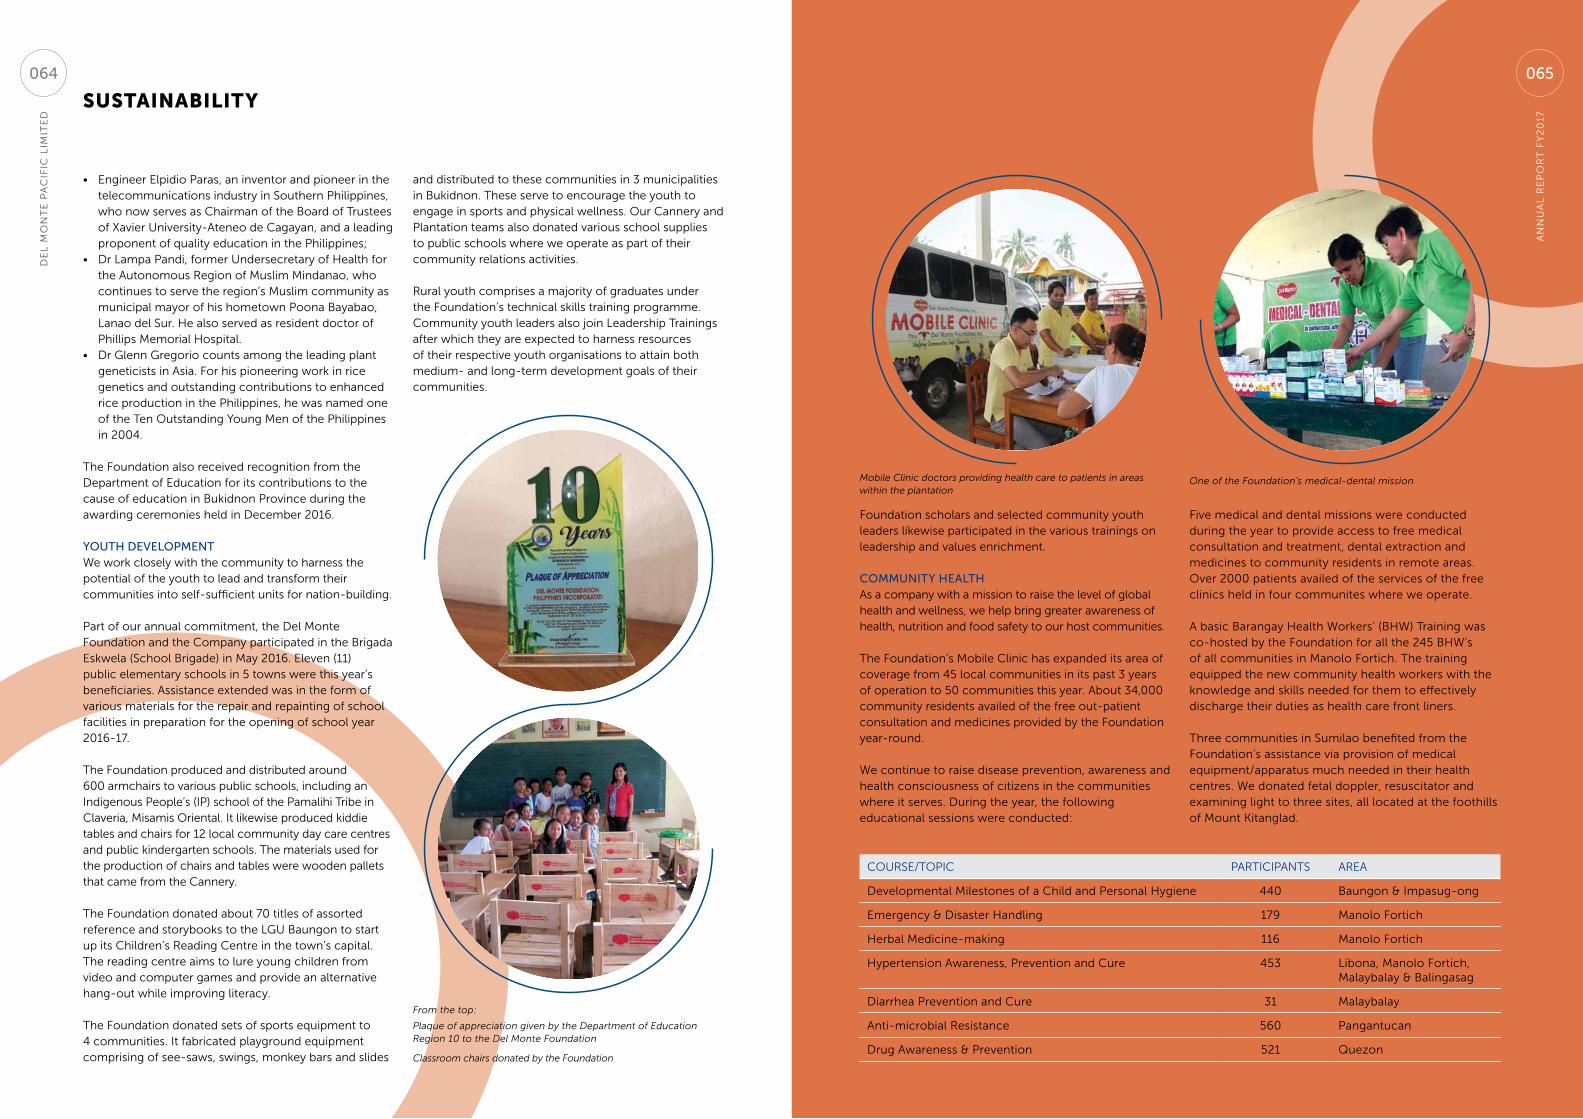
SuStainability
• engineer elpidio paras, an inventor and pioneer in the telecommunications industry in Southern philippines, who now serves as Chairman of the Board of Trustees of Xavier university-Ateneo de Cagayan, and a leading proponent of quality education in the philippines;
• Dr lampa pandi, former undersecretary of Health for the Autonomous Region of Muslim Mindanao, who continues to serve the region’s Muslim community as municipal mayor of his hometown poona Bayabao, lanao del Sur. He also served as resident doctor of phillips Memorial Hospital.
• Dr Glenn Gregorio counts among the leading plant geneticists in Asia. For his pioneering work in rice genetics and outstanding contributions to enhanced rice production in the philippines, he was named one of the Ten outstanding Young Men of the philippines in 2004.
The Foundation also received recognition from the Department of education for its contributions to the cause of education in Bukidnon province during the awarding ceremonies held in December 2016.
youth DeveloPMentWe work closely with the community to harness the potential of the youth to lead and transform their communities into self-sufficient units for nation-building.
part of our annual commitment, the Del Monte Foundation and the Company participated in the Brigada eskwela (School Brigade) in May 2016. eleven (11) public elementary schools in 5 towns were this year’s beneficiaries. Assistance extended was in the form of various materials for the repair and repainting of school facilities in preparation for the opening of school year 2016-17.
The Foundation produced and distributed around 600 armchairs to various public schools, including an Indigenous people’s (Ip) school of the pamalihi Tribe in Claveria, Misamis oriental. It likewise produced kiddie tables and chairs for 12 local community day care centres and public kindergarten schools. The materials used for the production of chairs and tables were wooden pallets that came from the Cannery.
The Foundation donated about 70 titles of assorted reference and storybooks to the lGu Baungon to start up its Children’s Reading Centre in the town’s capital. The reading centre aims to lure young children from video and computer games and provide an alternative hang-out while improving literacy.
The Foundation donated sets of sports equipment to 4 communities. It fabricated playground equipment comprising of see-saws, swings, monkey bars and slides
and distributed to these communities in 3 municipalities in Bukidnon. These serve to encourage the youth to engage in sports and physical wellness. our Cannery and plantation teams also donated various school supplies to public schools where we operate as part of their community relations activities.
Rural youth comprises a majority of graduates under the Foundation’s technical skills training programme. Community youth leaders also join leadership Trainings after which they are expected to harness resources of their respective youth organisations to attain both medium- and long-term development goals of their communities.
From the top:
Plaque of appreciation given by the Department of Education Region 10 to the Del Monte Foundation
Classroom chairs donated by the Foundation
Foundation scholars and selected community youth leaders likewise participated in the various trainings on leadership and values enrichment.
coMMunity healthAs a company with a mission to raise the level of global health and wellness, we help bring greater awareness of health, nutrition and food safety to our host communities.
The Foundation’s Mobile Clinic has expanded its area of coverage from 45 local communities in its past 3 years of operation to 50 communities this year. About 34,000 community residents availed of the free out-patient consultation and medicines provided by the Foundation year-round.
We continue to raise disease prevention, awareness and health consciousness of citizens in the communities where it serves. During the year, the following educational sessions were conducted:
Five medical and dental missions were conducted during the year to provide access to free medical consultation and treatment, dental extraction and medicines to community residents in remote areas. over 2000 patients availed of the services of the free clinics held in four communites where we operate.
A basic Barangay Health Workers’ (BHW) Training was co-hosted by the Foundation for all the 245 BHW’s of all communities in Manolo Fortich. The training equipped the new community health workers with the knowledge and skills needed for them to effectively discharge their duties as health care front liners.
Three communities in Sumilao benefited from the Foundation’s assistance via provision of medical equipment/apparatus much needed in their health centres. We donated fetal doppler, resuscitator and examining light to three sites, all located at the foothills of Mount Kitanglad.
Mobile Clinic doctors providing health care to patients in areas within the plantation
One of the Foundation’s medical-dental mission
CouRSe/TopIC pARTICIpAnTS AReA
Developmental Milestones of a Child and personal Hygiene 440 Baungon & Impasug-ong
emergency & Disaster Handling 179 Manolo Fortich
Herbal Medicine-making 116 Manolo Fortich
Hypertension Awareness, prevention and Cure 453 libona, Manolo Fortich, Malaybalay & Balingasag
Diarrhea prevention and Cure 31 Malaybalay
Anti-microbial Resistance 560 pangantucan
Drug Awareness & prevention 521 Quezon
An
nu
Al
Re
po
RT
FY
20
17
065
De
l M
on
Te
pA
CIF
IC l
IMIT
eD
064
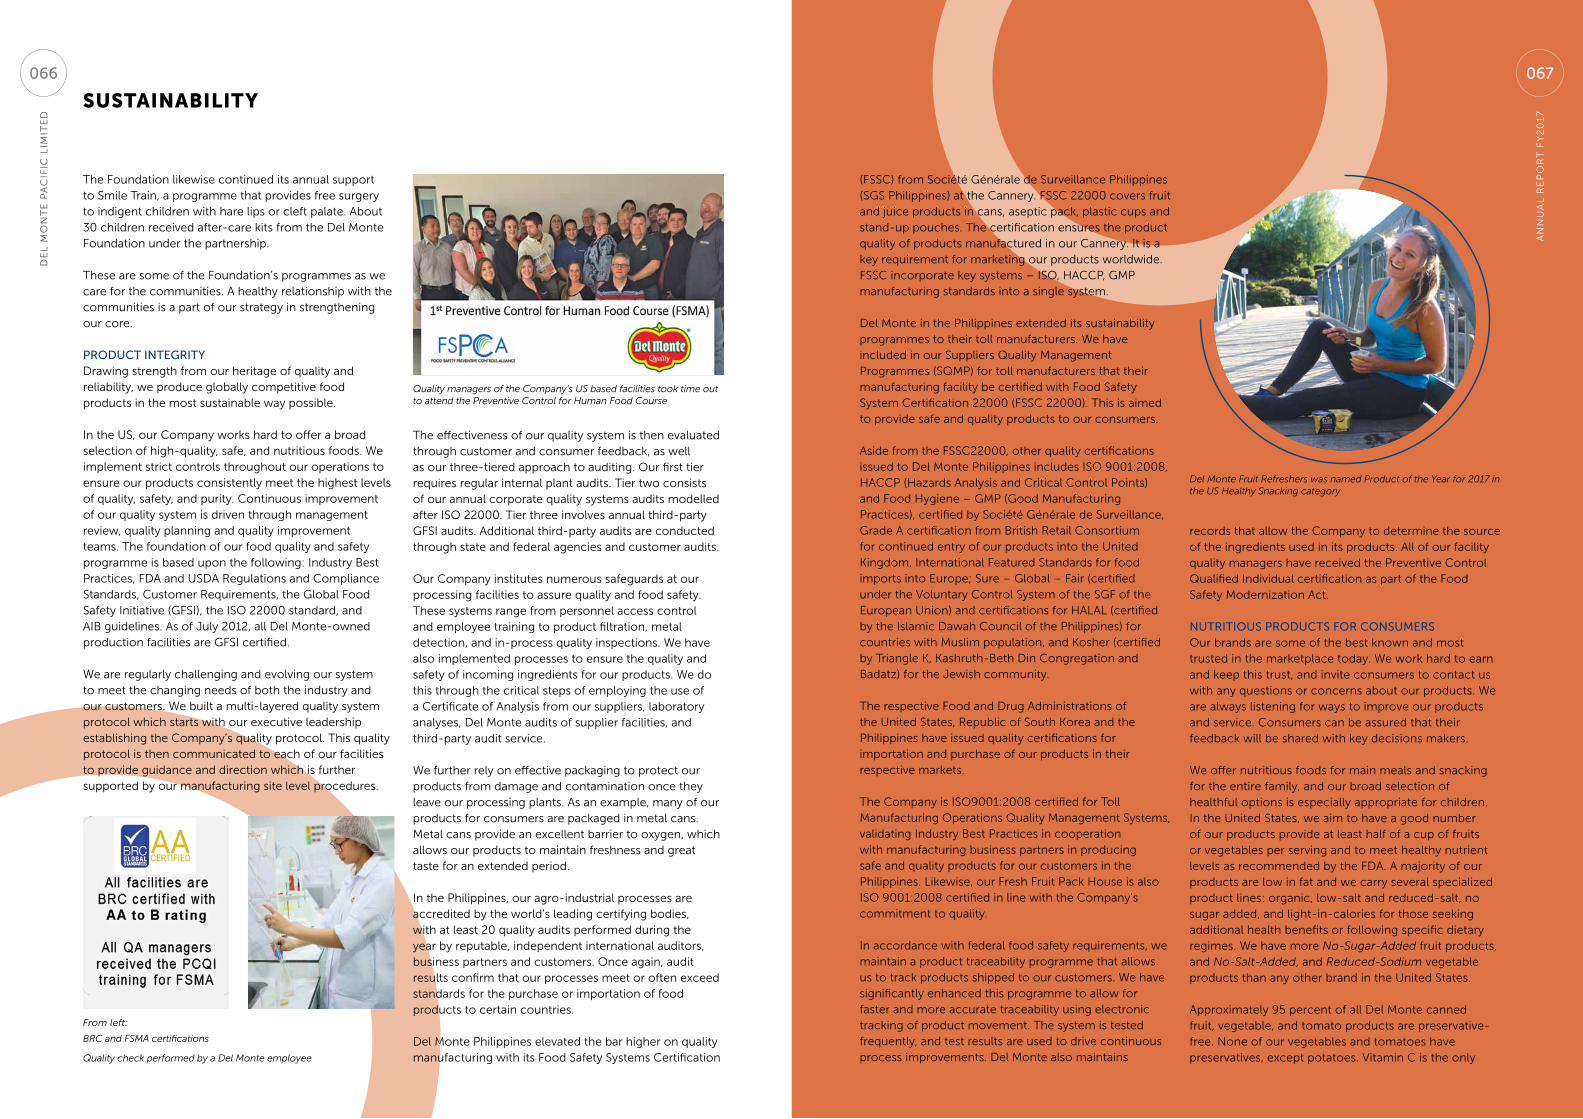
SuStainability
The Foundation likewise continued its annual support to Smile Train, a programme that provides free surgery to indigent children with hare lips or cleft palate. About 30 children received after-care kits from the Del Monte Foundation under the partnership.
These are some of the Foundation’s programmes as we care for the communities. A healthy relationship with the communities is a part of our strategy in strengthening our core.
ProDuct integrityDrawing strength from our heritage of quality and reliability, we produce globally competitive food products in the most sustainable way possible.
In the uS, our Company works hard to offer a broad selection of high-quality, safe, and nutritious foods. We implement strict controls throughout our operations to ensure our products consistently meet the highest levels of quality, safety, and purity. Continuous improvement of our quality system is driven through management review, quality planning and quality improvement teams. The foundation of our food quality and safety programme is based upon the following: Industry Best practices, FDA and uSDA Regulations and Compliance Standards, Customer Requirements, the Global Food Safety Initiative (GFSI), the ISo 22000 standard, and AIB guidelines. As of July 2012, all Del Monte-owned production facilities are GFSI certified.
We are regularly challenging and evolving our system to meet the changing needs of both the industry and our customers. We built a multi-layered quality system protocol which starts with our executive leadership establishing the Company’s quality protocol. This quality protocol is then communicated to each of our facilities to provide guidance and direction which is further supported by our manufacturing site level procedures.
The effectiveness of our quality system is then evaluated through customer and consumer feedback, as well as our three-tiered approach to auditing. our first tier requires regular internal plant audits. Tier two consists of our annual corporate quality systems audits modelled after ISo 22000. Tier three involves annual third-party GFSI audits. Additional third-party audits are conducted through state and federal agencies and customer audits.
our Company institutes numerous safeguards at our processing facilities to assure quality and food safety. These systems range from personnel access control and employee training to product filtration, metal detection, and in-process quality inspections. We have also implemented processes to ensure the quality and safety of incoming ingredients for our products. We do this through the critical steps of employing the use of a Certificate of Analysis from our suppliers, laboratory analyses, Del Monte audits of supplier facilities, and third-party audit service.
We further rely on effective packaging to protect our products from damage and contamination once they leave our processing plants. As an example, many of our products for consumers are packaged in metal cans. Metal cans provide an excellent barrier to oxygen, which allows our products to maintain freshness and great taste for an extended period.
In the philippines, our agro-industrial processes are accredited by the world’s leading certifying bodies, with at least 20 quality audits performed during the year by reputable, independent international auditors, business partners and customers. once again, audit results confirm that our processes meet or often exceed standards for the purchase or importation of food products to certain countries.
Del Monte philippines elevated the bar higher on quality manufacturing with its Food Safety Systems Certification
From left:
BRC and FSMA certifications
Quality check performed by a Del Monte employee
Quality managers of the Company’s US based facilities took time out to attend the Preventive Control for Human Food Course
(FSSC) from Société Générale de Surveillance philippines (SGS philippines) at the Cannery. FSSC 22000 covers fruit and juice products in cans, aseptic pack, plastic cups and stand-up pouches. The certification ensures the product quality of products manufactured in our Cannery. It is a key requirement for marketing our products worldwide. FSSC incorporate key systems – ISo, HACCp, GMp manufacturing standards into a single system.
Del Monte in the philippines extended its sustainability programmes to their toll manufacturers. We have included in our Suppliers Quality Management programmes (SQMp) for toll manufacturers that their manufacturing facility be certified with Food Safety System Certification 22000 (FSSC 22000). This is aimed to provide safe and quality products to our consumers.
Aside from the FSSC22000, other quality certifications issued to Del Monte philippines includes ISo 9001:2008, HACCp (Hazards Analysis and Critical Control points) and Food Hygiene – GMp (Good Manufacturing practices), certified by Société Générale de Surveillance, Grade A certification from British Retail Consortium for continued entry of our products into the united Kingdom, International Featured Standards for food imports into europe; Sure – Global – Fair (certified under the Voluntary Control System of the SGF of the european union) and certifications for HAlAl (certified by the Islamic Dawah Council of the philippines) for countries with Muslim population, and Kosher (certified by Triangle K, Kashruth-Beth Din Congregation and Badatz) for the Jewish community.
The respective Food and Drug Administrations of the united States, Republic of South Korea and the philippines have issued quality certifications for importation and purchase of our products in their respective markets.
The Company is ISo9001:2008 certified for Toll Manufacturing operations Quality Management Systems, validating Industry Best practices in cooperation with manufacturing business partners in producing safe and quality products for our customers in the philippines. likewise, our Fresh Fruit pack House is also ISo 9001:2008 certified in line with the Company’s commitment to quality.
In accordance with federal food safety requirements, we maintain a product traceability programme that allows us to track products shipped to our customers. We have significantly enhanced this programme to allow for faster and more accurate traceability using electronic tracking of product movement. The system is tested frequently, and test results are used to drive continuous process improvements. Del Monte also maintains
records that allow the Company to determine the source of the ingredients used in its products. All of our facility quality managers have received the preventive Control Qualified Individual certification as part of the Food Safety Modernization Act.
nutritious ProDucts for consuMersour brands are some of the best known and most trusted in the marketplace today. We work hard to earn and keep this trust, and invite consumers to contact us with any questions or concerns about our products. We are always listening for ways to improve our products and service. Consumers can be assured that their feedback will be shared with key decisions makers.
We offer nutritious foods for main meals and snacking for the entire family, and our broad selection of healthful options is especially appropriate for children. In the united States, we aim to have a good number of our products provide at least half of a cup of fruits or vegetables per serving and to meet healthy nutrient levels as recommended by the FDA. A majority of our products are low in fat and we carry several specialized product lines: organic, low-salt and reduced-salt, no sugar added, and light-in-calories for those seeking additional health benefits or following specific dietary regimes. We have more No-Sugar-Added fruit products, and No-Salt-Added, and Reduced-Sodium vegetable products than any other brand in the united States.
Approximately 95 percent of all Del Monte canned fruit, vegetable, and tomato products are preservative-free. none of our vegetables and tomatoes have preservatives, except potatoes. Vitamin C is the only
Del Monte Fruit Refreshers was named Product of the Year for 2017 in the US Healthy Snacking category
An
nu
Al
Re
po
RT
FY
20
17
067
De
l M
on
Te
pA
CIF
IC l
IMIT
eD
066

SuStainability
preservative we use in canned fruit or shelf stable fruit cups, which is a naturally inherent nutrient already present in those products.
As such, we are recognized as a produce for Better Health Foundation (pBH) Role Mode - pBH’s highest recognition level, awarded to those companies which provide significant steps toward improving the health of Americans. We are proud to serve on the pBH Board of Trustees to help drive more consumer demand for fruits and veggies. We are also a national partner of the united States Department of Agriculture’s “Choose My plate” initiative and member of the Tomato Wellness Council.
We are also proud members of the Canned Food Alliance executive Committee, where we are committed to educating health and nutrition professionals, as well as consumers, about the many benefits of canned fruits, vegetables and beans and how they can contribute to a healthy diet.
In Asia, our nutrition platforms are anchored on weight management, heart health and bone health. our goal is to produce healthier and more nutritious products in the future as we move to strengthen our core.
non-gMo anD non-BPa ProDuctsWe grow our fruit, vegetables and tomatoes with care on farms that have been with us for generations. We preserve that wholesome goodness for families to nourish their loved ones with the best quality products. We want our consumers to know what is in their food to help them make the best decisions for their family.
In the united States, all of the fruit, vegetables and tomatoes in Del Monte products have always come from traditional breeding. Del Monte remains committed to meeting evolving consumer preferences and continues to explore non-GMo ingredient alternatives where possible.
Del Monte made a significant investment to source these added ingredients from non-GMo origins. As a result, we converted the majority of our vegetables and fruit cups and most of our tomato products to “non-GMo” by the end of our 2016 pack season (Sept/oct 2016).
In 2016, we also worked with the uSDA to verify our sweet corn products as non-genetically modified resulting in the uSDA certification, “uSDA process Verified non-Ge/GMo”.
Del Monte’s top priority is the quality and safety of our products. For more than 40 years, BpA has been approved by the FDA for use in food contact applications, and can coatings containing BpA have played an essential part in food preservation.
In response to growing consumer and customer preference, we worked closely with can manufacturers and lining suppliers to approve non-BpA internal can lining alternatives that met both food safety and consumer quality requirements. Given the critical role in ensuring product safety and preserving quality, any replacement for BpA had to pass rigorous safety and quality testing before we accepted it for use in our products. If an alternative proves safe and effective in a particular application, we will pursue it.
We made these changes thoughtfully and carefully to ensure the safety, quality and nutritional integrity of our products, as well as the taste that our consumers expect.
We do these initiatives to ensure the safety of our products as we strengthen our core to better nourish families and enrich lives, every day!
nourisHing our environMent
We rely on nature’s bounty to bring our products to millions of families across the globe. our direct connection to the earth’s resources reinforces our longstanding commitment to stewardship and responsible operation. our key conservation focus areas are managing water, energy and waste in our manufacturing operations as well as in our agricultural practices.
Shift to non-GMO and non-BPA cans
our environmental management system (eMS) sets out rigorous guidelines and processes to ensure that our facilities meet the highest standards of environmental performance, every day. our programme is based on the ISo standard 14001. We view full compliance with all applicable regulations as a minimum goal, and strive to exceed industry standards across our operations.
Del Monte has an excellent track record in maintaining compliance with all applicable environmental regulations. We conduct in-house audits for all our uS-based facilities at least once every three years.
We maintain a written environmental policy that is updated periodically to reflect new advances in best practice and to better serve the Company’s operating needs. This policy is posted in our facilities, communicated to facility management, and also incorporated into training for environmental and operations staff.
our environmental team remains on the cutting edge of environmental management by being active in industry and governmental forums, and by taking leadership roles in local, regional, and national environmental organisations.
In the philippines, our Carbon Footprint is negative, implying that our operations are eco-friendly. We employ best practices to monitor and continuously improve our overall Carbon Footprint.
agricultural Practices in the usa
pARTneRInG WITH GRoWeRSDel Monte contracts with 900 farmers across north America, and about 90% of the food we produce is grown in the uS. our crops are locally sourced and travel less than an average of 100 miles from the field
to the manufacturing gate, and an average of 350 miles from distribution centre to retailer. Many growers are 3rd generation Del Monte growers, especially in fruit where we have families that have grown for Del Monte for over 70 years. Tomato growers have somewhat shorter tenure, but many have grown for 30 plus years. Vegetable growers have been with our Company in excess of 20 years, with less than two percent turnover year-to-year. By minimizing the impact of growing, processing, packaging, and distributing our products, we are helping to protect the air, land, and water, and ensuring our long-term success.
our Company is unique compared to our competitors in that we have our own dedicated agricultural Seed operations research team. This team carefully selects those plants that exhibit desirable traits to produce stronger crops through traditional breeding techniques.
Frost plot for peas
Green beans field
An
nu
Al
Re
po
RT
FY
20
17
069
De
l M
on
Te
pA
CIF
IC l
IMIT
eD
068
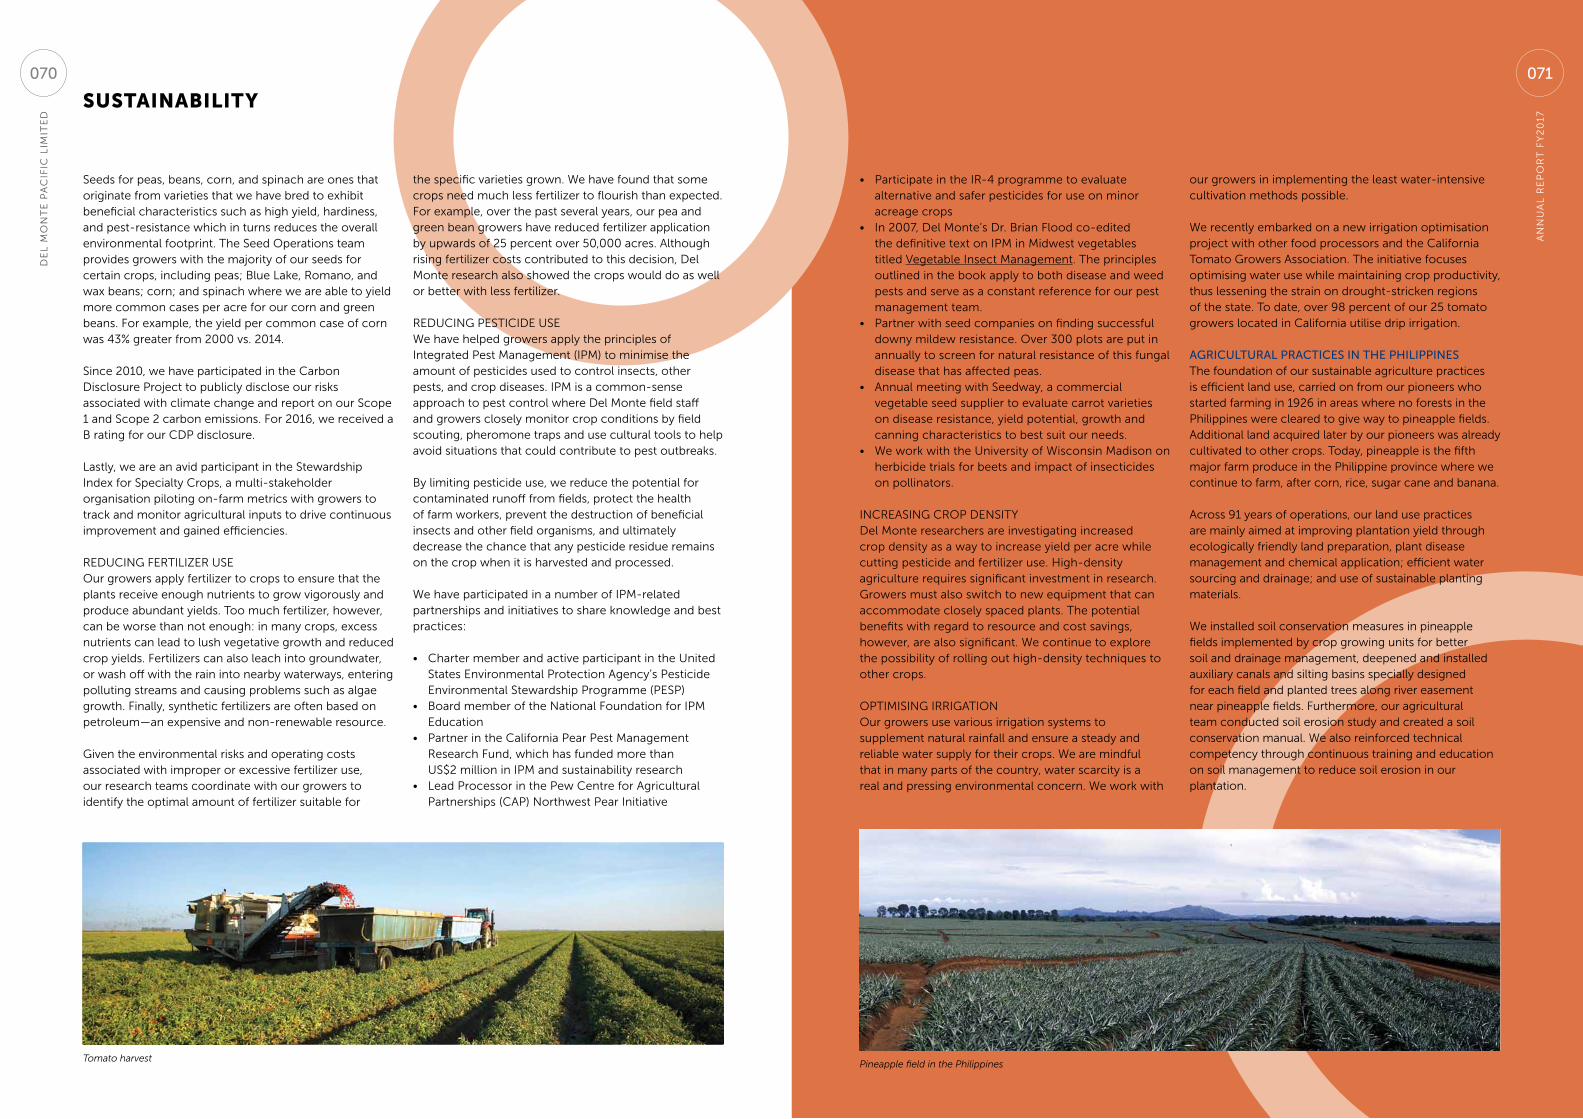
SuStainability
Seeds for peas, beans, corn, and spinach are ones that originate from varieties that we have bred to exhibit beneficial characteristics such as high yield, hardiness, and pest-resistance which in turns reduces the overall environmental footprint. The Seed operations team provides growers with the majority of our seeds for certain crops, including peas; Blue lake, Romano, and wax beans; corn; and spinach where we are able to yield more common cases per acre for our corn and green beans. For example, the yield per common case of corn was 43% greater from 2000 vs. 2014.
Since 2010, we have participated in the Carbon Disclosure project to publicly disclose our risks associated with climate change and report on our Scope 1 and Scope 2 carbon emissions. For 2016, we received a B rating for our CDp disclosure.
lastly, we are an avid participant in the Stewardship Index for Specialty Crops, a multi-stakeholder organisation piloting on-farm metrics with growers to track and monitor agricultural inputs to drive continuous improvement and gained efficiencies.
ReDuCInG FeRTIlIZeR uSeour growers apply fertilizer to crops to ensure that the plants receive enough nutrients to grow vigorously and produce abundant yields. Too much fertilizer, however, can be worse than not enough: in many crops, excess nutrients can lead to lush vegetative growth and reduced crop yields. Fertilizers can also leach into groundwater, or wash off with the rain into nearby waterways, entering polluting streams and causing problems such as algae growth. Finally, synthetic fertilizers are often based on petroleum—an expensive and non-renewable resource.
Given the environmental risks and operating costs associated with improper or excessive fertilizer use, our research teams coordinate with our growers to identify the optimal amount of fertilizer suitable for
the specific varieties grown. We have found that some crops need much less fertilizer to flourish than expected. For example, over the past several years, our pea and green bean growers have reduced fertilizer application by upwards of 25 percent over 50,000 acres. Although rising fertilizer costs contributed to this decision, Del Monte research also showed the crops would do as well or better with less fertilizer.
ReDuCInG peSTICIDe uSeWe have helped growers apply the principles of Integrated pest Management (IpM) to minimise the amount of pesticides used to control insects, other pests, and crop diseases. IpM is a common-sense approach to pest control where Del Monte field staff and growers closely monitor crop conditions by field scouting, pheromone traps and use cultural tools to help avoid situations that could contribute to pest outbreaks. By limiting pesticide use, we reduce the potential for contaminated runoff from fields, protect the health of farm workers, prevent the destruction of beneficial insects and other field organisms, and ultimately decrease the chance that any pesticide residue remains on the crop when it is harvested and processed.
We have participated in a number of IpM-related partnerships and initiatives to share knowledge and best practices:
• Charter member and active participant in the united States environmental protection Agency’s pesticide environmental Stewardship programme (peSp)
• Board member of the national Foundation for IpM education
• partner in the California pear pest Management Research Fund, which has funded more than uS$2 million in IpM and sustainability research
• lead processor in the pew Centre for Agricultural partnerships (CAp) northwest pear Initiative
Tomato harvest
• participate in the IR-4 programme to evaluate alternative and safer pesticides for use on minor acreage crops
• In 2007, Del Monte’s Dr. Brian Flood co-edited the definitive text on IpM in Midwest vegetables titled Vegetable Insect Management. The principles outlined in the book apply to both disease and weed pests and serve as a constant reference for our pest management team.
• partner with seed companies on finding successful downy mildew resistance. over 300 plots are put in annually to screen for natural resistance of this fungal disease that has affected peas.
• Annual meeting with Seedway, a commercial vegetable seed supplier to evaluate carrot varieties on disease resistance, yield potential, growth and canning characteristics to best suit our needs.
• We work with the university of Wisconsin Madison on herbicide trials for beets and impact of insecticides on pollinators.
InCReASInG CRop DenSITYDel Monte researchers are investigating increased crop density as a way to increase yield per acre while cutting pesticide and fertilizer use. High-density agriculture requires significant investment in research. Growers must also switch to new equipment that can accommodate closely spaced plants. The potential benefits with regard to resource and cost savings, however, are also significant. We continue to explore the possibility of rolling out high-density techniques to other crops.
opTIMISInG IRRIGATIonour growers use various irrigation systems to supplement natural rainfall and ensure a steady and reliable water supply for their crops. We are mindful that in many parts of the country, water scarcity is a real and pressing environmental concern. We work with
our growers in implementing the least water-intensive cultivation methods possible.
We recently embarked on a new irrigation optimisation project with other food processors and the California Tomato Growers Association. The initiative focuses optimising water use while maintaining crop productivity, thus lessening the strain on drought-stricken regions of the state. To date, over 98 percent of our 25 tomato growers located in California utilise drip irrigation.
agricultural Practices in the PhiliPPinesThe foundation of our sustainable agriculture practices is efficient land use, carried on from our pioneers who started farming in 1926 in areas where no forests in the philippines were cleared to give way to pineapple fields. Additional land acquired later by our pioneers was already cultivated to other crops. Today, pineapple is the fifth major farm produce in the philippine province where we continue to farm, after corn, rice, sugar cane and banana.
Across 91 years of operations, our land use practices are mainly aimed at improving plantation yield through ecologically friendly land preparation, plant disease management and chemical application; efficient water sourcing and drainage; and use of sustainable planting materials.
We installed soil conservation measures in pineapple fields implemented by crop growing units for better soil and drainage management, deepened and installed auxiliary canals and silting basins specially designed for each field and planted trees along river easement near pineapple fields. Furthermore, our agricultural team conducted soil erosion study and created a soil conservation manual. We also reinforced technical competency through continuous training and education on soil management to reduce soil erosion in our plantation.
Pineapple field in the Philippines
An
nu
Al
Re
po
RT
FY
20
17
071
De
l M
on
Te
pA
CIF
IC l
IMIT
eD
070
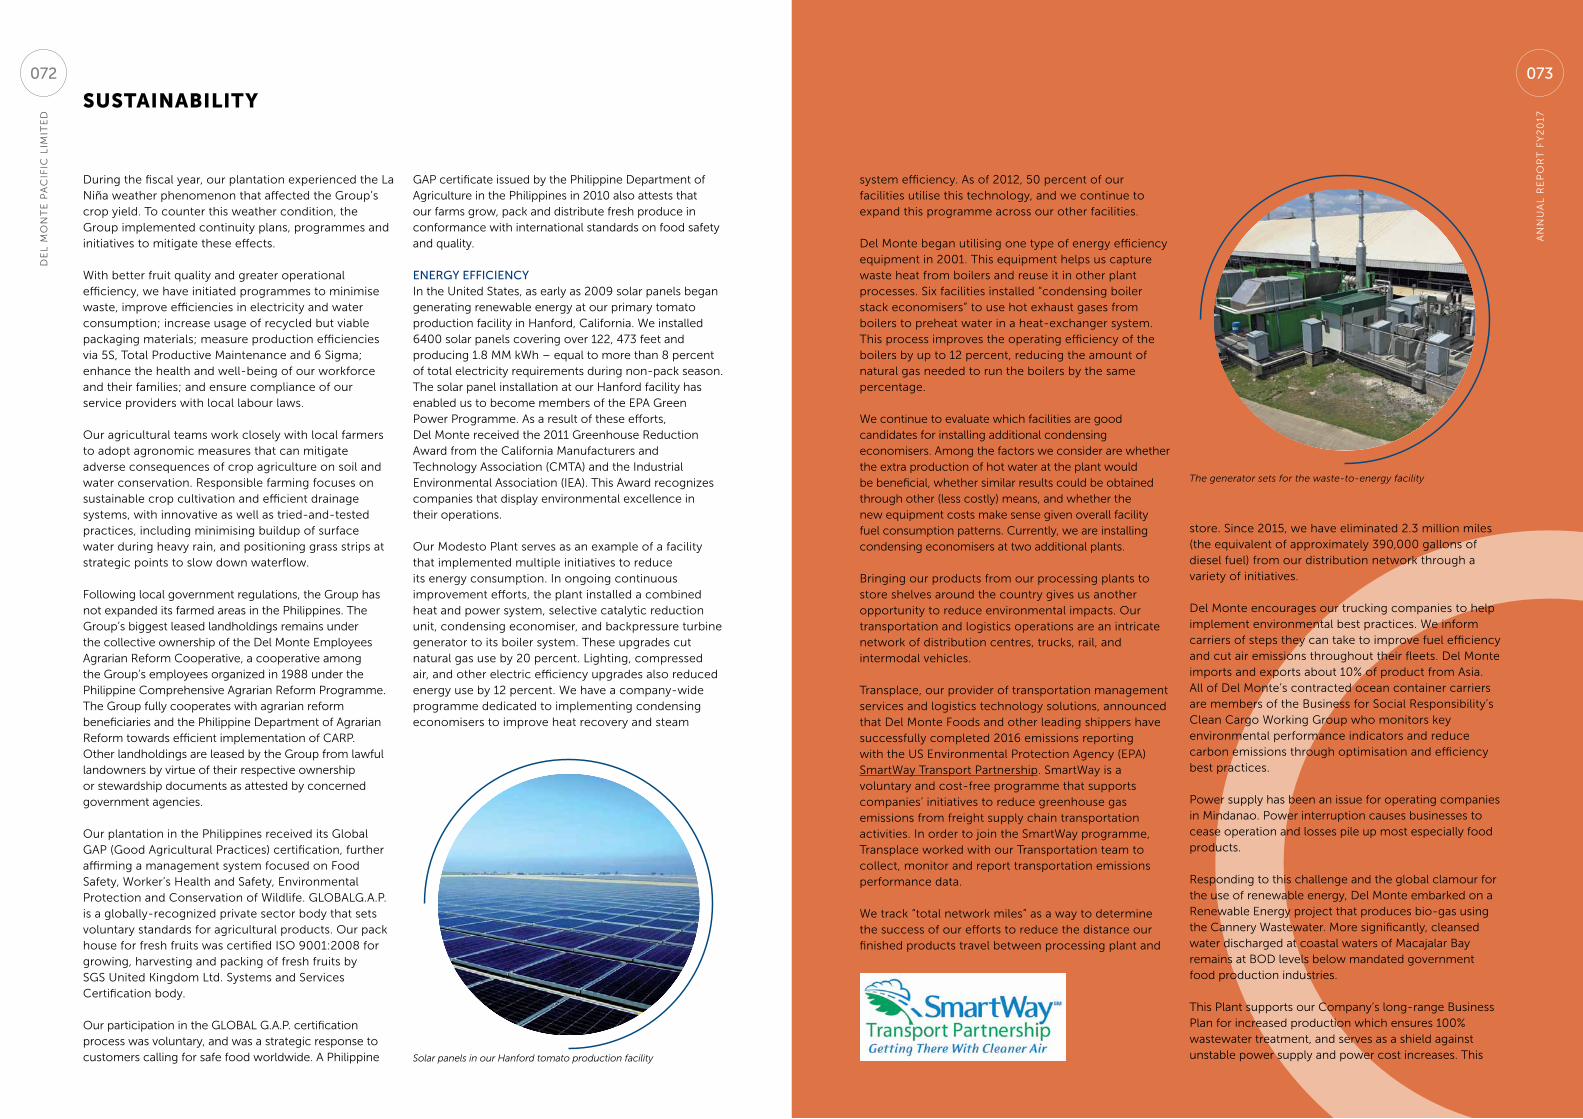
SuStainability
During the fiscal year, our plantation experienced the la niña weather phenomenon that affected the Group’s crop yield. To counter this weather condition, the Group implemented continuity plans, programmes and initiatives to mitigate these effects.
With better fruit quality and greater operational efficiency, we have initiated programmes to minimise waste, improve efficiencies in electricity and water consumption; increase usage of recycled but viable packaging materials; measure production efficiencies via 5S, Total productive Maintenance and 6 Sigma; enhance the health and well-being of our workforce and their families; and ensure compliance of our service providers with local labour laws.
our agricultural teams work closely with local farmers to adopt agronomic measures that can mitigate adverse consequences of crop agriculture on soil and water conservation. Responsible farming focuses on sustainable crop cultivation and efficient drainage systems, with innovative as well as tried-and-tested practices, including minimising buildup of surface water during heavy rain, and positioning grass strips at strategic points to slow down waterflow.
Following local government regulations, the Group has not expanded its farmed areas in the philippines. The Group’s biggest leased landholdings remains under the collective ownership of the Del Monte employees Agrarian Reform Cooperative, a cooperative among the Group’s employees organized in 1988 under the philippine Comprehensive Agrarian Reform programme. The Group fully cooperates with agrarian reform beneficiaries and the philippine Department of Agrarian Reform towards efficient implementation of CARp. other landholdings are leased by the Group from lawful landowners by virtue of their respective ownership or stewardship documents as attested by concerned government agencies.
our plantation in the philippines received its Global GAp (Good Agricultural practices) certification, further affirming a management system focused on Food Safety, Worker’s Health and Safety, environmental protection and Conservation of Wildlife. GloBAlG.A.p. is a globally-recognized private sector body that sets voluntary standards for agricultural products. our pack house for fresh fruits was certified ISo 9001:2008 for growing, harvesting and packing of fresh fruits by SGS united Kingdom ltd. Systems and Services Certification body.
our participation in the GloBAl G.A.p. certification process was voluntary, and was a strategic response to customers calling for safe food worldwide. A philippine Solar panels in our Hanford tomato production facility
GAp certificate issued by the philippine Department of Agriculture in the philippines in 2010 also attests that our farms grow, pack and distribute fresh produce in conformance with international standards on food safety and quality.
energy efficiencyIn the united States, as early as 2009 solar panels began generating renewable energy at our primary tomato production facility in Hanford, California. We installed 6400 solar panels covering over 122, 473 feet and producing 1.8 MM kWh – equal to more than 8 percent of total electricity requirements during non-pack season. The solar panel installation at our Hanford facility has enabled us to become members of the epA Green power programme. As a result of these efforts, Del Monte received the 2011 Greenhouse Reduction Award from the California Manufacturers and Technology Association (CMTA) and the Industrial environmental Association (IeA). This Award recognizes companies that display environmental excellence in their operations.
our Modesto plant serves as an example of a facility that implemented multiple initiatives to reduce its energy consumption. In ongoing continuous improvement efforts, the plant installed a combined heat and power system, selective catalytic reduction unit, condensing economiser, and backpressure turbine generator to its boiler system. These upgrades cut natural gas use by 20 percent. lighting, compressed air, and other electric efficiency upgrades also reduced energy use by 12 percent. We have a company-wide programme dedicated to implementing condensing economisers to improve heat recovery and steam
system efficiency. As of 2012, 50 percent of our facilities utilise this technology, and we continue to expand this programme across our other facilities.
Del Monte began utilising one type of energy efficiency equipment in 2001. This equipment helps us capture waste heat from boilers and reuse it in other plant processes. Six facilities installed “condensing boiler stack economisers” to use hot exhaust gases from boilers to preheat water in a heat-exchanger system. This process improves the operating efficiency of the boilers by up to 12 percent, reducing the amount of natural gas needed to run the boilers by the same percentage.
We continue to evaluate which facilities are good candidates for installing additional condensing economisers. Among the factors we consider are whether the extra production of hot water at the plant would be beneficial, whether similar results could be obtained through other (less costly) means, and whether the new equipment costs make sense given overall facility fuel consumption patterns. Currently, we are installing condensing economisers at two additional plants.
Bringing our products from our processing plants to store shelves around the country gives us another opportunity to reduce environmental impacts. our transportation and logistics operations are an intricate network of distribution centres, trucks, rail, and intermodal vehicles.
Transplace, our provider of transportation management services and logistics technology solutions, announced that Del Monte Foods and other leading shippers have successfully completed 2016 emissions reporting with the uS environmental protection Agency (epA) SmartWay Transport partnership. SmartWay is a voluntary and cost-free programme that supports companies’ initiatives to reduce greenhouse gas emissions from freight supply chain transportation activities. In order to join the SmartWay programme, Transplace worked with our Transportation team to collect, monitor and report transportation emissions performance data.
We track “total network miles” as a way to determine the success of our efforts to reduce the distance our finished products travel between processing plant and
store. Since 2015, we have eliminated 2.3 million miles (the equivalent of approximately 390,000 gallons of diesel fuel) from our distribution network through a variety of initiatives.
Del Monte encourages our trucking companies to help implement environmental best practices. We inform carriers of steps they can take to improve fuel efficiency and cut air emissions throughout their fleets. Del Monte imports and exports about 10% of product from Asia. All of Del Monte’s contracted ocean container carriers are members of the Business for Social Responsibility’s Clean Cargo Working Group who monitors key environmental performance indicators and reduce carbon emissions through optimisation and efficiency best practices.
power supply has been an issue for operating companies in Mindanao. power interruption causes businesses to cease operation and losses pile up most especially food products.
Responding to this challenge and the global clamour for the use of renewable energy, Del Monte embarked on a Renewable energy project that produces bio-gas using the Cannery Wastewater. More significantly, cleansed water discharged at coastal waters of Macajalar Bay remains at BoD levels below mandated government food production industries.
This plant supports our Company’s long-range Business plan for increased production which ensures 100% wastewater treatment, and serves as a shield against unstable power supply and power cost increases. This
The generator sets for the waste-to-energy facility
An
nu
Al
Re
po
RT
FY
20
17
073
De
l M
on
Te
pA
CIF
IC l
IMIT
eD
072

SuStainability
plant will take over the job done by an equally eco-effective but power-intensive aerobic treatment plant.
This plant highlights our commitment to environmental stewardship on reduction of our greenhouse gas emissions (GHG), recycling while enhancing our business competitiveness through reduced energy costs.
The Del Monte office in Manila was awarded a leeD (leadership in energy and environmental Design) Silver certification in 2016 by the uS Green Building Council (uSGBC). Based on the uSGBC project Directory, the Jose Y. Campos Centre (JYCC) building is the 44th leeD Certified building in the philippines and is the first building in the philippines to earn the leeD Innovation Credit for Bird Collision Deterrence. The building prides itself of environment friendly features on energy efficiency, water reduction, waste management and health and safety features for the building occupants.
We will continue to seek out energy reduction opportunities across all our facilities and invest in the improvements that collectively reduce both our air emissions, including greenhouse gases, and our operating costs. our Company continually assesses our investment opportunities in renewable energy solutions at each of our facilities.
water efficiencyour plants use water for tasks such as washing and sanitising fruits and vegetables, thermally processing our canned products, and sanitising equipment. To the extent possible, we capture and reuse water within the plant. We recycle our can cooling water and, through heat exchangers, use it to preheat our boiler feed water in most of our facilities. By doing so, we reduce the amount of new water needed and also reduce our energy needs.
Water discharged from our facilities is sent to various destinations based on the quantity of water and whether it requires treatment to remove contaminants before it can be returned to the environment.
Given all that we do, we do understand the current risks associated with water supply and quality. We operate and contractually grow food in seven states where water availability may be in jeopardy. our water risks include:
• Fresh water shortages due to drought and pressures on limited surface and groundwater supplies. Increased drought may pose a particular risk to our water supplies in Mexico, California, Texas (the Carrizo-Wilcox Aquifer), and Wisconsin (the Central Wisconsin Sand and Gravel Aquifer) near term as well as longer term (over the next 15-45 years).
• new regulatory restrictions on fresh water use and grey water discharges
• Reputational damage if issues of sustainable and equitable water use are not properly addressed
• Increasing costs and/or reduced revenues due to all of the above risks
We also understand in order to decrease the risks, we need to:
• Invest in technologies to improve water conservation • encourage business culture to make saving water a
daily priority• Reuse and/or recycle water in operations as many
times as possible before discharging to grey water• Improve the quality of grey water discharges through
source point pollution control and new raw product processing methods that discharge less pollutants of concern
• Work with growers to encourage the use of more water-efficient irrigation systems and techniques to use less water
our Cannery in the philippines uses the condensate (water from steam and pineapple juice) of our evaporators and permeates water from mill juice from our Reverse osmosis system for ultrafiltration System CIp and Ion exchange plants regeneration. These allow us to use less fresh water and avoid water treatment costs.
waste ManageMentIn the united States, we are currently benchmarking our waste management practices and specifically comparing landfilling to recycling rates to ensure that we are managing our waste streams in the most efficient manner possible. We instituted a “ner0 landfill” policy where we aim to divert up to 98 percent from reaching the landfill based on the environmental protection Agency’s Waste Reduction Hierarchy.
For over four years, we have been actively involved in the Food Waste Reduction Alliance (a collaborative effort between the Grocery Manufacturers Association, Food Marketing Institute, and national Restaurant Association). We research food waste in our supply chains and identify where/how we can make a difference by learning from each other and receiving guidance from european entities, environmental organisations and industry-related firms.
less than 3% of the total waste generated at production facilities, distribution centres, and research locations go to a landfill. We supply local farmers with approximately 290,000 tons of organic material for animal feed and 54,000 tons for land application purposes.
our Walnut Creek Research Centre (WCRC) in California received a “RecycleSmart” Award from the Contra Costa Solid Waste Authority for our food waste recovery efforts. The WCRC diverts the food and packaging materials of the unused food by the manual opening of pallets of un-donatable packaged food, recycles the container and sends the food to compost for energy as part of a local restaurant programme, Food Recycling project. our WCRC is also certified as a Bay Area Green Business due to its efforts to conserve water, energy and waste, implement eco-friendly materials and engaging employees in conservation behaviour best practices.
In the philippines, our pineapple pulp waste disposal system, a pioneering effort started in the 1950s, converts a by-product of the Cannery into feed for our cattle farm at the plantation. This helps us reduce waste and cut costs.
We operate effluent treatment plants that treat wastewater discharged from our agro-industrial facilities. our high-filtration extraction system processes excess juice into pineapple concentrate and syrup, significantly reducing volume of wastewater.
plantation-based families share in our total conservation effort as they segregate domestic solid waste right in their own homes. Recyclable materials collected from households are sold to fund community projects.
resPonsiBle use of MaterialsIn the united States, Del Monte products carry with them a pledge of freshness and quality—that the products we bring to the table will consistently deliver delicious, flavourful, and healthful nutrition. part of the reason we can guarantee such high quality is our attention to product packaging. We devote significant effort to good packaging design to ensure that we meet the basic packaging criteria, but that we also use the least amount of materials and resources to package our products.
While Del Monte’s innovations are focused on new products, new packages and meeting consumer needs, they also target environmental consciousness and affordability. By reducing the amount of materials used in Del Monte packaging everyone wins. less packaging materials used means a lower carbon footprint for Del Monte’s overall operations, and associated greenhouse gases emitted are lessened. Del Monte has been on a multi-year journey to safely reduce: the amount of metal used in our cans, the amount of plastic in our cups, and the amount of corrugate in our cases. Since 2009, Del Monte has reduced the amount of packaging by almost 15%, which equates to a reduction of about 20,000 tons of packaging materials. By using state of the art testing and simulation techniques, Del Monte’s engineers
continue to design the most lightweight materials required to meet their required function.
our focus on packaging efficiency has significant benefits all along our production chain. even slight adjustments to individual containers can result in big savings of materials, energy, and fuel when considered over millions of units. Reductions in secondary packaging can also significantly minimise waste during shipping.
We regularly consider packaging initiatives that focus on the following objectives:
• Remove or reduce packaging and use more effective materials
• encourage recycling• Improve transportation efficiency through packaging
changes
In the philippines, we work with suppliers and community organisations to ensure a safe environment for our workers and host communities. We comply with government standards in the use of fertilizers and industrial chemicals, including safe transport and handling, and collection and recovery of packaging materials. We conduct regular safety audits on our fertilizer and chemical storage and work areas. A Supplier Quality Management programme and product traceability measures are in place to respond to customer requirements. Audit results are shared with concerned teams to ensure deficiencies are immediately addressed. Workers handling chemicals are issued protective equipment and undergo regular medical check-ups.
Facts about our can packaging
An
nu
Al
Re
po
RT
FY
20
17
075
De
l M
on
Te
pA
CIF
IC l
IMIT
eD
074
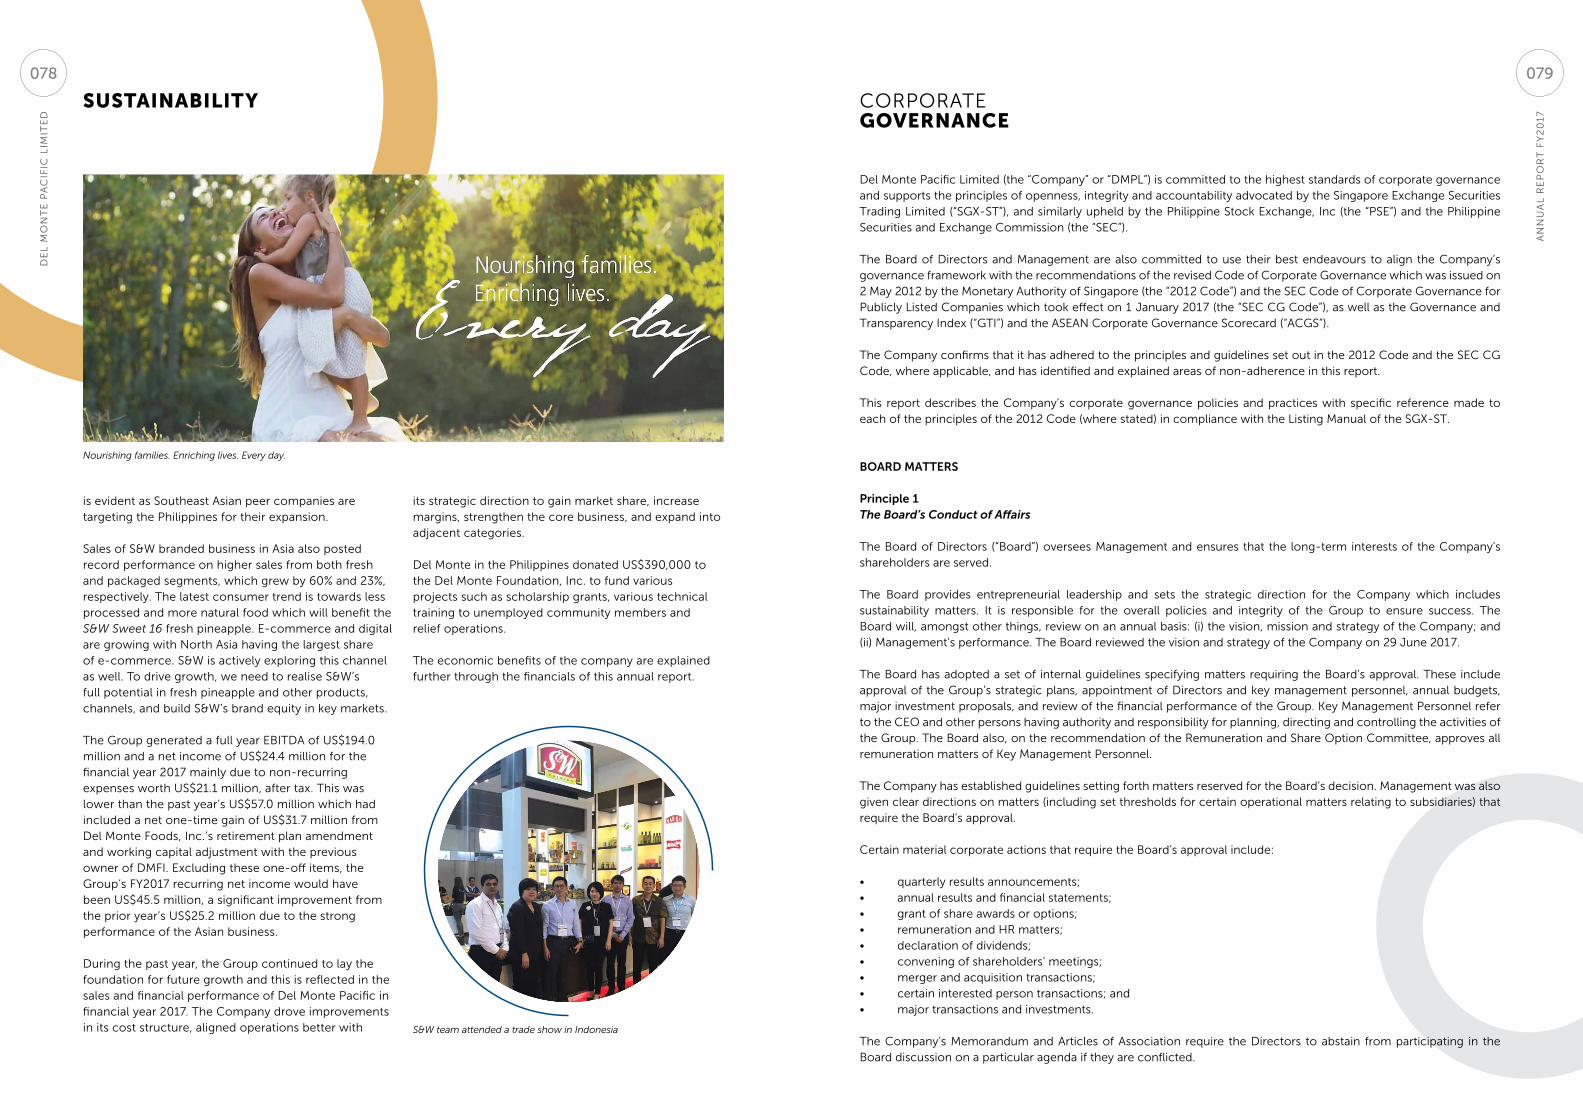
SuStainability
S&W team attended a trade show in Indonesia
Nourishing families. Enriching lives. Every day.
is evident as Southeast Asian peer companies are targeting the philippines for their expansion.
Sales of S&W branded business in Asia also posted record performance on higher sales from both fresh and packaged segments, which grew by 60% and 23%, respectively. the latest consumer trend is towards less processed and more natural food which will benefit the S&W Sweet 16 fresh pineapple. e-commerce and digital are growing with north Asia having the largest share of e-commerce. S&W is actively exploring this channel as well. to drive growth, we need to realise S&W’s full potential in fresh pineapple and other products, channels, and build S&W’s brand equity in key markets.
the Group generated a full year eBItDA of uS$194.0 million and a net income of uS$24.4 million for the financial year 2017 mainly due to non-recurring expenses worth uS$21.1 million, after tax. this was lower than the past year’s uS$57.0 million which had included a net one-time gain of uS$31.7 million from Del Monte Foods, Inc.’s retirement plan amendment and working capital adjustment with the previous owner of DMFI. excluding these one-off items, the Group’s FY2017 recurring net income would have been uS$45.5 million, a significant improvement from the prior year’s uS$25.2 million due to the strong performance of the Asian business.
During the past year, the Group continued to lay the foundation for future growth and this is reflected in the sales and financial performance of Del Monte pacific in financial year 2017. the Company drove improvements in its cost structure, aligned operations better with
its strategic direction to gain market share, increase margins, strengthen the core business, and expand into adjacent categories.
Del Monte in the philippines donated uS$390,000 to the Del Monte Foundation, Inc. to fund various projects such as scholarship grants, various technical training to unemployed community members and relief operations.
the economic benefits of the company are explained further through the financials of this annual report.
De
l M
on
te
pA
CIF
IC l
IMIt
eD
078
CoRpoRAte goVernance
Del Monte pacific limited (the “Company” or “DMpl”) is committed to the highest standards of corporate governance and supports the principles of openness, integrity and accountability advocated by the Singapore exchange Securities trading limited (“SGX-St”), and similarly upheld by the philippine Stock exchange, Inc (the “pSe”) and the philippine Securities and exchange Commission (the “SeC”).
the Board of Directors and Management are also committed to use their best endeavours to align the Company’s governance framework with the recommendations of the revised Code of Corporate Governance which was issued on 2 May 2012 by the Monetary Authority of Singapore (the “2012 Code”) and the SeC Code of Corporate Governance for publicly listed Companies which took effect on 1 January 2017 (the “SeC CG Code”), as well as the Governance and transparency Index (“GtI”) and the ASeAn Corporate Governance Scorecard (“ACGS”).
the Company confirms that it has adhered to the principles and guidelines set out in the 2012 Code and the SeC CG Code, where applicable, and has identified and explained areas of non-adherence in this report. this report describes the Company’s corporate governance policies and practices with specific reference made to each of the principles of the 2012 Code (where stated) in compliance with the listing Manual of the SGX-St.
BoarD Matters
Principle 1The Board’s Conduct of Affairs
the Board of Directors (“Board”) oversees Management and ensures that the long-term interests of the Company’s shareholders are served.
the Board provides entrepreneurial leadership and sets the strategic direction for the Company which includes sustainability matters. It is responsible for the overall policies and integrity of the Group to ensure success. the Board will, amongst other things, review on an annual basis: (i) the vision, mission and strategy of the Company; and (ii) Management’s performance. the Board reviewed the vision and strategy of the Company on 29 June 2017.
the Board has adopted a set of internal guidelines specifying matters requiring the Board’s approval. these include approval of the Group’s strategic plans, appointment of Directors and key management personnel, annual budgets, major investment proposals, and review of the financial performance of the Group. Key Management personnel refer to the Ceo and other persons having authority and responsibility for planning, directing and controlling the activities of the Group. the Board also, on the recommendation of the Remuneration and Share option Committee, approves all remuneration matters of Key Management personnel.
the Company has established guidelines setting forth matters reserved for the Board’s decision. Management was also given clear directions on matters (including set thresholds for certain operational matters relating to subsidiaries) that require the Board’s approval.
Certain material corporate actions that require the Board’s approval include: • quarterlyresultsannouncements;• annualresultsandfinancialstatements;• grantofshareawardsoroptions;• remunerationandHRmatters;• declarationofdividends;• conveningofshareholders’meetings;• mergerandacquisitiontransactions;• certaininterestedpersontransactions;and• majortransactionsandinvestments.
the Company’s Memorandum and Articles of Association require the Directors to abstain from participating in the Board discussion on a particular agenda if they are conflicted.
An
nu
Al
Re
po
Rt
FY
20
17
079
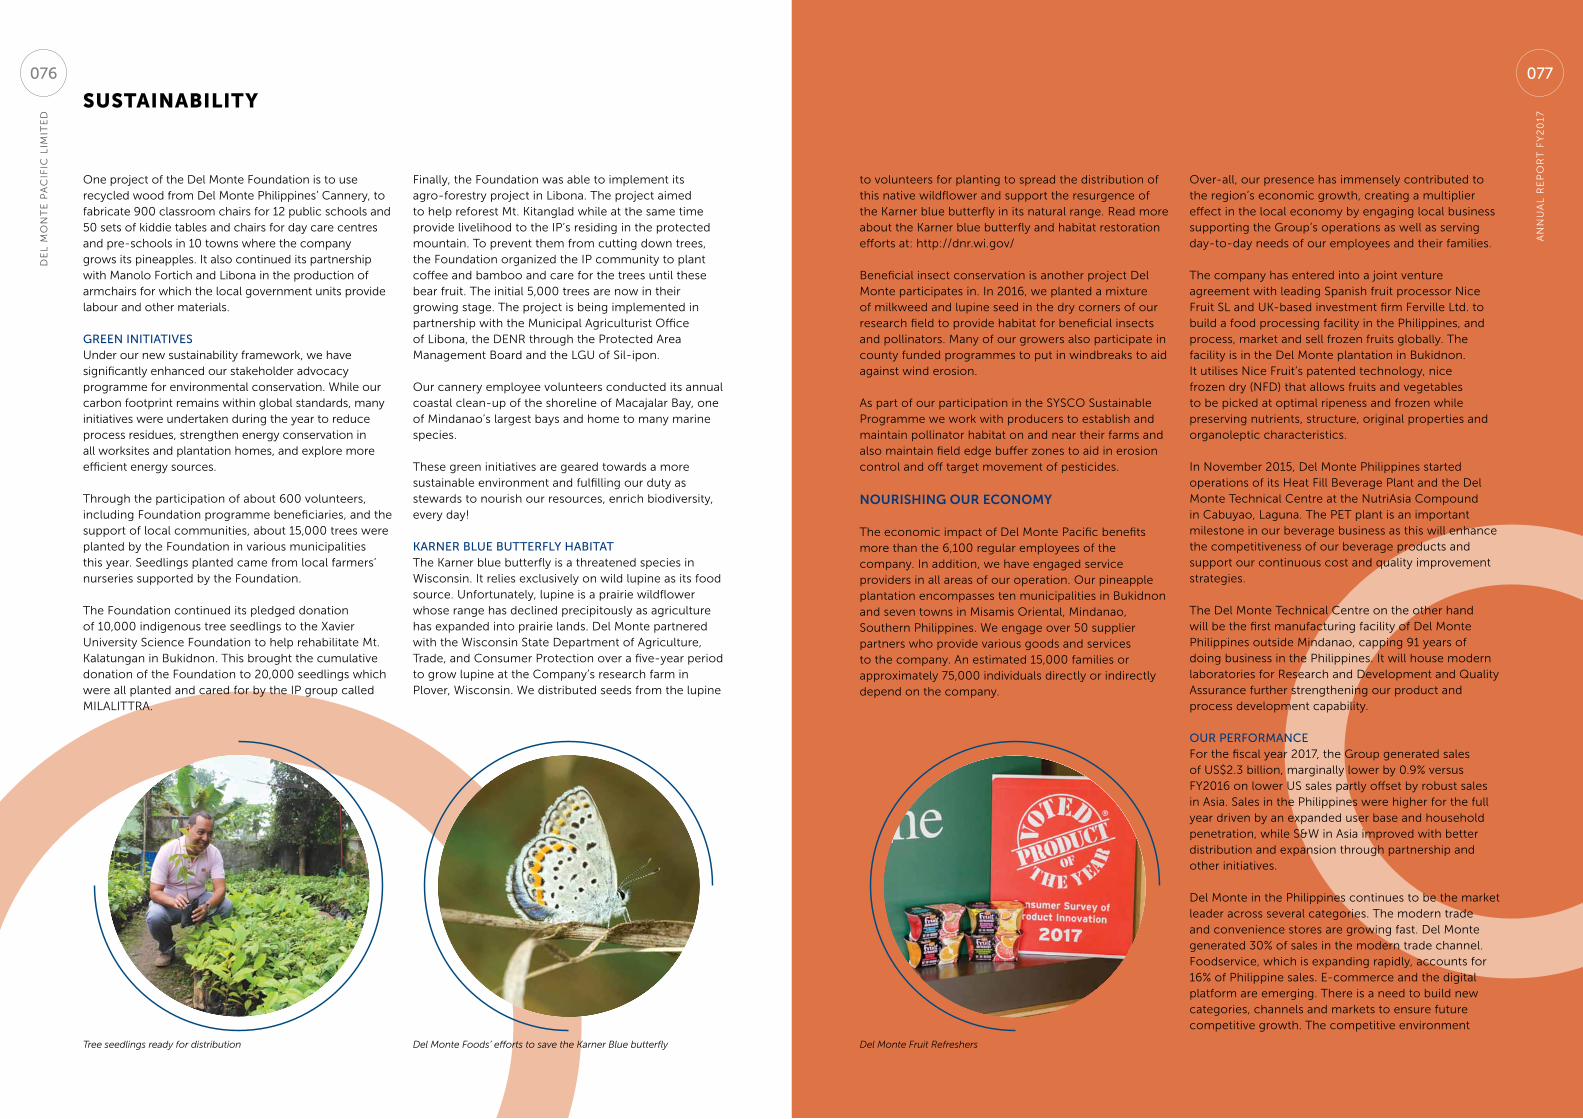
SuStainability
one project of the Del Monte Foundation is to use recycled wood from Del Monte philippines’ Cannery, to fabricate 900 classroom chairs for 12 public schools and 50 sets of kiddie tables and chairs for day care centres and pre-schools in 10 towns where the company grows its pineapples. It also continued its partnership with Manolo Fortich and libona in the production of armchairs for which the local government units provide labour and other materials.
green initiativesunder our new sustainability framework, we have significantly enhanced our stakeholder advocacy programme for environmental conservation. While our carbon footprint remains within global standards, many initiatives were undertaken during the year to reduce process residues, strengthen energy conservation in all worksites and plantation homes, and explore more efficient energy sources.
Through the participation of about 600 volunteers, including Foundation programme beneficiaries, and the support of local communities, about 15,000 trees were planted by the Foundation in various municipalities this year. Seedlings planted came from local farmers’ nurseries supported by the Foundation.
The Foundation continued its pledged donation of 10,000 indigenous tree seedlings to the Xavier university Science Foundation to help rehabilitate Mt. Kalatungan in Bukidnon. This brought the cumulative donation of the Foundation to 20,000 seedlings which were all planted and cared for by the Ip group called MIlAlITTRA.
Tree seedlings ready for distribution
Finally, the Foundation was able to implement its agro-forestry project in libona. The project aimed to help reforest Mt. Kitanglad while at the same time provide livelihood to the Ip’s residing in the protected mountain. To prevent them from cutting down trees, the Foundation organized the Ip community to plant coffee and bamboo and care for the trees until these bear fruit. The initial 5,000 trees are now in their growing stage. The project is being implemented in partnership with the Municipal Agriculturist office of libona, the DenR through the protected Area Management Board and the lGu of Sil-ipon.
our cannery employee volunteers conducted its annual coastal clean-up of the shoreline of Macajalar Bay, one of Mindanao’s largest bays and home to many marine species.
These green initiatives are geared towards a more sustainable environment and fulfilling our duty as stewards to nourish our resources, enrich biodiversity, every day!
karner Blue Butterfly haBitatThe Karner blue butterfly is a threatened species in Wisconsin. It relies exclusively on wild lupine as its food source. unfortunately, lupine is a prairie wildflower whose range has declined precipitously as agriculture has expanded into prairie lands. Del Monte partnered with the Wisconsin State Department of Agriculture, Trade, and Consumer protection over a five-year period to grow lupine at the Company’s research farm in plover, Wisconsin. We distributed seeds from the lupine
Del Monte Foods’ efforts to save the Karner Blue butterfly
to volunteers for planting to spread the distribution of this native wildflower and support the resurgence of the Karner blue butterfly in its natural range. Read more about the Karner blue butterfly and habitat restoration efforts at: http://dnr.wi.gov/
Beneficial insect conservation is another project Del Monte participates in. In 2016, we planted a mixture of milkweed and lupine seed in the dry corners of our research field to provide habitat for beneficial insects and pollinators. Many of our growers also participate in county funded programmes to put in windbreaks to aid against wind erosion.
As part of our participation in the SYSCo Sustainable programme we work with producers to establish and maintain pollinator habitat on and near their farms and also maintain field edge buffer zones to aid in erosion control and off target movement of pesticides.
nourisHing our econoMY
The economic impact of Del Monte pacific benefits more than the 6,100 regular employees of the company. In addition, we have engaged service providers in all areas of our operation. our pineapple plantation encompasses ten municipalities in Bukidnon and seven towns in Misamis oriental, Mindanao, Southern philippines. We engage over 50 supplier partners who provide various goods and services to the company. An estimated 15,000 families or approximately 75,000 individuals directly or indirectly depend on the company.
over-all, our presence has immensely contributed to the region’s economic growth, creating a multiplier effect in the local economy by engaging local business supporting the Group’s operations as well as serving day-to-day needs of our employees and their families.
The company has entered into a joint venture agreement with leading Spanish fruit processor nice Fruit Sl and uK-based investment firm Ferville ltd. to build a food processing facility in the philippines, and process, market and sell frozen fruits globally. The facility is in the Del Monte plantation in Bukidnon. It utilises nice Fruit’s patented technology, nice frozen dry (nFD) that allows fruits and vegetables to be picked at optimal ripeness and frozen while preserving nutrients, structure, original properties and organoleptic characteristics.
In november 2015, Del Monte philippines started operations of its Heat Fill Beverage plant and the Del Monte Technical Centre at the nutriAsia Compound in Cabuyao, laguna. The peT plant is an important milestone in our beverage business as this will enhance the competitiveness of our beverage products and support our continuous cost and quality improvement strategies.
The Del Monte Technical Centre on the other hand will be the first manufacturing facility of Del Monte philippines outside Mindanao, capping 91 years of doing business in the philippines. It will house modern laboratories for Research and Development and Quality Assurance further strengthening our product and process development capability.
our PerforManceFor the fiscal year 2017, the Group generated sales of uS$2.3 billion, marginally lower by 0.9% versus FY2016 on lower uS sales partly offset by robust sales in Asia. Sales in the philippines were higher for the full year driven by an expanded user base and household penetration, while S&W in Asia improved with better distribution and expansion through partnership and other initiatives.
Del Monte in the philippines continues to be the market leader across several categories. The modern trade and convenience stores are growing fast. Del Monte generated 30% of sales in the modern trade channel. Foodservice, which is expanding rapidly, accounts for 16% of philippine sales. e-commerce and the digital platform are emerging. There is a need to build new categories, channels and markets to ensure future competitive growth. The competitive environment
Del Monte Fruit Refreshers
An
nu
Al
Re
po
RT
FY
20
17
077
De
l M
on
Te
pA
CIF
IC l
IMIT
eD
076
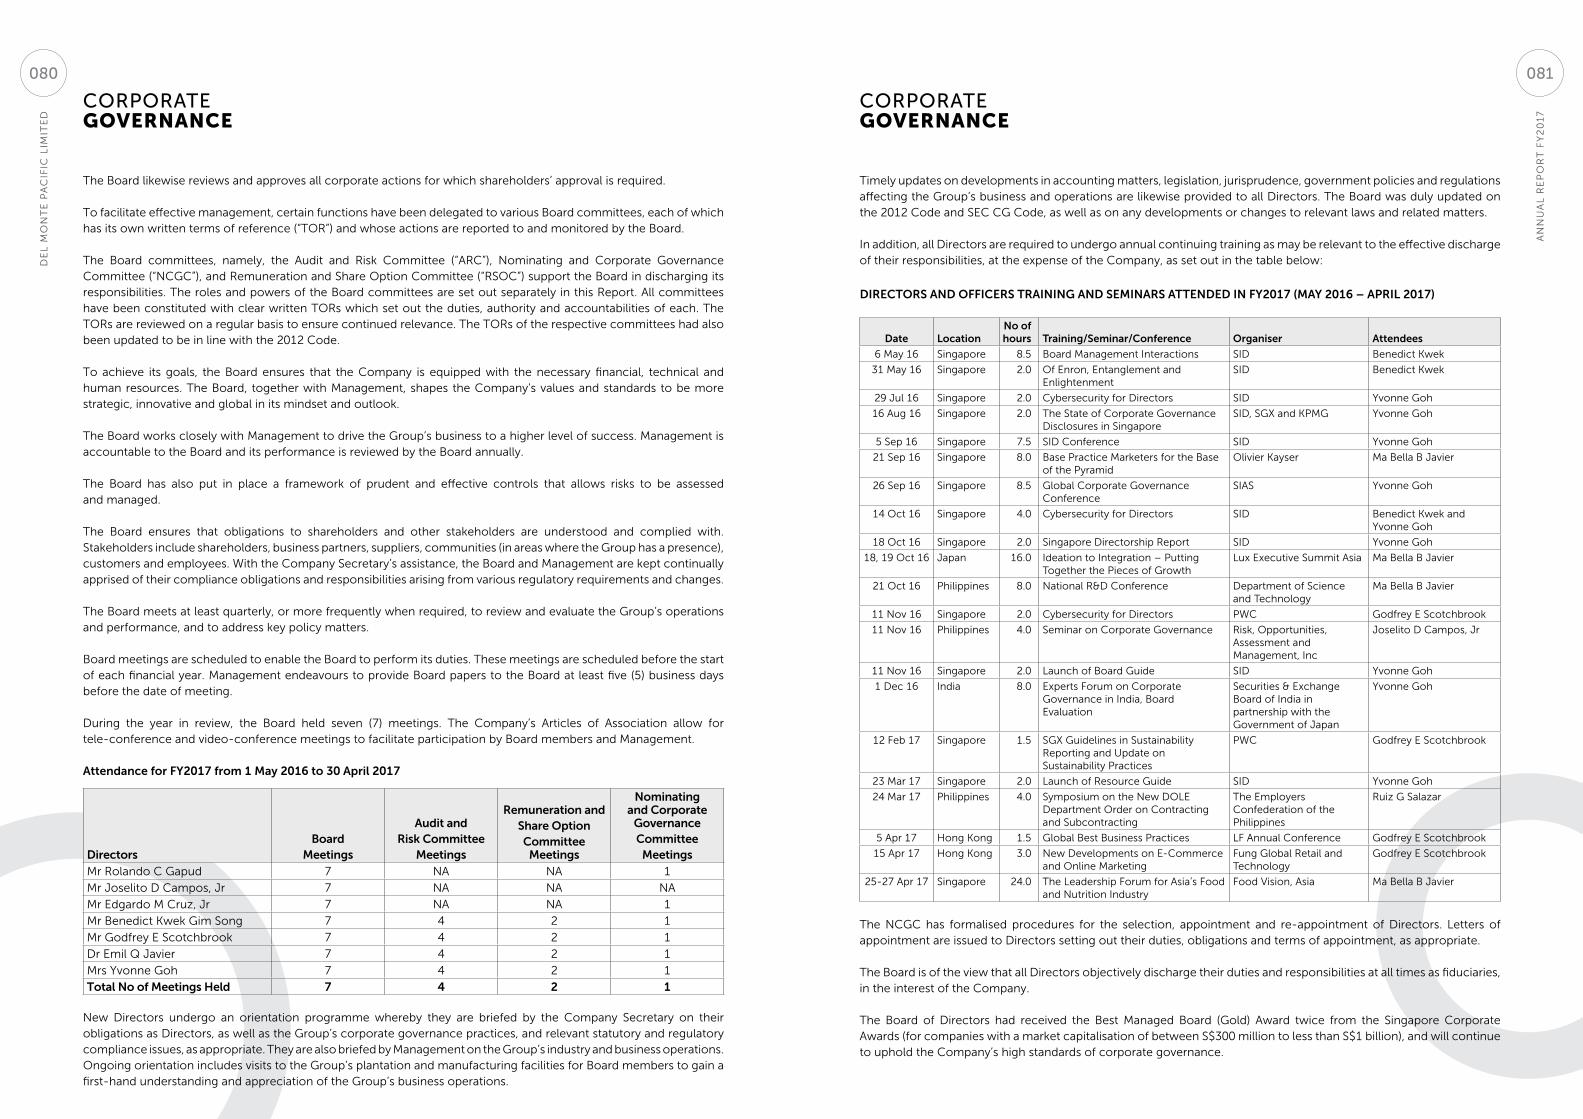
CORPORATE GOVERNANCE
CORPORATE GOVERNANCE
Timely updates on developments in accounting matters, legislation, jurisprudence, government policies and regulations affecting the Group’s business and operations are likewise provided to all Directors. The Board was duly updated on the 2012 Code and SEC CG Code, as well as on any developments or changes to relevant laws and related matters.
In addition, all Directors are required to undergo annual continuing training as may be relevant to the effective discharge of their responsibilities, at the expense of the Company, as set out in the table below:
DIRECTORS AND OFFICERS TRAINING AND SEMINARS ATTENDED IN FY2017 (MAY 2016 – APRIL 2017)
Date LocationNo of hours Training/Seminar/Conference Organiser Attendees
6 May 16 Singapore 8.5 Board Management Interactions SID Benedict Kwek
31 May 16 Singapore 2.0 Of Enron, Entanglement and Enlightenment
SID Benedict Kwek
29 Jul 16 Singapore 2.0 Cybersecurity for Directors SID Yvonne Goh
16 Aug 16 Singapore 2.0 The State of Corporate Governance Disclosures in Singapore
SID, SGX and KPMG Yvonne Goh
5 Sep 16 Singapore 7.5 SID Conference SID Yvonne Goh
21 Sep 16 Singapore 8.0 Base Practice Marketers for the Base of the Pyramid
Olivier Kayser Ma Bella B Javier
26 Sep 16 Singapore 8.5 Global Corporate Governance Conference
SIAS Yvonne Goh
14 Oct 16 Singapore 4.0 Cybersecurity for Directors SID Benedict Kwek and Yvonne Goh
18 Oct 16 Singapore 2.0 Singapore Directorship Report SID Yvonne Goh
18, 19 Oct 16 Japan 16.0 Ideation to Integration – Putting Together the Pieces of Growth
Lux Executive Summit Asia Ma Bella B Javier
21 Oct 16 Philippines 8.0 National R&D Conference Department of Science and Technology
Ma Bella B Javier
11 Nov 16 Singapore 2.0 Cybersecurity for Directors PWC Godfrey E Scotchbrook
11 Nov 16 Philippines 4.0 Seminar on Corporate Governance Risk, Opportunities, Assessment and Management, Inc
Joselito D Campos, Jr
11 Nov 16 Singapore 2.0 Launch of Board Guide SID Yvonne Goh
1 Dec 16 India 8.0 Experts Forum on Corporate Governance in India, Board Evaluation
Securities & Exchange Board of India in partnership with the Government of Japan
Yvonne Goh
12 Feb 17 Singapore 1.5 SGX Guidelines in Sustainability Reporting and Update on Sustainability Practices
PWC Godfrey E Scotchbrook
23 Mar 17 Singapore 2.0 Launch of Resource Guide SID Yvonne Goh
24 Mar 17 Philippines 4.0 Symposium on the New DOLE Department Order on Contracting and Subcontracting
The Employers Confederation of the Philippines
Ruiz G Salazar
5 Apr 17 Hong Kong 1.5 Global Best Business Practices LF Annual Conference Godfrey E Scotchbrook
15 Apr 17 Hong Kong 3.0 New Developments on E-Commerce and Online Marketing
Fung Global Retail and Technology
Godfrey E Scotchbrook
25-27 Apr 17 Singapore 24.0 The Leadership Forum for Asia’s Food and Nutrition Industry
Food Vision, Asia Ma Bella B Javier
The NCGC has formalised procedures for the selection, appointment and re-appointment of Directors. Letters of appointment are issued to Directors setting out their duties, obligations and terms of appointment, as appropriate.
The Board is of the view that all Directors objectively discharge their duties and responsibilities at all times as fiduciaries, in the interest of the Company.
The Board of Directors had received the Best Managed Board (Gold) Award twice from the Singapore Corporate Awards (for companies with a market capitalisation of between S$300 million to less than S$1 billion), and will continue to uphold the Company’s high standards of corporate governance.
The Board likewise reviews and approves all corporate actions for which shareholders’ approval is required.
To facilitate effective management, certain functions have been delegated to various Board committees, each of which has its own written terms of reference (“TOR”) and whose actions are reported to and monitored by the Board.
The Board committees, namely, the Audit and Risk Committee (“ARC”), Nominating and Corporate Governance Committee (“NCGC”), and Remuneration and Share Option Committee (“RSOC”) support the Board in discharging its responsibilities. The roles and powers of the Board committees are set out separately in this Report. All committees have been constituted with clear written TORs which set out the duties, authority and accountabilities of each. The TORs are reviewed on a regular basis to ensure continued relevance. The TORs of the respective committees had also been updated to be in line with the 2012 Code.
To achieve its goals, the Board ensures that the Company is equipped with the necessary financial, technical and human resources. The Board, together with Management, shapes the Company’s values and standards to be more strategic, innovative and global in its mindset and outlook.
The Board works closely with Management to drive the Group’s business to a higher level of success. Management is accountable to the Board and its performance is reviewed by the Board annually.
The Board has also put in place a framework of prudent and effective controls that allows risks to be assessed and managed.
The Board ensures that obligations to shareholders and other stakeholders are understood and complied with. Stakeholders include shareholders, business partners, suppliers, communities (in areas where the Group has a presence), customers and employees. With the Company Secretary’s assistance, the Board and Management are kept continually apprised of their compliance obligations and responsibilities arising from various regulatory requirements and changes.
The Board meets at least quarterly, or more frequently when required, to review and evaluate the Group’s operations and performance, and to address key policy matters.
Board meetings are scheduled to enable the Board to perform its duties. These meetings are scheduled before the start of each financial year. Management endeavours to provide Board papers to the Board at least five (5) business days before the date of meeting.
During the year in review, the Board held seven (7) meetings. The Company’s Articles of Association allow for tele-conference and video-conference meetings to facilitate participation by Board members and Management.
Attendance for FY2017 from 1 May 2016 to 30 April 2017
DirectorsBoard
Meetings
Audit and Risk Committee
Meetings
Remuneration andShare OptionCommittee
Meetings
Nominating and Corporate
GovernanceCommittee
MeetingsMr Rolando C Gapud 7 NA NA 1
Mr Joselito D Campos, Jr 7 NA NA NA
Mr Edgardo M Cruz, Jr 7 NA NA 1
Mr Benedict Kwek Gim Song 7 4 2 1
Mr Godfrey E Scotchbrook 7 4 2 1
Dr Emil Q Javier 7 4 2 1
Mrs Yvonne Goh 7 4 2 1
Total No of Meetings Held 7 4 2 1
New Directors undergo an orientation programme whereby they are briefed by the Company Secretary on their obligations as Directors, as well as the Group’s corporate governance practices, and relevant statutory and regulatory compliance issues, as appropriate. They are also briefed by Management on the Group’s industry and business operations. Ongoing orientation includes visits to the Group’s plantation and manufacturing facilities for Board members to gain a first-hand understanding and appreciation of the Group’s business operations.
AN
NU
AL
RE
PO
RT
FY
20
17
DE
L M
ON
TE
PA
CIF
IC L
IMIT
ED
081080
CORPORATE GOVERNANCE
CORPORATE GOVERNANCE
Consistent with previous practice, the NCGC had undertaken a rigorous review of the independence of each Independent Director, including those whose tenure had exceeded nine (9) years from the date of their appointment. Led by the NCGC Chairman and facilitated by BoardRoom, the assessment was conducted by means of a confidential and incisive questionnaire completed by each Director and confirmation completed by the Independent Directors. The results were analysed and discussed at the NC and Board meetings. Each member of the NCGC had abstained from deliberations in respect of the assessment on his own independence.
Based on the assessment, Messrs Benedict Kwek Gim Song (first appointed on 30 April 2007), Emil Q Javier (first appointed on 30 April 2007) and Godfrey E Scotchbrook, (first appointed on 28 December 2000) have demonstrated independent mindedness and conduct at Board and Board committee meetings. The NCGC is also of the firm view and opinion that these Directors exercise independent judgment in the best interest of the Company in the discharge of their duties as Directors, inspite of their tenure in the Board exceeding nine (9) years.
Our Directors also bring invaluable experience, extensive business network and expertise in specialised fields, such as strategic planning, mergers and acquisitions, corporate finance and restructuring, accounting, marketing and business development, risk and crisis management, corporate communications, investor relations, corporate governance and agronomy.
The size, composition, range of experience and the varied expertise of current Board members allow discussions on policy, strategy and performance to be critical, informed and effective.
The Board has adopted a Board Diversity Policy which recognises the importance of diversity. The Board firmly believes that its effectiveness and decision-making will be enhanced as it harnesses the variety of skills, industry and business experiences, gender, age, ethnicity and culture, geographical background and nationalities, tenure of service, and other distinguishing qualities of its own diverse Board.
The NCGC is responsible for administering this policy and for evaluating it annually.
Principle 3Chairman and Chief Executive Officer
There is a clear division of executive duties and responsibilities in the Company, providing checks and balances to ensure that there is no concentration of power, in any one individual and that accountability is increased. The Company’s business is managed and administered by the Managing Director and CEO, Mr Joselito D Campos Jr, whilst the Board is headed by Mr Rolando C Gapud as Executive Chairman. The Executive Chairman of the Board and the CEO are not related to each other.
The duties of the Executive Chairman include, amongst other things, providing leadership to the Board and ensuring the effectiveness of the Board in all aspects, leading the Company in its relationships with stakeholders and setting the course for the Company to reach greater heights. He works closely with the CEO as well as the business unit heads on strategic planning. He leads the Board in charting the strategic roadmap of the Company including setting the vision and the key initiatives to achieve it. He is in the forefront of any acquisitions, joint ventures and strategic alliances of the Company.
The Executive Chairman also sets the tone of Board meetings to encourage proactive participation and constructive discussions on agenda topics. During Board meetings, he ensures that adequate time is available for discussion of all agenda items, in particular, discussions on strategic matters and issues. Constructive relations between the Board and Management are encouraged, as with Executive Directors and Non-Executive Directors. The Executive Chairman ensures that Directors and shareholders alike, receive clear, timely and accurate information from Management, thus maintaining the Company’s high standards of corporate governance.
Principle 2Board’s Composition and Guidance
The Board comprises seven (7) Directors, three (3) of whom are Executive Directors. The four (4) Non-Executive Directors are Independent Directors. The composition of the Board of Directors is as follows:
Mr Rolando C Gapud Executive ChairmanMr Joselito D Campos, Jr Managing Director and CEOMr Edgardo M Cruz, Jr Executive DirectorMr Benedict Kwek Gim Song Lead Independent DirectorMr Godfrey E Scotchbrook Independent DirectorDr Emil Q Javier Independent DirectorMrs Yvonne Goh Independent Director
The profiles of the Directors, including information on their appointments and re-appointments, are set out in the “Board of Directors” section of this Report.
Lead Independent Director
Mr Benedict Kwek Gim Song acts as the Lead Independent Director and is the principal liaison to address shareholders’ concerns, in which direct contact through normal channels of the Chairman, CEO or Management had failed to resolve, or for which such contact is inappropriate. His role as Lead Independent Director includes the following:
• Act as liaison between the Independent Directors and the Chairman of the Board and lead the Independent Directors to provide a non-executive perspective in circumstances where it would be inappropriate for the Chairman to serve in such capacity, and to contribute a balanced viewpoint to the Board;
• Advise the Chairman of the Board as to the quality, quantity and timeliness of information submitted by Management that is necessary or appropriate for the Independent Directors to effectively and responsibly perform their duties;
• Assist the Board in better ensuring compliance with, and implementation of, governance guidelines; and
• Serve as a liaison for consultation and communication with shareholders.
The Board is of the view that a strong element of independence is present in the Board with Independent Directors making up more than half the Board. The Board exercises objective and independent judgment on the Group’s corporate affairs. No individual or group of individuals dominates the Board’s decision-making.
The Non-Executive Directors contribute to the Board process by monitoring and reviewing Management’s performance against pre-determined goals and objectives. Their views and opinions provide alternative perspectives to the Group’s business. The Directors exercise independent judgment and discretion on the Group’s business activities and transactions, in particular, in situations involving conflicts of interest and other complexities.
The NCGC, on an annual basis, determines whether or not a director is independent, taking into account the 2012 Code’s definition.
Independence is taken to mean that Directors have no relationship with the Company, or its related corporations, its 10% shareholders or its officers that could interfere, or be reasonably perceived to interfere, with the exercise of the Director’s independent business judgment.
The 2012 Code states that the independence of any Director who has served on the Board beyond nine (9) years from the date of his first appointment should be subject to particularly rigorous review.
AN
NU
AL
RE
PO
RT
FY
20
17
DE
L M
ON
TE
PA
CIF
IC L
IMIT
ED
083082
CORPORATE GOVERNANCE
CORPORATE GOVERNANCE
The NCGC is also tasked with reviewing the performance and contribution of the Directors in order to nominate them for re-election or re-appointment. The NCGC will review, in particular, the Directors’ attendance and participation at meetings of the Board and Board committees, and their efforts and contributions towards the success of the Group’s business and operations.
The NCGC reviews and determines the independence of each Director on an annual basis.
Details of each Director’s academic and professional qualifications, directorships or chairmanships in other companies, and other major appointments, are presented in the “Board of Directors” section of this Annual Report.
DMPL’s policy on directors’ conflict of interest states that Directors should consult the Chairman of the Board and the Chairman of the NCGC prior to accepting any appointments to the board of directors or advisory board of another listed company or its principal subsidiaries, or any other principal commitments so that such appointments may be considered by the Board in accordance with corporate guidelines and the Policy.
In cases where a Director has multiple Board representations, the NCGC also assesses whether such Director has been adequately carrying out his duties as a Director of the Company.
To address competing time commitments when Directors serve on multiple boards, the Board had set a maximum limit of four (4) directorships and/or chairmanships that Executive Directors may hold concurrently for listed companies, and a maximum limit of five (5) directorships and/or chairmanship in listed companies for Independent and Non-Executive Directors. The details of directorships and/or chairmanships in other listed companies and other principal commitments of the Directors are set out in the “Board of Directors” section of this Annual Report.
Under Article 88 of the Company’s Articles of Association, all Directors hold office for a maximum period of three (3) years whereupon they shall retire, but they are eligible for re-election.
Director Retiring Under Article 88
Mr Rolando C Gapud Executive Chairman Appointed on 20 January 2006 Re-elected on 29 April 2011 and 15 April 2014
Mr Benedict Kwek Gim Song Lead Independent DirectorAppointed on 30 April 2007Re-elected on 29 April 2011 and 15 April 2014
In reviewing the nomination for re-election of the Directors retiring under Article 88 of the Company’s Articles of Association, the NCGC had considered the contributions and performance of each Director, taking into account his/her attendance and participation at Board and Board committee meetings.
All Directors retiring have consented to continue in office and have offered themselves for re-election at the Company’s AGM.
Both Mr Gapud and Mr Kwek are neither substantial shareholders nor directly associated to any substantial shareholder or a 10% shareholder of the Company.
In its long term drive towards excellence, the Company recognises the importance of sustainable leadership. To support this, a Succession Planning Programme has been established where a leadership talent bench is developed. DMPL is committed to building and sustaining leadership capabilities by strengthening the talent pipeline, rolling out the leadership competencies, identifying high performers, and executing development and retention plans for these high performers. The Company further drives functional excellence via an integrated employee development programme which includes training, on-the-job learning, coaching and mentoring.
The duties of the CEO include, amongst other things, determining the Company’s strategic direction, formulating, executing and implementing the strategic plan together with its Key Management Personnel. He communicates and implements the Company’s vision, mission, values and overall strategy, and promotes any organisation change in relation to the same. He oversees the operations of the Company, and manages the human and financial resources in accordance with the strategic plan. The CEO ensures that he has an intimate working knowledge of the Company’s industry and market, and keeps up to date with developments in both. He also directs, evaluates and guides the work of the Company’s Key Management Personnel, and provides the Board with timely information and interfaces between the Board and Management. He builds the corporate culture and motivates the Company’s employees, and serves as the link between the Company and its stakeholders.
Principle 4Board Membership
The Nominating Committee was set up on 7 February 2003 and had been renamed on 29 June 2017 as the Nominating and Corporate Governance Committee (“NCGC”) to include corporate governance matters in its functions. The members of the NCGC remain the same. It currently comprises the following members, a majority of whom, including the Chairman, are Independent Directors:
Mr Godfrey E Scotchbrook NCGC ChairmanMr Benedict Kwek Gim Song MemberDr Emil Q Javier MemberMrs Yvonne Goh MemberMr Rolando C Gapud MemberMr Edgardo M Cruz, Jr Member
Under its TOR, the NCGC is responsible for reviewing the Board’s composition and effectiveness, and determining whether Directors possess the requisite qualifications and expertise and whether the independence of Directors is compromised. The NCGC is tasked with ensuring compliance with, and proper observance of, corporate governance principles and practices recommended by the 2012 Code and the SEC CG Code.
All appointments and re-appointments of Directors are first reviewed and considered by the NCGC and then recommended for approval by the Board. The NCGC has formalised this process and has adopted procedures for the selection, appointment and re-appointment of Directors in order to increase transparency of the nominating process.
The NCGC evaluates the balance of skills and competencies on the Board and, in consultation with the Chairman of the Board and Management, determine the desired skill sets and qualities for a particular appointment.
The NCGC does not usually but may consider engaging the services of search consultants to identify prospective candidates if the need so arises. The NCGC currently considers recommendations and referrals, provided the prospective candidates meet the qualification criteria established for the particular appointment.
The NCGC undertakes the process of identifying the quality of directors aligned with the Company’s strategic directions. The NCGC evaluates the suitability of a prospective candidate based on her or his qualifications and experience, ability to commit time and effort in the effective discharge of duties and responsibilities, independence, past business and related experience, and track record. The NCGC identifies any core competencies that will complement those of current Directors on the Board.
AN
NU
AL
RE
PO
RT
FY
20
17
DE
L M
ON
TE
PA
CIF
IC L
IMIT
ED
085084
CORPORATE GOVERNANCE
CORPORATE GOVERNANCE
Principle 6Access to Information
Management endeavours to provide the Board with timely and complete information at least five (5) business days prior to Board meetings and on an ongoing basis. These include relevant information and explanatory notes for matters that are presented to the Board, such as budgets and forecasts.
At Board meetings, the Group’s actual results are compared with budgets, and material variances are explained. The strategies and forecasts for the following months are discussed and approved as appropriate.
The Directors have separate and independent access to Management and the Company Secretary. The Company Secretary assists the Chairman in ensuring that Board procedures are followed and regularly reviewed to ensure the effective functioning of the Board, and that the Company’s Memorandum and Articles of Association, and relevant rules and regulations are complied with.
The Company Secretary also assists in the preparation of the Agenda for Board and Board committee meetings, and attends and prepares minutes of all Board and Board committee meetings.
The Company Secretary ensures the flow of qualitative information within the Board and its committees, and between senior Management and the Non-Executive Directors. He is the primary channel of communication between the Company and the SGX-ST, the PSE and the SEC.
The Company Secretary advises newly-appointed Directors on their duties and obligations as Directors, the Group’s governance practices, and relevant statutory and regulatory compliance matters, as part of an orientation programme. In addition, he assists with the professional development and training of Board members, as appropriate.
The appointment and the removal of the Company Secretary is a matter for the Board as a whole.
The Company Secretary, Mr Antonio E S Ungson, is a lawyer by profession. He had previously served as company secretary in various companies during the course of his career. He also has an understanding of basic financial and accounting matters.
Aside from access to the advice and services of Management and the Company Secretary, the Directors may, in appropriate circumstances, seek independent professional advice concerning the Company’s affairs at the Company’s expense.
REMUNERATION MATTERS
Principle 7Procedures for Developing Remuneration Policies
The RSOC was set up on 7 February 2003 and for the year in review, the RSOC comprises the following members who are all Independent Non-Executive Directors:
Mr Godfrey E Scotchbrook RSOC ChairmanMr Benedict Kwek Gim Song MemberDr Emil Q Javier MemberMrs Yvonne Goh Member
The RSOC’s principal function is to ensure that a formal and transparent procedure is in place for fixing the remuneration packages of the Directors as well as Key Management Personnel of the Group. It is at liberty to seek independent professional advice as appropriate and has periodically sought the advice of remuneration consultants on remuneration matters for Directors and Key Management Personnel.
There is a set retirement age for Key Management Personnel. The NCGC conducts a review of the succession plan for Board members, CEO and Key Management Personnel of the Company.
The NCGC implements an evaluation process to assess its effectiveness as a whole. The evaluation process is undertaken as an internal exercise and involves NCGC members completing a questionnaire covering areas relating to:
• Memberships and appointments• Conduct of NCGC meetings• Trainings and resources available• Reporting to the Board • Process for selection and appointment of new Directors• Nomination of Directors and re-election• Independence of Directors• Board performance evaluation • Succession planning• Multiple Board representations• Standards of conduct • Communication with shareholders
The evaluation process takes into account the views of each NC member and provides an opportunity for members to give constructive feedback on the workings of the NCGC, including procedures and processes adopted, and if these may be improved upon.
The evaluation exercise is carried out by the NCGC on an annual basis.
Principle 5Board Performance
The Board, through the NCGC, implements an annual evaluation process to assess the effectiveness of the Board as a whole. The evaluation process is undertaken as an internal exercise and involves Board members completing a questionnaire covering areas relating to:
• Board composition• Information to the Board • Board procedures • Board accountability• Communication with CEO and Key Management Personnel• Succession planning of Key Management Personnel• Standards of conduct by the Board
The evaluation process takes into account the views of each Board member and provides an opportunity for Directors to provide constructive feedback on the workings of the Board, including its procedures and processes and if these may be improved upon.
Led by the NCGC Chairman and facilitated by external service provider, this collective assessment was conducted by means of a confidential questionnaire completed by each Director, which is collated, analysed and discussed with the NCGC and the Board with comparatives from the prior period evaluation. Recommendations to further enhance the effectiveness of the Board are implemented, as appropriate.
None of the Directors have appointed any alternate Director(s).
AN
NU
AL
RE
PO
RT
FY
20
17
DE
L M
ON
TE
PA
CIF
IC L
IMIT
ED
087086
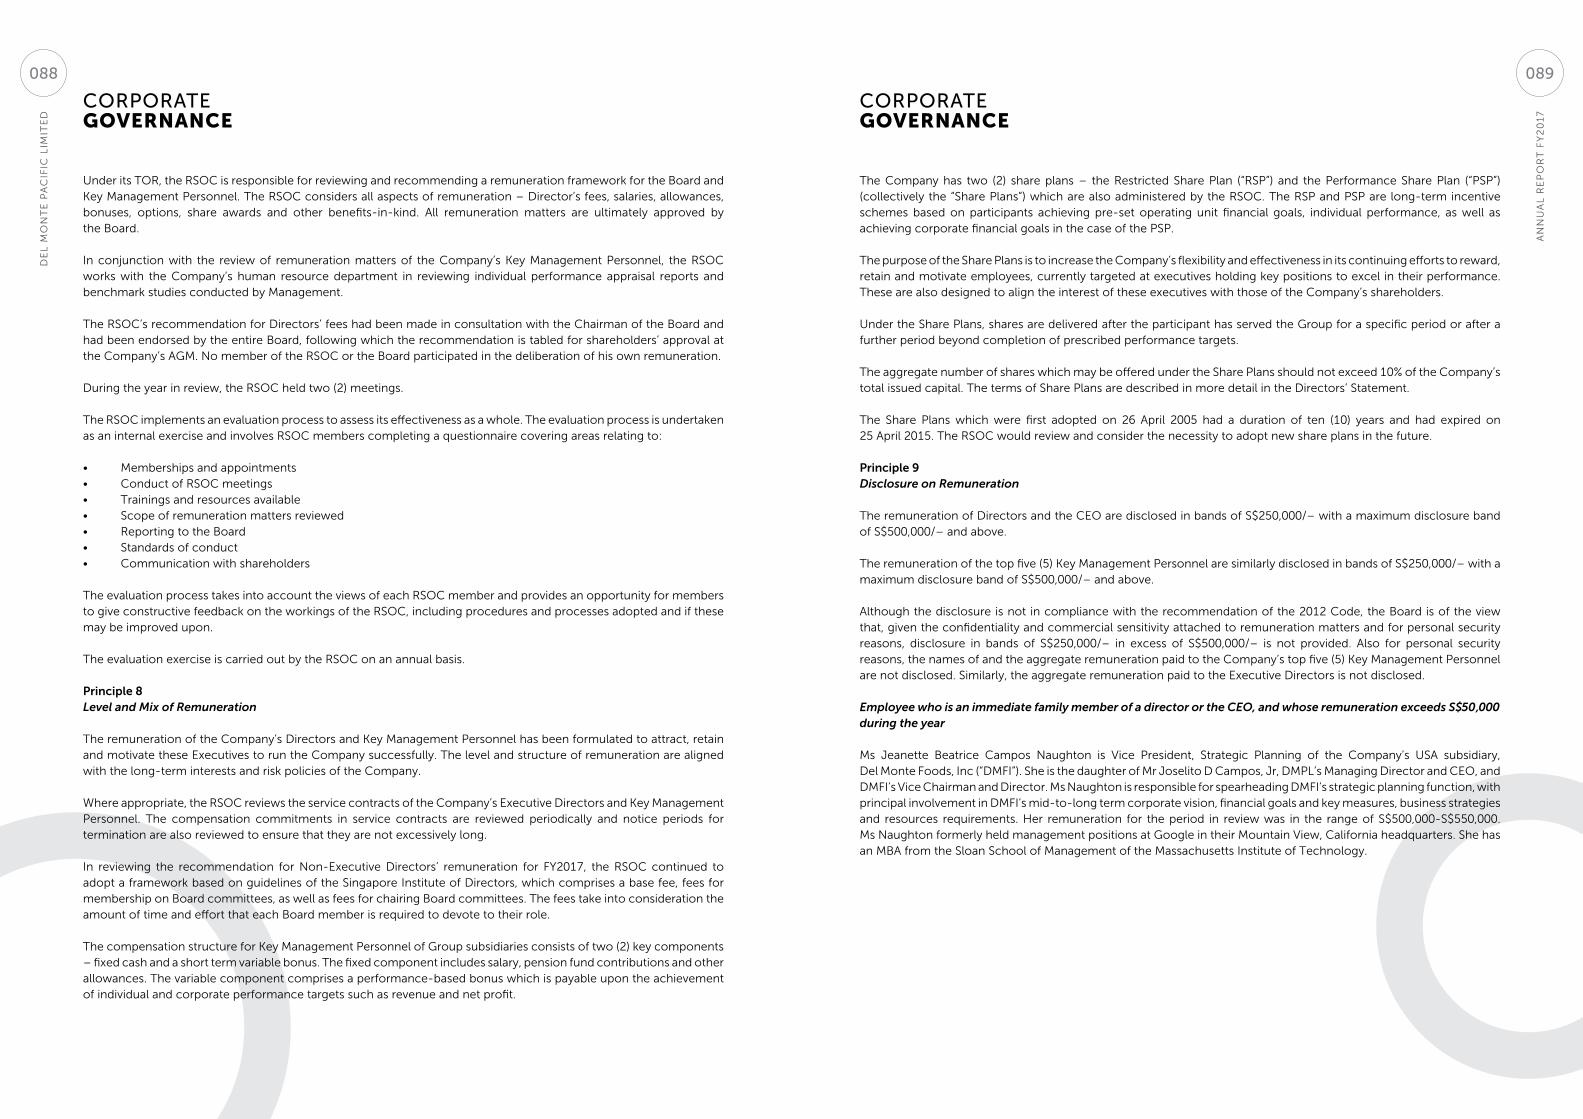
CORPORATE GOVERNANCE
CORPORATE GOVERNANCE
The Company has two (2) share plans – the Restricted Share Plan (“RSP”) and the Performance Share Plan (“PSP”) (collectively the “Share Plans”) which are also administered by the RSOC. The RSP and PSP are long-term incentive schemes based on participants achieving pre-set operating unit financial goals, individual performance, as well as achieving corporate financial goals in the case of the PSP.
The purpose of the Share Plans is to increase the Company’s flexibility and effectiveness in its continuing efforts to reward, retain and motivate employees, currently targeted at executives holding key positions to excel in their performance. These are also designed to align the interest of these executives with those of the Company’s shareholders.
Under the Share Plans, shares are delivered after the participant has served the Group for a specific period or after a further period beyond completion of prescribed performance targets.
The aggregate number of shares which may be offered under the Share Plans should not exceed 10% of the Company’s total issued capital. The terms of Share Plans are described in more detail in the Directors’ Statement.
The Share Plans which were first adopted on 26 April 2005 had a duration of ten (10) years and had expired on 25 April 2015. The RSOC would review and consider the necessity to adopt new share plans in the future.
Principle 9Disclosure on Remuneration
The remuneration of Directors and the CEO are disclosed in bands of S$250,000/– with a maximum disclosure band of S$500,000/– and above.
The remuneration of the top five (5) Key Management Personnel are similarly disclosed in bands of S$250,000/– with a maximum disclosure band of S$500,000/– and above.
Although the disclosure is not in compliance with the recommendation of the 2012 Code, the Board is of the view that, given the confidentiality and commercial sensitivity attached to remuneration matters and for personal security reasons, disclosure in bands of S$250,000/– in excess of S$500,000/– is not provided. Also for personal security reasons, the names of and the aggregate remuneration paid to the Company’s top five (5) Key Management Personnel are not disclosed. Similarly, the aggregate remuneration paid to the Executive Directors is not disclosed.
Employee who is an immediate family member of a director or the CEO, and whose remuneration exceeds S$50,000 during the year
Ms Jeanette Beatrice Campos Naughton is Vice President, Strategic Planning of the Company’s USA subsidiary, Del Monte Foods, Inc (“DMFI”). She is the daughter of Mr Joselito D Campos, Jr, DMPL’s Managing Director and CEO, and DMFI’s Vice Chairman and Director. Ms Naughton is responsible for spearheading DMFI’s strategic planning function, with principal involvement in DMFI’s mid-to-long term corporate vision, financial goals and key measures, business strategies and resources requirements. Her remuneration for the period in review was in the range of S$500,000-S$550,000. Ms Naughton formerly held management positions at Google in their Mountain View, California headquarters. She has an MBA from the Sloan School of Management of the Massachusetts Institute of Technology.
Under its TOR, the RSOC is responsible for reviewing and recommending a remuneration framework for the Board and Key Management Personnel. The RSOC considers all aspects of remuneration – Director’s fees, salaries, allowances, bonuses, options, share awards and other benefits-in-kind. All remuneration matters are ultimately approved by the Board.
In conjunction with the review of remuneration matters of the Company’s Key Management Personnel, the RSOC works with the Company’s human resource department in reviewing individual performance appraisal reports and benchmark studies conducted by Management.
The RSOC’s recommendation for Directors’ fees had been made in consultation with the Chairman of the Board and had been endorsed by the entire Board, following which the recommendation is tabled for shareholders’ approval at the Company’s AGM. No member of the RSOC or the Board participated in the deliberation of his own remuneration.
During the year in review, the RSOC held two (2) meetings.
The RSOC implements an evaluation process to assess its effectiveness as a whole. The evaluation process is undertaken as an internal exercise and involves RSOC members completing a questionnaire covering areas relating to:
• Memberships and appointments• Conduct of RSOC meetings• Trainings and resources available• Scope of remuneration matters reviewed• Reporting to the Board • Standards of conduct • Communication with shareholders
The evaluation process takes into account the views of each RSOC member and provides an opportunity for members to give constructive feedback on the workings of the RSOC, including procedures and processes adopted and if these may be improved upon.
The evaluation exercise is carried out by the RSOC on an annual basis.
Principle 8Level and Mix of Remuneration
The remuneration of the Company’s Directors and Key Management Personnel has been formulated to attract, retain and motivate these Executives to run the Company successfully. The level and structure of remuneration are aligned with the long-term interests and risk policies of the Company.
Where appropriate, the RSOC reviews the service contracts of the Company’s Executive Directors and Key Management Personnel. The compensation commitments in service contracts are reviewed periodically and notice periods for termination are also reviewed to ensure that they are not excessively long.
In reviewing the recommendation for Non-Executive Directors’ remuneration for FY2017, the RSOC continued to adopt a framework based on guidelines of the Singapore Institute of Directors, which comprises a base fee, fees for membership on Board committees, as well as fees for chairing Board committees. The fees take into consideration the amount of time and effort that each Board member is required to devote to their role.
The compensation structure for Key Management Personnel of Group subsidiaries consists of two (2) key components – fixed cash and a short term variable bonus. The fixed component includes salary, pension fund contributions and other allowances. The variable component comprises a performance-based bonus which is payable upon the achievement of individual and corporate performance targets such as revenue and net profit.
AN
NU
AL
RE
PO
RT
FY
20
17
DE
L M
ON
TE
PA
CIF
IC L
IMIT
ED
089088
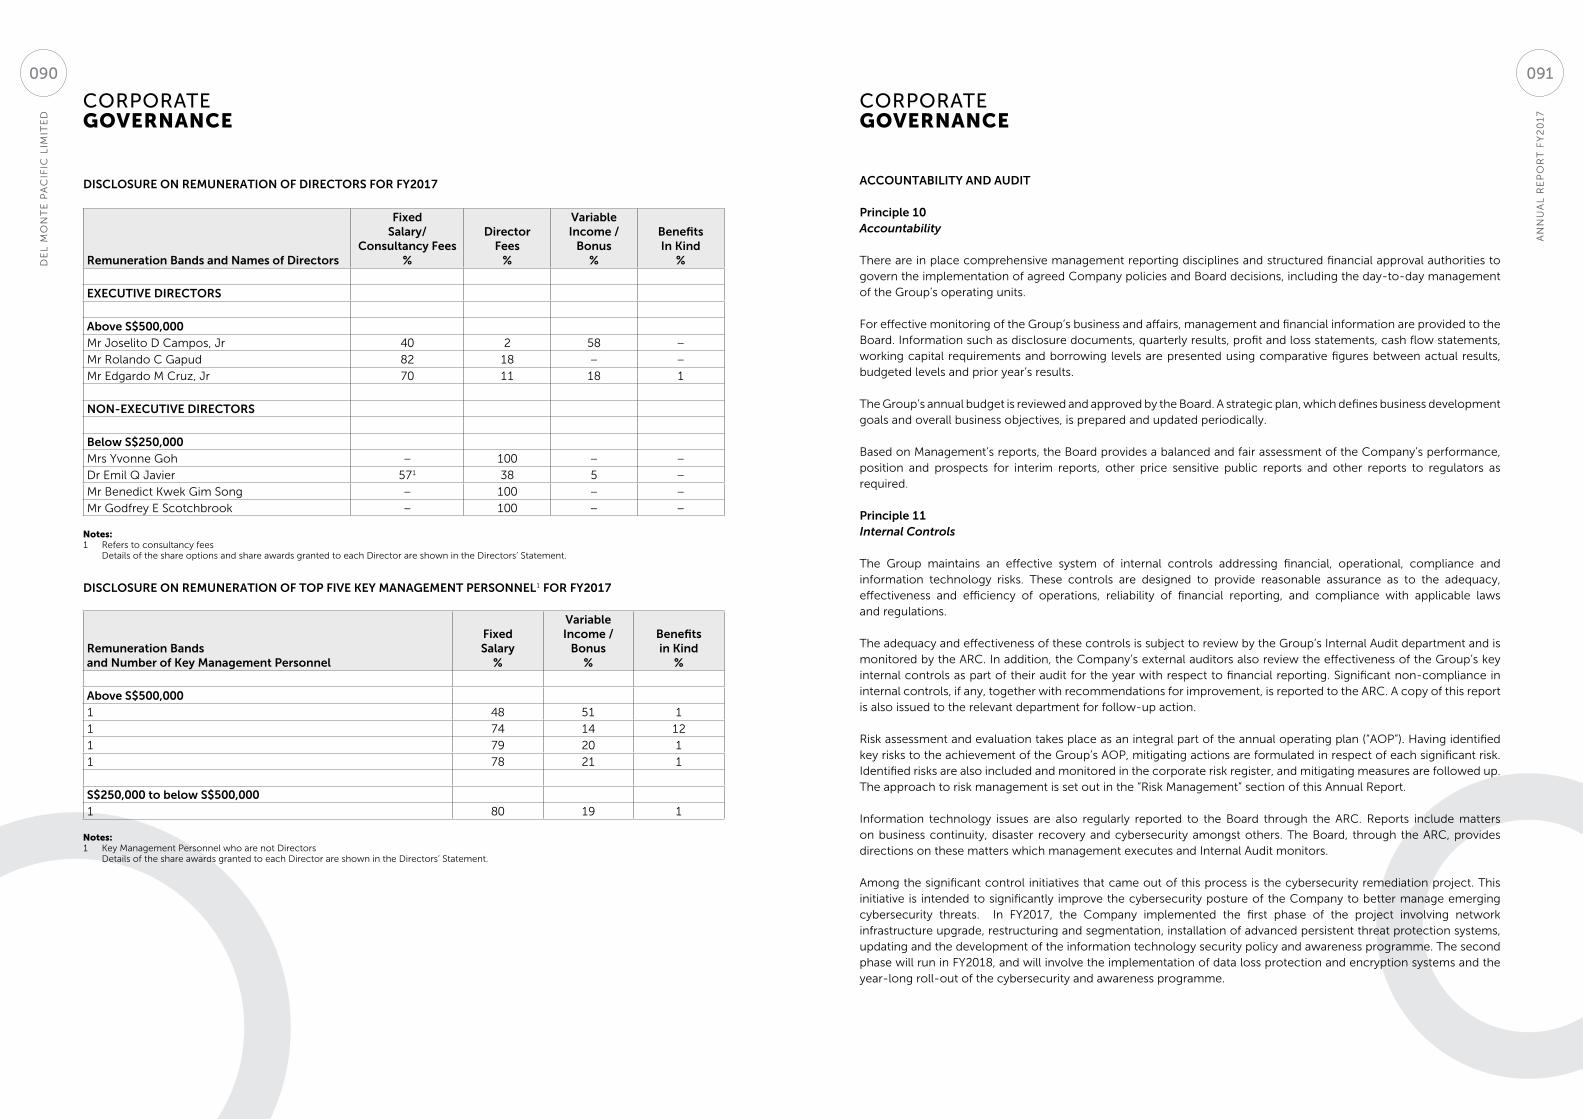
CORPORATE GOVERNANCE
CORPORATE GOVERNANCE
ACCOUNTABILITY AND AUDIT Principle 10Accountability
There are in place comprehensive management reporting disciplines and structured financial approval authorities to govern the implementation of agreed Company policies and Board decisions, including the day-to-day management of the Group’s operating units.
For effective monitoring of the Group’s business and affairs, management and financial information are provided to the Board. Information such as disclosure documents, quarterly results, profit and loss statements, cash flow statements, working capital requirements and borrowing levels are presented using comparative figures between actual results, budgeted levels and prior year’s results.
The Group’s annual budget is reviewed and approved by the Board. A strategic plan, which defines business development goals and overall business objectives, is prepared and updated periodically.
Based on Management’s reports, the Board provides a balanced and fair assessment of the Company’s performance, position and prospects for interim reports, other price sensitive public reports and other reports to regulators as required.
Principle 11Internal Controls
The Group maintains an effective system of internal controls addressing financial, operational, compliance and information technology risks. These controls are designed to provide reasonable assurance as to the adequacy, effectiveness and efficiency of operations, reliability of financial reporting, and compliance with applicable laws and regulations.
The adequacy and effectiveness of these controls is subject to review by the Group’s Internal Audit department and is monitored by the ARC. In addition, the Company’s external auditors also review the effectiveness of the Group’s key internal controls as part of their audit for the year with respect to financial reporting. Significant non-compliance in internal controls, if any, together with recommendations for improvement, is reported to the ARC. A copy of this report is also issued to the relevant department for follow-up action.
Risk assessment and evaluation takes place as an integral part of the annual operating plan (“AOP”). Having identified key risks to the achievement of the Group’s AOP, mitigating actions are formulated in respect of each significant risk. Identified risks are also included and monitored in the corporate risk register, and mitigating measures are followed up. The approach to risk management is set out in the “Risk Management” section of this Annual Report.
Information technology issues are also regularly reported to the Board through the ARC. Reports include matters on business continuity, disaster recovery and cybersecurity amongst others. The Board, through the ARC, provides directions on these matters which management executes and Internal Audit monitors.
Among the significant control initiatives that came out of this process is the cybersecurity remediation project. This initiative is intended to significantly improve the cybersecurity posture of the Company to better manage emerging cybersecurity threats. In FY2017, the Company implemented the first phase of the project involving network infrastructure upgrade, restructuring and segmentation, installation of advanced persistent threat protection systems, updating and the development of the information technology security policy and awareness programme. The second phase will run in FY2018, and will involve the implementation of data loss protection and encryption systems and the year-long roll-out of the cybersecurity and awareness programme.
DISCLOSURE ON REMUNERATION OF DIRECTORS FOR FY2017
Remuneration Bands and Names of Directors
Fixed Salary/
Consultancy Fees%
Director Fees
%
Variable Income /
Bonus %
Benefits In Kind
%
EXECUTIVE DIRECTORS
Above S$500,000Mr Joselito D Campos, Jr 40 2 58 –
Mr Rolando C Gapud 82 18 – –
Mr Edgardo M Cruz, Jr 70 11 18 1
NON-EXECUTIVE DIRECTORS
Below S$250,000Mrs Yvonne Goh – 100 – –
Dr Emil Q Javier 571 38 5 –
Mr Benedict Kwek Gim Song – 100 – –
Mr Godfrey E Scotchbrook – 100 – –
Notes:1 Refers to consultancy fees Details of the share options and share awards granted to each Director are shown in the Directors’ Statement.
DISCLOSURE ON REMUNERATION OF TOP FIVE KEY MANAGEMENT PERSONNEL1 FOR FY2017
Remuneration Bands and Number of Key Management Personnel
Fixed Salary
%
Variable Income /
Bonus %
Benefits in Kind
%
Above S$500,0001 48 51 1
1 74 14 12
1 79 20 1
1 78 21 1
S$250,000 to below S$500,0001 80 19 1
Notes:1 Key Management Personnel who are not Directors Details of the share awards granted to each Director are shown in the Directors’ Statement.
AN
NU
AL
RE
PO
RT
FY
20
17
DE
L M
ON
TE
PA
CIF
IC L
IMIT
ED
091090

CORPORATE GOVERNANCE
CORPORATE GOVERNANCE
In the year in review, the ARC had reviewed the audit and non-audit services of the external auditors and was satisfied that the auditors continue to be independent. A breakdown of the aggregate fees paid for audit and non-audit services is set out below:
Year ended 30 April
2017US$’000
Audit fees
– paid to the auditors of the Company 371
– paid to other auditors 1,553
Non-audit fees
– paid to the auditors of the Company –
– paid to other auditors 667
The ARC also reviews significant financial reporting issues to ensure the integrity of the Company’s financial statements and any announcements relating to the Company’s financial performance. The ARC further conducts periodic reviews of all interested persons transactions.
Except as disclosed, for FY2017, the Company did not enter into any other material contracts involving the interests of its CEO, Directors or controlling shareholders.
The ARC has the authority to investigate any matter within its TOR, has unrestricted access to Management and the Head of the Internal Audit department, and has full discretion to invite any Director or executive officer to attend its meetings.
The ARC monitors the adequacy and effectiveness of the Group’s internal controls system and internal audit function. It has set in place arrangements to ensure independent investigation of matters such as improprieties in financial reporting.
The Company has a suitable framework for whistleblowing that allows employees to freely communicate their concerns about illegal or unethical practices without fear of retaliation. A Whistleblower Policy has been in place since 2004 to promote the highest standards of business and personal ethics in the conduct of the Group’s affairs. As representatives of the Group, officers and employees must practise honesty and integrity, and strictly comply with all applicable laws, rules and regulations.
The Policy aims to deter and uncover corrupt, illegal, unethical, fraudulent or other conduct detrimental to the interest of the Group committed by officers and employees, as well as third parties, such as, but not limited to, suppliers and contractors. The Group encourages its officers and employees, suppliers and contractors to provide information that evidences unsafe, unlawful, unethical, fraudulent or wasteful practices. It does not disregard anonymous complaints.
This policy enables the Group to effectively deal with reports from whistleblowers in a manner that will protect the identity of the whistleblower and provide for the appropriate use of the information provided. It also establishes the policies for protecting whistleblowers against reprisal by any person internal or external to the Company, and provide for the appropriate infrastructure, including the appointment of a “Whistleblower Protection Officer”, a “Whistleblower Investigations Officer” and alternative means of reporting.
The Board, together with the Chairman of the ARC, had appointed the Group CFO as the Protection Officer, as well as the Head of Internal Audit as the Investigations Officer, to administer the Company’s Whistleblower programme. These are the contact details:
For legal compliance: +632 856 2557, +63 917 872 1472, or email [email protected]
For other matters: +6388 855 2090, +63 917 712 0311, or email [email protected]
Based on the internal controls established and maintained by the Group, work performed by the internal and external auditors, and reviews performed by Management and the ARC, the ARC and the Board are of the opinion that the Group’s internal controls, addressing financial, operational, compliance and information technology risks, and risk management systems were adequate and effective as at 30 April 2017.
The Board received written confirmation from the CEO and the Chief Financial Officer that (a) the financial records have been properly maintained and the financial statements give a true and fair view of the Company’s operations and finances; and (b) the Company’s risk management and internal control systems remain adequate and effective.
The Board will, on a continuing basis, endeavour to further enhance and improve the Company’s system of internal controls and risk management policies.
Principle 12Audit and Risk Committee
The Audit Committee was set up on 9 July 1999 and renamed Audit and Risk Committee (“ARC”) on 25 June 2015 as the Audit Committee had always served the function of overseeing the Company’s risk management framework and policies. The ARC comprises the following members who are all Independent Non-Executive Directors:
Mr Benedict Kwek Gim Song ARC ChairmanMr Godfrey E Scotchbrook MemberDr Emil Q Javier MemberMrs Yvonne Goh Member
The members of the ARC are highly qualified with two (2) members having the requisite financial management experience and expertise.
The ARC implements an evaluation process to assess its effectiveness as a whole. The evaluation process is undertaken as an internal exercise and involves ARC members completing a questionnaire covering areas relating to:
• Memberships and appointments• Conduct of ARC meetings• Trainings and resources available• Financial reporting processes• Financial and operational internal controls • Risk management systems• Internal and external audit processes• Whistle-blowing reporting processes• ARC’s relationship with the Board
The evaluation process takes into account the views of each ARC member and provides an opportunity for members to give constructive feedback on the workings of the ARC including procedures and processes adopted and if these may be improved upon.
The evaluation exercise is carried out by the ARC on an annual basis.
Led by the ARC Chairman, a summary of findings prepared based on responses from the completed questionnaires was discussed with feedback noted.
Under its TOR, the ARC reviews the scope and results of the Company’s annual audit and its cost effectiveness. The ARC also ensures the independence and objectivity of the external auditors. Likewise, it reviews the non-audit services provided by the Company’s external auditors.
AN
NU
AL
RE
PO
RT
FY
20
17
DE
L M
ON
TE
PA
CIF
IC L
IMIT
ED
093092
CORPORATE GOVERNANCE
CORPORATE GOVERNANCE
The Group ensures that shareholders have the opportunity to participate effectively in, and vote at, General Meetings (“GM”). Shareholders are informed of the rules and voting procedures that govern AGMs and GMs. The results of the votes taken during the AGM or GM are disclosed and made available to the public on the same day, and likewise uploaded on the Company’s website within five (5) days from the date of the meeting.
The Memorandum & Articles of Association of the Company do not allow corporations which provide nominee or custodial services to appoint more than two (2) proxies to vote. At present, only the Central Depository (Pte) Ltd is permitted to appoint more than two (2) proxies. The Company does, however, allow non-shareholders to attend the AGM or GM as observers.
The Company’s dividend payment policy for Ordinary Shares has been to distribute a minimum of 33% of full year profit. For fiscal year 2017, the Company declared a 50% payout of the year’s net profit. The dividend policy and terms including the declaration dates are provided in the Company’s website. The Company endeavours to pay dividends within 30 days after declaration.
Principle 15 Communication with Shareholders/Investor Relations
The Group is committed to engaging its stakeholders and providing easy and regular access to timely, effective, fair, pertinent and accurate information about the Company. The Group has an Investor Relations policy that clearly articulates and promotes this.
The Company’s Investor Relations is handled in-house. It has a dedicated Investor Relations team comprising of the Chief Corporate Officer and Investor Relations Manager who regularly engage and communicate with the investing community. Various IR and communication modes are employed by the Company not just to provide information but also to gather feedback and address questions and concerns. Insights and feedback gathered are taken and, where appropriate, acted upon.
The Company strengthens its relationship with the investing community and solicits their views through one-on-one meetings, participation in at least two (2) annual conferences, forums and road shows organised by stock broking and investing companies. Between May 2016 and April 2017, the Company participated in three (3) conferences organised by Goldman Sachs in Manila and by HSBC in Singapore, and met with 109 investors and brokers, including conference calls.
To maintain an open channel of communication, the Company also has an email alert system whereby emails on its developments and updates are sent out to investors. Such information is also announced to the public via the SGX-ST and PSE portals.
The Company has organised trips to its plantation and cannery, as well as trade checks, for the investing community, providing them with a first-hand appreciation and understanding of the Company’s operations and markets.
The Group provides descriptive and detailed disclosure whenever possible and avoids boilerplate disclosure, and immediately announces any material information on the Company or any of its subsidiaries or associated companies.
Material information, including the Company’s financial position, performance, ownership, strategies, activities and governance, are disclosed to all shareholders and the investing community equally via SGX-ST and the PSE portals, upholding the principle of no selective disclosure.
The Company observes a closed-window period of two (2) weeks prior to the announcement of its quarterly results and one (1) month prior to the announcement of its full year results. During this period, the Company does not meet nor communicate with the investing community to ensure no selective disclosure is made.
The ARC also makes recommendations to the Board on the appointment, re-appointment and removal of the external auditors, including the remuneration and terms of engagement of the external auditors. Once approved by the Board, this is then ratified by the shareholders at a general meeting. For any change in the external auditor, the Company provides the reason for the change in its disclosure to the regulators.
In appointing the external auditors for the Company and its subsidiaries, the Group has complied with Rule 712 of the SGX Listing Manual in having appointed a suitable auditing firm to meet its audit obligations, and one that is registered with the Accounting and Corporate Regulatory Authority of Singapore (“ACRA”). The Group has also complied with Rule 715 in having engaged the same auditing firm based in Singapore to audit its Singapore-incorporated subsidiaries and significant associated companies, and for having appointed suitable auditing firms for its significant foreign-incorporated subsidiaries and associated companies. The Group has also complied with the requirements of SRC Rule 68 in selecting an SEC-accredited auditing firm in the Philippines.
Under a new policy adopted, the ARC and the Board will undertake a review of external auditors once every five (5) years.
The ARC meets with the Group’s external auditors and with the Head of Internal Audit department without the presence of Management at least once a year.
During the year in review, the ARC held four (4) meetings.
Principle 13 Internal Audit
The Group’s Internal Audit department is staffed by qualified, experienced and trained personnel who are members of the Institute of Internal Auditors. Their duties are appropriately segregated. The Head of Internal Audit is Mr Gil Ramon S Veloso who reports functionally to the ARC and administratively to the CEO.
This department commands a respectable standing within the Company and is responsible for reviewing the risk management, internal control and governance processes to ensure these are adequate and effectively implemented.
It is the Group’s policy to support the Internal Audit department in complying with the International Professional Practices Framework set by The Institute of Internal Auditors. Training and development opportunities are provided for the Internal Audit department staff to upgrade their technical knowledge and skill sets to ensure they remain current and relevant.
The ARC approves the hiring, removal, evaluation and compensation of the Head of Internal Audit. The Internal Audit department has unfettered access to all company documents, records, properties and personnel, including access to the ARC.
The ARC annually reviews the adequacy and effectiveness of the internal audit function and it is of the view that the Company’s internal audit function is adequate.
Principle 14 Shareholder Rights
The Group treats all shareholders fairly and equitably, and recognises, protects and facilitates the exercise of shareholders’ rights. Moreover, the Group continually reviews and updates such governance arrangements.
Shareholders are informed of changes in the Company’s business that are likely to materially affect the value of the Company’s shares.
AN
NU
AL
RE
PO
RT
FY
20
17
DE
L M
ON
TE
PA
CIF
IC L
IMIT
ED
095094

CORPORATE GOVERNANCE
CORPORATE GOVERNANCE
As part of the Company’s ongoing effort to improve investor relations, it will continue to review and update governance arrangements with stakeholders. The Company also benchmarks against peers and industry best practices by having the relevant executives attend seminars and forums, joining IR organisations, and keeping abreast of the 2012 Code and similar guidelines and recommendations.
Principle 16 Conduct of Shareholder Meetings
The Company encourages shareholder participation at GMs and ensures that the venue for GMs is in a central location easily accessed by public transportation.
Shareholders have the opportunity to participate effectively and to vote in the AGMs/GMs either in person or by proxy.
Resolutions on each distinct issue are tabled separately at GMs.
At GMs, shareholders are given the opportunity to communicate their views and direct questions to Directors and Senior Management regarding the Company. The Chairman of the Board, the respective Chairman of the ARC, NCGC and RSOC, all other Directors, Senior Management including the CEO, and the external auditors were present at the most recent AGM to assist the Board in addressing shareholders’ questions.
For greater transparency, the Company had since 2013 instituted electronic poll voting and all resolutions are put to vote by electronic poll at its AGMs and GMs. The Company had also appointed independent scrutineers, Drewcorp Services Pte Ltd, to validate the votes at its most recent AGM. Announcement of the detailed results of the poll, including the number of votes cast for and against each resolution with the respective percentages, is made on the same day.
The AGM and GM Minutes which include the questions and answers during the meetings are available on the Company’s website after the meetings.
DEALINGS WITH SECURITIES
In 2013, the Company adopted and implemented a Securities Dealings Policy (which replaces and incorporates the guidelines set out in the Best Practices on Securities Transactions adopted by the Company in 2003) to govern dealings in the Company’s securities by Directors, Key Management Personnel and certain designated employees having access to price sensitive information. With this policy, these individuals are required to seek the approval of the Chairman or the Board before dealing in the Company’s shares. Directors are also required to report their dealings in the Company’s shares within two (2) business days from the date of transaction.
Directors, Key Management Personnel and certain designated employees had been advised that it is an offence to deal in the Company’s securities when they are in possession of unpublished material price-sensitive information. They are also discouraged from dealing in the Company’s securities on short-term considerations.
They are not allowed to deal in the Company’s securities during the period commencing two (2) weeks before the announcement of the Company’s financial results for each of the first three quarters of its financial year; and (1) one month before the announcement of the Company’s full-year financial results. For the year in review, these individuals had been compliant with the Securities Dealings Policy.
The Company announces its financial results on a quarterly basis within the prescribed timeframe and holds joint briefings or conference calls with the investing community. The briefings are held in an accessible central location. These briefings are also broadcast via webcast to global viewers, with a recording available for six (6) months. Key Management Personnel are present during the briefings. The Company uploads on its website the materials for media briefings and press conferences.
The Management, Discussion and Analysis (MDA) report, press release and presentation on the Company’s financial results are disseminated through the SGX-ST and PSE portals, the Company’s email alerts and website all on the same day.
In March 2017, the Company successfully revamped its corporate website (www.delmontepacific.com) with an international design to promote DMPL as a global food and beverage player, while also improving the structure and sitemap to allow easy navigation and access to key investor information. The website features the Company’s four key brands (Del Monte, S&W, Contadina and College Inn), the international business and DMPL’s various awards across many sectors. It also has links to other subsidiaries’ and brands’ websites, and includes social media links to DMPL’s subsidiaries’ Facebook, Instagram, Twitter, Pinterest and Linkedin pages. Most importantly, the website is mobile-responsive and accessible from tablets and smartphones.
The corporate website has a dedicated and comprehensive IR section that is user-friendly with easily downloadable and updated press releases, announcements, quarterly reports, presentations, annual reports and analyst reports. Announcements are uploaded as soon as they are released to the SGX-ST and PSE portals, including other disclosures and reports submitted to the Philippine SEC.
The following are also included in the IR site: IR policy, IR calendar, AGM and GM Minutes, dividend policy and payout details, share information and the Company’s top 20 shareholders. The following are also available on the website: Sustainability, Corporate Governance, bio-data of Directors and Senior Management, Memorandum and Articles of Association, Code of Business Ethics and other policies.
The IR email address ([email protected]) and telephone number (+65 6594 0980) are listed prominently on the IR homepage and in the annual report, making DMPL’s IR manager accessible. The IR team endeavours to reply to emails and requests within a day.
DMPL is guided by strong principles grounded on the guidelines of the 2012 Code, the SEC CG Code, the SGX Listing Manual, the GTI and the ACGS to strengthen stakeholder relations. DMPL’s IR is guided by the principles of trust; good corporate governance; transparency, openness and quality of disclosure; fairness; timeliness; pro-activeness and engagement; accessibility; employment of information technology; and continuous improvement.
The Company received the Best Investor Relations (Gold) Award in July 2017 and the Best Annual Report (Bronze) Award in July 2016 and July 2017 from the Singapore Corporate Awards (SCA) for companies with a market capitalisation of between S$300 million to less than S$1 billion.
Since the SCA began in 2006, DMPL has won 2 Gold awards for the Best Managed Board and Best Investor Relations. DMPL is one of only less than 10 companies from the 750 companies listed in Singapore to have achieved this.
DMPL has also received 4 distinct awards including that for the Best CFO and Best Annual Report and is one of only 14 companies to have achieved this.
DMPL has won a total of 12 awards for 8 consecutive years, since 2010.
The Company was ranked 32nd amongst 631 Singapore-listed companies or within thetop five percentile in the August 2016 Singapore Governance and Transparency Index (SGTI). DMPL also ranked 28th amongst 100 largest Singapore-listed companies in the April 2016 ASEAN Corporate Governance Scorecard.
AN
NU
AL
RE
PO
RT
FY
20
17
DE
L M
ON
TE
PA
CIF
IC L
IMIT
ED
097096

DIRECTORS’ STATEMENT
DIRECTORS’ STATEMENT
The Directors are pleased to present their report to the members together with the audited financial statements of Del Monte Pacific Limited (the “Company”) and its subsidiaries (collectively, the “Group”) comprising the statements of financial position, income statements, statements of comprehensive income, statements of changes in equity and the statements of cash flow of the Group and Company for the financial year ended 30 April 2017.
OPINION OF THE DIRECTORS In the opinion of the directors, (a) the financial statements of the Group are drawn up so as to give a true and fair view of the financial position of
the Group and of the Company as at 30 April 2017 and the financial performance, changes in equity and cash flows of the Group and of the Company for the year then ended in accordance with International Financial Reporting Standards; and
(b) at the date of this statement, there are reasonable grounds to believe that the Company will be able to pay its
debts as and when they fall due. The Group’s net current assets position is US$433.7 million as at 30 April 2017 and the Company expects dividend payment from its subsidiaries.
DIRECTORS
The Directors in office as at the date of this report are as follows:
Mr Rolando C Gapud (Executive Chairman)Mr Joselito D Campos, Jr (Managing Director)Mr Edgardo M Cruz, Jr (Executive Director)Mr Benedict Kwek Gim Song (Lead Independent Director)Mr Godfrey E ScotchbrookDr Emil Q Javier
(Independent Director)(Independent Director)
Mrs Yvonne Goh (Independent Director)
ARRANGEMENTS TO ENABLE DIRECTORS TO ACQUIRE SHARES OR DEBENTURES
Except as disclosed under the “Share Option and Incentive Plans” section of this report, neither at the end of, nor at any time during the financial year, was the Company a party to any arrangement whose objects are, or one of whose objects is, to enable the Directors of the Company to acquire benefits by means of the acquisition of shares in or debentures of the Company, its subsidiaries or any other body corporate.
DIRECTORS’ INTERESTS
According to the registers kept by the Company, particulars of interests of Directors who held office at the end of the financial year (including those held by their spouses and infant children) in shares and share options in the Company are as follows:
Directors’ Interest in Shares:
Direct interests Deemed interestsAs at
beginningof the year
1 May 2016/date of
appointment, if later
As at end of the year
30 April 2017As at
21 May 2017
As at beginning
of the year1 May 2016/
date of appointment,
if later
As at endof the year
30 April 2017As at
21 May 2017
The CompanyOrdinary shares of US$0.01 eachMr Rolando C Gapud 2,063,140 2,063,140 2,063,140 – – –Mr Joselito D Campos, Jr 7,621,466 7,621,466 7,621,466 1,303,256,961 1,303,256,961 1,303,256,961Mr Edgardo M Cruz, Jr 2,881,635 2,881,635 2,881,635 – – –Dr Emil Q Javier 534,851 534,851 534,851 – – –
Directors’ Interest in Options:Direct interests Deemed interests
As at beginning
of the year1 May 2016/
date of appointment,
if later
As at end of the year
30 April 2017 As at 21 May
2017
As at beginning
of the year1 May 2016/
date of appointment,
if later
As at endof the year
30 April 2017As at 21 May
2017
Options to subscribe for ordinary shares at S$0.627 per share between 07/03/2010 to 06/03/2018
Mr Benedict Kwek Gim Song 300,000 300,000 300,000 – – –Mr Godfrey E Scotchbrook 360,000 360,000 360,000 – – –
Options to subscribe for ordinary shares at S$0.578 per share between 02/07/2015 to 06/03/2018
Mr Benedict Kwek Gim Song 25,255 25,255 25,255 – – –Mr Godfrey E Scotchbrook 30,306 30,306 30,306 – – –
AN
NU
AL
RE
PO
RT
FY
20
17
DE
L M
ON
TE
PA
CIF
IC L
IMIT
ED
099098
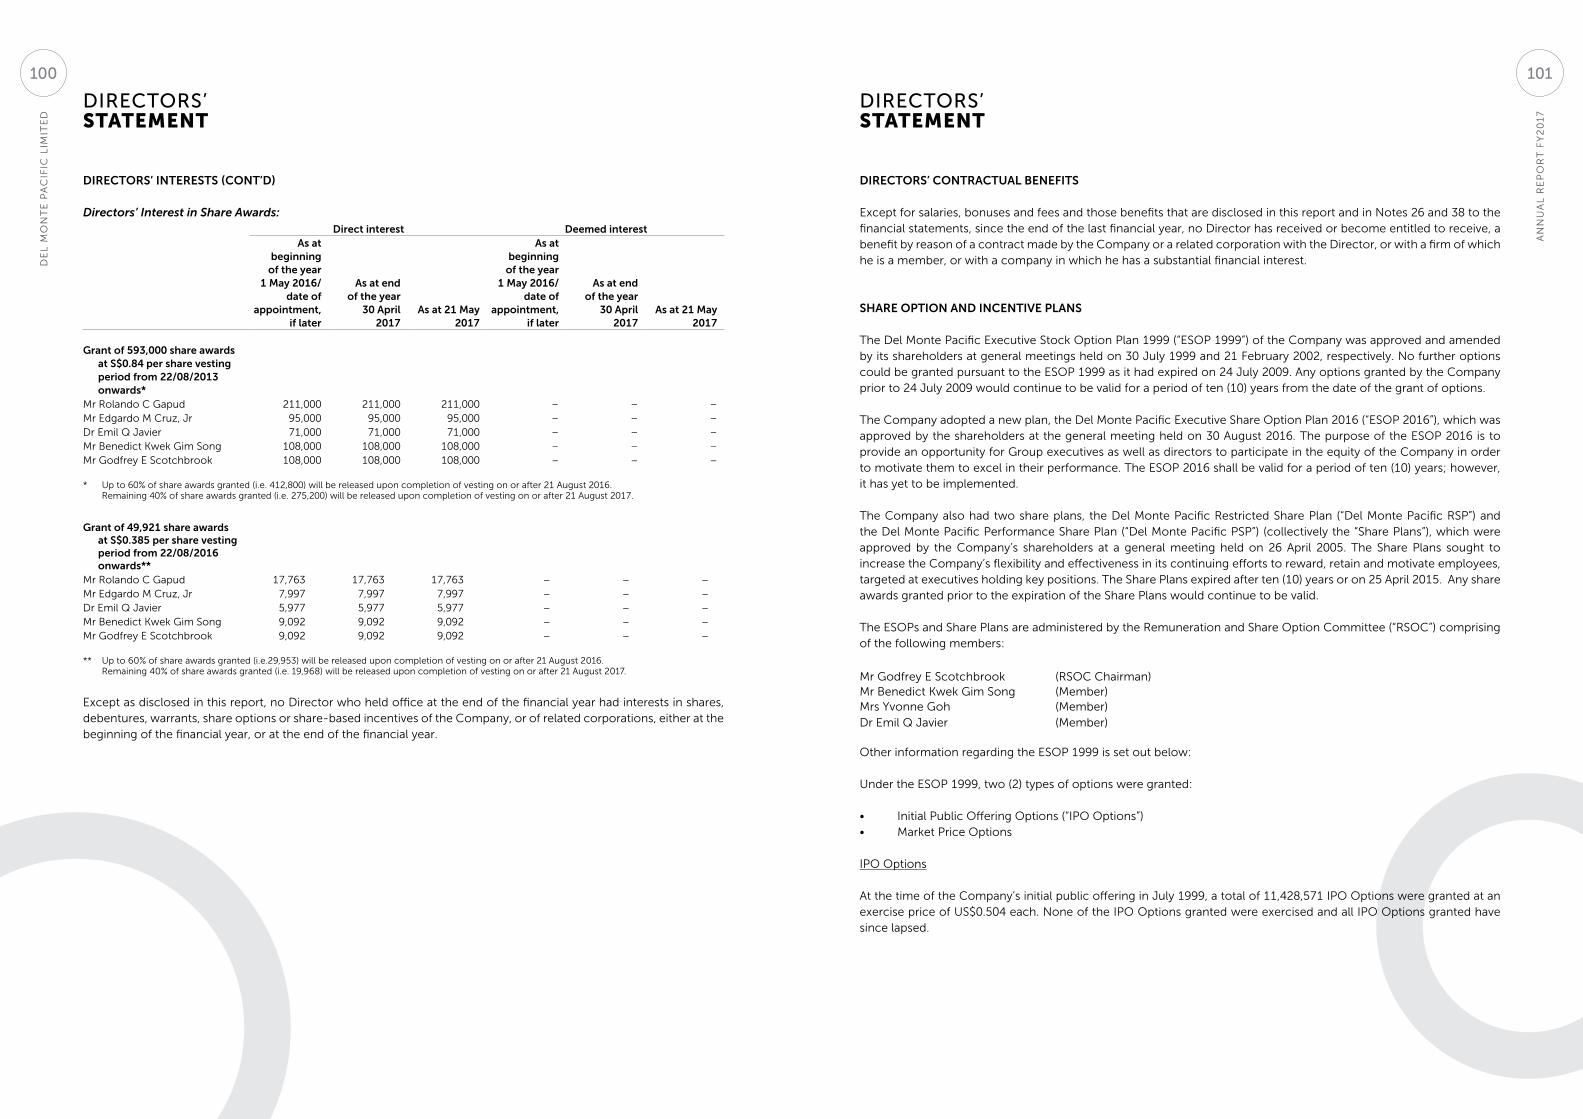
DIRECTORS’ STATEMENT
DIRECTORS’ STATEMENT
DIRECTORS’ INTERESTS (CONT’D)
Directors’ Interest in Share Awards:Direct interest Deemed interest
As at beginning
of the year1 May 2016/
date of appointment,
if later
As at end of the year
30 April2017
As at 21 May 2017
As at beginning
of the year1 May 2016/
date of appointment,
if later
As at end of the year
30 April2017
As at 21 May 2017
Grant of 593,000 share awards at S$0.84 per share vesting period from 22/08/2013 onwards*
Mr Rolando C Gapud 211,000 211,000 211,000 – – –Mr Edgardo M Cruz, Jr 95,000 95,000 95,000 – – –Dr Emil Q Javier 71,000 71,000 71,000 – – –Mr Benedict Kwek Gim Song 108,000 108,000 108,000 – – –Mr Godfrey E Scotchbrook 108,000 108,000 108,000 – – –
* Up to 60% of share awards granted (i.e. 412,800) will be released upon completion of vesting on or after 21 August 2016. Remaining 40% of share awards granted (i.e. 275,200) will be released upon completion of vesting on or after 21 August 2017.
Grant of 49,921 share awards at S$0.385 per share vesting period from 22/08/2016 onwards**
Mr Rolando C Gapud 17,763 17,763 17,763 – – –Mr Edgardo M Cruz, Jr 7,997 7,997 7,997 – – –Dr Emil Q Javier 5,977 5,977 5,977 – – –Mr Benedict Kwek Gim Song 9,092 9,092 9,092 – – –Mr Godfrey E Scotchbrook 9,092 9,092 9,092 – – –
** Up to 60% of share awards granted (i.e.29,953) will be released upon completion of vesting on or after 21 August 2016. Remaining 40% of share awards granted (i.e. 19,968) will be released upon completion of vesting on or after 21 August 2017.
Except as disclosed in this report, no Director who held office at the end of the financial year had interests in shares, debentures, warrants, share options or share-based incentives of the Company, or of related corporations, either at the beginning of the financial year, or at the end of the financial year.
DIRECTORS’ CONTRACTUAL BENEFITS
Except for salaries, bonuses and fees and those benefits that are disclosed in this report and in Notes 26 and 38 to the financial statements, since the end of the last financial year, no Director has received or become entitled to receive, a benefit by reason of a contract made by the Company or a related corporation with the Director, or with a firm of which he is a member, or with a company in which he has a substantial financial interest.
SHARE OPTION AND INCENTIVE PLANS
The Del Monte Pacific Executive Stock Option Plan 1999 (“ESOP 1999”) of the Company was approved and amended by its shareholders at general meetings held on 30 July 1999 and 21 February 2002, respectively. No further options could be granted pursuant to the ESOP 1999 as it had expired on 24 July 2009. Any options granted by the Company prior to 24 July 2009 would continue to be valid for a period of ten (10) years from the date of the grant of options.
The Company adopted a new plan, the Del Monte Pacific Executive Share Option Plan 2016 (“ESOP 2016”), which was approved by the shareholders at the general meeting held on 30 August 2016. The purpose of the ESOP 2016 is to provide an opportunity for Group executives as well as directors to participate in the equity of the Company in order to motivate them to excel in their performance. The ESOP 2016 shall be valid for a period of ten (10) years; however, it has yet to be implemented.
The Company also had two share plans, the Del Monte Pacific Restricted Share Plan (“Del Monte Pacific RSP”) and the Del Monte Pacific Performance Share Plan (“Del Monte Pacific PSP”) (collectively the “Share Plans”), which were approved by the Company’s shareholders at a general meeting held on 26 April 2005. The Share Plans sought to increase the Company’s flexibility and effectiveness in its continuing efforts to reward, retain and motivate employees, targeted at executives holding key positions. The Share Plans expired after ten (10) years or on 25 April 2015. Any share awards granted prior to the expiration of the Share Plans would continue to be valid.
The ESOPs and Share Plans are administered by the Remuneration and Share Option Committee (“RSOC”) comprising of the following members:
Mr Godfrey E Scotchbrook (RSOC Chairman)Mr Benedict Kwek Gim Song (Member)Mrs Yvonne GohDr Emil Q Javier
(Member)(Member)
Other information regarding the ESOP 1999 is set out below:
Under the ESOP 1999, two (2) types of options were granted:
• Initial Public Offering Options (“IPO Options”)• Market Price Options
IPO Options
At the time of the Company’s initial public offering in July 1999, a total of 11,428,571 IPO Options were granted at an exercise price of US$0.504 each. None of the IPO Options granted were exercised and all IPO Options granted have since lapsed.
AN
NU
AL
RE
PO
RT
FY
20
17
DE
L M
ON
TE
PA
CIF
IC L
IMIT
ED
101100

DIRECTORS’ STATEMENT
DIRECTORS’ STATEMENT
SHARE OPTION AND INCENTIVE PLANS (CONT’D)
Market Price Options
(a) A Market Price Option confers the right to subscribe for shares granted under the ESOP 1999 one year after the Listing Date.
(b) A Market Price Option may be granted only after the lapse of one year from the Listing Date.
(c) The period for the exercise of a Market Price Option commences after the second anniversary of the date of grant of the option and expires on the 10th anniversary of such date of grant.
(d) The exercise price of a Market Price Option may be set at a discount not exceeding 20% of the market price at the date of grant.
In March 2001, a total of 14,050,000 Market Price Options were granted at an exercise price of S$0.490 each. All of the 14,050,000 Market Price Options have either been exercised or have lapsed following the mandatory conditional cash offer by NutriAsia Pacific Ltd in January 2006.
On 7 March 2008, a total of 1,550,000 Market Price Options were granted at an exercise price of S$0.627 each being the average last done price of the Company’s share for the last three (3) market days preceding the date of grant. The options are valid for ten (10) years from 7 March 2008.
On 30 April 2013, the Company approved the grant of 150,000 Adjustment Options to three Non-Executive Directors of the Company, arising from the bonus issue of two (2) bonus shares for every ten (10) existing ordinary shares (“Bonus Issue”) carried out by the Company on 18 April 2013. The grant of the additional 150,000 options represented a 20% adjustment to the number of unexercised options previously granted by the Company. The rationale for the adjustment is to account for the dilutive effect arising from the Bonus Issue on the unexercised options.
On 1 July 2015, the Company approved the grant of 75,765 Adjustment Options to three Non-Executive Directors, arising from the rights issue of shares carried out by the Company on 10 March 2015. The grant of the additional 75,765 options was for the adjustment to account for the dilutive effect arising from the rights issue on the unexercised options.
Del Monte Pacific RSP
Other information regarding the Del Monte Pacific RSP is set out below:
(a) No minimum vesting periods are prescribed.
(b) The length of the vesting period(s) in respect of each award granted will be determined on a case-to-case basis by the RSOC.
(c) Delivery of shares upon vesting of the share awards may be by way of an issue of new shares and/or the transfer of existing shares (by way of purchase of existing shares).
On 7 March 2008, three (3) employees of related companies were granted an aggregate of 1,725,000 share awards at the market price of S$0.615 per share.
On 20 May 2008, 1,611,000 shares were awarded at the market price of S$0.680 per share to Mr Joselito D Campos, Jr, an associate of a controlling shareholder, approved by shareholders at the Annual General Meeting of the Company held on 28 April 2008.
On 12 May 2009, six (6) employees of related companies were granted an aggregate of 3,749,000 share awards at the market price of S$0.540 per share.
SHARE OPTION AND INCENTIVE PLANS (CONT’D)
Del Monte Pacific RSP (cont’d)
On 29 April 2011, 2,643,000 shares were awarded at the market price of S$0.485 per share to Mr Joselito D Campos, Jr, an associate of a controlling shareholder, approved by shareholders at the Annual General Meeting of the Company held on 29 April 2011.
On 21 November 2011, 67,700 shares were awarded to a Non-Executive Director of the Company at the market price of S$0.455 per share.
On 30 April 2013, the Company approved the grant of 486,880 share awards to Mr Joselito D Campos, Jr and five (5) employees of related companies at a market price of S$0.81 per share, arising from the bonus issue of two (2) bonus shares for every ten (10) existing ordinary shares (“Bonus Issue”) carried out by the Company on 18 April 2013. The grant of the additional 486,880 share awards represented a 20% adjustment to the number of unvested share awards previously granted by the Company. The rationale for the adjustment is to account for the dilutive effect arising from the Bonus Issue on the unexercised options.
On 22 August 2013, 688,000 shares were awarded at the market price of S$0.84 per share to Messrs Rolando C Gapud, Edgardo M Cruz, Jr, Emil Q Javier, Benedict Kwek Gim Song, Patrick L Go and Godfrey E Scotchbrook.
On 1 July 2015, 57,918 shares were awarded at the market price of S$0.385 per share to six (6) Directors, arising from the rights issue of shares carried out by the Company on 10 March 2015. The grant of the additional 57,918 share awards was for the adjustment to account for the dilutive effect arising from the rights issue on the unvested share awards previously granted by the Company.
As at the date of this report, no share awards had been granted to Directors or employees of related companies.
Del Monte Pacific PSP
Other information regarding the Del Monte Pacific PSP is set out below:
(a) Vesting periods are not applicable.
(b) Shares awarded are released at the end of the performance period (typically, at the conclusion of a financial year end) once the RSOC is satisfied that the prescribed performance target(s) have been achieved by awardees.
(c) Delivery of share awards may be by way of an issue of new shares and/or the transfer of existing shares (by way of purchase of existing shares).
As at the date of this report, no share awards have been granted pursuant to the Del Monte Pacific PSP.
AN
NU
AL
RE
PO
RT
FY
20
17
DE
L M
ON
TE
PA
CIF
IC L
IMIT
ED
103102
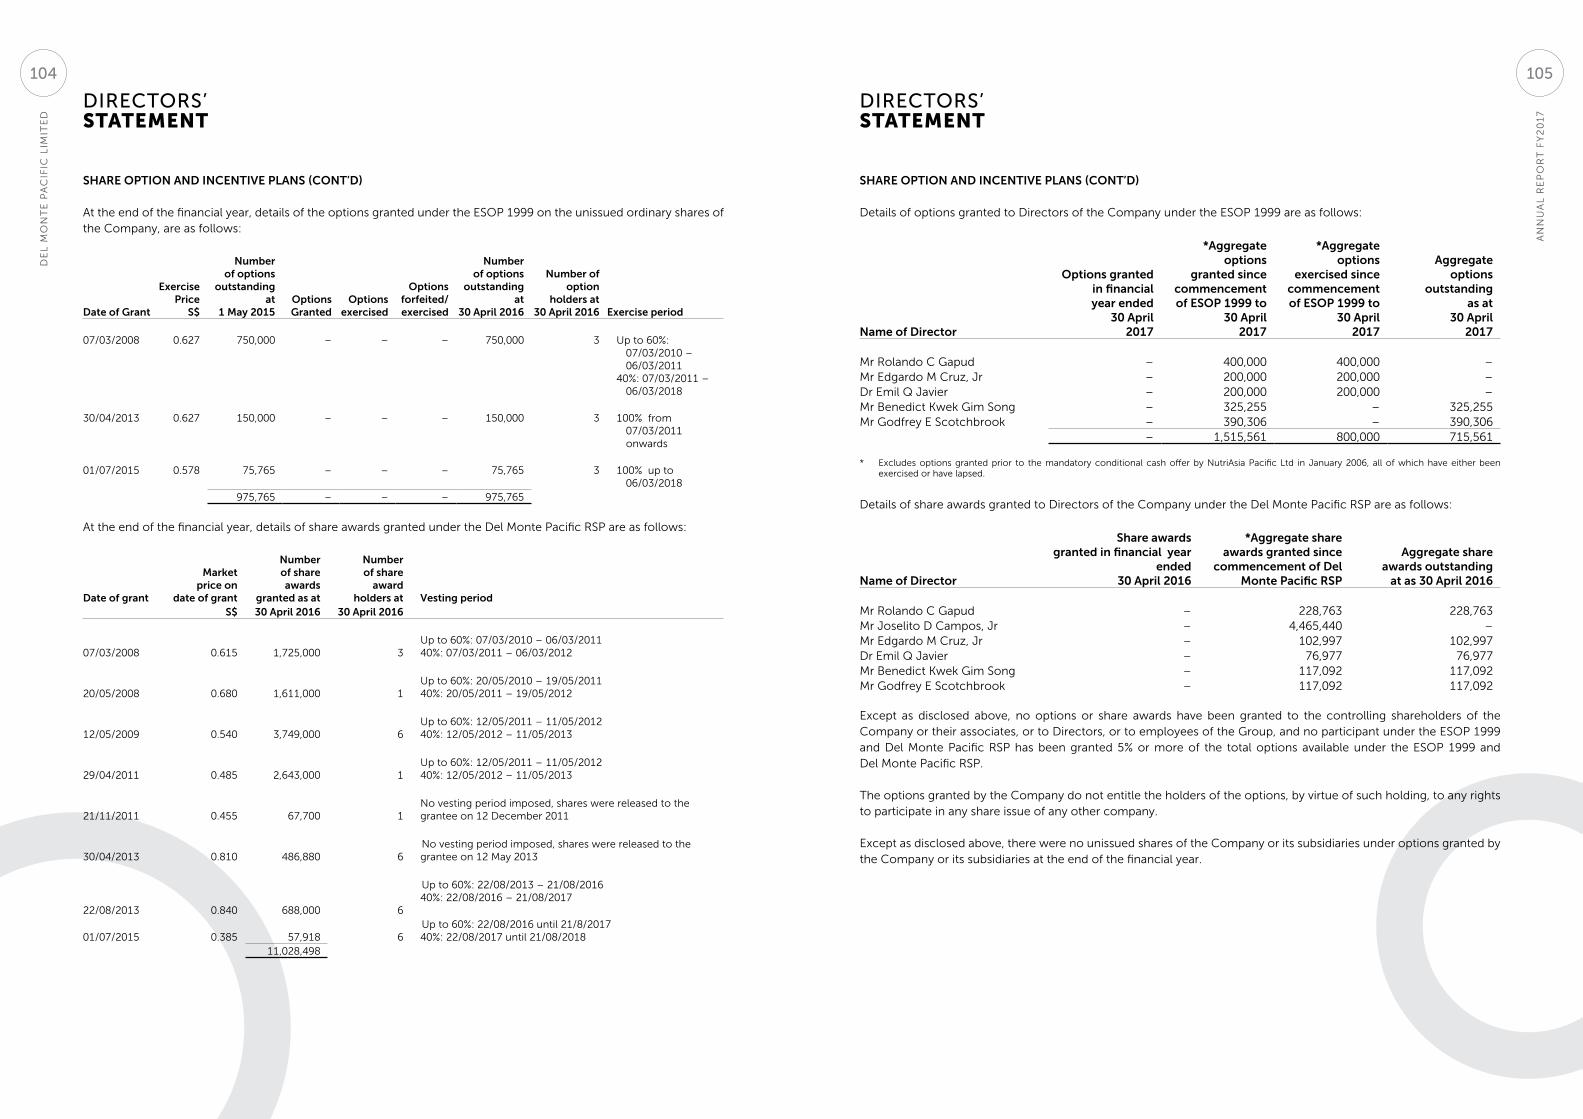
DIRECTORS’ STATEMENT
DIRECTORS’ STATEMENT
SHARE OPTION AND INCENTIVE PLANS (CONT’D)
At the end of the financial year, details of the options granted under the ESOP 1999 on the unissued ordinary shares of the Company, are as follows:
Date of Grant
Exercise Price
S$
Number of options
outstanding at
1 May 2015OptionsGranted
Optionsexercised
Options forfeited/ exercised
Number of options
outstanding at
30 April 2016
Number of option
holders at 30 April 2016 Exercise period
07/03/2008 0.627 750,000 – – – 750,000 3 Up to 60%: 07/03/2010 – 06/03/2011
40%: 07/03/2011 – 06/03/2018
30/04/2013 0.627 150,000 – – – 150,000 3 100% from 07/03/2011 onwards
01/07/2015 0.578 75,765 – – – 75,765 3 100% up to 06/03/2018
975,765 – – – 975,765
At the end of the financial year, details of share awards granted under the Del Monte Pacific RSP are as follows:
Date of grant
Market price on
date of grant
Number of share awards
granted as at
Number of share
award holders at Vesting period
S$ 30 April 2016 30 April 2016
07/03/2008 0.615 1,725,000 3Up to 60%: 07/03/2010 – 06/03/201140%: 07/03/2011 – 06/03/2012
20/05/2008 0.680 1,611,000 1Up to 60%: 20/05/2010 – 19/05/201140%: 20/05/2011 – 19/05/2012
12/05/2009 0.540 3,749,000 6Up to 60%: 12/05/2011 – 11/05/201240%: 12/05/2012 – 11/05/2013
29/04/2011 0.485 2,643,000 1Up to 60%: 12/05/2011 – 11/05/201240%: 12/05/2012 – 11/05/2013
21/11/2011 0.455 67,700 1No vesting period imposed, shares were released to thegrantee on 12 December 2011
30/04/2013 0.810 486,880 6No vesting period imposed, shares were released to thegrantee on 12 May 2013
22/08/2013 0.840 688,000 6
Up to 60%: 22/08/2013 – 21/08/201640%: 22/08/2016 – 21/08/2017
01/07/2015 0.385 57,918 6Up to 60%: 22/08/2016 until 21/8/201740%: 22/08/2017 until 21/08/2018
11,028,498
SHARE OPTION AND INCENTIVE PLANS (CONT’D)
Details of options granted to Directors of the Company under the ESOP 1999 are as follows:
Name of Director
Options granted in financial
year ended 30 April
2017
*Aggregate options
granted since commencement of ESOP 1999 to
30 April 2017
*Aggregate options
exercised since commencement of ESOP 1999 to
30 April 2017
Aggregate options
outstanding as at
30 April 2017
Mr Rolando C Gapud – 400,000 400,000 –Mr Edgardo M Cruz, Jr – 200,000 200,000 –Dr Emil Q Javier – 200,000 200,000 –Mr Benedict Kwek Gim Song – 325,255 – 325,255Mr Godfrey E Scotchbrook – 390,306 – 390,306
– 1,515,561 800,000 715,561
* Excludes options granted prior to the mandatory conditional cash offer by NutriAsia Pacific Ltd in January 2006, all of which have either been exercised or have lapsed.
Details of share awards granted to Directors of the Company under the Del Monte Pacific RSP are as follows:
Name of Director
Share awards granted in financial year
ended30 April 2016
*Aggregate share awards granted since
commencement of Del Monte Pacific RSP
Aggregate share awards outstanding
at as 30 April 2016
Mr Rolando C Gapud – 228,763 228,763Mr Joselito D Campos, Jr – 4,465,440 –Mr Edgardo M Cruz, Jr – 102,997 102,997Dr Emil Q Javier – 76,977 76,977Mr Benedict Kwek Gim Song – 117,092 117,092Mr Godfrey E Scotchbrook – 117,092 117,092
Except as disclosed above, no options or share awards have been granted to the controlling shareholders of the Company or their associates, or to Directors, or to employees of the Group, and no participant under the ESOP 1999 and Del Monte Pacific RSP has been granted 5% or more of the total options available under the ESOP 1999 and Del Monte Pacific RSP.
The options granted by the Company do not entitle the holders of the options, by virtue of such holding, to any rights to participate in any share issue of any other company.
Except as disclosed above, there were no unissued shares of the Company or its subsidiaries under options granted by the Company or its subsidiaries at the end of the financial year.
AN
NU
AL
RE
PO
RT
FY
20
17
DE
L M
ON
TE
PA
CIF
IC L
IMIT
ED
105104
DIRECTORS’ STATEMENT
DIRECTORS’ STATEMENT
AUDIT AND RISK COMMITTEE
The Audit Committee was renamed the Audit and Risk Committee (“ARC”) on 25 June 2015 as the Audit Committee had always served the function of overseeing the Company’s risk management framework and policies. For the financial year ended 30 April 2017, the ARC comprised the following members:
Mr Benedict Kwek Gim Song (ARC Chairman)Mr Edgardo M Cruz, Jr (Member)Mr Rolando C Gapud (Member)Mr Godfrey E Scotchbrook (Member)Dr Emil Q Javier (Member)Mrs Yvonne Goh (Member)
From 1 May 2016 to 30 April 2017, the ARC had held four (4) meetings. The ARC reviews the effectiveness of the systems of internal controls in the Group, its accounting policies, annual financial statements and quarterly reports, the adequacy and effectiveness of the internal audit function, and the findings of both the external and internal auditors. The ARC may also examine whatever aspects it deems appropriate regarding the Group’s financial affairs, its internal and external audits and its exposure to risks of a regulatory or legal nature. Furthermore, all interested person transactions are subject to regular periodic reviews by the ARC to ensure that they are carried out on arm’s length commercial terms consistent with the Group’s usual business practices and policies, and are not prejudicial to the Company’s minority shareholders.
In performing its functions, the ARC reviewed the overall scope of both internal and external audits and the assistance given by the Company’s officers to the auditors. The ARC met with the internal and external auditors to discuss the results of their respective examinations and their evaluation of the Company and the Group’s system of internal controls. The ARC also reviewed the financial statements of the Company and the consolidated financial statements of the Group for the financial year ended 30 April 2017, as well as the external auditors’ report thereon.
The ARC has full access to and cooperation of Management and the internal auditors. It also has full discretion to invite any Director or executive officer to attend its meetings. The Chief Financial Officer attends all meetings of the ARC. The auditors have unrestricted access to the ARC. The ARC has reasonable resources to enable it to discharge its functions effectively.
INTERNAL CONTROLS
Based on the internal controls established and maintained by the Group, work performed by the internal and external auditors, and reviews performed by management, various Board Committees and the Board, the ARC and the Board are of the opinion that the Group’s internal controls, addressing financial, operational, compliance and information technology risks, were adequate and effective as at 30 April 2017.
AUDITORS
The auditors, Ernst & Young LLP, have indicated their willingness to accept re-appointment.
On behalf of the Board of Directors,
Mr Rolando C GapudExecutive Chairman
Mr Joselito D Campos, JrExecutive Director
13 July 2017
AN
NU
AL
RE
PO
RT
FY
20
17
DE
L M
ON
TE
PA
CIF
IC L
IMIT
ED
107106
INDEPENDENT AUDITORS’ REPORTto the members of Del Monte Pacific Limited
INDEPENDENT AUDITORS’ REPORTto the members of Del Monte Pacific Limited
REPORT ON THE AUDIT OF THE FINANCIAL STATEMENTS
Opinion
We have audited the financial statements of Del Monte Pacific Limited (the “Company”) and its subsidiaries (collectively, the “Group”), which comprise the statements of financial position of the Group and the Company as at 30 April 2017, the income statements, statements of comprehensive income, statements of changes in equity and statements of cash flows of the Group and the Company for the year then ended, and notes to the financial statements, including a summary of significant accounting policies.
In our opinion, the accompanying financial statements of the Group and the Company present fairly, in all material respects, the financial position of the Group and the Company as at 30 April 2017, and their financial performance and their cash flows for the year then ended in accordance with International Financial Reporting Standards (IFRSs).
Basis for Opinion
We conducted our audit in accordance with International Standards on Auditing (ISAs). Our responsibilities under those standards are further described in the Auditor’s Responsibilities for the Audit of the Financial Statements section of our report. We are independent of the Group in accordance with the Accounting and Corporate Regulatory Authority (“ACRA”) Code of Professional Conduct and Ethics for Public Accountants and Accounting Entities (“ACRA Code”) and the International Ethics Standards Board for Accountants’ Code of Ethics for Professional Accountants (IESBA Code) together with the ethical requirements that are relevant to our audit of the financial statements in Singapore, and we have fulfilled our other ethical responsibilities in accordance with these requirements, ACRA Code and IESBA Code. We believe that the audit evidence we have obtained is sufficient and appropriate to provide a basis for our opinion.
Key Audit Matters
Key audit matters are those matters that, in our professional judgement, were of most significance in our audit of the financial statements of the current period. These matters were addressed in the context of our audit of the financial statements as a whole, and in forming our opinion thereon, and we do not provide a separate opinion on these matters. For each matter below, our description of how our audit addressed the matter is provided in that context.
We have fulfilled the responsibilities described in the Auditor’s Responsibilities for the Audit of the Financial Statements section of our report, including in relation to these matters. Accordingly, our audit included the performance of procedures designed to respond to our assessment of the risks of material misstatement of the financial statements. The results of our audit procedures, including the procedures performed to address the matters below, provide the basis for our audit opinion on the accompanying financial statements.
Key Audit Matters (cont’d)
Key audit matter How our audit addressed the matter
Biological assets(a) Adoption of Amendments to IAS 16, Property, Plant
and Equipment and IAS 41, Agriculture: Bearer Plants
On 1 January 2016, the amendments to IAS 16, Property, Plant and Equipment and IAS 41, Agriculture: Bearer Plants became effective. Under the amendments, biological assets that meet the definition of bearer plants will no longer be within the scope of IAS 41. Instead, such bearer plants will be within the scope of IAS 16 and have to be measured at accumulated cost before maturity and using either the cost model or revaluation model after maturity. Produce that grows on bearer plants remained within the scope of IAS 41 and continues to be measured at fair value less costs to sell.
We considered this to be a key audit matter as the adoption of these amendments resulted in material adjustments made to certain account balances, including the restatement of comparatives.
In previous financial years, the Group has accounted for bearer plants at cost and reduced by the estimated cost of harvested produce while their agricultural produce at fair value less estimated point-of-sale costs at the point of harvest. Beginning 1 May 2016, the Group adopted these amendments and this resulted in a change in the Group’s accounting policy for biological assets as disclosed in Note 3. This change resulted in the presentation of biological assets of US$85.5 million, net of accumulated depreciation, as bearer plants and an increase in the carrying value of biological assets as of 30 April 2017 by US$44.3 million, representing the fair value of the agricultural produce prior to harvest. In addition, the Group has also restated the comparative amounts as disclosed in Note 3.
Refer to Notes 3, 6 and 12 to the financial statements.
We obtained an understanding of management’s process for separating bearer plants from the agricultural produce.
With respect to bearer plants, we obtained an understanding of management’s identification of the capitalizable costs and the method of depreciation and compared sample capitalized costs of bearer plants to supporting documents.
For the agricultural produce prior to harvest, we obtained an understanding of management’s fair value measurement methodology, the timing of the recognition of the agricultural produce prior to harvest considering the life cycle of the bearer plant, and evaluated the significant fair value assumptions which include future selling prices, gross margin, estimated tonnage of harvests and future growing costs used in the valuation by comparing them against available market and historical information. We involved our internal specialist in evaluating the methodology used in calculating the fair value.
We assessed whether the adjustments to the respective account balances have been made in accordance with the requirements set out in the amendments.
AN
NU
AL
RE
PO
RT
FY
20
17
DE
L M
ON
TE
PA
CIF
IC L
IMIT
ED
109108
INDEPENDENT AUDITORS’ REPORTto the members of Del Monte Pacific Limited
INDEPENDENT AUDITORS’ REPORTto the members of Del Monte Pacific Limited
Key Audit Matters (cont’d)
Key audit matter How our audit addressed the matter
Biological assets(b) Fair value of biological assets
The gain on changes in the fair value of produce prior to harvest and harvested produce amounted to US$45.6 million for the year ended 30 April 2017.
The valuation of biological assets was significant to our audit because the estimation process is complex, involves significant management estimate, and is based on assumptions that can be affected by natural phenomena. The key assumptions for the fair value of harvested produce include selling prices. The key assumptions for the fair value of produce prior to harvest include future selling prices, gross margin, estimated tonnage of harvests and future growing costs.
Refer to Note 12 to the financial statements.
We tested the key assumptions, which include selling prices and gross margin for harvested produce; and future selling prices, gross margin, estimated tonnage of harvests and future growing costs for produce prior to harvest, by comparing them to external data such as selling prices in the principal market and historical information. We also assessed the methodology used in estimating the fair value. Given the complexity of the valuation, our internal specialists were involved in performing some of these procedures. We also assessed the adequacy of the related disclosures on the assumptions underlying the measurement of these biological assets.
Recoverability of goodwill and indefinite life trademarks (a) Goodwill
As at 30 April 2017, goodwill is carried at US$203.4 million, which represents 13% of the total non-current assets. The annual impairment test is significant to our audit because the valuation process is complex, involves significant management judgement, and is based on assumptions (market multiples) that can be affected by future market and economic conditions.
The Group allocated goodwill to a Cash Generating Unit (CGU), Del Monte Foods, Inc. and its subsidiaries. The Group used the fair value less costs of disposal to estimate the recoverable value of the CGU.
Refer to Note 9 to the financial statements.
We obtained an understanding of the Group’s impairment assessment process and the related controls. We tested the key assumptions, which include market multiples, by comparing them to external data such as EBITDA and revenue levels of peer companies.
Given the complexity of the valuation process, our internal valuation specialist was involved in performing some of these procedures.
We also focused on the adequacy of the Group’s disclosures in Note 9 to the financial statements, about those assumptions to which the outcome of the impairment test was most sensitive, that is, those that have the most significant effect on the determination of the recoverable amount of goodwill.
Key Audit Matters (cont’d)
Key audit matter How our audit addressed the matter
Recoverability of goodwill and indefinite life trademarks (b) Indefinite life trademarks
As at 30 April 2017, indefinite life trademarks were carried at U$408.0 million which comprises of the following trademarks: “Del Monte” in the United States of America (USA), Philippines and India, “College Inn” in the USA, “S&W” in Asia, and “Todays” in the Philippines. The annual impairment tests are significant to our audit because the valuation process is complex, involves significant management judgment and estimates based on assumptions that can be affected by future market and economic conditions as well as trademark and royalty rates in the market.
The Group used the Royalty Savings Approach in valuing its intangible assets in the USA and Philippines. This approach relies on the forecasted revenue for the related brand or trademark and applies the royalty rates in the market. For the other trademarks in Asia, the Group used the discounted cash flow of the related CGUs. This method relies on forecasted financial results which uses significant assumptions such as revenue growth rates, EBITDA and long-term margins, terminal value growth rate and discount rate.
Refer to Note 9 to the financial statements.
We assessed the reasonableness of the forecasted revenue and royalty rates used to derive the recoverable value of the brand and trademarks by comparing against available market and historical information.
We also evaluated the significant assumptions in the financial forecast of the CGUs, which include revenue growth rates, EBITDA and long-term margins, terminal value growth rate and discount rate, by comparing them against available market information, historical data and management plans.
Given the complexity of the valuation process, our internal specialist was involved in performing some of these procedures.
AN
NU
AL
RE
PO
RT
FY
20
17
DE
L M
ON
TE
PA
CIF
IC L
IMIT
ED
111110

INDEPENDENT AUDITORS’ REPORTto the members of Del Monte Pacific Limited
INDEPENDENT AUDITORS’ REPORTto the members of Del Monte Pacific Limited
Key Audit Matters (cont’d)
Key audit matter How our audit addressed the matter
Recoverability of deferred tax assets
As at 30 April 2017, the Group has recognized net deferred tax assets of US$92.8 million, which includes deferred tax assets recognized by Del Monte Foods, Inc., a subsidiary in the United States of America (USA), amounting to US$91.1 million.
The recoverability of the deferred tax asset was significant to our audit because it involves significant management judgment and is based on assumptions that are affected by future market or economic conditions. The key assumptions in the taxable income forecast include revenue and EBITDA growth rates.
Refer to Note 10 to the financial statements.
We assessed the recognition of deferred tax assets by comparing it to the taxable income forecast. We tested the key assumptions in the taxable income forecast such as revenue and EBITDA growth rates against available market information, management plans, historical performance and industry/market outlook. We compared the consistency of management's taxable income forecasts with those included in the budget approved by the Board of Directors.
We assessed the robustness of management’s forecasting process by comparing the actual results of the subsidiary against the forecast used in prior year.
We involved our internal specialist in reviewing the temporary differences.
Valuation of defined benefit liability
The Group has defined benefit plans in the Philippines and the USA, giving rise to defined benefit liability of US$76.9 million and pension asset amounting to US$5.5 million as at 30 April 2017 which are measured using actuarial valuation methods.
We considered this to be a key audit matter because of the magnitude of the amounts, management's judgement in the use of assumptions such as future salary increases, discount rates, mortality rates and health care trends and technical expertise required to determine these amounts.
Refer to Note 22 to the financial statements.
Our procedures included, among others, involving our internal specialist to assist us in reviewing the valuation methodology and the actuarial and demographic assumptions used by management to value the Group's various pension obligations. We evaluated the competence, capabilities and objectivity of management’s specialist.
We evaluated the key actuarial assumptions such as future salary increases, discount rates, mortality rates and health care trends by comparing them to market data and historical information.
We tested the employees’ payroll data on a sample basis, and reviewed the reconciliation of the membership census data used in the actuarial models to the payroll data of the Group.
OTHER INFORMATION
Management is responsible for the other information. The other information comprises the Group’s 2017 Annual Report, but does not include the financial statements and our auditor’s report thereon. The Group’s 2017 Annual Report is expected to be made available to us after the date of this auditor’s report.
Our opinion on the financial statements does not cover the other information and we will not express any form of assurance conclusion thereon.
In connection with our audit of the financial statements, our responsibility is to read the other information and, in doing so, consider whether the other information is materially inconsistent with the financial statements or our knowledge obtained in the audit or otherwise appears to be materially misstated.
When we read the Group’s 2017 Annual Report, if we conclude that there is a material misstatement therein, we are required to communicate the matter to the directors and take appropriate actions in accordance with ISAs.
RESPONSIBILITIES OF MANAGEMENT AND DIRECTORS FOR THE FINANCIAL STATEMENTS
Management is responsible for the preparation and fair presentation of the financial statements in accordance with IFRSs, and for such internal control as management determines is necessary to enable the preparation of financial statements that are free from material misstatement, whether due to fraud or error.
In preparing the financial statements, management is responsible for assessing the Group’s and Company’s ability to continue as a going concern, disclosing, as applicable, matters related to going concern and using the going concern basis of accounting unless management either intends to liquidate the Group or to cease operations, or has no realistic alternative but to do so.
The directors’ responsibilities include overseeing the Group’s financial reporting process.
AUDITOR’S RESPONSIBILITIES FOR THE AUDIT OF THE FINANCIAL STATEMENTS
Our objectives are to obtain reasonable assurance about whether the financial statements as a whole are free from material misstatement, whether due to fraud or error, and to issue an auditor’s report that includes our opinion. Reasonable assurance is a high level of assurance, but is not a guarantee that an audit conducted in accordance with ISAs will always detect a material misstatement when it exists. Misstatements can arise from fraud or error and are considered material if, individually or in the aggregate, they could reasonably be expected to influence the economic decisions of users taken on the basis of these financial statements.
As part of an audit in accordance with ISAs, we exercise professional judgement and maintain professional skepticism throughout the audit. We also:
• Identify and assess the risks of material misstatement of the financial statements, whether due to fraud or error, design and perform audit procedures responsive to those risks, and obtain audit evidence that is sufficient and appropriate to provide a basis for our opinion. The risk of not detecting a material misstatement resulting from fraud is higher than for one resulting from error, as fraud may involve collusion, forgery, intentional omissions, misrepresentations, or the override of internal control.
• Obtain an understanding of internal control relevant to the audit in order to design audit procedures that are appropriate in the circumstances, but not for the purpose of expressing an opinion on the effectiveness of the Group’s internal control.
AN
NU
AL
RE
PO
RT
FY
20
17
DE
L M
ON
TE
PA
CIF
IC L
IMIT
ED
113112
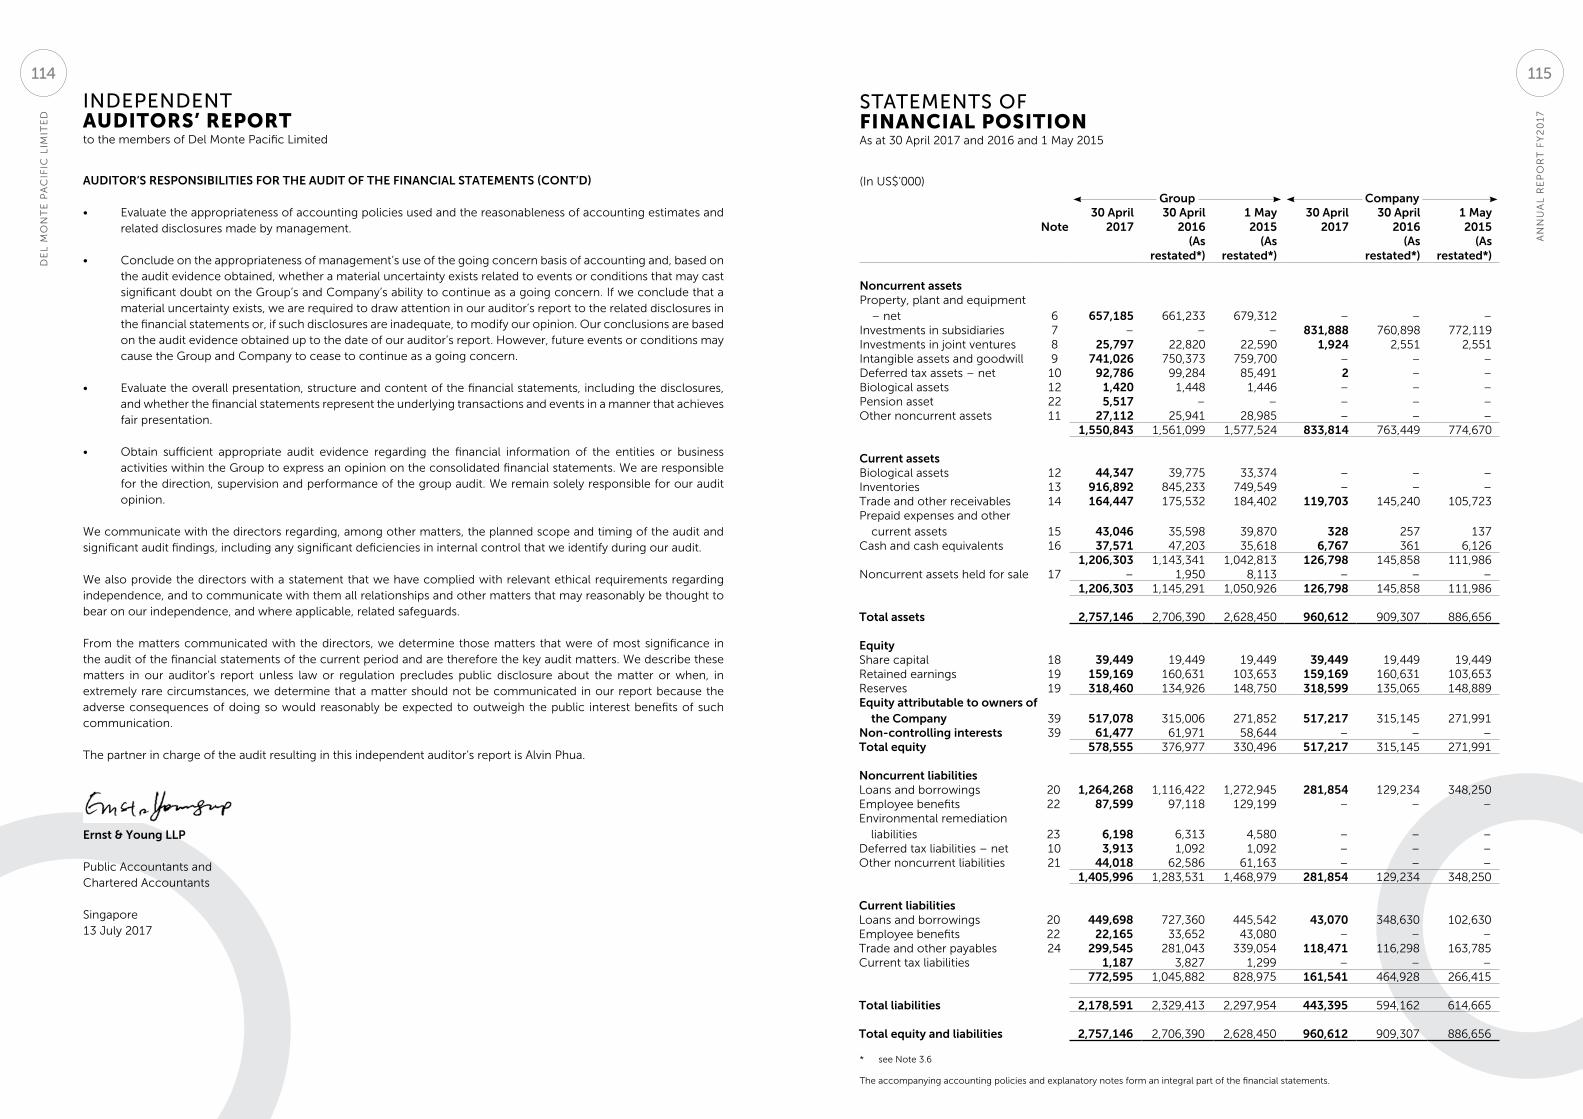
INDEPENDENT AUDITORS’ REPORTto the members of Del Monte Pacific Limited
(In US$’000)
Group Company
Note30 April
201730 April
20161 May 2015
30 April2017
30 April2016
1 May 2015
(As restated*)
(Asrestated*)
(As restated*)
(Asrestated*)
Noncurrent assetsProperty, plant and equipment
– net 6 657,185 661,233 679,312 – – –Investments in subsidiaries 7 – – – 831,888 760,898 772,119 Investments in joint ventures 8 25,797 22,820 22,590 1,924 2,551 2,551 Intangible assets and goodwill 9 741,026 750,373 759,700 – – –Deferred tax assets – net 10 92,786 99,284 85,491 2 – –Biological assets 12 1,420 1,448 1,446 – – –Pension asset 22 5,517 – – – – –Other noncurrent assets 11 27,112 25,941 28,985 – – –
1,550,843 1,561,099 1,577,524 833,814 763,449 774,670
Current assetsBiological assets 12 44,347 39,775 33,374 – – –Inventories 13 916,892 845,233 749,549 – – –Trade and other receivables 14 164,447 175,532 184,402 119,703 145,240 105,723 Prepaid expenses and other
current assets 15 43,046 35,598 39,870 328 257 137 Cash and cash equivalents 16 37,571 47,203 35,618 6,767 361 6,126
1,206,303 1,143,341 1,042,813 126,798 145,858 111,986 Noncurrent assets held for sale 17 – 1,950 8,113 – – –
1,206,303 1,145,291 1,050,926 126,798 145,858 111,986
Total assets 2,757,146 2,706,390 2,628,450 960,612 909,307 886,656
EquityShare capital 18 39,449 19,449 19,449 39,449 19,449 19,449 Retained earnings 19 159,169 160,631 103,653 159,169 160,631 103,653 Reserves 19 318,460 134,926 148,750 318,599 135,065 148,889 Equity attributable to owners of
the Company 39 517,078 315,006 271,852 517,217 315,145 271,991 Non-controlling interests 39 61,477 61,971 58,644 – – –Total equity 578,555 376,977 330,496 517,217 315,145 271,991
Noncurrent liabilitiesLoans and borrowings 20 1,264,268 1,116,422 1,272,945 281,854 129,234 348,250 Employee benefits 22 87,599 97,118 129,199 – – –Environmental remediation
liabilities 23
6,198 6,313 4,580 – – –Deferred tax liabilities – net 10 3,913 1,092 1,092 – – –Other noncurrent liabilities 21 44,018 62,586 61,163 – – –
1,405,996 1,283,531 1,468,979 281,854 129,234 348,250
Current liabilitiesLoans and borrowings 20 449,698 727,360 445,542 43,070 348,630 102,630 Employee benefits 22 22,165 33,652 43,080 – – –Trade and other payables 24 299,545 281,043 339,054 118,471 116,298 163,785 Current tax liabilities 1,187 3,827 1,299 – – –
772,595 1,045,882 828,975 161,541 464,928 266,415
Total liabilities 2,178,591 2,329,413 2,297,954 443,395 594,162 614,665
Total equity and liabilities 2,757,146 2,706,390 2,628,450 960,612 909,307 886,656
* see Note 3.6
The accompanying accounting policies and explanatory notes form an integral part of the financial statements.
STATEMENTS OF FINANCIAL POSITION As at 30 April 2017 and 2016 and 1 May 2015
AUDITOR’S RESPONSIBILITIES FOR THE AUDIT OF THE FINANCIAL STATEMENTS (CONT’D)
• Evaluate the appropriateness of accounting policies used and the reasonableness of accounting estimates and related disclosures made by management.
• Conclude on the appropriateness of management’s use of the going concern basis of accounting and, based on the audit evidence obtained, whether a material uncertainty exists related to events or conditions that may cast significant doubt on the Group’s and Company’s ability to continue as a going concern. If we conclude that a material uncertainty exists, we are required to draw attention in our auditor’s report to the related disclosures in the financial statements or, if such disclosures are inadequate, to modify our opinion. Our conclusions are based on the audit evidence obtained up to the date of our auditor’s report. However, future events or conditions may cause the Group and Company to cease to continue as a going concern.
• Evaluate the overall presentation, structure and content of the financial statements, including the disclosures, and whether the financial statements represent the underlying transactions and events in a manner that achieves fair presentation.
• Obtain sufficient appropriate audit evidence regarding the financial information of the entities or business activities within the Group to express an opinion on the consolidated financial statements. We are responsible for the direction, supervision and performance of the group audit. We remain solely responsible for our audit opinion.
We communicate with the directors regarding, among other matters, the planned scope and timing of the audit and significant audit findings, including any significant deficiencies in internal control that we identify during our audit.
We also provide the directors with a statement that we have complied with relevant ethical requirements regarding independence, and to communicate with them all relationships and other matters that may reasonably be thought to bear on our independence, and where applicable, related safeguards.
From the matters communicated with the directors, we determine those matters that were of most significance in the audit of the financial statements of the current period and are therefore the key audit matters. We describe these matters in our auditor’s report unless law or regulation precludes public disclosure about the matter or when, in extremely rare circumstances, we determine that a matter should not be communicated in our report because the adverse consequences of doing so would reasonably be expected to outweigh the public interest benefits of such communication.
The partner in charge of the audit resulting in this independent auditor’s report is Alvin Phua.
Ernst & Young LLP
Public Accountants andChartered Accountants
Singapore13 July 2017
AN
NU
AL
RE
PO
RT
FY
20
17
DE
L M
ON
TE
PA
CIF
IC L
IMIT
ED
115114
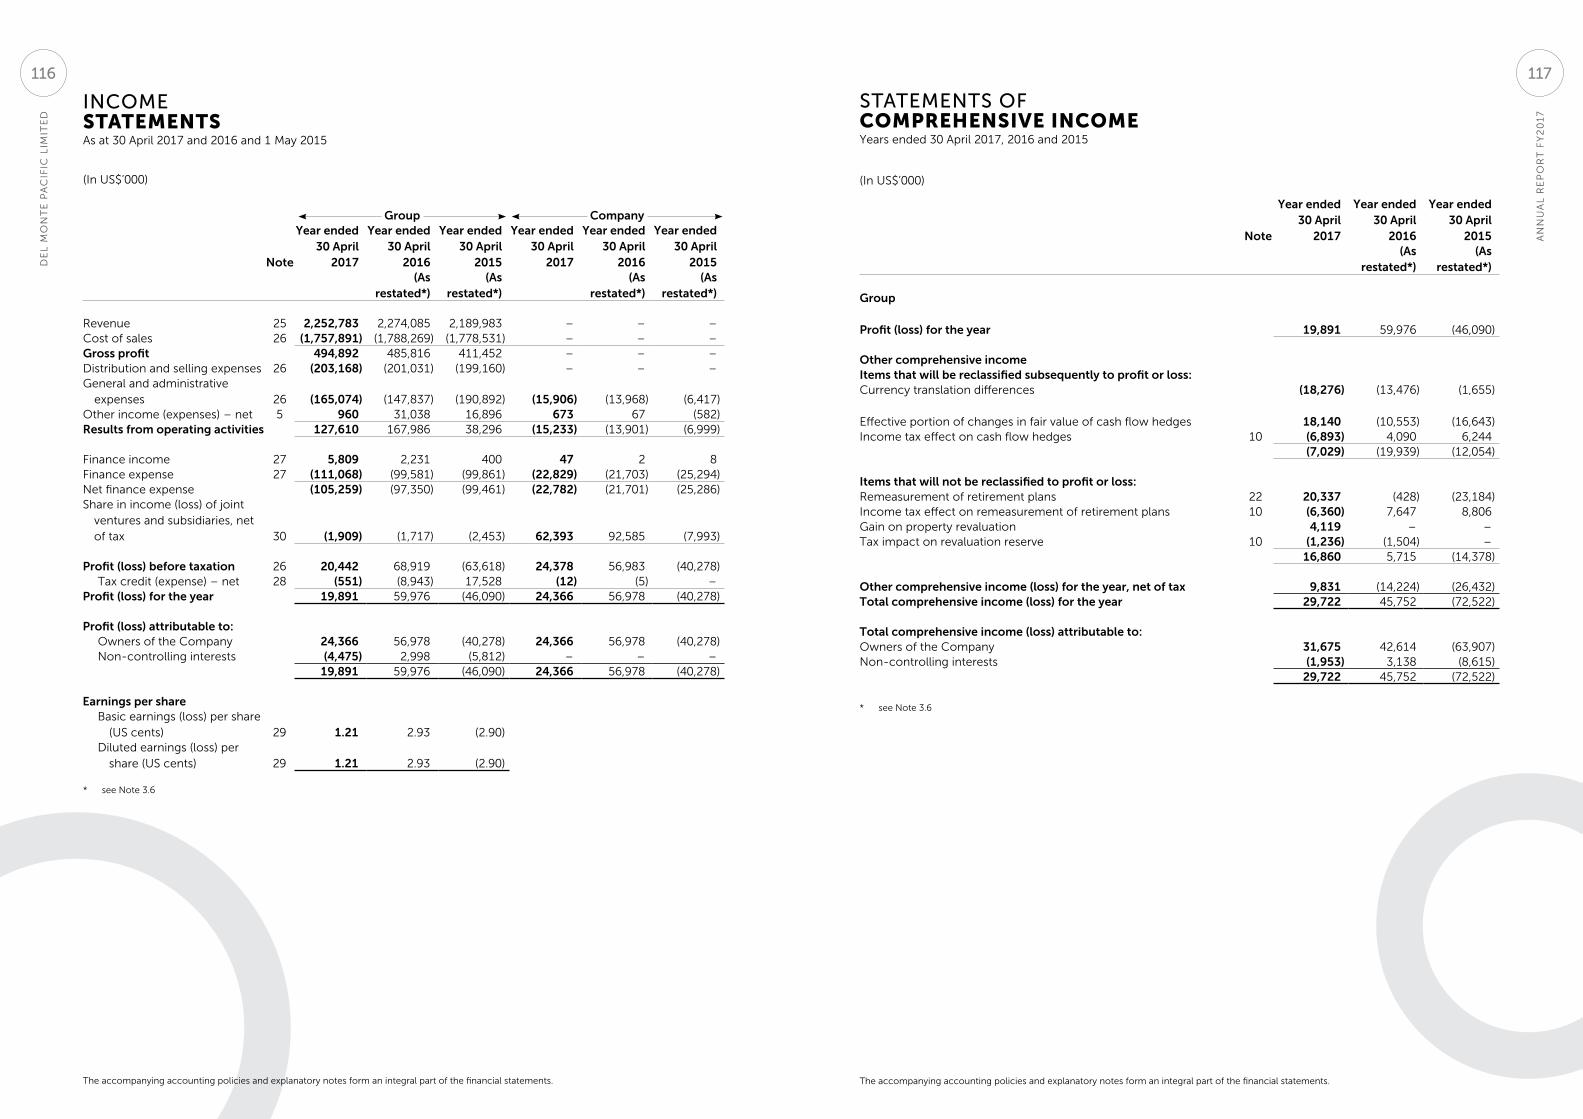
(In US$’000)
Group Company
Note
Year ended 30 April
2017
Year ended 30 April
2016
Year ended 30 April
2015
Year ended 30 April
2017
Year ended 30 April
2016
Year ended 30 April
2015(As
restated*)(As
restated*)(As
restated*)(As
restated*)
Revenue 25 2,252,783 2,274,085 2,189,983 – – –Cost of sales 26 (1,757,891) (1,788,269) (1,778,531) – – –Gross profit 494,892 485,816 411,452 – – –Distribution and selling expenses 26 (203,168) (201,031) (199,160) – – –General and administrative
expenses 26 (165,074) (147,837) (190,892) (15,906) (13,968) (6,417)Other income (expenses) – net 5 960 31,038 16,896 673 67 (582)Results from operating activities 127,610 167,986 38,296 (15,233) (13,901) (6,999)
Finance income 27 5,809 2,231 400 47 2 8 Finance expense 27 (111,068) (99,581) (99,861) (22,829) (21,703) (25,294)Net finance expense (105,259) (97,350) (99,461) (22,782) (21,701) (25,286)Share in income (loss) of joint
ventures and subsidiaries, net of tax 30 (1,909) (1,717) (2,453) 62,393 92,585 (7,993)
Profit (loss) before taxation 26 20,442 68,919 (63,618) 24,378 56,983 (40,278)Tax credit (expense) – net 28 (551) (8,943) 17,528 (12) (5) –
Profit (loss) for the year 19,891 59,976 (46,090) 24,366 56,978 (40,278)
Profit (loss) attributable to:Owners of the Company 24,366 56,978 (40,278) 24,366 56,978 (40,278)Non-controlling interests (4,475) 2,998 (5,812) – – –
19,891 59,976 (46,090) 24,366 56,978 (40,278)
Earnings per shareBasic earnings (loss) per share
(US cents) 29 1.21 2.93 (2.90)Diluted earnings (loss) per
share (US cents) 29 1.21 2.93 (2.90)
* see Note 3.6
The accompanying accounting policies and explanatory notes form an integral part of the financial statements.
INCOME STATEMENTS As at 30 April 2017 and 2016 and 1 May 2015
(In US$’000)
Note
Year ended 30 April
2017
Year ended 30 April
2016
Year ended 30 April
2015(As
restated*)(As
restated*)
Group
Profit (loss) for the year
19,891
59,976
(46,090)
Other comprehensive incomeItems that will be reclassified subsequently to profit or loss:Currency translation differences (18,276) (13,476) (1,655)
Effective portion of changes in fair value of cash flow hedges 18,140 (10,553) (16,643) Income tax effect on cash flow hedges 10 (6,893) 4,090 6,244
(7,029) (19,939) (12,054)
Items that will not be reclassified to profit or loss:Remeasurement of retirement plans 22 20,337 (428) (23,184)Income tax effect on remeasurement of retirement plans 10 (6,360) 7,647 8,806Gain on property revaluation 4,119 – –Tax impact on revaluation reserve 10 (1,236) (1,504) –
16,860 5,715 (14,378)
Other comprehensive income (loss) for the year, net of tax 9,831 (14,224) (26,432)Total comprehensive income (loss) for the year 29,722 45,752 (72,522)
Total comprehensive income (loss) attributable to:Owners of the Company 31,675 42,614 (63,907)Non-controlling interests (1,953) 3,138 (8,615)
29,722 45,752 (72,522)
* see Note 3.6
The accompanying accounting policies and explanatory notes form an integral part of the financial statements.
STATEMENTS OF COMPREHENSIVE INCOME Years ended 30 April 2017, 2016 and 2015
AN
NU
AL
RE
PO
RT
FY
20
17
DE
L M
ON
TE
PA
CIF
IC L
IMIT
ED
117116
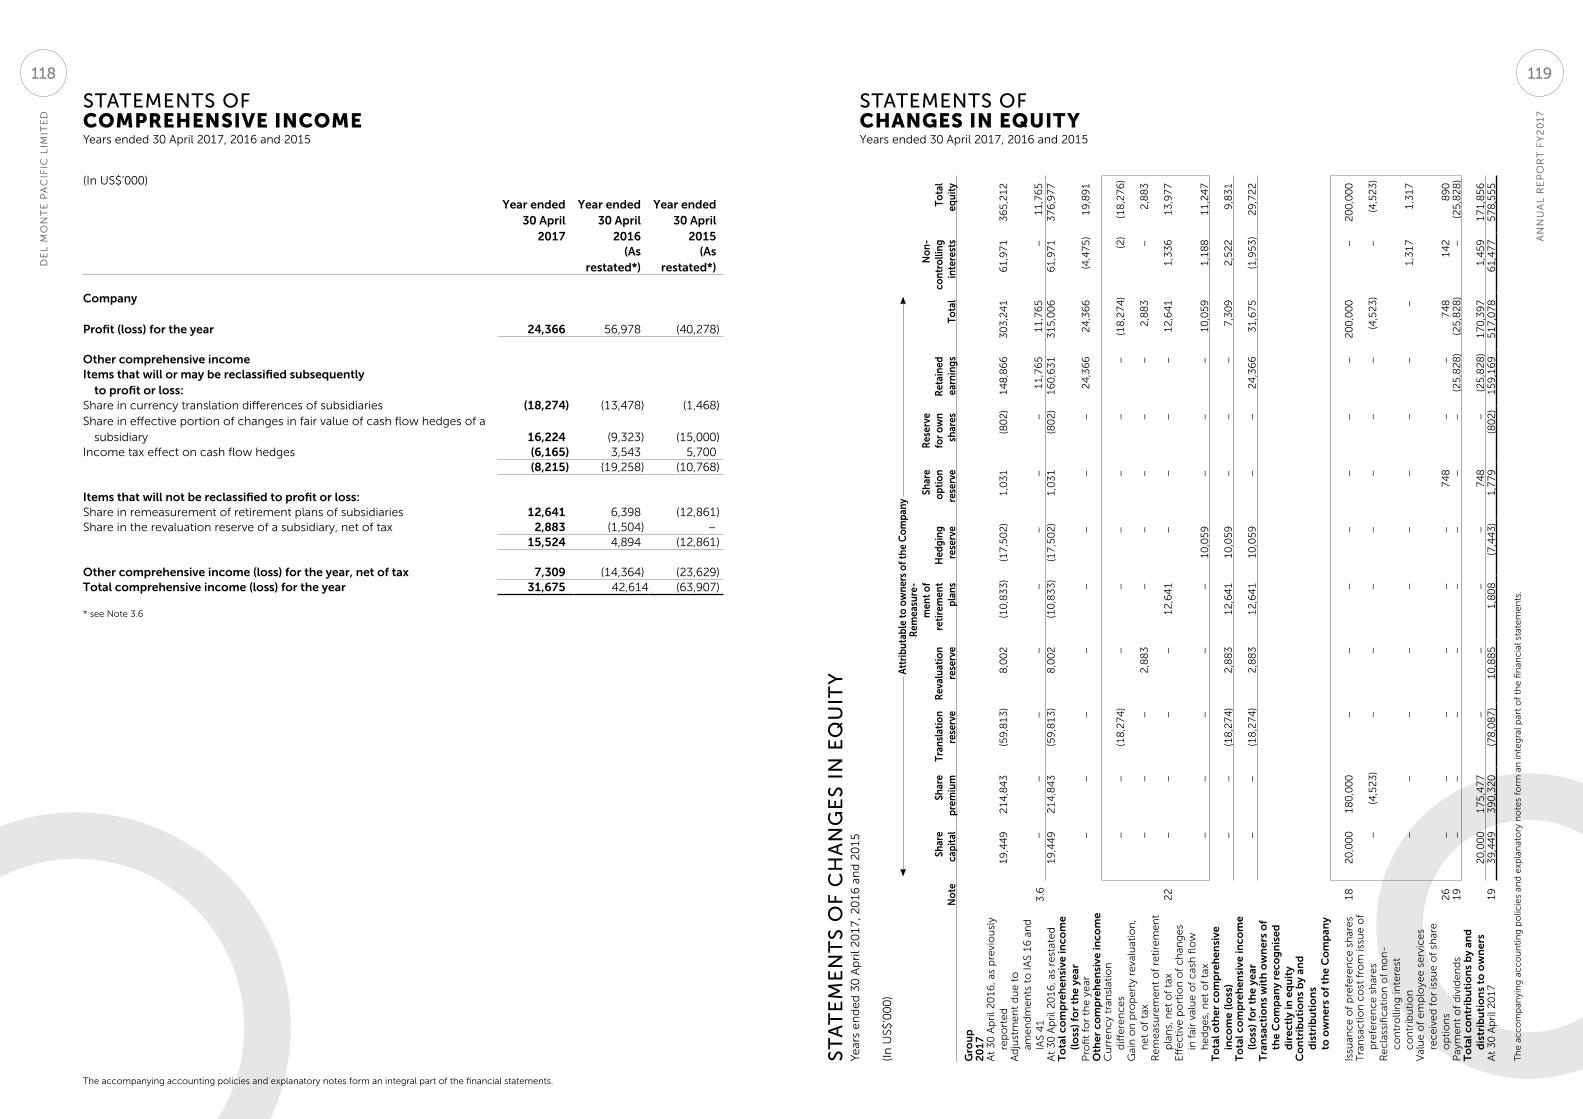
(In US$’000)
Year ended 30 April
2017
Year ended 30 April
2016
Year ended 30 April
2015(As
restated*)(As
restated*)
Company
Profit (loss) for the year 24,366 56,978 (40,278)
Other comprehensive incomeItems that will or may be reclassified subsequently
to profit or loss:Share in currency translation differences of subsidiaries (18,274) (13,478) (1,468)Share in effective portion of changes in fair value of cash flow hedges of a
subsidiary 16,224 (9,323) (15,000)Income tax effect on cash flow hedges (6,165) 3,543 5,700
(8,215) (19,258) (10,768)
Items that will not be reclassified to profit or loss:Share in remeasurement of retirement plans of subsidiaries 12,641 6,398 (12,861)Share in the revaluation reserve of a subsidiary, net of tax 2,883 (1,504) –
15,524 4,894 (12,861)
Other comprehensive income (loss) for the year, net of tax 7,309 (14,364) (23,629) Total comprehensive income (loss) for the year 31,675 42,614 (63,907)
* see Note 3.6
The accompanying accounting policies and explanatory notes form an integral part of the financial statements.
STATEMENTS OF COMPREHENSIVE INCOME Years ended 30 April 2017, 2016 and 2015
(In
US$
’00
0)
Att
ribu
tabl
e to
ow
ners
of t
he C
om
pany
No
teSh
are
capi
tal
Shar
e pr
emiu
mTr
ansl
atio
n re
serv
eR
eval
uati
on
rese
rve
Rem
easu
re-
men
t o
f re
tire
men
tpl
ans
Hed
ging
re
serv
e
Shar
e
opt
ion
rese
rve
Res
erve
fo
r o
wn
shar
esR
etai
ned
earn
ings
Tota
l
No
n-co
ntro
lling
in
tere
sts
Tota
l eq
uity
Gro
up
20
17
At
30
Ap
ril 2
01
6, a
s p
revi
ou
sly
rep
ort
ed
19
,44
92
14
,84
3(5
9,8
13
)8
,00
2(1
0,8
33
)(1
7,5
02
)1
,03
1(8
02
)1
48
,86
63
03
,24
16
1,9
71
36
5,2
12
Ad
just
me
nt
du
e t
o
ame
nd
me
nts
to
IAS
16
an
d
IAS
41
3.6
––
––
––
––
11
,76
5
11
,76
5
– 1
1,7
65
A
t 3
0 A
pri
l 20
16
, as
rest
ate
d 1
9,4
49
2
14
,84
3
(5
9,8
13
) 8
,00
2
(1
0,8
33
) (
17
,50
2)
1,0
31
(
80
2)
16
0,6
31
3
15
,00
6
61
,97
1
37
6,9
77
T
ota
l co
mp
reh
ensi
ve in
com
e (l
oss
) fo
r th
e ye
arP
rofi
t fo
r th
e y
ear
––
––
––
––
24
,36
6
24
,36
6
(4
,47
5)
19
,89
1
Oth
er c
om
pre
hen
sive
inco
me
Cu
rre
nc
y tr
ansl
atio
n
diff
ere
nc
es
––
(18
,27
4)
––
––
––
(18
,27
4)
(2
)(1
8,2
76
)G
ain
on
pro
pe
rty
reva
luat
ion
, n
et
of
tax
––
–2
,88
3–
––
––
2,8
83
–2
,88
3R
em
eas
ure
me
nt
of
reti
rem
en
t p
lan
s, n
et
of
tax
22
––
––
12
,64
1–
––
–1
2,6
41
1,3
36
1
3,9
77
E
ffe
cti
ve p
ort
ion
of
ch
ang
es
in f
air
valu
e o
f c
ash
flo
w
he
dg
es,
ne
t o
f ta
x–
––
––
1
0,0
59
–
––
10
,05
9
1,1
88
1
1,2
47
T
ota
l oth
er c
om
pre
hen
sive
in
com
e (l
oss
)–
–(1
8,2
74
)2
,88
31
2,6
41
10
,05
9
––
–7
,30
9 2
,52
2
9,8
31
To
tal c
om
pre
hen
sive
inco
me
(lo
ss) f
or
the
year
––
(18
,27
4)
2,8
83
12
,64
11
0,0
59
–
– 2
4,3
66
3
1,6
75
(1
,95
3)
29
,72
2T
ran
sact
ion
s w
ith
ow
ner
s o
f th
e C
om
pan
y re
cog
nis
ed
dir
ectl
y in
eq
uit
yC
on
trib
uti
on
s b
y an
d
dis
trib
uti
on
s to
ow
ner
s o
f th
e C
om
pan
y
Issu
anc
e o
f p
refe
ren
ce
sh
are
s1
8 2
0,0
00
1
80
,00
0
––
––
––
–2
00
,00
0–
20
0,0
00
Tra
nsa
cti
on
co
st f
rom
issu
e o
f p
refe
ren
ce
sh
are
s–
(4,5
23
)–
––
––
––
(4,5
23
)–
(4,5
23
)R
ec
lass
ific
atio
n o
f n
on
-c
on
tro
llin
g in
tere
st
co
ntr
ibu
tio
n–
––
––
––
––
– 1
,31
7
1,3
17
V
alu
e o
f e
mp
loye
e s
erv
ice
s re
ce
ive
d f
or
issu
e o
f sh
are
o
pti
on
s2
6–
––
––
–7
48
––
74
8
14
2
8
90
Pay
me
nt
of
div
ide
nd
s1
9–
––
––
––
– (
25
,82
8)
(25
,82
8)
– (
25
,82
8)
To
tal c
on
trib
uti
on
s b
y an
d
dis
trib
uti
on
s to
ow
ner
s 2
0,0
00
1
75
,47
7
––
––
74
8–
(2
5,8
28
) 1
70
,39
7
1,4
59
1
71
,85
6A
t 3
0 A
pri
l 20
17
19
3
9,4
49
3
90
,32
0
(78
,08
7)
10
,88
51
,80
8 (
7,4
43
) 1
,77
9
(8
02
) 1
59
,16
9
51
7,0
78
61
,47
7
57
8,5
55
STATEMENTS OF CHANGES IN EQUITY Years ended 30 April 2017, 2016 and 2015
Th
e a
cc
om
pan
yin
g a
cc
ou
nti
ng
po
licie
s an
d e
xpla
nat
ory
no
tes
form
an
inte
gra
l par
t o
f th
e fi
nan
cia
l sta
tem
en
ts.
ST
AT
EM
EN
TS
OF
CH
AN
GE
S I
N E
QU
ITY
Ye
ars
en
de
d 3
0 A
pri
l 20
17
, 20
16
an
d 2
01
5
AN
NU
AL
RE
PO
RT
FY
20
17
DE
L M
ON
TE
PA
CIF
IC L
IMIT
ED
119118
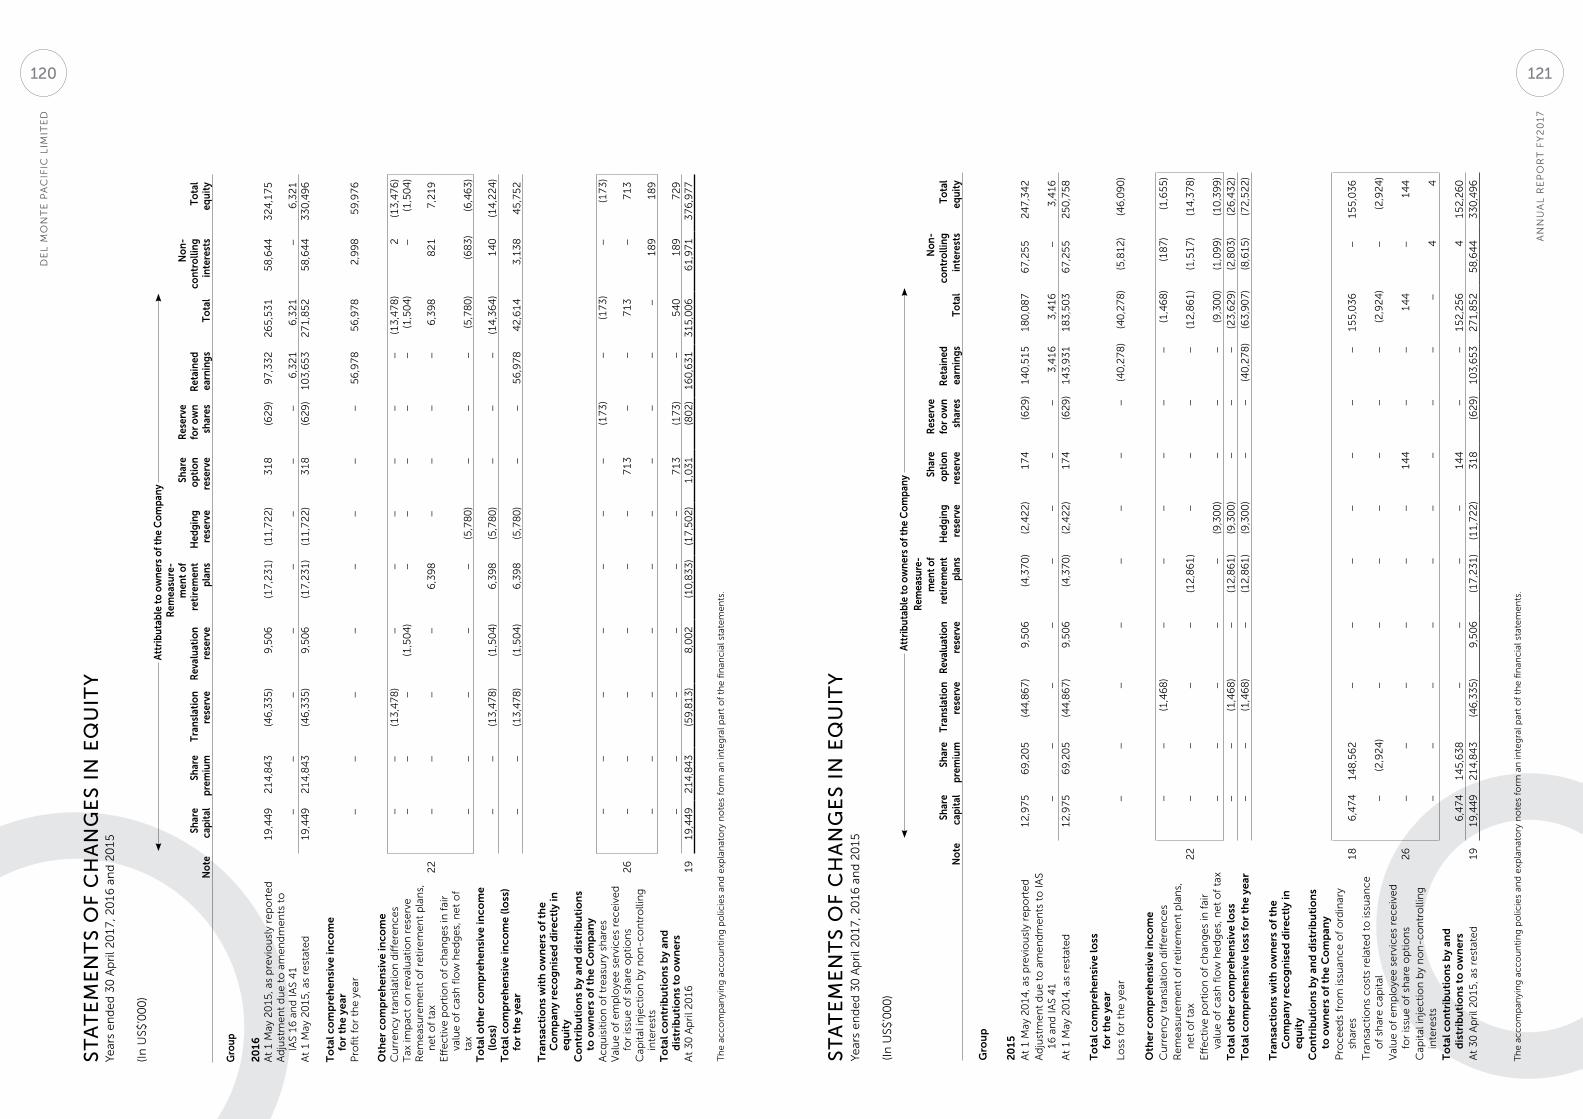
ST
AT
EM
EN
TS
OF
CH
AN
GE
S I
N E
QU
ITY
Year
s e
nd
ed
30
Ap
ril 2
01
7, 2
01
6 a
nd
20
15
(In
US$
’00
0)
Att
ribu
tabl
e to
ow
ners
of t
he C
om
pany
No
teSh
are
capi
tal
Shar
e pr
emiu
mTr
ansl
atio
n re
serv
eR
eval
uati
on
rese
rve
Rem
easu
re-
men
t o
f re
tire
men
tpl
ans
Hed
ging
re
serv
e
Shar
e
opt
ion
rese
rve
Res
erve
fo
r o
wn
shar
esR
etai
ned
earn
ings
Tota
l
No
n-co
ntro
lling
in
tere
sts
Tota
l eq
uity
Gro
up
20
16
At
1 M
ay 2
01
5, a
s p
revi
ou
sly
rep
ort
ed
19
,44
9
21
4,8
43
(4
6,3
35
) 9
,50
6
(17
,23
1)
(11
,72
2)
31
8
(62
9)
97
,33
22
65
,53
15
8,6
44
32
4,1
75
Ad
just
me
nt
du
e t
o a
me
nd
me
nts
to
IA
S 1
6 a
nd
IAS
41
––
––
––
––
6,3
21
6,3
21
–
6,3
21
At
1 M
ay 2
01
5, a
s re
stat
ed
19
,44
9
21
4,8
43
(4
6,3
35
) 9
,50
6
(17
,23
1)
(11
,72
2)
31
8
(62
9)
10
3,6
53
27
1,8
52
58
,64
4
33
0,4
96
To
tal c
om
pre
hen
sive
inco
me
fo
r th
e ye
arP
rofi
t fo
r th
e y
ear
––
––
––
––
56
,97
8
56
,97
8
2,9
98
5
9,9
76
Oth
er c
om
pre
hen
sive
inco
me
Cu
rre
nc
y tr
ansl
atio
n d
iffe
ren
ce
s–
–(1
3,4
78
)–
––
––
–(1
3,4
78
)2
(13
,47
6)
Tax
imp
act
on
re
valu
atio
n r
ese
rve
––
–(1
,50
4)
––
––
–(1
,50
4)
–(1
,50
4)
Re
me
asu
rem
en
t o
f re
tire
me
nt
pla
ns,
n
et
of
tax
22
––
––
6,3
98
––
––
6,3
98
82
17
,21
9E
ffe
cti
ve p
ort
ion
of
ch
ang
es
in f
air
valu
e o
f c
ash
flo
w h
ed
ge
s, n
et
of
tax
––
––
–(5
,78
0)
––
–(5
,78
0)
(68
3)
(6,4
63
)T
ota
l oth
er c
om
pre
hen
sive
inco
me
(lo
ss)
––
(13
,47
8)
(1,5
04
)6
,39
8(5
,78
0)
––
–(1
4,3
64
)1
40
(14
,22
4)
To
tal c
om
pre
hen
sive
inco
me
(lo
ss)
for
the
year
––
(1
3,4
78
) (
1,5
04
) 6
,39
8
(5
,78
0)
––
56
,97
8
42
,61
4
3,1
38
4
5,7
52
Tra
nsa
ctio
ns
wit
h o
wn
ers
of
the
Co
mp
any
reco
gn
ised
dir
ectl
y in
eq
uit
yC
on
trib
uti
on
s b
y an
d d
istr
ibu
tio
ns
to o
wn
ers
of
the
Co
mp
any
Ac
qu
isit
ion
of
tre
asu
ry s
har
es
––
––
––
–(1
73
)–
(17
3)
–(1
73
)V
alu
e o
f e
mp
loye
e s
erv
ice
s re
ce
ive
d
for
issu
e o
f sh
are
op
tio
ns
26
––
––
––
71
3–
–7
13
–7
13
Cap
ital
inje
cti
on
by
no
n-c
on
tro
llin
g
inte
rest
s–
––
––
––
––
–1
89
18
9T
ota
l co
ntr
ibu
tio
ns
by
and
d
istr
ibu
tio
ns
to o
wn
ers
––
––
––
71
3(1
73
)–
54
01
89
72
9A
t 3
0 A
pri
l 20
16
19
1
9,4
49
2
14
,84
3
(5
9,8
13
) 8
,00
2
(1
0,8
33
) (
17
,50
2)
1,0
31
(
80
2)
16
0,6
31
31
5,0
06
6
1,9
71
3
76
,97
7
Th
e a
cc
om
pan
yin
g a
cc
ou
nti
ng
po
licie
s an
d e
xpla
nat
ory
no
tes
form
an
inte
gra
l par
t o
f th
e fi
nan
cia
l sta
tem
en
ts.
(In
US$
’00
0)
Att
ribu
tabl
e to
ow
ners
of t
he C
om
pany
No
teSh
are
capi
tal
Shar
e pr
emiu
mTr
ansl
atio
n re
serv
eR
eval
uati
on
rese
rve
Rem
easu
re-
men
t of
reti
rem
ent
plan
sH
edgi
ng
rese
rve
Shar
e
opt
ion
rese
rve
Res
erve
fo
r o
wn
shar
esR
etai
ned
earn
ings
Tota
l
No
n-co
ntro
lling
in
tere
sts
Tota
l eq
uity
Gro
up
20
15
At
1 M
ay 2
01
4, a
s p
revi
ou
sly
rep
ort
ed
12
,97
56
9,2
05
(44
,86
7)
9,5
06
(4,3
70
)(2
,42
2)
17
4(6
29
)1
40
,51
51
80
,08
76
7,2
55
24
7,3
42
Ad
just
me
nt
du
e t
o a
me
nd
me
nts
to
IAS
16
an
d IA
S 4
1–
––
––
––
– 3
,41
6
3,4
16
–
3,4
16
A
t 1
May
20
14
, as
rest
ate
d1
2,9
75
69
,20
5(4
4,8
67
)9
,50
6(4
,37
0)
(2,4
22
)1
74
(62
9)
14
3,9
31
1
83
,50
3
67
,25
5
25
0,7
58
To
tal c
om
pre
hen
sive
loss
fo
r th
e ye
arLo
ss f
or
the
ye
ar–
––
––
––
– (
40
,27
8)
(4
0,2
78
) (
5,8
12
) (
46
,09
0)
Oth
er c
om
pre
hen
sive
inco
me
Cu
rre
nc
y tr
ansl
atio
n d
iffe
ren
ce
s–
–(1
,46
8)
––
––
––
(1,4
68
)(1
87
)(1
,65
5)
Re
me
asu
rem
en
t o
f re
tire
me
nt
pla
ns,
n
et
of
tax
22
––
––
(12
,86
1)
––
––
(12
,86
1)
(1,5
17
)(1
4,3
78
)E
ffe
cti
ve p
ort
ion
of
ch
ang
es
in f
air
valu
e o
f c
ash
flo
w h
ed
ge
s, n
et
of
tax
––
––
–(9
,30
0)
––
–(9
,30
0)
(1,0
99
)(1
0,3
99
)T
ota
l oth
er c
om
pre
hen
sive
loss
––
(1,4
68
)–
(12
,86
1)
(9,3
00
)–
––
(23
,62
9)
(2,8
03
)(2
6,4
32
)T
ota
l co
mp
reh
ensi
ve lo
ss f
or
the
year
––
(1,4
68
)–
(12
,86
1)
(9,3
00
)–
– (
40
,27
8)
(63
,90
7)
(8,6
15
)(7
2,5
22
)
Tra
nsa
ctio
ns
wit
h o
wn
ers
of
the
Co
mp
any
reco
gn
ised
dir
ectl
y in
eq
uit
yC
on
trib
uti
on
s b
y an
d d
istr
ibu
tio
ns
to o
wn
ers
of
the
Co
mp
any
Pro
ce
ed
s fr
om
issu
anc
e o
f o
rdin
ary
shar
es
18
6,4
74
14
8,5
62
––
––
––
–1
55
,03
6–
15
5,0
36
Tra
nsa
cti
on
s c
ost
s re
late
d t
o is
suan
ce
o
f sh
are
cap
ital
–(2
,92
4)
––
––
––
–(2
,92
4)
–(2
,92
4)
Val
ue
of
em
plo
yee
se
rvic
es
rec
eiv
ed
fo
r is
sue
of
shar
e o
pti
on
s2
6–
––
––
–1
44
––
14
4–
14
4C
apit
al in
jec
tio
n b
y n
on
-co
ntr
olli
ng
in
tere
sts
––
––
––
––
––
44
To
tal c
on
trib
uti
on
s b
y an
d
dis
trib
uti
on
s to
ow
ner
s6
,47
41
45
,63
8–
––
–1
44
––
15
2,2
56
41
52
,26
0A
t 3
0 A
pri
l 20
15
, as
rest
ate
d1
9 1
9,4
49
2
14
,84
3
(4
6,3
35
) 9
,50
6
(1
7,2
31
) (
11
,72
2)
31
8
(6
29
) 1
03
,65
3
27
1,8
52
5
8,6
44
3
30
,49
6
Th
e a
cc
om
pan
yin
g a
cc
ou
nti
ng
po
licie
s an
d e
xpla
nat
ory
no
tes
form
an
inte
gra
l par
t o
f th
e fi
nan
cia
l sta
tem
en
ts.
ST
AT
EM
EN
TS
OF
CH
AN
GE
S I
N E
QU
ITY
Ye
ars
en
de
d 3
0 A
pri
l 20
17
, 20
16
an
d 2
01
5
AN
NU
AL
RE
PO
RT
FY
20
17
DE
L M
ON
TE
PA
CIF
IC L
IMIT
ED
121120
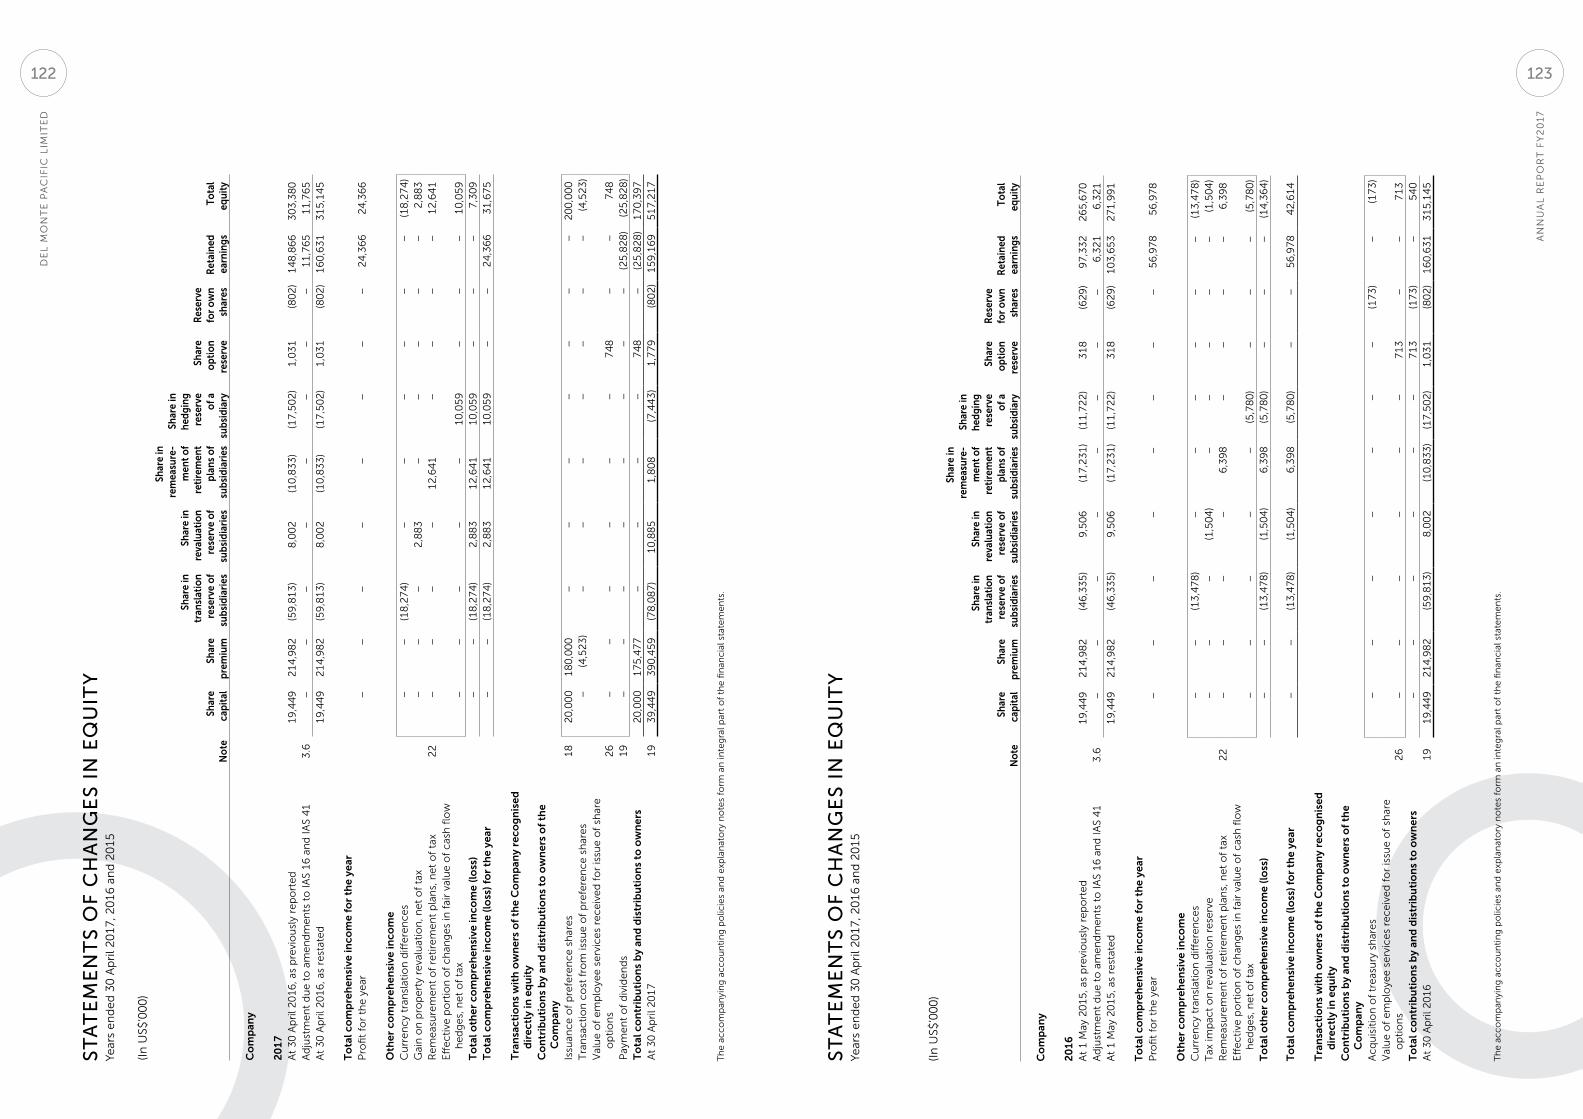
(In
US$
’00
0)
No
teSh
are
capi
tal
Shar
e pr
emiu
m
Shar
e in
tr
ansl
atio
n re
serv
e o
f su
bsid
iari
es
Shar
e in
re
valu
atio
n re
serv
e o
f su
bsid
iari
es
Shar
e in
re
mea
sure
-m
ent
of
reti
rem
ent
plan
s o
f su
bsid
iari
es
Shar
e in
he
dgin
g re
serv
e o
f a
subs
idia
ry
Shar
e
opt
ion
rese
rve
Res
erve
fo
r o
wn
shar
esR
etai
ned
earn
ings
Tota
l eq
uity
Co
mp
any
20
17
At
30
Ap
ril 2
01
6, a
s p
revi
ou
sly
rep
ort
ed
19
,44
92
14
,98
2(5
9,8
13
)8
,00
2(1
0,8
33
)(1
7,5
02
)1
,03
1(8
02
)1
48
,86
63
03
,38
0A
dju
stm
en
t d
ue
to
am
en
dm
en
ts t
o IA
S 1
6 a
nd
IAS
41
3.6
––
––
––
––
11
,76
5
11
,76
5
At
30
Ap
ril 2
01
6, a
s re
stat
ed
1
9,4
49
2
14
,98
2
(5
9,8
13
) 8
,00
2
(1
0,8
33
)(1
7,5
02
)1
,03
1 (
80
2)
16
0,6
31
3
15
,14
5
To
tal c
om
pre
hen
sive
inco
me
for
the
year
Pro
fit
for
the
ye
ar–
––
––
––
– 2
4,3
66
2
4,3
66
Oth
er c
om
pre
hen
sive
inco
me
Cu
rre
nc
y tr
ansl
atio
n d
iffe
ren
ce
s–
–(1
8,2
74
)–
––
––
–(1
8,2
74
)G
ain
on
pro
pe
rty
reva
luat
ion
, ne
t o
f ta
x–
––
2,8
83
––
––
–2
,88
3R
em
eas
ure
me
nt
of
reti
rem
en
t p
lan
s, n
et
of
tax
22
––
––
12
,64
1
––
––
12
,64
1
Eff
ec
tive
po
rtio
n o
f c
han
ge
s in
fai
r va
lue
of
cas
h fl
ow
h
ed
ge
s, n
et
of
tax
––
––
– 1
0,0
59
–
––
10
,05
9
To
tal o
ther
co
mp
reh
ensi
ve in
com
e (l
oss
)–
–(1
8,2
74
) 2
,88
3
12
,64
1
10
,05
9
––
–7
,30
9T
ota
l co
mp
reh
ensi
ve in
com
e (l
oss
) fo
r th
e ye
ar–
–(1
8,2
74
) 2
,88
3
12
,64
1
10
,05
9
––
24
,36
6
31
,67
5
Tra
nsa
ctio
ns
wit
h o
wn
ers
of
the
Co
mp
any
reco
gn
ised
d
irec
tly
in e
qu
ity
Co
ntr
ibu
tio
ns
by
and
dis
trib
uti
on
s to
ow
ner
s o
f th
e C
om
pan
yIs
suan
ce
of
pre
fere
nc
e s
har
es
18
2
0,0
00
1
80
,00
0
––
––
––
–2
00
,00
0T
ran
sac
tio
n c
ost
fro
m is
sue
of
pre
fere
nc
e s
har
es
–(4
,52
3)
––
––
––
–(4
,52
3)
Val
ue
of
em
plo
yee
se
rvic
es
rec
eiv
ed
fo
r is
sue
of
shar
e
op
tio
ns
26
––
––
––
74
8
––
74
8
Pay
me
nt
of
div
ide
nd
s1
9–
––
––
––
– (
25
,82
8)
(2
5,8
28
)T
ota
l co
ntr
ibu
tio
ns
by
and
dis
trib
uti
on
s to
ow
ner
s 2
0,0
00
1
75
,47
7
––
––
74
8–
(25
,82
8)
17
0,3
97
A
t 3
0 A
pri
l 20
17
19
39
,44
9
39
0,4
59
(7
8,0
87
)1
0,8
85
1,8
08
(7,4
43
)1
,77
9 (
80
2)
15
9,1
69
5
17
,21
7
Th
e a
cc
om
pan
yin
g a
cc
ou
nti
ng
po
licie
s an
d e
xpla
nat
ory
no
tes
form
an
inte
gra
l par
t o
f th
e fi
nan
cia
l sta
tem
en
ts.
ST
AT
EM
EN
TS
OF
CH
AN
GE
S I
N E
QU
ITY
Ye
ars
en
de
d 3
0 A
pri
l 20
17
, 20
16
an
d 2
01
5
(In
US$
’00
0)
No
teSh
are
capi
tal
Shar
e pr
emiu
m
Shar
e in
tr
ansl
atio
n re
serv
e o
f su
bsid
iari
es
Shar
e in
re
valu
atio
n re
serv
e o
f su
bsid
iari
es
Shar
e in
re
mea
sure
-m
ent
of
reti
rem
ent
plan
s o
f su
bsid
iari
es
Shar
e in
he
dgin
g re
serv
e o
f a
subs
idia
ry
Shar
e
opt
ion
rese
rve
Res
erve
fo
r o
wn
shar
esR
etai
ned
earn
ings
Tota
l eq
uity
Co
mp
any
20
16
At
1 M
ay 2
01
5, a
s p
revi
ou
sly
rep
ort
ed
19
,44
92
14
,98
2(4
6,3
35
)9
,50
6(1
7,2
31
)(1
1,7
22
)3
18
(62
9)
97
,33
22
65
,67
0A
dju
stm
en
t d
ue
to
am
en
dm
en
ts t
o IA
S 1
6 a
nd
IAS
41
3.6
––
––
––
––
6,3
21
6,3
21
At
1 M
ay 2
01
5, a
s re
stat
ed
1
9,4
49
21
4,9
82
(46
,33
5)
9,5
06
(17
,23
1)
(11
,72
2)
31
8(6
29
) 1
03
,65
3
27
1,9
91
To
tal c
om
pre
hen
sive
inco
me
for
the
year
Pro
fit
for
the
ye
ar–
––
––
––
– 5
6,9
78
5
6,9
78
Oth
er c
om
pre
hen
sive
inco
me
Cu
rre
nc
y tr
ansl
atio
n d
iffe
ren
ce
s–
–(1
3,4
78
)–
––
––
–(1
3,4
78
)T
ax im
pac
t o
n r
eva
luat
ion
re
serv
e–
––
(1,5
04
)–
––
––
(1,5
04
)R
em
eas
ure
me
nt
of
reti
rem
en
t p
lan
s, n
et
of
tax
22
––
––
6,3
98
––
––
6,3
98
Eff
ec
tive
po
rtio
n o
f c
han
ge
s in
fai
r va
lue
of
cas
h fl
ow
h
ed
ge
s, n
et
of
tax
––
––
–(5
,78
0)
––
–(5
,78
0)
To
tal o
ther
co
mp
reh
ensi
ve in
com
e (l
oss
)–
–(1
3,4
78
)(1
,50
4)
6,3
98
(5,7
80
)–
––
(14
,36
4)
To
tal c
om
pre
hen
sive
inco
me
(lo
ss) f
or
the
year
––
(13
,47
8)
(1,5
04
)6
,39
8(5
,78
0)
––
5
6,9
78
4
2,6
14
Tra
nsa
ctio
ns
wit
h o
wn
ers
of
the
Co
mp
any
reco
gn
ised
d
irec
tly
in e
qu
ity
Co
ntr
ibu
tio
ns
by
and
dis
trib
uti
on
s to
ow
ner
s o
f th
e C
om
pan
yA
cq
uis
itio
n o
f tr
eas
ury
sh
are
s–
––
––
––
(17
3)
–(1
73
)V
alu
e o
f e
mp
loye
e s
erv
ice
s re
ce
ive
d f
or
issu
e o
f sh
are
o
pti
on
s2
6–
––
––
–7
13
––
71
3T
ota
l co
ntr
ibu
tio
ns
by
and
dis
trib
uti
on
s to
ow
ner
s–
––
––
–7
13
(17
3)
–5
40
At
30
Ap
ril 2
01
61
91
9,4
49
21
4,9
82
(59
,81
3)
8,0
02
(10
,83
3)
(17
,50
2)
1,0
31
(80
2)
16
0,6
31
3
15
,14
5
Th
e a
cc
om
pan
yin
g a
cc
ou
nti
ng
po
licie
s an
d e
xpla
nat
ory
no
tes
form
an
inte
gra
l par
t o
f th
e fi
nan
cia
l sta
tem
en
ts.
ST
AT
EM
EN
TS
OF
CH
AN
GE
S I
N E
QU
ITY
Ye
ars
en
de
d 3
0 A
pri
l 20
17
, 20
16
an
d 2
01
5
AN
NU
AL
RE
PO
RT
FY
20
17
DE
L M
ON
TE
PA
CIF
IC L
IMIT
ED
123122
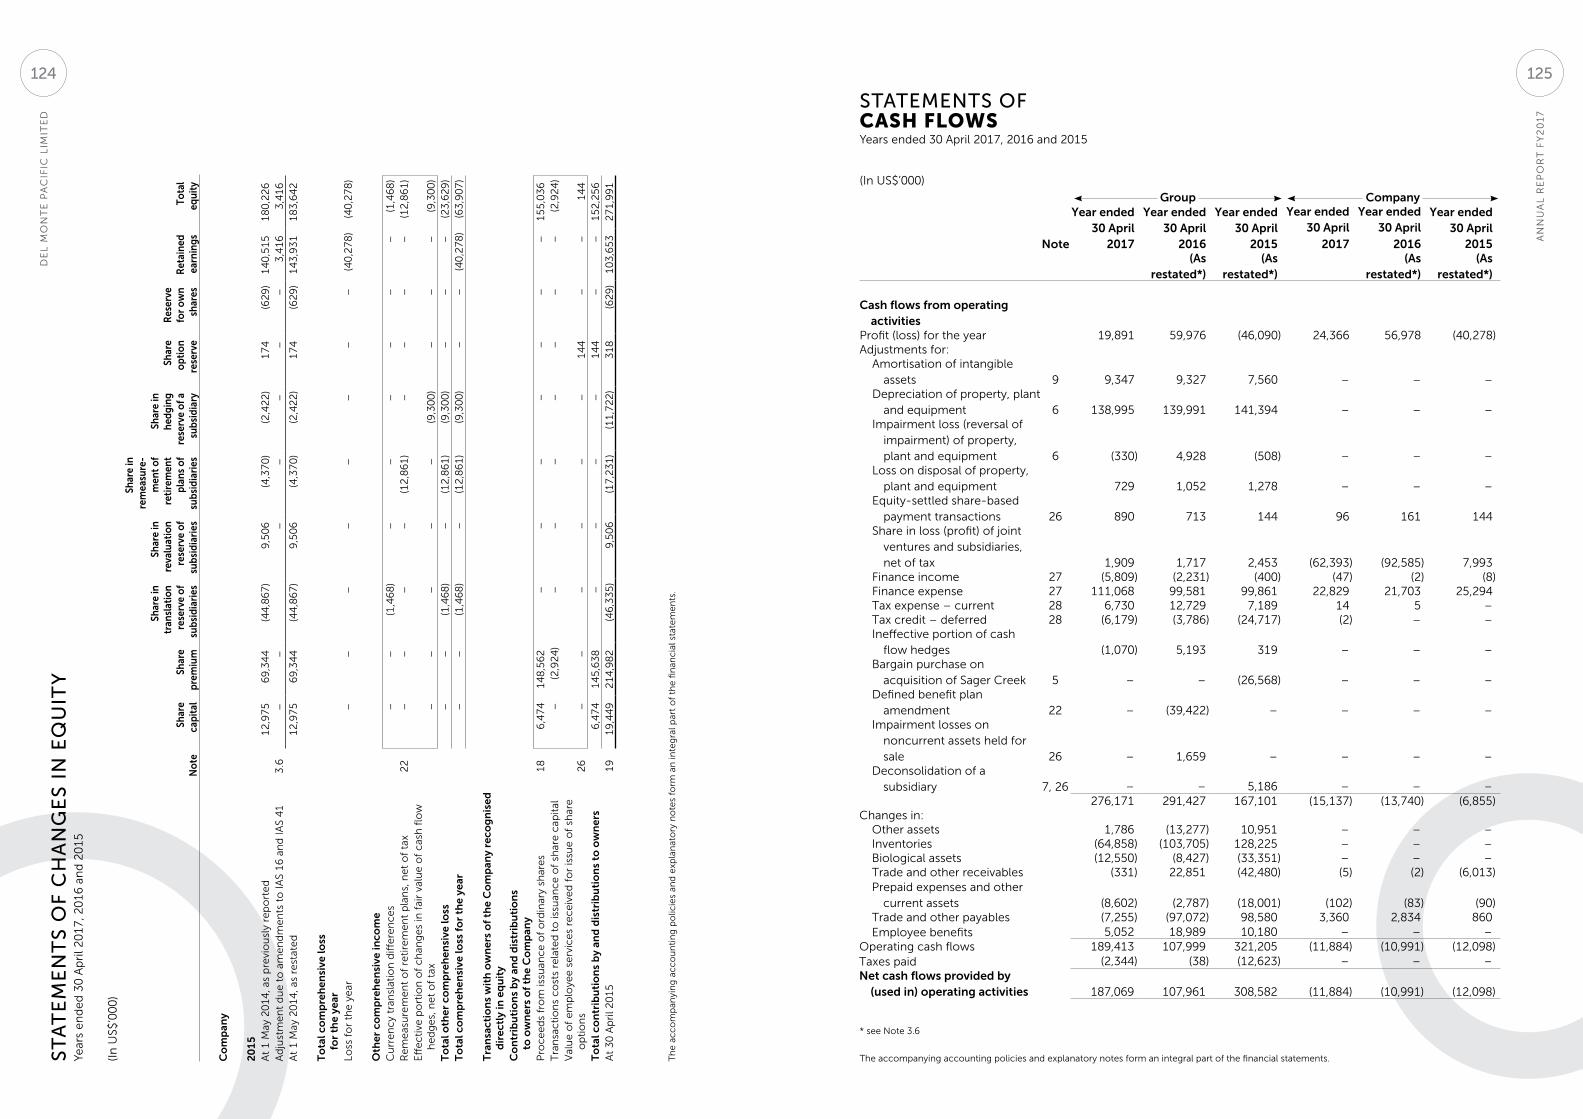
(In
US$
’00
0)
No
teSh
are
capi
tal
Shar
e pr
emiu
m
Shar
e in
tr
ansl
atio
n re
serv
e o
f su
bsid
iari
es
Shar
e in
re
valu
atio
n re
serv
e o
f su
bsid
iari
es
Shar
e in
re
mea
sure
-m
ent
of
reti
rem
ent
plan
s o
f su
bsid
iari
es
Shar
e in
he
dgin
g re
serv
e o
f a
subs
idia
ry
Shar
e
opt
ion
rese
rve
Res
erve
fo
r o
wn
shar
esR
etai
ned
earn
ings
Tota
l eq
uity
Co
mp
any
20
15
At
1 M
ay 2
01
4, a
s p
revi
ou
sly
rep
ort
ed
12
,97
56
9,3
44
(44
,86
7)
9,5
06
(4,3
70
)(2
,42
2)
17
4(6
29
)1
40
,51
51
80
,22
6A
dju
stm
en
t d
ue
to
am
en
dm
en
ts t
o IA
S 1
6 a
nd
IAS
41
3.6
––
–
–
–
––
3,4
16
3
,41
6
At
1 M
ay 2
01
4, a
s re
stat
ed
1
2,9
75
69
,34
4(4
4,8
67
)9
,50
6(4
,37
0)
(2,4
22
)1
74
(62
9)
14
3,9
31
1
83
,64
2
To
tal c
om
pre
hen
sive
loss
fo
r th
e ye
arLo
ss f
or
the
ye
ar–
––
––
––
– (
40
,27
8)
(4
0,2
78
)
Oth
er c
om
pre
hen
sive
inco
me
Cu
rre
nc
y tr
ansl
atio
n d
iffe
ren
ce
s–
–(1
,46
8)
––
––
––
(1,4
68
)R
em
eas
ure
me
nt
of
reti
rem
en
t p
lan
s, n
et
of
tax
22
––
––
(12
,86
1)
––
––
(12
,86
1)
Eff
ec
tive
po
rtio
n o
f c
han
ge
s in
fai
r va
lue
of
cas
h fl
ow
h
ed
ge
s, n
et
of
tax
––
––
–(9
,30
0)
––
–(9
,30
0)
To
tal o
ther
co
mp
reh
ensi
ve lo
ss–
–(1
,46
8)
–(1
2,8
61
)(9
,30
0)
––
–(2
3,6
29
)T
ota
l co
mp
reh
ensi
ve lo
ss f
or
the
year
––
(1,4
68
)–
(12
,86
1)
(9,3
00
)–
– (
40
,27
8)
(6
3,9
07
)
Tra
nsa
ctio
ns
wit
h o
wn
ers
of
the
Co
mp
any
reco
gn
ised
d
irec
tly
in e
qu
ity
Co
ntr
ibu
tio
ns
by
and
dis
trib
uti
on
s to
ow
ner
s o
f th
e C
om
pan
yP
roc
ee
ds
fro
m is
suan
ce
of
ord
inar
y sh
are
s1
86
,47
41
48
,56
2–
––
––
––
15
5,0
36
Tra
nsa
cti
on
s c
ost
s re
late
d t
o is
suan
ce
of
shar
e c
apit
al–
(2,9
24
)–
––
––
––
(2,9
24
)V
alu
e o
f e
mp
loye
e s
erv
ice
s re
ce
ive
d f
or
issu
e o
f sh
are
o
pti
on
s2
6–
––
––
–1
44
––
14
4T
ota
l co
ntr
ibu
tio
ns
by
and
dis
trib
uti
on
s to
ow
ner
s6
,47
41
45
,63
8–
––
–1
44
––
15
2,2
56
At
30
Ap
ril 2
01
51
91
9,4
49
21
4,9
82
(46
,33
5)
9,5
06
(17
,23
1)
(11
,72
2)
31
8(6
29
) 1
03
,65
3
27
1,9
91
Th
e a
cc
om
pan
yin
g a
cc
ou
nti
ng
po
licie
s an
d e
xpla
nat
ory
no
tes
form
an
inte
gra
l par
t o
f th
e fi
nan
cia
l sta
tem
en
ts.
ST
AT
EM
EN
TS
OF
CH
AN
GE
S I
N E
QU
ITY
Ye
ars
en
de
d 3
0 A
pri
l 20
17
, 20
16
an
d 2
01
5
(In US$’000)
Group Company
Note
Year ended 30 April
2017
Year ended 30 April
2016
Year ended 30 April
2015
Year ended 30 April
2017
Year ended 30 April
2016
Year ended 30 April
2015(As
restated*)(As
restated*)(As
restated*)(As
restated*)
Cash flows from operating activities
Profit (loss) for the year 19,891 59,976 (46,090) 24,366 56,978 (40,278)Adjustments for:
Amortisation of intangible assets 9 9,347 9,327 7,560 – – –
Depreciation of property, plant and equipment 6 138,995 139,991 141,394 – – –
Impairment loss (reversal of impairment) of property, plant and equipment 6 (330) 4,928 (508) – – –
Loss on disposal of property, plant and equipment 729 1,052 1,278 – – –
Equity-settled share-based payment transactions 26 890 713 144 96 161 144
Share in loss (profit) of joint ventures and subsidiaries, net of tax 1,909 1,717 2,453 (62,393) (92,585) 7,993
Finance income 27 (5,809) (2,231) (400) (47) (2) (8)Finance expense 27 111,068 99,581 99,861 22,829 21,703 25,294Tax expense – current 28 6,730 12,729 7,189 14 5 –Tax credit – deferred 28 (6,179) (3,786) (24,717) (2) – –Ineffective portion of cash
flow hedges (1,070) 5,193 319 – – –Bargain purchase on
acquisition of Sager Creek 5 – – (26,568) – – –Defined benefit plan
amendment 22 – (39,422) – – – –Impairment losses on
noncurrent assets held for sale 26 – 1,659 – – – –
Deconsolidation of a subsidiary 7, 26 – – 5,186 – – –
276,171 291,427 167,101 (15,137) (13,740) (6,855)Changes in:
Other assets 1,786 (13,277) 10,951 – – –Inventories (64,858) (103,705) 128,225 – – –Biological assets (12,550) (8,427) (33,351) – – –Trade and other receivables (331) 22,851 (42,480) (5) (2) (6,013)Prepaid expenses and other
current assets (8,602) (2,787) (18,001) (102) (83) (90)Trade and other payables (7,255) (97,072) 98,580 3,360 2,834 860Employee benefits 5,052 18,989 10,180 – – –
Operating cash flows 189,413 107,999 321,205 (11,884) (10,991) (12,098)Taxes paid (2,344) (38) (12,623) – – –Net cash flows provided by
(used in) operating activities 187,069 107,961 308,582 (11,884) (10,991) (12,098)
* see Note 3.6
STATEMENTS OF CASH FLOWS Years ended 30 April 2017, 2016 and 2015
The accompanying accounting policies and explanatory notes form an integral part of the financial statements.
AN
NU
AL
RE
PO
RT
FY
20
17
DE
L M
ON
TE
PA
CIF
IC L
IMIT
ED
125124
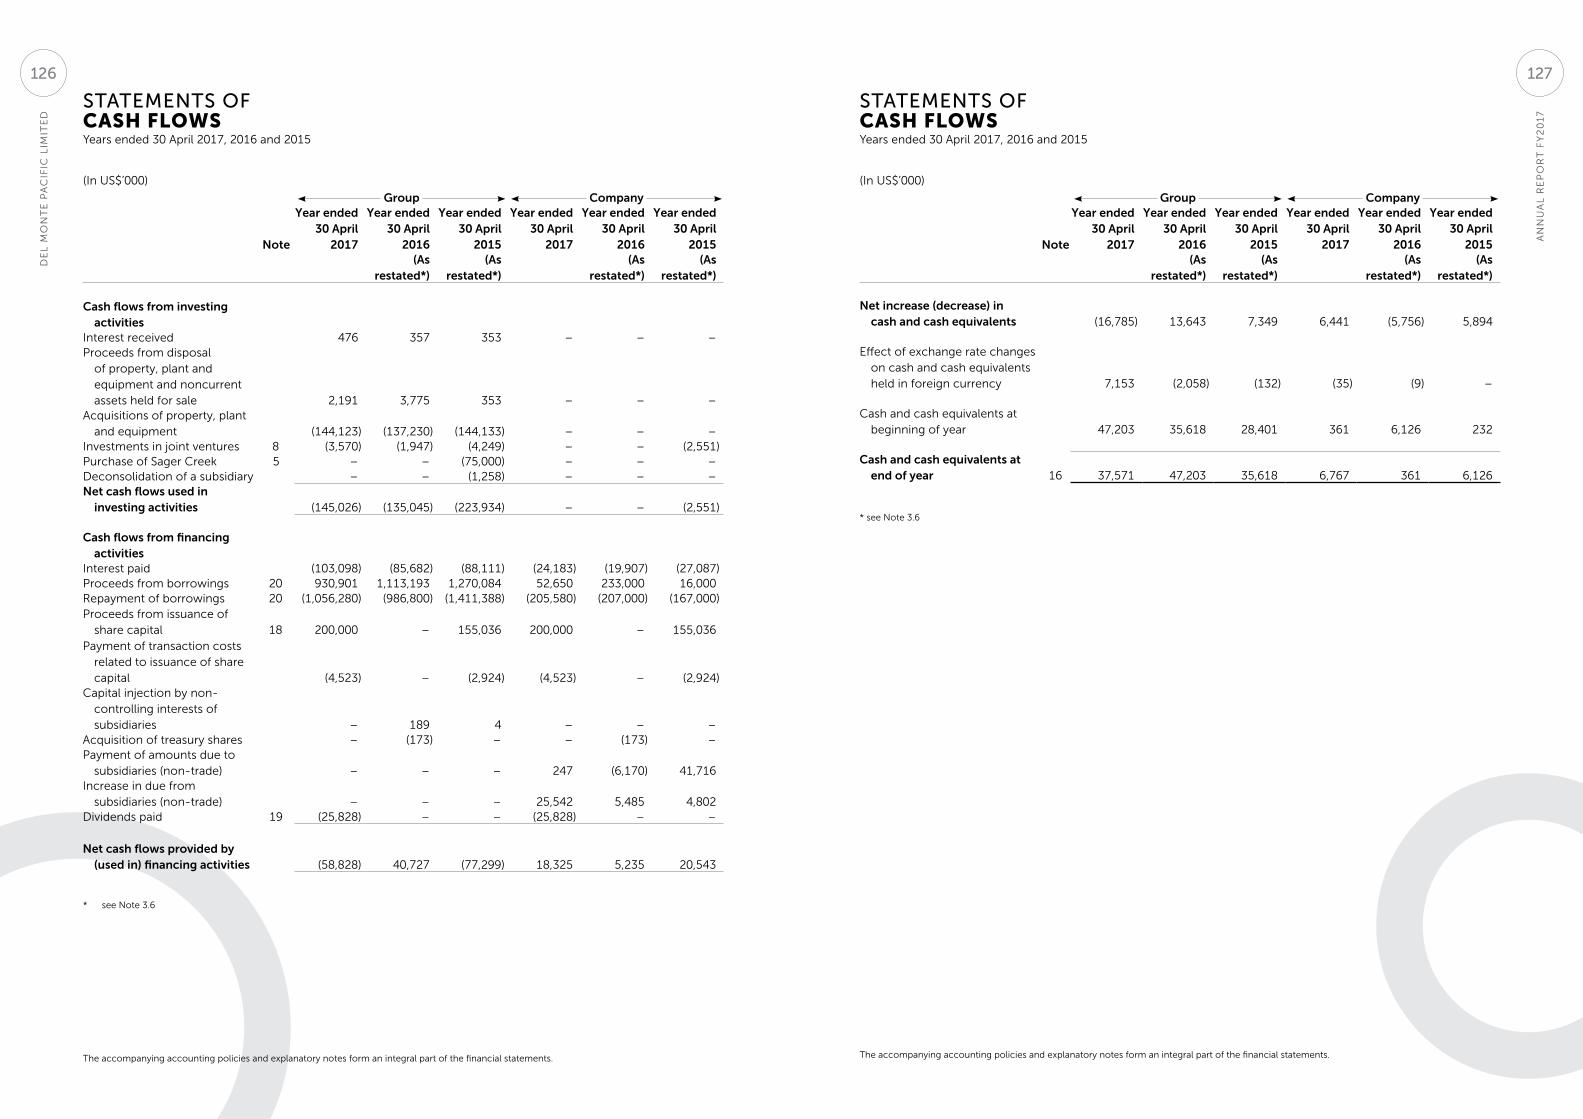
(In US$’000)
Group Company
Note
Year ended 30 April
2017
Year ended 30 April
2016
Year ended 30 April
2015
Year ended 30 April
2017
Year ended 30 April
2016
Year ended 30 April
2015(As
restated*)(As
restated*)(As
restated*)(As
restated*)
Cash flows from investing activities
Interest received 476 357 353 – – –Proceeds from disposal
of property, plant and equipment and noncurrent assets held for sale 2,191 3,775 353 – – –
Acquisitions of property, plant and equipment (144,123) (137,230) (144,133) – – –
Investments in joint ventures 8 (3,570) (1,947) (4,249) – – (2,551)Purchase of Sager Creek 5 – – (75,000) – – –Deconsolidation of a subsidiary – – (1,258) – – –Net cash flows used in
investing activities (145,026) (135,045) (223,934) – – (2,551)
Cash flows from financing activities
Interest paid (103,098) (85,682) (88,111) (24,183) (19,907) (27,087)Proceeds from borrowings 20 930,901 1,113,193 1,270,084 52,650 233,000 16,000Repayment of borrowings 20 (1,056,280) (986,800) (1,411,388) (205,580) (207,000) (167,000)Proceeds from issuance of
share capital 18 200,000 – 155,036 200,000 – 155,036Payment of transaction costs
related to issuance of share capital (4,523) – (2,924) (4,523) – (2,924)
Capital injection by non-controlling interests of subsidiaries – 189 4 – – –
Acquisition of treasury shares – (173) – – (173) –Payment of amounts due to
subsidiaries (non-trade) – – – 247 (6,170) 41,716Increase in due from
subsidiaries (non-trade) – – – 25,542 5,485 4,802Dividends paid 19 (25,828) – – (25,828) – –
Net cash flows provided by (used in) financing activities (58,828) 40,727 (77,299) 18,325 5,235 20,543
* see Note 3.6
STATEMENTS OF CASH FLOWS Years ended 30 April 2017, 2016 and 2015
The accompanying accounting policies and explanatory notes form an integral part of the financial statements.
(In US$’000)
Group Company
Note
Year ended 30 April
2017
Year ended 30 April
2016
Year ended 30 April
2015
Year ended 30 April
2017
Year ended 30 April
2016
Year ended 30 April
2015(As
restated*)(As
restated*)(As
restated*)(As
restated*)
Net increase (decrease) in cash and cash equivalents (16,785) 13,643 7,349 6,441 (5,756) 5,894
Effect of exchange rate changes on cash and cash equivalents held in foreign currency 7,153 (2,058) (132) (35) (9) –
Cash and cash equivalents at beginning of year 47,203 35,618 28,401 361 6,126 232
Cash and cash equivalents at end of year 16 37,571 47,203 35,618 6,767 361 6,126
* see Note 3.6
The accompanying accounting policies and explanatory notes form an integral part of the financial statements.
STATEMENTS OF CASH FLOWS Years ended 30 April 2017, 2016 and 2015
AN
NU
AL
RE
PO
RT
FY
20
17
DE
L M
ON
TE
PA
CIF
IC L
IMIT
ED
127126
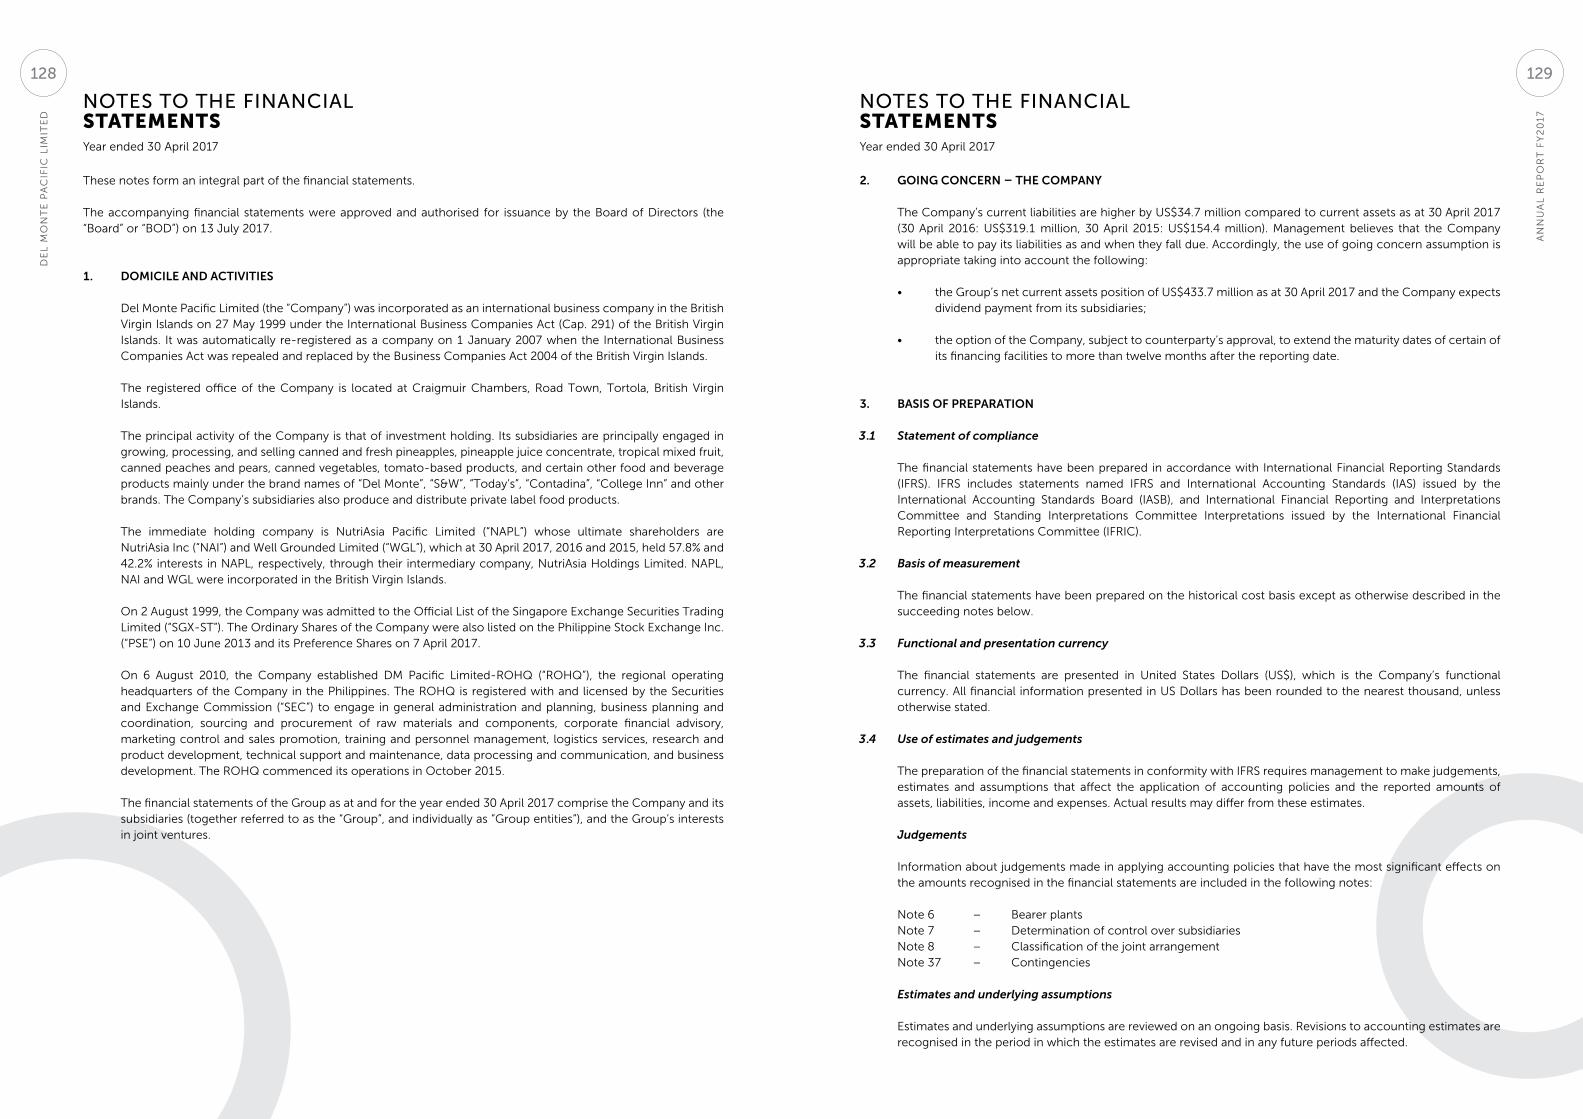
NOTES TO THE FINANCIAL STATEMENTS
NOTES TO THE FINANCIAL STATEMENTS
Year ended 30 April 2017 Year ended 30 April 2017
These notes form an integral part of the financial statements.
The accompanying financial statements were approved and authorised for issuance by the Board of Directors (the “Board” or “BOD”) on 13 July 2017.
1. DOMICILE AND ACTIVITIES
Del Monte Pacific Limited (the “Company”) was incorporated as an international business company in the British Virgin Islands on 27 May 1999 under the International Business Companies Act (Cap. 291) of the British Virgin Islands. It was automatically re-registered as a company on 1 January 2007 when the International Business Companies Act was repealed and replaced by the Business Companies Act 2004 of the British Virgin Islands.
The registered office of the Company is located at Craigmuir Chambers, Road Town, Tortola, British Virgin Islands.
The principal activity of the Company is that of investment holding. Its subsidiaries are principally engaged in growing, processing, and selling canned and fresh pineapples, pineapple juice concentrate, tropical mixed fruit, canned peaches and pears, canned vegetables, tomato-based products, and certain other food and beverage products mainly under the brand names of “Del Monte”, “S&W”, “Today’s”, “Contadina”, “College Inn” and other brands. The Company’s subsidiaries also produce and distribute private label food products.
The immediate holding company is NutriAsia Pacific Limited (“NAPL”) whose ultimate shareholders are NutriAsia Inc (“NAI”) and Well Grounded Limited (“WGL”), which at 30 April 2017, 2016 and 2015, held 57.8% and 42.2% interests in NAPL, respectively, through their intermediary company, NutriAsia Holdings Limited. NAPL, NAI and WGL were incorporated in the British Virgin Islands.
On 2 August 1999, the Company was admitted to the Official List of the Singapore Exchange Securities Trading Limited (“SGX-ST”). The Ordinary Shares of the Company were also listed on the Philippine Stock Exchange Inc. (“PSE”) on 10 June 2013 and its Preference Shares on 7 April 2017. On 6 August 2010, the Company established DM Pacific Limited-ROHQ (“ROHQ”), the regional operating headquarters of the Company in the Philippines. The ROHQ is registered with and licensed by the Securities and Exchange Commission (“SEC”) to engage in general administration and planning, business planning and coordination, sourcing and procurement of raw materials and components, corporate financial advisory, marketing control and sales promotion, training and personnel management, logistics services, research and product development, technical support and maintenance, data processing and communication, and business development. The ROHQ commenced its operations in October 2015.
The financial statements of the Group as at and for the year ended 30 April 2017 comprise the Company and its subsidiaries (together referred to as the “Group”, and individually as ”Group entities”), and the Group’s interests in joint ventures.
2. GOING CONCERN – THE COMPANY
The Company’s current liabilities are higher by US$34.7 million compared to current assets as at 30 April 2017 (30 April 2016: US$319.1 million, 30 April 2015: US$154.4 million). Management believes that the Company will be able to pay its liabilities as and when they fall due. Accordingly, the use of going concern assumption is appropriate taking into account the following:
• the Group’s net current assets position of US$433.7 million as at 30 April 2017 and the Company expects dividend payment from its subsidiaries;
• the option of the Company, subject to counterparty’s approval, to extend the maturity dates of certain of its financing facilities to more than twelve months after the reporting date.
3. BASIS OF PREPARATION
3.1 Statement of compliance
The financial statements have been prepared in accordance with International Financial Reporting Standards (IFRS). IFRS includes statements named IFRS and International Accounting Standards (IAS) issued by the International Accounting Standards Board (IASB), and International Financial Reporting and Interpretations Committee and Standing Interpretations Committee Interpretations issued by the International Financial Reporting Interpretations Committee (IFRIC).
3.2 Basis of measurement
The financial statements have been prepared on the historical cost basis except as otherwise described in the succeeding notes below.
3.3 Functional and presentation currency
The financial statements are presented in United States Dollars (US$), which is the Company’s functional currency. All financial information presented in US Dollars has been rounded to the nearest thousand, unless otherwise stated.
3.4 Use of estimates and judgements
The preparation of the financial statements in conformity with IFRS requires management to make judgements, estimates and assumptions that affect the application of accounting policies and the reported amounts of assets, liabilities, income and expenses. Actual results may differ from these estimates.
Judgements
Information about judgements made in applying accounting policies that have the most significant effects on the amounts recognised in the financial statements are included in the following notes:
Note 6 – Bearer plantsNote 7 – Determination of control over subsidiariesNote 8 – Classification of the joint arrangementNote 37 – Contingencies
Estimates and underlying assumptions
Estimates and underlying assumptions are reviewed on an ongoing basis. Revisions to accounting estimates are recognised in the period in which the estimates are revised and in any future periods affected.
AN
NU
AL
RE
PO
RT
FY
20
17
DE
L M
ON
TE
PA
CIF
IC L
IMIT
ED
129128
NOTES TO THE FINANCIAL STATEMENTS
NOTES TO THE FINANCIAL STATEMENTS
Year ended 30 April 2017 Year ended 30 April 2017
3. BASIS OF PREPARATION (CONT’D)
3.4 Use of estimates and judgements (cont’d)
Estimates and underlying assumptions (cont’d)
Information about assumptions and estimation uncertainties that have a significant risk resulting in a material adjustment within the next financial year are included in the following notes:
Note 6 – Useful lives of property, plant and equipment, revaluation of freehold land, estimate of yield for bearer plant's depreciation for bearer plant’s depreciation
Note 7 – Recoverability of investments in subsidiariesNote 8 – Recoverability of investments in joint venturesNote 9 – Useful lives of intangible assets and impairment of goodwill and intangible assets Note 10 – Realisability of deferred tax assetsNote 12 – Future cost of growing crops and fair value of livestock, harvested crops, and produce prior
to harvestNote 13 – Allowance for inventory obsolescence and net realisable valueNote 14 – Impairment of trade receivablesNote 22 – Measurement of employee benefit obligationsNote 24 – Estimation of trade promotion accrualsNote 23 – Estimation of environmental remediation liabilitiesNote 28 – Measurement of taxNote 35 – Determination of fair valuesNote 37 – Contingencies
3.5 Measurement of fair value
Fair value is the price that would be received to sell an asset or paid to transfer a liability in an orderly transaction between market participants at the measurement date. The fair value is based on the presumption that the transaction to sell the asset or transfer the liability takes place either in the principal market for the asset or liability or in the most advantageous market for the asset or liability. The principal or most advantageous market must be accessible to the Group.
The fair value of an asset or liability is measured using the assumptions that market participants would use when pricing the asset or liability, assuming that market participants act in their economic best interest.
The Group uses valuation techniques that are appropriate in the circumstances and for which sufficient data are available to measure fair value, maximising the use of relevant observable inputs and minimising the use of unobservable inputs.
All assets and liabilities for which fair value is measured or disclosed in the financial statements are categorised within the fair value hierarchy, described as follows, based on the lowest level input that is significant to the fair value measurement as a whole:
• Level 1: quoted prices (unadjusted) in active markets for identical assets or liabilities that the Group can access at the measurement date.
• Level 2: inputs other than quoted prices included within Level 1 that are observable for the asset or liability, either directly or indirectly.
• Level 3: unobservable inputs for the asset or liability.
3. BASIS OF PREPARATION (CONT’D)
3.5 Measurement of fair value (cont’d)
If the inputs used to measure the fair value of an asset or a liability fall into different levels of the fair value hierarchy, then the fair value measurement is categorised in its entirety in the same level of the fair value hierarchy as the lowest level input that is significant to the entire measurement.
The Group recognises transfers between levels of the fair value hierarchy at the end of the reporting period during which the change has occurred.
3.6 Adoption of New or Revised Standards, Amendments to Standards and Interpretations
The Group has adopted the following standards, amendments to standards, including any consequential amendments to other standards, and interpretations with a date of initial application of 1 May 2016. The adoption of these new standards, amendments to standards, and interpretations has no significant impact to the Group unless otherwise stated.
Amendments to IAS 16, Property, Plant, and Equipment and IAS 41, Agriculture: Bearer Plants. The amendments change the accounting requirements for biological assets that meet the definition of bearer plants. Under the amendments, biological assets that meet the definition of bearer plants will no longer be within the scope of IAS 41. Instead, IAS 16 will apply. After initial recognition, bearer plants will be measured under IAS 16 at accumulated cost (before maturity) and using either the cost model or revaluation model (after maturity). The amendments also require that produce that grows on bearer plants will remain in the scope of IAS 41 measured at fair value less costs to sell. In previous financial years, the Group has accounted for bearer plants at cost reduced by the estimated cost of harvested produce, and their agricultural produce at fair value less estimated point of sale costs at the point of harvest.
The Group has assessed that the pineapple crops qualify as bearer plants. Accordingly, the Group applied the requirements of the amendments. The restatements and reclassification of accounts were applied on a retrospective basis and comparative amounts for fiscal years 2016 and 2015 have been restated to reflect the changes in accounting policies.
AN
NU
AL
RE
PO
RT
FY
20
17
DE
L M
ON
TE
PA
CIF
IC L
IMIT
ED
131130
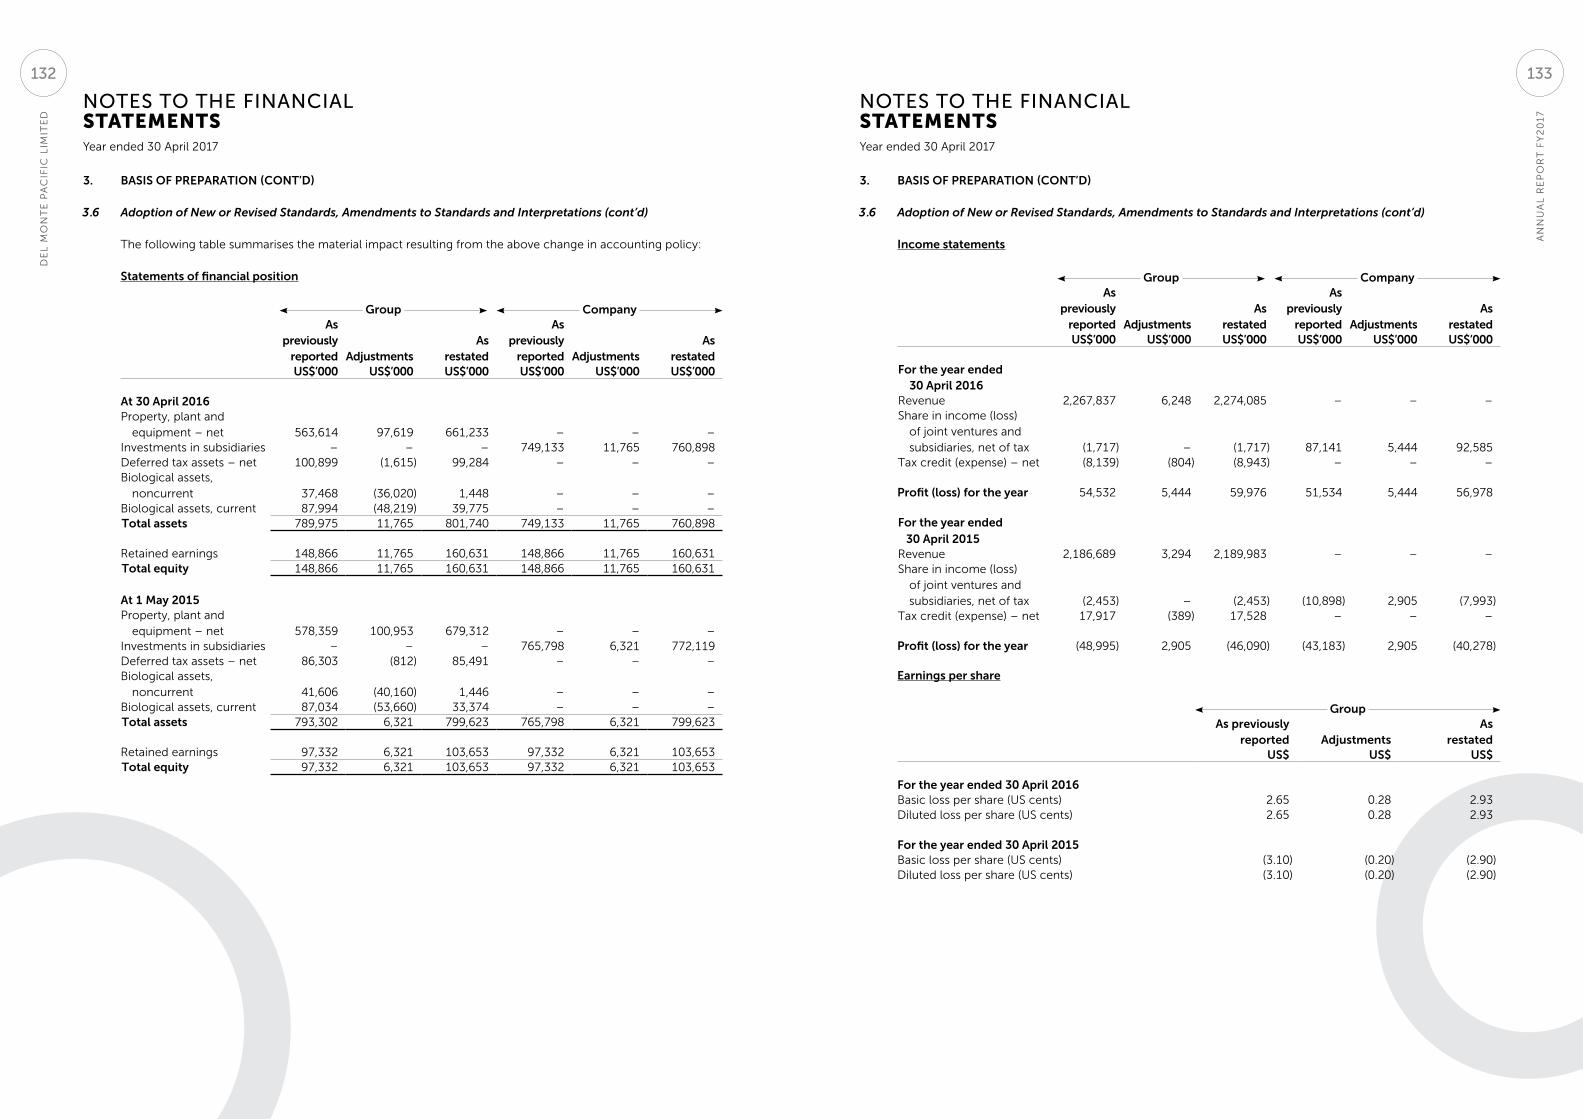
NOTES TO THE FINANCIAL STATEMENTS
NOTES TO THE FINANCIAL STATEMENTS
Year ended 30 April 2017 Year ended 30 April 2017
3. BASIS OF PREPARATION (CONT’D)
3.6 Adoption of New or Revised Standards, Amendments to Standards and Interpretations (cont’d)
The following table summarises the material impact resulting from the above change in accounting policy:
Statements of financial position
Group Company As
previously reported Adjustments
As restated
As previously
reported AdjustmentsAs
restatedUS$’000 US$’000 US$’000 US$’000 US$’000 US$’000
At 30 April 2016Property, plant and
equipment – net 563,614 97,619 661,233 – – –Investments in subsidiaries – – – 749,133 11,765 760,898Deferred tax assets – net 100,899 (1,615) 99,284 – – –Biological assets,
noncurrent 37,468 (36,020) 1,448 – – –Biological assets, current 87,994 (48,219) 39,775 – – –Total assets 789,975 11,765 801,740 749,133 11,765 760,898
Retained earnings 148,866 11,765 160,631 148,866 11,765 160,631Total equity 148,866 11,765 160,631 148,866 11,765 160,631
At 1 May 2015Property, plant and
equipment – net 578,359 100,953 679,312 – – –Investments in subsidiaries – – – 765,798 6,321 772,119Deferred tax assets – net 86,303 (812) 85,491 – – –Biological assets,
noncurrent 41,606 (40,160) 1,446 – – –Biological assets, current 87,034 (53,660) 33,374 – – –Total assets 793,302 6,321 799,623 765,798 6,321 799,623
Retained earnings 97,332 6,321 103,653 97,332 6,321 103,653Total equity 97,332 6,321 103,653 97,332 6,321 103,653
3. BASIS OF PREPARATION (CONT’D)
3.6 Adoption of New or Revised Standards, Amendments to Standards and Interpretations (cont’d)
Income statements
Group Company As
previously reported Adjustments
As restated
As previously
reported AdjustmentsAs
restatedUS$’000 US$’000 US$’000 US$’000 US$’000 US$’000
For the year ended 30 April 2016
Revenue 2,267,837 6,248 2,274,085 – – –Share in income (loss)
of joint ventures and subsidiaries, net of tax (1,717) – (1,717) 87,141 5,444 92,585
Tax credit (expense) – net (8,139) (804) (8,943) – – –
Profit (loss) for the year 54,532 5,444 59,976 51,534 5,444 56,978
For the year ended 30 April 2015
Revenue 2,186,689 3,294 2,189,983 – – –Share in income (loss)
of joint ventures and subsidiaries, net of tax (2,453) – (2,453) (10,898) 2,905 (7,993)
Tax credit (expense) – net 17,917 (389) 17,528 – – –
Profit (loss) for the year (48,995) 2,905 (46,090) (43,183) 2,905 (40,278)
Earnings per share
Group As previously
reported AdjustmentsAs
restatedUS$ US$ US$
For the year ended 30 April 2016Basic loss per share (US cents) 2.65 0.28 2.93Diluted loss per share (US cents) 2.65 0.28 2.93
For the year ended 30 April 2015Basic loss per share (US cents) (3.10) (0.20) (2.90)Diluted loss per share (US cents) (3.10) (0.20) (2.90)
AN
NU
AL
RE
PO
RT
FY
20
17
DE
L M
ON
TE
PA
CIF
IC L
IMIT
ED
133132
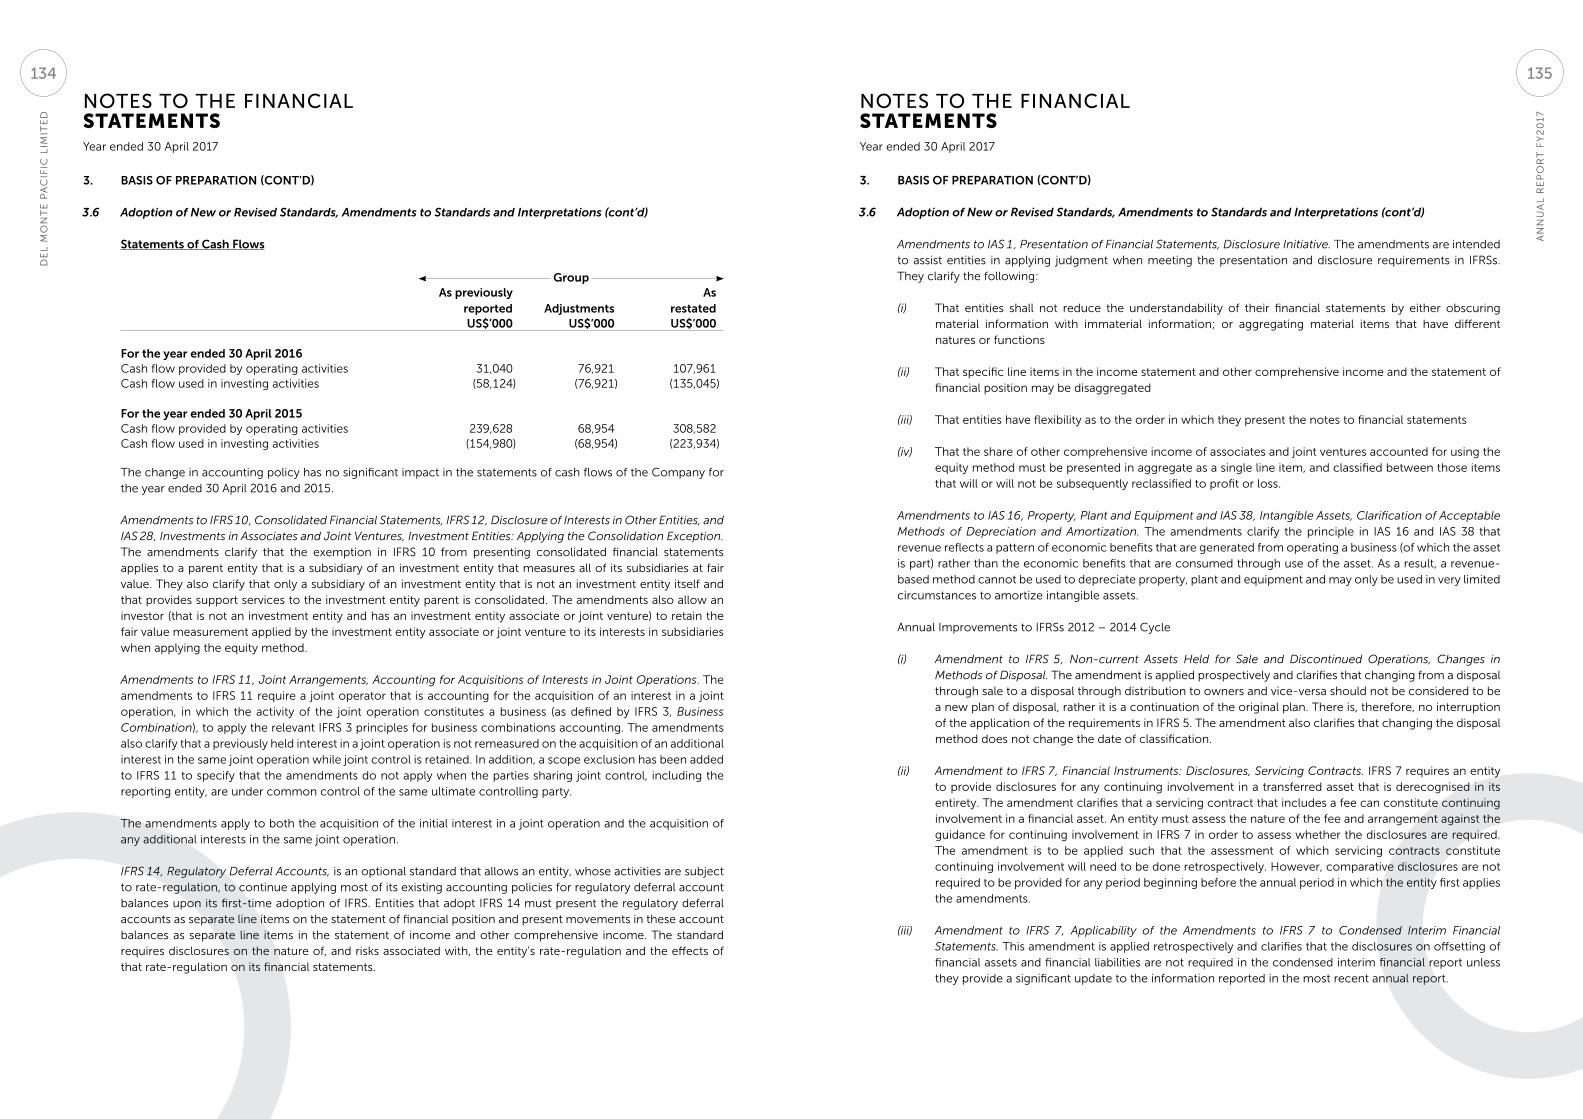
NOTES TO THE FINANCIAL STATEMENTS
NOTES TO THE FINANCIAL STATEMENTS
Year ended 30 April 2017 Year ended 30 April 2017
3. BASIS OF PREPARATION (CONT’D)
3.6 Adoption of New or Revised Standards, Amendments to Standards and Interpretations (cont’d)
Statements of Cash Flows
Group As previously
reported AdjustmentsAs
restatedUS$’000 US$’000 US$’000
For the year ended 30 April 2016Cash flow provided by operating activities 31,040 76,921 107,961Cash flow used in investing activities (58,124) (76,921) (135,045)
For the year ended 30 April 2015Cash flow provided by operating activities 239,628 68,954 308,582Cash flow used in investing activities (154,980) (68,954) (223,934)
The change in accounting policy has no significant impact in the statements of cash flows of the Company for the year ended 30 April 2016 and 2015.
Amendments to IFRS 10, Consolidated Financial Statements, IFRS 12, Disclosure of Interests in Other Entities, and IAS 28, Investments in Associates and Joint Ventures, Investment Entities: Applying the Consolidation Exception. The amendments clarify that the exemption in IFRS 10 from presenting consolidated financial statements applies to a parent entity that is a subsidiary of an investment entity that measures all of its subsidiaries at fair value. They also clarify that only a subsidiary of an investment entity that is not an investment entity itself and that provides support services to the investment entity parent is consolidated. The amendments also allow an investor (that is not an investment entity and has an investment entity associate or joint venture) to retain the fair value measurement applied by the investment entity associate or joint venture to its interests in subsidiaries when applying the equity method.
Amendments to IFRS 11, Joint Arrangements, Accounting for Acquisitions of Interests in Joint Operations. The amendments to IFRS 11 require a joint operator that is accounting for the acquisition of an interest in a joint operation, in which the activity of the joint operation constitutes a business (as defined by IFRS 3, Business Combination), to apply the relevant IFRS 3 principles for business combinations accounting. The amendments also clarify that a previously held interest in a joint operation is not remeasured on the acquisition of an additional interest in the same joint operation while joint control is retained. In addition, a scope exclusion has been added to IFRS 11 to specify that the amendments do not apply when the parties sharing joint control, including the reporting entity, are under common control of the same ultimate controlling party.
The amendments apply to both the acquisition of the initial interest in a joint operation and the acquisition of any additional interests in the same joint operation.
IFRS 14, Regulatory Deferral Accounts, is an optional standard that allows an entity, whose activities are subject to rate-regulation, to continue applying most of its existing accounting policies for regulatory deferral account balances upon its first-time adoption of IFRS. Entities that adopt IFRS 14 must present the regulatory deferral accounts as separate line items on the statement of financial position and present movements in these account balances as separate line items in the statement of income and other comprehensive income. The standard requires disclosures on the nature of, and risks associated with, the entity’s rate-regulation and the effects of that rate-regulation on its financial statements.
3. BASIS OF PREPARATION (CONT’D)
3.6 Adoption of New or Revised Standards, Amendments to Standards and Interpretations (cont’d)
Amendments to IAS 1, Presentation of Financial Statements, Disclosure Initiative. The amendments are intended to assist entities in applying judgment when meeting the presentation and disclosure requirements in IFRSs. They clarify the following:
(i) That entities shall not reduce the understandability of their financial statements by either obscuring material information with immaterial information; or aggregating material items that have different natures or functions
(ii) That specific line items in the income statement and other comprehensive income and the statement of financial position may be disaggregated
(iii) That entities have flexibility as to the order in which they present the notes to financial statements
(iv) That the share of other comprehensive income of associates and joint ventures accounted for using the equity method must be presented in aggregate as a single line item, and classified between those items that will or will not be subsequently reclassified to profit or loss.
Amendments to IAS 16, Property, Plant and Equipment and IAS 38, Intangible Assets, Clarification of Acceptable Methods of Depreciation and Amortization. The amendments clarify the principle in IAS 16 and IAS 38 that revenue reflects a pattern of economic benefits that are generated from operating a business (of which the asset is part) rather than the economic benefits that are consumed through use of the asset. As a result, a revenue-based method cannot be used to depreciate property, plant and equipment and may only be used in very limited circumstances to amortize intangible assets.
Annual Improvements to IFRSs 2012 – 2014 Cycle
(i) Amendment to IFRS 5, Non-current Assets Held for Sale and Discontinued Operations, Changes in Methods of Disposal. The amendment is applied prospectively and clarifies that changing from a disposal through sale to a disposal through distribution to owners and vice-versa should not be considered to be a new plan of disposal, rather it is a continuation of the original plan. There is, therefore, no interruption of the application of the requirements in IFRS 5. The amendment also clarifies that changing the disposal method does not change the date of classification.
(ii) Amendment to IFRS 7, Financial Instruments: Disclosures, Servicing Contracts. IFRS 7 requires an entity to provide disclosures for any continuing involvement in a transferred asset that is derecognised in its entirety. The amendment clarifies that a servicing contract that includes a fee can constitute continuing involvement in a financial asset. An entity must assess the nature of the fee and arrangement against the guidance for continuing involvement in IFRS 7 in order to assess whether the disclosures are required. The amendment is to be applied such that the assessment of which servicing contracts constitute continuing involvement will need to be done retrospectively. However, comparative disclosures are not required to be provided for any period beginning before the annual period in which the entity first applies the amendments.
(iii) Amendment to IFRS 7, Applicability of the Amendments to IFRS 7 to Condensed Interim Financial Statements. This amendment is applied retrospectively and clarifies that the disclosures on offsetting of financial assets and financial liabilities are not required in the condensed interim financial report unless they provide a significant update to the information reported in the most recent annual report.
AN
NU
AL
RE
PO
RT
FY
20
17
DE
L M
ON
TE
PA
CIF
IC L
IMIT
ED
135134
NOTES TO THE FINANCIAL STATEMENTS
NOTES TO THE FINANCIAL STATEMENTS
Year ended 30 April 2017 Year ended 30 April 2017
3. BASIS OF PREPARATION (CONT’D)
3.6 Adoption of New or Revised Standards, Amendments to Standards and Interpretations (cont’d)
(iv) Amendment to IAS 19, Employee Benefits, Discount Rate: Regional Market Issue. This amendment is applied prospectively and clarifies that market depth of high quality corporate bonds is assessed based on the currency in which the obligation is denominated, rather than the country where the obligation is located. When there is no deep market for high quality corporate bonds in that currency, government bond rates must be used.
(v) Amendment to IAS 34, Interim Financial Reporting, Disclosure of Information ‘Elsewhere in the Interim Financial Report’. The amendment is applied retrospectively and clarifies that the required interim disclosures must either be in the interim financial statements or incorporated by cross-reference between the interim financial statements and wherever they are included within the greater interim financial report (e.g., in the management commentary or risk report).
4. SIGNIFICANT ACCOUNTING POLICIES
The accounting policies set out below have been applied consistently to all periods presented in these financial statements, and have been applied consistently by Group entities, except as explained in Note 3.6, which addresses the changes in accounting policies.
4.1 Basis of consolidation
(i) Business combination
Business combinations are accounted for using the acquisition method in accordance with IFRS 3 as at the acquisition date, which is the date on which control is transferred to the Group.
The Group measures goodwill at the acquisition date as:
• the fair value of consideration transferred; plus
• the recognised amount of any non-controlling interests in the acquiree; plus
• if the business combination is achieved in stages, the fair value of the pre-existing equity interest in the acquiree,
over the net recognised amount (generally fair value) of the identifiable assets acquired and liabilities assumed. Any goodwill that arises is tested annually for impairment.
When the excess is negative, a bargain purchase gain is recognised immediately in the income statement.
The consideration transferred does not include amounts related to the settlement of pre-existing relationships. Such amounts are generally recognised in the income statement.
Any contingent consideration payable is recognised at fair value at the acquisition date and included in the consideration transferred. If the contingent consideration is classified as equity, it is not remeasured and settlement is accounted for within equity. Otherwise, subsequent changes to the fair value of the contingent consideration are recognised in the income statement.
4. SIGNIFICANT ACCOUNTING POLICIES (CONT’D)
4.1 Basis of consolidation (cont’d)
(i) Business combination (cont’d)
Non-controlling interests that are present ownership interests and entitle their holders to a proportionate share of the acquiree’s net assets in the event of liquidation are measured either at fair value or at the non-controlling interests’ proportionate share of the recognised amounts of the acquiree’s identifiable net assets, at the acquisition date. The measurement basis taken is elected on a transaction-by-transaction basis. All other components of non-controlling interests are measured at acquisition-date fair value unless another measurement is required by another standard.
Costs related to the acquisition, other than those associated with the issue of debt or equity securities, that the Group incurs in connection with a business combination are expensed as incurred.
If the initial accounting for a business combination is incomplete by the end of the reporting period it occurs, provisional amounts for the items for which the accounting is incomplete is reported in the financial statements. During the measurement period, which is not more than one year from acquisition date, the provisional amounts recognised are retrospectively adjusted, and any additional assets or liabilities recognised, to reflect new information obtained about facts and circumstances that existed as of the acquisition date. Comparative information for prior periods are revised, as needed.
The Group acquired Sager Creek Vegetable Company’s vegetable business in March 2015 (see Note 5).
Changes in the Group’s interest in a subsidiary that do not result in a loss of control are accounted for as transactions with owners in their capacity as owners and therefore no adjustments are made to goodwill and no gain or loss is recognised in the income statement. Adjustments to non-controlling interests arising from transactions that do not involve the loss of control are based on a proportionate amount of the net assets of the subsidiary.
(ii) Investments in subsidiaries
Subsidiaries are entities controlled by the Group. Control is achieved when the Company is exposed, or has rights, to variable returns from its involvement with the investee and has the ability to affect those returns through power over the investee. Specifically, the Company controls an investee if and only if the Company has:
• power over the investee (i.e. existing rights that give the current ability to direct the relevant activities of the investee);
• exposure, or rights, to variable returns from its involvement with the investee; and• the ability to use its power over the investee to affect its returns.
When the Company has less than majority of the voting rights or similar rights to an investee, the Company considers all relevant facts and circumstances in assessing whether it has power over an investee, including:
• the contractual arrangement with the other vote holders of the investee;• rights arising from other contractual arrangements; and• the Company’s voting rights and potential voting rights.
AN
NU
AL
RE
PO
RT
FY
20
17
DE
L M
ON
TE
PA
CIF
IC L
IMIT
ED
137136
NOTES TO THE FINANCIAL STATEMENTS
NOTES TO THE FINANCIAL STATEMENTS
Year ended 30 April 2017 Year ended 30 April 2017
4. SIGNIFICANT ACCOUNTING POLICIES (CONT’D)
4.1 Basis of consolidation (cont’d)
(ii) Investments in subsidiaries (cont’d)
The Company re-assesses whether or not it controls an investee if facts and circumstances indicate that there are changes to one or more of the three elements of control. Subsidiaries are fully consolidated from the date control is transferred to the Company and cease to be consolidated from the date control is transferred out of the Company. Assets, liabilities, income and expenses of a subsidiary acquired or disposed of during the year are included in the income statement from the date the Company gains control until the date the Company ceases to control the subsidiary.
Profit or loss and each component of other comprehensive income are attributed to the equity holders of the Company and to the non-controlling interests, even if this results in the non-controlling interests having a deficit balance. When necessary, adjustments are made to the financial statements of subsidiaries to bring their accounting policies into line with the Company’s accounting policies. All intra-group assets and liabilities, equity, income expenses and cash flows relating to transactions between members of the Company are eliminated in full on consolidation.
(iii) Acquisition under common control
The formation of the Group in 1999 was accounted for as a reorganisation of companies under common control using merger accounting. The financial statements therefore reflect the combined financial statements of all companies that form the Group as if they were a Group for all periods presented. The assets and liabilities of Del Monte Pacific Resources Limited and its subsidiaries contributed to the Company have been reflected at predecessor cost in these financial statements.
(iv) Loss of control
When the Group loses control over a subsidiary, it derecognises the assets and liabilities of the subsidiary, and any related non-controlling interest and other components of equity. Any resulting gain or loss is recognised in the income statement.
(v) Goodwill
Goodwill that arises upon the acquisition of subsidiaries is included in intangible assets. For the measurement of goodwill on initial recognition, see Note 5.
Subsequent measurement
Goodwill is measured at cost less accumulated impairment losses. In respect of the joint ventures, the carrying amount of goodwill is included in the carrying amount of the investment, and an impairment loss on such an investment is not allocated to any asset, including goodwill, that forms part of the carrying amount of the joint ventures.
Impairment of goodwill is discussed in Note 4.10.
4. SIGNIFICANT ACCOUNTING POLICIES (CONT’D)
4.1 Basis of consolidation (cont’d)
(vi) Investments in joint ventures
Joint ventures are those entities in which the Group has joint control, whereby the Group has rights to the net assets of the arrangement, rather than rights to its assets and obligations for its liabilities. Joint control is the contractually sharing of control of an arrangement, which exists only when decisions about the relevant activities require unanimous consent of the parties sharing control.
The considerations made in determining significant influence or joint control are similar to those necessary to determine control over subsidiaries.Investments in joint ventures are accounted for using the equity method. They are recognised initially at cost, which includes transactions costs. Subsequent to the initial recognition, the financial statements include the Group’s share of profit or loss and other comprehensive income of the joint ventures, after adjustments to align the accounting policies with those of the Group, from the date that significant influence or joint control commences until the date that significant influence or joint control ceases. When the Group’s share of losses exceeds its interest in joint ventures, the carrying amount of the investment, together with any long-term interests that form part thereof, is reduced to zero, and the recognition of further losses is discontinued except to the extent that the Group has an obligation to fund the investee’s operations or has made payments on behalf of the investee.
(vii) Transactions eliminated on consolidation
Intra-group balances and transactions, and any unrealised income or expenses arising from intra-group transactions, are eliminated in preparing the financial statements. Unrealised gains arising from transactions with joint ventures are eliminated against the investment to the extent of the Group’s interest in the investee. Unrealised losses are eliminated in the same way as unrealised gains, but only to the extent that there is no evidence of impairment.
(viii) Investments in subsidiaries and joint ventures in the separate financial statements
Interest in subsidiaries and joint ventures are accounted for using the equity method. In 2016, the Company early adopted the amendments to IAS 27, Equity Method in Separate Financial Statements. It is initially recognised at cost, which includes transactions costs. Subsequent to the initial recognition, the financial statements include the Company’s share of profit or loss and other comprehensive income of the equity-accounted investee. Unrealised losses are eliminated in the same way as unrealised gains, but only to the extent that there is no evidence of impairment.
When the Company’s share of losses exceeds its interest in subsidiaries and joint ventures, the carrying amount of the investment, together with any long-term interests that form part thereof, is reduced to zero, and the recognition of further losses is discontinued except to the extent that the Company has an obligation to fund the investee’s operations or has made payments on behalf of the investee.
AN
NU
AL
RE
PO
RT
FY
20
17
DE
L M
ON
TE
PA
CIF
IC L
IMIT
ED
139138
NOTES TO THE FINANCIAL STATEMENTS
NOTES TO THE FINANCIAL STATEMENTS
Year ended 30 April 2017 Year ended 30 April 2017
4. SIGNIFICANT ACCOUNTING POLICIES (CONT’D)
4.2 Foreign currency
(i) Foreign currency transactions
Transactions in foreign currencies are translated to the respective functional currencies of Group entities at the exchange rate at the dates of the transactions. Monetary assets and liabilities denominated in foreign currencies at the reporting date are retranslated to the functional currency at the exchange rate at that date. The foreign currency gain or loss on monetary items is the difference between amortised cost in the functional currency at the beginning of the year, adjusted for effective interest and payments during the year, and the amortised cost in foreign currency translated at the exchange rate at the end of the year.
Non-monetary assets and liabilities denominated in foreign currencies that are measured at fair value are retranslated to the functional currency at the exchange rate at the date that the fair value was determined. Non-monetary items in a foreign currency that are measured in terms of historical cost are translated using the exchange rate at the date of the transaction. Foreign currency differences arising on retranslation are recognised in the income statement, except for differences which are recognised in (OCI) arising on the retranslation of qualifying cash flow hedges to the extent the hedge is effective.
(ii) Foreign operations
The assets and liabilities of foreign operations, including goodwill and fair value adjustments arising on acquisition, are translated to US Dollars at exchange rates at the reporting date. The income and expenses of foreign operations are translated to US Dollars using monthly average exchange rates.
Foreign currency differences are recognised in other comprehensive income and presented in the foreign currency translation reserve (translation reserve) in equity. However, if the operation is a non-wholly-owned subsidiary, then the relevant proportionate share of the translation difference is allocated to the non-controlling interests. When a foreign operation is disposed of such that control, or joint control is lost, the cumulative amount in the translation reserve related to that foreign operation is reclassified to profit or loss as part of the gain or loss on disposal. When the group disposes of only part of its interest in a subsidiary that includes a foreign operation while retaining control, the relevant proportion of the cumulative amount is reattributed to non-controlling interests. When the Group disposes of only part of its investment in joint venture that includes a foreign operation while retaining significant influence or joint control, the relevant proportion of the cumulative amount is reclassified to the income statement.
When the settlement of a monetary item that is a receivable from or payable to a foreign operation is neither planned nor likely in the foreseeable future, foreign exchange gains and losses arising from such a monetary item are considered to form part of a net investment in a foreign operation and are recognised in other comprehensive income, and presented in the translation reserve in equity.
4.3 Current versus Noncurrent Classification
The Group presents assets and liabilities in the statements of financial position based on current/noncurrent classification. An asset is current when:
• It is expected to be realised or intended to be sold or consumed in the normal operating cycle• It is held primarily for the purpose of trading• It is expected to be realised within 12 months after the reporting period, or• It is cash or cash equivalent unless restricted from being exchanged or used to settle a liability for at least
12 months after the reporting period.
4. SIGNIFICANT ACCOUNTING POLICIES (CONT’D)
4.3 Current versus Noncurrent Classification (cont’d)
All other assets are classified as noncurrent.
A liability is current when:
• It is expected to be settled in the normal operating cycle• It is held primarily for the purpose of trading• It is due to be settled within 12 months after the reporting period, or• There is no unconditional right to defer the settlement of the liability for at least 12 months after the
reporting period.
The Group classifies all other liabilities as noncurrent.
Deferred tax assets and deferred tax liabilities are classified as noncurrent assets and liabilities, respectively.
4.4 Intangible assets
(i) Indefinite intangible assets
Intangible assets are measured at cost less accumulated impairment losses.
(ii) Research and development
Expenditure on research activities, undertaken with the prospect of gaining new scientific or technical knowledge and understanding, is recognised in the income statement as incurred.
Development activities involve a plan or design for the production of new or substantially improved products and processes. Development expenditure is capitalised only if development costs can be measured reliably, the product or process is technically and commercially feasible, future economic benefits are probable, and the Group intends to and has sufficient resources to complete development and to use or sell the asset. The expenditure capitalised includes the cost of materials, direct labour, overhead costs that are directly attributable to preparing the asset for its intended use, and capitalised borrowing costs. Other development expenditure is recognised in the income statement as incurred.
Capitalised development expenditure is measured at cost less accumulated amortisation and accumulated impairment losses.
(iii) Other intangible assets
Other intangible assets that are acquired by the Group and have finite useful lives are measured at cost less accumulated amortisation and accumulated impairment losses.
(iv) Subsequent expenditure
Subsequent expenditure is capitalised only when it increases the future economic benefits embodied in the specific asset to which it relates. All other expenditure, including expenditure on internally generated goodwill and brands, is recognised in the income statement as incurred.
AN
NU
AL
RE
PO
RT
FY
20
17
DE
L M
ON
TE
PA
CIF
IC L
IMIT
ED
141140

NOTES TO THE FINANCIAL STATEMENTS
NOTES TO THE FINANCIAL STATEMENTS
Year ended 30 April 2017 Year ended 30 April 2017
4. SIGNIFICANT ACCOUNTING POLICIES (CONT’D)
4.4 Intangible assets (cont’d)
(v) Amortisation
Amortisation is calculated based on the cost of the asset.
Amortisation is recognised in profit or loss on a straight-line basis over the estimated useful lives of intangible assets, other than goodwill and, from the date that they are available for use. The estimated useful lives for the current period and comparative years are as follows:
Trademarks – 10 to 40 yearsCustomer relationships – 8 to 20 years
Amortisation methods, useful lives and residual values are reviewed at each reporting date and adjusted if appropriate.
4.5 Financial instruments
The Group classifies non-derivative financial assets into the following categories: financial assets at fair value through profit or loss (FVPL), held-to-maturity (HTM) financial assets, loans and receivables and available-for-sale (AFS) financial assets. The Group classifies non-derivative financial liabilities into the following categories: financial liabilities at FVPL and other financial liabilities. The classification depends on the purpose for which the investments were acquired and whether they are quoted in an active market. Classification is determined at initial recognition and, where allowed and appropriate, re-evaluates such designation at every reporting date. The Group has no financial assets and liabilities at FVPL, HTM financial assets, and AFS financial assets as at 30 April 2017 and 2016, and 2015. (i) Non-derivative financial assets
The Group initially recognises loans and receivables and deposits on the date that they are originated. All other financial assets are recognised initially on the trade date, which is the date that the Group becomes a party to the contractual provisions of the instrument.
The Group derecognises a financial asset when the contractual rights to the cash flows from the asset expire, or it transfers the rights to receive the contractual cash flows on the financial asset in a transaction in which substantially all the risks and rewards of ownership of the financial asset are transferred, or it neither transfers nor retains substantially all of the risks and rewards of ownership and does not retain control over the transferred asset. Any interest in transferred financial assets that is created or retained by the Group is recognised as a separate asset or liability.
Financial assets and liabilities are offset and the net amount presented in the statement of financial position when, and only when, the Group has a legal right to offset the amounts and intends either to settle on a net basis or to realise the asset and settle the liability simultaneously. The Group assesses that it has a currently enforceable right of offset if the right is not contingent on a future event, and is legally enforceable in the normal course of business, event of default, and event of insolvency or bankruptcy of the Group and all of the counterparties.
Non-derivative financial assets comprise of loans and receivables.
4. SIGNIFICANT ACCOUNTING POLICIES (CONT’D)
4.5 Financial instruments (cont’d)
(i) Non-derivative financial assets
Loans and receivables
Loans and receivables are financial assets with fixed or determinable payments that are not quoted in an active market. Such assets are recognised initially at fair value plus any directly attributable transaction costs. Subsequent to initial recognition, loans and receivables are measured at amortised cost using the effective interest method, less any impairment losses.
Loans and receivables comprise trade and other receivables, refundable deposits, and cash and cash equivalents. Cash and cash equivalents comprise bank balances, cash on hand and short-term marketable securities.
(ii) Non-derivative financial liabilities
Financial liabilities are recognised initially on the date that the Group becomes a party to the contractual provisions of the instrument.
The Group derecognises a financial liability when its contractual obligations are discharged, are cancelled or expire.
The Group assesses that it has a currently enforceable right of offset if the right is not contingent on a future event, and is legally enforceable in the normal course of business, event of default, and event of insolvency or bankruptcy of the Group and all of the counterparties.
Such financial liabilities are recognised initially at fair value plus any directly attributable transaction costs. Subsequent to initial recognition, these financial liabilities are measured at amortised cost using the effective interest method.
Non-derivative financial liabilities comprise loans and borrowings, and trade and other payables.
(iii) Derivative financial instruments, including hedge accounting
The Group uses derivative financial instruments for the purpose of managing risks associated with interest rates, currencies, transportation and certain commodities. The Group does not trade or use instruments with the objective of earning financial gains on fluctuations in the derivative instrument alone, nor does it use instruments where there are no underlying exposures. All derivative instruments are recorded in the statement of financial position at fair value. The accounting for changes in the fair value (i.e., gains or losses) of a derivative instrument depends on whether the instrument has been designated and qualifies as part of a hedging relationship and further, on the type of hedging relationship. For those derivative instruments that are designated and qualify as hedging instruments, the Group designates the hedging instrument based upon the exposure being hedged, as a fair value hedge, cash flow hedge, or a hedge of a net investment in a foreign operation.
AN
NU
AL
RE
PO
RT
FY
20
17
DE
L M
ON
TE
PA
CIF
IC L
IMIT
ED
143142
NOTES TO THE FINANCIAL STATEMENTS
NOTES TO THE FINANCIAL STATEMENTS
Year ended 30 April 2017 Year ended 30 April 2017
4. SIGNIFICANT ACCOUNTING POLICIES (CONT’D)
4.5 Financial instruments (cont’d)
(iii) Derivative financial instruments, including hedge accounting (cont’d)
On initial designation of the derivative as the hedging instrument, the Group formally documents the relationship between the hedging instrument and the hedged item, including the risk management objectives and strategy in undertaking the hedge transaction and the hedged risk, together with the methods that will be used to assess the effectiveness of the hedging relationship. The Group makes an assessment, both at the inception of the hedge relationship as well as on an ongoing basis, of whether the hedging instruments are expected to be ‘highly effective’ in offsetting the changes in the fair value or cash flows of the respective hedged items attributable to the hedged risk, and whether the actual results of each hedge are within a range of 80 – 125%. For a cash flow hedge of a forecast transaction, the transaction should be highly probable to occur and should present an exposure to variations in cash flows that could ultimately affect reported profit or loss.
Derivatives are recognised initially at fair value; any directly attributable transaction costs are recognised in the income statement as they are incurred. Subsequent to initial recognition, derivatives are measured at fair value, and changes therein are generally recognised in the income statement.
Cash flow hedges
When a derivative is designated as a cash flow hedging instrument, the effective portion of changes in the fair value of the derivative is recognised in other comprehensive income and accumulated in the hedging reserve. Any ineffective portion of changes in the fair value of the derivative is recognised immediately in the income statement under “Finance expense”.
The amount accumulated in equity is retained in other comprehensive income and reclassified to profit or loss in the same period or periods during which the hedged item affects profit or loss.
If the hedging instrument no longer meets the criteria for hedge accounting, expires or is sold, terminated or exercised, or the designation is revoked, then hedge accounting is discontinued prospectively. If the forecast transaction is no longer expected to occur, then the amount accumulated in equity is reclassified to the income statement.
4.6 Property, plant and equipment
(i) Recognition and measurement
Items of property, plant and equipment are measured at cost less accumulated depreciation and accumulated impairment losses except for freehold land, which are stated at its revalued amounts. The revalued amount is the fair value at the date of revaluation less any subsequent accumulated impairment losses. Revaluation is carried out by independent professional valuers regularly such that the carrying amount of these assets does not differ materially from that which would be determined using fair values at the reporting date.
A bearer plant is a pineapple and papaya living plant that is used in the production or supply of agricultural produce, is expected to bear produce for more than one period and has a remote likelihood of being sold as agricultural produce, except for incidental scrap sales. Costs related to bearer plants are capitalized up to point of maturity of the bearer plants, including costs during the ratoon crop cycle. These costs include land preparation, cultural, spraying and plantation overhead costs.
4. SIGNIFICANT ACCOUNTING POLICIES (CONT’D)
4.6 Property, plant and equipment (cont’d)
(i) Recognition and measurement (cont’d)
Any increase in the revaluation amount is recognised in other comprehensive income and presented in the revaluation reserve in equity unless it offsets a previous decrease in value of the same asset that was recognised in the income statement. A decrease in value is recognised in the income statement where it exceeds the increase previously recognised in the revaluation reserve. Upon disposal, any related revaluation reserve is transferred from other comprehensive income to retained earnings and is not taken into account in arriving at the gain or loss on disposal.
Cost includes expenditure that is directly attributable to the acquisition of the asset. The cost of self-constructed assets includes the cost of materials and direct labour, any other costs directly attributable to bringing the assets to a working condition for their intended use, when the Group has an obligation to remove the asset or restore the site as estimate of the costs of dismantling and removing the items and restoring the site on which they are located and capitalised borrowing costs. Purchased software that is integral to the functionality of the related equipment is capitalised as part of that equipment.
Construction in-progress represents plant and properties under construction or development and is stated at cost. This includes cost of construction, plant and equipment, borrowing costs directly attributable to such asset during the construction period and other direct costs. Construction in-progress is not depreciated until such time when the relevant assets are substantially completed and available for its intended use.
When parts of an item of property, plant and equipment have different useful lives, they are accounted for as separate items (major components) of property, plant and equipment.
The gain or loss on disposal of an item of property, plant and equipment is determined by comparing the proceeds from disposal with the carrying amount of the item, and is recognised net within other income/other expenses in the income statement.
(ii) Subsequent costs
The cost of replacing a component of an item of property, plant and equipment is recognised in the carrying amount of the item if it is probable that the future economic benefits embodied within the component will flow to the Group, and its cost can be measured reliably. The carrying amount of the replaced component is derecognised. The costs of the day-to-day servicing of property, plant and equipment are recognised in the income statement as incurred.
(iii) Depreciation
Depreciation is based on the cost of an asset less its residual value. Significant components of individual assets are assessed and if a component has a useful life that is different from the remainder of that asset, that component is depreciated separately.
Depreciation (except bearer plants) is recognised in the income statement on a straight-line basis over their estimated useful lives of each component of an item of property, plant and equipment, unless it is included in the carrying amount of another asset. Leased assets are depreciated over the shorter of the lease term and their useful lives unless it is reasonably certain that the Group will obtain ownership by the end of the lease term. Freehold land is not depreciated.
AN
NU
AL
RE
PO
RT
FY
20
17
DE
L M
ON
TE
PA
CIF
IC L
IMIT
ED
145144
NOTES TO THE FINANCIAL STATEMENTS
NOTES TO THE FINANCIAL STATEMENTS
Year ended 30 April 2017 Year ended 30 April 2017
4. SIGNIFICANT ACCOUNTING POLICIES (CONT’D)
4.6 Property, plant and equipment (cont’d)
(iii) Depreciation (cont’d)
Depreciation is recognised from the date that the property, plant and equipment are installed and are ready for use, or in respect of internally constructed assets, from the date that the asset is completed and ready for use.
For bearer plants, units of production method was used. Depreciation is charged according to the cost of fruits harvested at plant crop and ratoon crop harvest months.
The estimated useful lives for the current period and comparative years are as follows:
Buildings, land improvements and – 3 to 50 years or lease term, whichever is shorterleasehold improvements Machineries and equipment – 3 to 30 years
Bearer plants are depreciated based on the ratio of actual quantity of harvest over the estimated yield for both plant crop and ratoon crop harvests. Plant crop harvest usually occurs within 16 to 18 months after planting while ratoon crop occurs at the 32nd to 34th month after planting. Depreciation is determined on a per field basis.
Depreciation methods, useful lives and residual values are reviewed at each reporting date and adjusted if appropriate.
4.7 Biological assets
The Group’s biological assets include: (a) bearer plant’s agricultural produce consisting of pineapple and papaya; (b) breeding and dairy herd; (c) growing herd; and (d) cattle for slaughter. Agricultural produce include: (a) harvested pineapple and papaya fruits; (b) produce growing on bearer plants; and (c) cut meat from the cattle for slaughter.
The Group’s biological assets are accounted for as follows:
Dairy and Breeding Herd
The dairy and breeding herd are measured at cost less accumulated depreciation. The breeding and dairy herd have useful lives of 3½ to 6 years. The cost method was used since fair value cannot be measured reliably. The breeding and dairy herd have no active markets and no similar assets are available in the relevant markets. In addition, existing sector benchmarks are irrelevant and estimates necessary to compute for the present value of expected net cash flows comprise a wide range of data which will not result in a reliable basis for determining the fair value. Dairy and breeding herd are classified as noncurrent assets in the statement of financial position.
Growing Herd
Growing herd is measured at cost. The cost method was used since the fair value cannot be measured reliably. Growing herd has no defined active market since it has not yet been identified if this will be for breeding or for slaughter. Growing herd is classified as noncurrent asset in the statement of financial position.
Cattle for Slaughter
Cattle for slaughter are measured at each reporting date at their fair value less point-of-sale costs. Gains and losses arising from changes in fair values are included in profit or loss for the period in which they arise. Cattle for slaughter are classified as current assets in the statement of financial position.
4. SIGNIFICANT ACCOUNTING POLICIES (CONT’D)
4.7 Biological assets (cont’d)
The Group’s agricultural produce are accounted for as follows:
Agricultural Produce
The Group’s growing produce are measured at their fair value from the time of maturity of the bearer plant until harvest. The Group uses the future selling prices and gross margin of finished goods less future growing cost applied to the estimated volume of harvest as the basis of fair value. The Group’s harvested produce are measured at fair value at the point of harvest based on the estimated future selling prices reduced by cost to sell.
Cut Meat
Cut meat is measured at each reporting date at their fair value less point-of-sale costs. Gains and losses arising from changes in fair values are included in profit or loss for the period in which they arise.
4.8 Leases
The determination of whether an arrangement is, or contains, a lease is based on the substance of the arrangement and requires an assessment of whether the fulfillment of the arrangement is dependent on the use of a specific asset or assets and the arrangement conveys a right to use the asset. A reassessment is made after inception of the lease only if one of the following applies:
(a) There is a change in contractual terms, other than a renewal or extension of the arrangement;
(b) A renewal option is exercised or extension granted, unless that term of the renewal or extension was initially included in the lease term;
(c) There is a change in the determination of whether fulfillment is dependent on a specified asset; or
(d) There is a substantial change to the asset.
Where a reassessment is made, lease accounting shall commence or cease from the date when the change in circumstances gave rise to the reassessment for scenarios (a), (c) or (d) above, and at the date of renewal or extension period for scenario (b).
Group as LesseeLeases where the lessor retains substantially all the risks and benefits of ownership of the leased asset are classified as operating leases. Operating lease payments are recognised as an expense in the income statement on a straight-line basis over the lease term.
4.9 Inventories
Inventories are measured at the lower of cost and net realisable value.
The cost of raw materials, packaging materials, traded goods, cost of production materials and storeroom items is based on the FIFO (First-in First-out) method. Cost of processed inventories comprises all costs of purchase, costs of conversion and other costs incurred in bringing the inventories to their present location and condition.
The costs of conversion include costs directly related to the units of production, and a systematic allocation of fixed and variable production overheads that are incurred in converting materials into finished goods.
AN
NU
AL
RE
PO
RT
FY
20
17
DE
L M
ON
TE
PA
CIF
IC L
IMIT
ED
147146
NOTES TO THE FINANCIAL STATEMENTS
NOTES TO THE FINANCIAL STATEMENTS
Year ended 30 April 2017 Year ended 30 April 2017
4. SIGNIFICANT ACCOUNTING POLICIES (CONT’D)
4.9 Inventories (cont’d)
The allocation of fixed production overheads is based on the normal capacity of the production facilities. Normal capacity is the production expected to be achieved on average for the periods or seasons under normal circumstances, taking into account the seasonal business cycle of the Group.
Net realisable value is the estimated selling price in the ordinary course of business, less the estimated costs of completion and selling expenses.
The cost of growing crops transferred from biological assets is its fair value less cost to sell at the date of harvest.
4.10 Cash equivalents
Cash equivalents are short-term, highly liquid investments that are readily convertible to known amount of cash with original maturities of three months or less that are subject to insignificant risk of change in value.
4.11 Impairment
(i) Non-derivative financial assets
A financial asset not classified at fair value through profit or loss is assessed at each reporting date to determine whether there is objective evidence that it is impaired. A financial asset is impaired if objective evidence indicates that a loss event(s) have occurred after the initial recognition of the asset, and that the loss event(s) had a negative effect on the estimated future cash flows of that asset that can be estimated reliably.
Objective evidence that financial assets are impaired can include default or delinquency by a debtor, restructuring of an amount due to the Group on terms that the Group would not consider otherwise, indications that a debtor or issuer will enter bankruptcy, adverse changes in the payment status of borrowers or issuers in the Group, or economic conditions that correlate with defaults.
Loans and receivables
The Group considers evidence of impairment for loans and receivables at both a specific asset and collective level. All individually significant loans and receivables are assessed for specific impairment. All individually significant receivables found not to be specifically impaired are then collectively assessed for any impairment that has been incurred but not yet identified.
Loans and receivables that are not individually significant are collectively assessed for impairment by grouping together loans and receivables with similar risk characteristics.
In assessing collective impairment, the Group uses historical trends of the probability of default, timing of recoveries and the amount of loss incurred, adjusted for management’s judgement as to whether current economic and credit conditions are such that the actual losses are likely to be greater or less than suggested by historical trends.
An impairment loss in respect of a financial asset measured at amortised cost is calculated as the difference between its carrying amount and the present value of the estimated future cash flows discounted at the asset’s original effective interest rate. Losses are recognised in the income statement and reflected in an allowance account against loans and receivables. Interest on the impaired asset continues to be recognised. When the Group considers that there are no realistic prospects of recovery of the asset, the relevant amounts are written off. If the amount of impairment loss subsequently decreases and the decrease can be related objectively to an event occurring after the impairment was recognised, then previously recognised impairment loss is reversed through the income statement.
4. SIGNIFICANT ACCOUNTING POLICIES (CONT’D)
4.11 Impairment (cont’d)
(ii) Non-financial assets
The carrying amounts of the Group’s non-financial assets, other than biological assets, inventories and deferred tax assets, are reviewed at each reporting date to determine whether there is any indication of impairment. If any such indication exists, then the asset’s recoverable amount is estimated. For goodwill, and intangible assets that have indefinite useful lives, the recoverable amount is estimated each year at the same time. An impairment loss is recognised if the carrying amount of an asset or its related cash-generating unit (CGU) exceeds its estimated recoverable amount.
The recoverable amount of an asset or CGU is the greater of its value-in-use (VIU) and its fair value less costs to sell. In assessing VIU, the estimated future cash flows are discounted to their present value using a pre-tax discount rate that reflects current market assessments of the time value of money and the risks specific to the asset or CGU. For the purpose of impairment testing, assets that cannot be tested individually are grouped together into the smallest group of assets that generates cash inflows from continuing use that are largely independent of the cash inflows of other assets or CGU.
Impairment losses are recognised in the income statement. Impairment losses recognised in respect of CGUs are allocated first to reduce the carrying amount of any goodwill allocated to the CGU (group of CGUs), and then to reduce the carrying amounts of the other assets in the CGU (group of CGUs) on a pro rata basis.
Joint ventures
An impairment loss in respect of joint ventures is measured by comparing the recoverable amount of the investment with its carrying amount. An impairment loss is recognised in the income statement. An impairment loss is reversed if there has been a favourable change in the estimates used to determine the recoverable amount.
An impairment loss in respect of goodwill is not reversed. In respect of other assets, impairment losses recognised in prior periods are assessed at each reporting date for any indications that the loss has decreased or no longer exists. An impairment loss recognised in prior periods for an asset other than goodwill is reversed if there has been a change in the estimates used to determine the recoverable amount. An impairment loss is reversed only to the extent that the asset’s carrying amount does not exceed the carrying amount that would have been determined, net of depreciation or amortisation, if no impairment loss had been recognised.
Goodwill
Goodwill that forms part of the carrying amount of an investment in a joint venture is not recognised separately, and therefore is not tested for impairment separately. Instead, the entire amount of the investment in a joint venture is tested for impairment as a single asset when there is objective evidence that the investment in a joint venture may be impaired.When conducting the annual impairment test for goodwill, the Group compares the estimated fair value of the CGU containing goodwill to its recoverable amount.
AN
NU
AL
RE
PO
RT
FY
20
17
DE
L M
ON
TE
PA
CIF
IC L
IMIT
ED
149148

NOTES TO THE FINANCIAL STATEMENTS
NOTES TO THE FINANCIAL STATEMENTS
Year ended 30 April 2017 Year ended 30 April 2017
4. SIGNIFICANT ACCOUNTING POLICIES (CONT’D)
4.11 Impairment (cont’d)
(ii) Non-financial assets (cont’d)
Goodwill is allocated to a CGU or group of CGUs that represents the lowest level within the entity at which the goodwill is monitored for internal management purposes. The recoverable amount is computed using two approaches: the value-in-use approach, which is the present value of expected cash flows, discounted at a risk adjusted weighted average cost of capital; and the fair value less cost to sell approach, which is based on using market multiples of companies in similar lines of business. The recoverable amount of an asset or CGU is the greater of its VIU and its fair value less costs to sell. An impairment loss is recognised if the carrying amount of an asset or its related CGU exceeds its estimated recoverable amount.
In assessing VIU, the estimated future cash flows are discounted to their present value using a discount rate that reflects current market assessments of the time value of money and the risks specific to the asset or CGU. For the purpose of impairment testing, assets that cannot be tested individually are grouped together into the smallest group of assets that generates cash inflows from continuing use that are largely independent of the cash inflows of other assets or CGU. Subject to an operating segment ceiling test, for the purposes of goodwill impairment testing, CGUs to which goodwill has been allocated are aggregated so that the level at which impairment testing is performed reflects the lowest level at which goodwill is monitored for internal reporting purposes. Goodwill acquired in a business combination is allocated to groups of CGUs that are expected to benefit from the synergies of the combination.
Impairment losses are recognised in profit or loss. Impairment losses recognised in respect of CGUs are allocated first to reduce the carrying amount of any goodwill allocated to the CGU (group of CGUs), and then to reduce the carrying amounts of the other assets in the CGU on a pro rata basis.
An impairment loss in respect of goodwill attributable to acquisition of a subsidiary is not reversed.
Intangible assets with indefinite lives, are components of the CGU containing goodwill and the impairment assessment is as described above.
4.12 Noncurrent assets held for sale
Assets held for sale are classified as held-for-sale if it is highly probable that they will be recovered primarily through sale rather than through continuing use. Such assets are measured at the lower of their carrying amount and fair value less cost to sell. Impairment losses on initial classification as held-for-sale and subsequent gains and losses on re-measurement are recognised in the income statement. Once classified as held-for-sale, property, plant and equipment are no longer depreciated. If it is no longer highly probable that an asset will be recovered primarily through sale, the asset ceases to be classified as held-for-sale and is measured at the lower of its carrying amount before the asset was classified as held-for-sale adjusted for any depreciation that would have been recognised had the asset not been reclassified as held for sale and its recoverable amount at the date of the subsequent reclassification. The required adjustment to the carrying amount of an asset that ceases to be classified as held-for-sale is included in the income statement. The Group classified part of Sager Creek’s assets as held-for-sale as of 1 May 2016 (see Note 14). The Group did not have any assets held for sale as of 30 April 2017.
4. SIGNIFICANT ACCOUNTING POLICIES (CONT’D)
4.13 Employee benefits
(i) Defined contribution plans
A defined contribution plan is a post-employment benefit plan under which an entity pays fixed contributions into a separate entity and will have no legal or constructive obligation to pay further amounts. Obligations for contributions to defined contribution pension plans are recognised as an employee benefit expense in the income statement in the periods during which services are rendered by employees.
(ii) Defined benefit pension plan
A defined benefit pension plan requires contributions to be made to separately administered funds. The Group’s net obligation in respect of defined benefit plans is calculated separately for each plan by estimating the amount of future benefit that employees have earned in the current and prior periods, discounting that amount and deducting the fair value of any plan assets. The Group determines the net interest expense (income) on the net defined benefit liability (asset) for the period by applying the discount rate used to measure the defined benefit obligation at the beginning of the annual period to the net defined benefit liability (asset), taking into account any changes in the net defined benefit liability (asset) during the period as a result of contributions and benefit payments.
The calculation of defined benefit obligations is performed annually by a qualified actuary using the projected unit credit method. When the calculation results in a benefit to the Group, the recognised asset is limited to the present value of economic benefits available in the form of any future refunds from the plan or reductions in future contributions to the plan. To calculate the present value of economic benefits, consideration is given to any applicable minimum funding requirements that apply to any plan in the Group. An economic benefit is available to the Group if it is realisable during the life of the plan, or on settlement of the plan liabilities.
Service costs which include current service costs, past service costs and gains or losses on non-routine settlements are recognised as expense in profit or loss. Past service costs are recognised when plan amendment or curtailment occurs.
Remeasurements of the net defined benefit liability comprise actuarial gains and losses, the return on plan assets (excluding interest) and the effect of the asset ceiling (if any, excluding interest). The Group recognises them immediately in other comprehensive income and all expenses related to defined benefit plans in staff cost in profit or loss. When the benefits of a plan are changed or when a plan is curtailed, the resulting change in benefit that relates to past service or the gain or loss on curtailment is recognised immediately in the income statement.
When the plan amendment or curtailment occurs, the Group recognises gains and losses on the settlement of a defined benefit plan when the settlement occurs. The gain or loss on settlement is the difference between the present value of the defined benefit obligation being settled as determined on the date of settlement and the settlement price, including any plan assets transferred and any payments made directly by the Group in connection with the settlement. In fiscal 2016, a plan amendment was implemented for certain medical and dental benefits (See Note 22).
AN
NU
AL
RE
PO
RT
FY
20
17
DE
L M
ON
TE
PA
CIF
IC L
IMIT
ED
151150
NOTES TO THE FINANCIAL STATEMENTS
NOTES TO THE FINANCIAL STATEMENTS
Year ended 30 April 2017 Year ended 30 April 2017
4. SIGNIFICANT ACCOUNTING POLICIES (CONT’D)
4.13 Employee benefits (cont’d)
(ii) Defined benefit pension plan (cont’d)
Multi-employer plans
The Group participates in several multi-employer pension plans, which provide defined benefits to certain union employees. The Group accounts for its proportionate share of the defined benefit obligation, plan assets and cost associated with the plan in the same way as other defined benefit plan. For certain union employee related retirement plans where sufficient information is not available to use defined benefit accounting, the Group accounts for these plans as if they were defined contribution plans.
(iii) Other plans
The Group has various other non-qualified retirement plans and supplemental retirement plans for executives, designed to provide benefits in excess of those otherwise permitted under the Group’s qualified retirement plans. These plans are unfunded and comply with Internal Revenue Service (IRS) rules for non-qualified plans.
(iv) Other long-term employee benefits
The Group’s net obligation in respect of long-term employee benefits other than pension plans is the amount of future benefit that employees have earned in return for their service in the current and prior periods. That benefit is discounted to determine its present value, and the fair value of any related assets is deducted. The calculation is performed using the projected unit credit method. Any actuarial gains and losses are recognised in the income statement in the period in which they arise.
(v) Termination benefits
Termination benefits are recognised as an expense when the Group is demonstrably committed, without realistic possibility of withdrawal, to a formal detailed plan to either terminate employment before the normal retirement date, or to provide termination benefits as a result of an offer made to encourage voluntary redundancy. Termination benefits are recognised as an expense once the Group has announced the plan to affected employees.
(vi) Short-term employee benefits
Short-term employee benefit obligations are measured on an undiscounted basis and are expensed as the related service is provided. A liability is recognised for the amount expected to be paid under short-term cash bonus if the Group has a present legal or constructive obligation to pay this amount as a result of past service provided by the employee and the obligation can be estimated reliably.
(vii) Share-based payment transactions
The Group grants share awards and share options to employees of the Group. The fair value of incentives granted is recognised as an employee benefit expense with a corresponding increase in equity. The fair value is measured at grant date and accounted for as described below.
4. SIGNIFICANT ACCOUNTING POLICIES (CONT’D)
4.13 Employee benefits (cont’d)
(vii) Share-based payment transactions (cont’d)
Share awards
The fair value, measured at grant date, is recognised over the period during which the employees become unconditionally entitled to the shares.
Share options
The fair value, measured at grant date, is recognised over the vesting period during which the employees become unconditionally entitled to the options. At each reporting date, the Group revises its estimates of the number of options that are expected to become exercisable. It recognises the impact of the revision of original estimates in employee benefit expense and as a corresponding adjustment to equity over the remaining vesting period.
4.14 Share Capital and Retained earnings
(i) Share capital
Ordinary shares
Ordinary shares are classified as equity. Holders of these shares are entitled to dividends as declared from time to time and are entitled to one vote per share at general meetings of the Company.
Preferred shares
Preferred shares are classified as equity. Holders of these shares are entitled to cash dividends based on the issue price, at the dividend rate per annum from the issue date, payable every 7 October and 7 April of each year following the issue date, upon declaration by the BOD.
The transaction costs directly attributable to the issue of ordinary and preference shares are accounted for as deduction from equity to the extent they are incremental costs directly attributable to the equity transaction that otherwise would have been avoided. The costs of an equity transaction that is abandoned are recognised as an expense.
Repurchase, disposal and reissue of share capital (treasury shares)
When share capital recognised as equity is repurchased, the amount of the consideration paid, which includes directly attributable costs, net of any tax effects, is recognised as a deduction from equity. Repurchased shares are classified as treasury shares and are presented in the reserve for own shares. When treasury shares are sold or reissued subsequently, the amount received is recognised as an increase in equity, and the resulting surplus or deficit on the transaction is presented in share premium.
Share premium
Share premium represents the excess of consideration received over the par value of common and preferred stocks.
AN
NU
AL
RE
PO
RT
FY
20
17
DE
L M
ON
TE
PA
CIF
IC L
IMIT
ED
153152
NOTES TO THE FINANCIAL STATEMENTS
NOTES TO THE FINANCIAL STATEMENTS
Year ended 30 April 2017 Year ended 30 April 2017
4. SIGNIFICANT ACCOUNTING POLICIES (CONT’D)
4.14 Share Capital and Retained earnings (cont’d)
(ii) Retained Earnings
Retained earnings include profit attributable to the equity holders of the Group and reduced by dividends declared on share capital.
(iii) Dividends
Dividends are recognised as a liability and deducted from retained earnings when they are declared.
4.15 Provisions
A provision is recognised if, as a result of a past event, the Group has a present legal or constructive obligation that can be estimated reliably, and it is probable that an outflow of economic benefits will be required to settle the obligation. Provisions are determined by discounting the expected future cash flows at a pre-tax rate that reflects current market assessments of the time value of money and the risks specific to the liability. The unwinding of the discount is recognised as finance cost.
(i) Environment remediation liabilities
In accordance with the Group’s environment policy and applicable legal requirements, a provision for environmental remediation obligations and the related expense, is recognised when such losses are probable and the amounts of such losses can be estimated reliably. Accruals for estimated losses for environmental remediation obligations are recognised no later than the completion of the remedial feasibility study. These accruals are adjusted as further information develops or circumstances change.
(ii) Retained insurance liabilities
The Group accrues for retained insurance risks associated with the deductible portion of any potential liabilities that might arise out of claims of employees, customers or other third parties for personal injury or property damage occurring in the course of the Group’s operations. A third-party actuary is engaged to assist the Group in estimating the ultimate cost of certain retained insurance risks. Additionally, the Group’s estimate of retained insurance liabilities is subject to change as new events or circumstances develop which might materially impact the ultimate cost to settle these losses.
4.16 Revenue recognition
(i) Sale of goods
Revenue from the sale of goods in the course of ordinary activities is measured at the fair value of the consideration received or receivable, net of returns and allowances, trade discounts and volume rebates. Revenue is recognised when the significant risks and rewards of ownership have been transferred to the customer, recovery of the consideration is probable, the associated costs and possible return of goods can be estimated reliably, there is no continuing management involvement with the goods, and the amount of revenue can be measured reliably. If it is probable that discounts will be granted and the amount can be measured reliably, then the discount is recognised as a reduction of revenue as the sales are recognised.
The timing of transfers of risks and rewards varies depending on the individual terms of the contract of sale but usually occurs when the customer receives the product.
4. SIGNIFICANT ACCOUNTING POLICIES (CONT’D)
4.16 Revenue recognition (cont’d)
(ii) Dividend income
Dividend income is recognised when the Company’s right to receive payment is established.
4.17 Lease payments
Payments made under operating leases are recognised in the income statement on a straight-line basis over the term of the lease. Lease incentives received are recognised as an integral part of the total lease expenses, over the term of the lease.
Rent expense is being recognised on a straight-line basis over the life of the lease. The difference between rent expense recognised and rental payments, as stipulated in the lease, is reflected as deferred rent in the statements of financial position.
4.18 Finance income and finance costs
Finance income comprises interest income earned mainly from bank deposits. Interest income is recognised as it accrues in the income statement, using the effective interest method.
Finance expense comprises interest expense on borrowings. All borrowing costs are recognised in profit or loss using the effective interest method, except to the extent that they are capitalised as being directly attributable to the acquisition, construction or production of an asset which necessarily takes a substantial period of time to be prepared for its intended use or sale.
Foreign currency gains and losses on financial assets and financial liabilities are reported on a net basis as either finance income or finance cost depending on whether foreign currency movements are in a net gain or net loss position.
4.19 Tax
Tax expense comprises current and deferred tax. Current tax and deferred tax is recognised in profit or loss except to the extent that it relates to a business combination, or items recognised directly in equity or in other comprehensive income.
Current tax is the expected tax payable on the taxable income for the year, using tax rates enacted or substantively enacted at the reporting date, and any adjustment to tax payable in respect of previous years.
Deferred tax is recognised in respect of temporary differences between the carrying amounts of assets and liabilities for financial reporting purposes and the amounts used for taxation purposes. Deferred tax is not recognised for:
• temporary differences on the initial recognition of assets or liabilities in a transaction that is not a business combination and that affects neither accounting nor taxable profit or loss;
• temporary differences related to investments in subsidiaries and joint ventures to the extent that the Group is able to control the timing of the reversal of the temporary difference and it is probable that they will not reverse in the foreseeable future; and
• taxable temporary differences arising on the initial recognition of goodwill.
AN
NU
AL
RE
PO
RT
FY
20
17
DE
L M
ON
TE
PA
CIF
IC L
IMIT
ED
155154
NOTES TO THE FINANCIAL STATEMENTS
NOTES TO THE FINANCIAL STATEMENTS
Year ended 30 April 2017 Year ended 30 April 2017
4. SIGNIFICANT ACCOUNTING POLICIES (CONT’D)
4.19 Tax (cont’d)
A deferred tax asset is recognised for unused tax losses, tax credits and deductible temporary differences, to the extent that it is probable that future taxable profits will be available against which they can be utilised. Deferred tax assets are reviewed at each reporting date and are reduced to the extent that it is no longer probable that the related tax benefit will be realised.
Deferred income tax assets and deferred income tax liabilities are offset, if a legally enforceable right exists to offset current tax assets against current income tax liabilities and the deferred income taxes relate to the same taxable entity and the same taxation authority.
In determining the amount of current and deferred tax, the Group takes into account the impact of uncertain tax positions and whether additional taxes and interest may be due. The Group believes that its accruals for tax liabilities are adequate for all open tax years based on its assessment of many factors, including interpretations of tax law and prior experience. This assessment relies on estimates and assumptions and may involve a series of judgements about future events. New information may become available that causes the Group to change its judgement regarding the adequacy of existing tax liabilities; such changes to tax liabilities will impact tax expense in the period that such a determination is made.
4.20 Earnings per share
The Group presents basic and diluted earnings per share data for its ordinary shares. Basic earnings per share is calculated by dividing the profit or loss attributable to ordinary shareholders of the Company by the weighted average number of ordinary shares outstanding during the year, adjusted for own shares held. Diluted earnings per share is determined by adjusting the profit or loss attributable to ordinary shareholders and the weighted average number of ordinary shares outstanding, adjusted for own shares held, for the effects of all dilutive potential ordinary shares, which comprise the restricted share plan and share options granted to employees.
4.21 Segment reporting
An operating segment is a component of the Group that engages in business activities from which it may earn revenues and incur expenses, including revenues and expenses that relate to transactions with any of the Group’s other components. All operating segments’ operating results are reviewed regularly by the Group’s Executive Committee to make decisions about resources to be allocated to the segment and assess its performance, and for which discrete financial information is available.
Segment results include items directly attributable to a segment as well as those that can be allocated on a reasonable basis. Unallocated items comprise mainly non-recurring expenses.
4. SIGNIFICANT ACCOUNTING POLICIES (CONT’D)
4.22 Contingencies
A contingent liability is:
(a) a possible obligation that arises from past events and whose existence will be confirmed only by the occurrence or non-occurrence of one or more uncertain future events not wholly within the control of the Group; or
(b) a present obligation that arises from past events but is not recognised because:
(i) It is not probable that an outflow of resources embodying economic benefits will be required to settle the obligation; or
(ii) The amount of the obligation cannot be measured with sufficient reliability.
A contingent asset is a possible asset that arises from past events and whose existence will be confirmed only by the occurrence or non-occurrence of one or more uncertain future events not wholly within the control of the Group.
Contingent liabilities and assets are not recognised on the statement of financial position of the Group, except for contingent liabilities assumed in a business combination that are present obligations and which the fair values can be reliably determined.
4.23 New standards and interpretations issued but not yet adopted
A number of new standards and amendments to standards are effective for annual periods beginning after 1 May 2017. However, the Group has not applied the following new or amended standards in preparing these financial statements. Unless otherwise stated, none of these are expected to have a significant impact on the Group’s financial statements.
Effective 1 May 2017
• Amendment to IFRS 12, Clarification of the Scope of the Standard (Part of Annual Improvements to IFRSs 2014 – 2016 Cycle)
The amendments clarify that the disclosure requirements in IFRS 12, other than those relating to summarized financial information, apply to an entity’s interest in a subsidiary, a joint venture or an associate (or a portion of its interest in a joint venture or an associate) that is classified (or included in a disposal group that is classified) as held for sale.
The Group will include the required disclosures in its 2018 financial statements.
• Amendments to IAS 7, Statement of Cash Flows, Disclosure Initiative
The amendments to IAS 7 require an entity to provide disclosures that enable users of financial statements to evaluate changes in liabilities arising from financing activities, including both changes arising from cash flows and non-cash changes (such as foreign exchange gains or losses). On initial application of the amendments, entities are not required to provide comparative information for preceding periods. Early application of the amendments is permitted.
Application of amendments will result in additional disclosures in the 2018 financial statements.
AN
NU
AL
RE
PO
RT
FY
20
17
DE
L M
ON
TE
PA
CIF
IC L
IMIT
ED
157156

NOTES TO THE FINANCIAL STATEMENTS
NOTES TO THE FINANCIAL STATEMENTS
Year ended 30 April 2017 Year ended 30 April 2017
4. SIGNIFICANT ACCOUNTING POLICIES (CONT’D)
4.23 New standards and interpretations issued but not yet adopted (cont’d)
Effective 1 May 2017 (cont’d)
• Amendments to IAS 12, Income Taxes, Recognition of Deferred Tax Assets for Unrealized Losses
The amendments clarify that an entity needs to consider whether tax law restricts the sources of taxable profits against which it may make deductions on the reversal of that deductible temporary difference. Furthermore, the amendments provide guidance on how an entity should determine future taxable profits and explain the circumstances in which taxable profit may include the recovery of some assets for more than their carrying amount.
Entities are required to apply the amendments retrospectively. However, on initial application of the amendments, the change in the opening equity of the earliest comparative period may be recognised in opening retained earnings (or in another component of equity, as appropriate), without allocating the change between opening retained earnings and other components of equity. Entities applying this relief must disclose that fact. Early application of the amendments is permitted.
The Group is currently assessing the potential impact of the amendments to IAS 12.
Effective 1 May 2018
• Amendments to IFRS 2, Share-based Payment, Classification and Measurement of Share-based Payment Transactions The amendments to IFRS 2 address three main areas: the effects of vesting conditions on the measurement of a cash-settled share-based payment transaction; the classification of a share-based payment transaction with net settlement features for withholding tax obligations; and the accounting where a modification to the terms and conditions of a share-based payment transaction changes its classification from cash settled to equity settled.
• Amendments to IFRS 4, Insurance Contracts, Applying IFRS 9, Financial Instruments, with IFRS 4
The amendments address concerns arising from implementing IFRS 9, the new financial instruments standard before implementing the forthcoming insurance contracts standard.
They allow entities to choose between the overlay approach and the deferral approach to deal with the transitional challenges. The overlay approach gives all entities that issue insurance contracts the option to recognise in other comprehensive income, rather than profit or loss, the volatility that could arise when IFRS 9 is applied before the new insurance contracts standard is issued. On the other hand, the deferral approach gives entities whose activities are predominantly connected with insurance an optional temporary exemption from applying IFRS 9 until the earlier of application of the forthcoming insurance contracts standard or 1 January 2021.
The overlay approach and the deferral approach will only be available to an entity if it has not previously applied IFRS 9.
4. SIGNIFICANT ACCOUNTING POLICIES (CONT’D)
4.23 New standards and interpretations issued but not yet adopted (cont’d)
Effective 1 May 2018 (cont’d)
• Amendments to IAS 28, Measuring an Associate or Joint Venture at Fair Value (Part of Annual Improvements to IFRSs 2014 – 2016 Cycle)
• The amendments clarify that an entity that is a venture capital organization, or other qualifying entity, may elect, at initial recognition on an investment-by-investment basis, to measure its investments in associates and joint ventures at fair value through profit or loss. They also clarify that if an entity that is not itself an investment entity has an interest in an associate or joint venture that is an investment entity, the entity may, when applying the equity method, elect to retain the fair value measurement applied by that investment entity associate or joint venture to the investment entity associate’s or joint venture’s interests in subsidiaries. This election is made separately for each investment entity associate or joint venture, at the later of the date on which (a) the investment entity associate or joint venture is initially recognised; (b) the associate or joint venture becomes an investment entity; and (c) the investment entity associate or joint venture first becomes a parent. The amendments should be applied retrospectively, with earlier application permitted.
• Amendments to IAS 40, Investment Property, Transfers of Investment Property
The amendments clarify when an entity should transfer property, including property under construction or development into, or out of investment property. The amendments state that a change in use occurs when the property meets, or ceases to meet, the definition of investment property and there is evidence of the change in use. A mere change in management’s intentions for the use of a property does not provide evidence of a change in use. The amendments should be applied prospectively to changes in use that occur on or after the beginning of the annual reporting period in which the entity first applies the amendments. Retrospective application is only permitted if this is possible without the use of hindsight.
• IFRIC-22, Foreign Currency Transactions and Advance Consideration
The interpretation clarifies that in determining the spot exchange rate to use on initial recognition of the related asset, expense or income (or part of it) on the derecognition of a non-monetary asset or non-monetary liability relating to advance consideration, the date of the transaction is the date on which an entity initially recognises the nonmonetary asset or non-monetary liability arising from the advance consideration. If there are multiple payments or receipts in advance, then the entity must determine a date of the transactions for each payment or receipt of advance consideration. The interpretation may be applied on a fully retrospective basis. Entities may also apply the interpretation prospectively to all assets, expenses and income in its scope that are initially recognised on or after the beginning of the reporting period in which the entity first applies the interpretation or the beginning of a prior reporting period presented as comparative information in the financial statements of the reporting period in which the entity first applies the interpretation.
AN
NU
AL
RE
PO
RT
FY
20
17
DE
L M
ON
TE
PA
CIF
IC L
IMIT
ED
159158
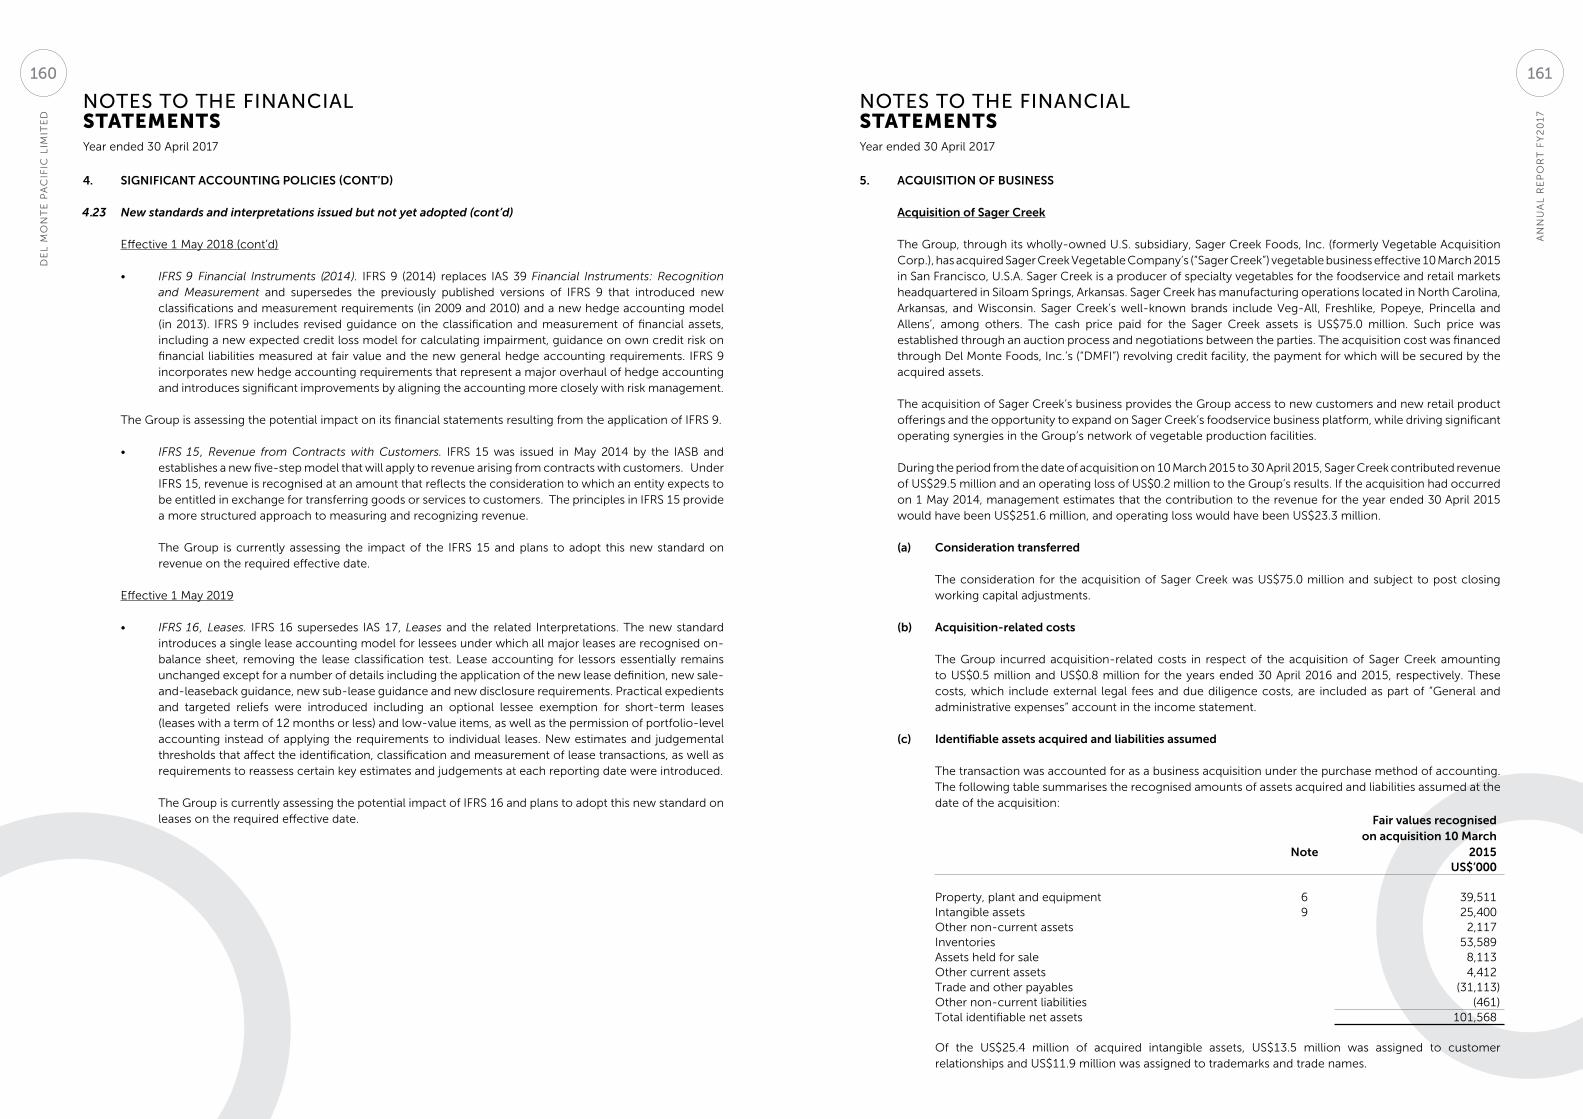
NOTES TO THE FINANCIAL STATEMENTS
NOTES TO THE FINANCIAL STATEMENTS
Year ended 30 April 2017 Year ended 30 April 2017
4. SIGNIFICANT ACCOUNTING POLICIES (CONT’D)
4.23 New standards and interpretations issued but not yet adopted (cont’d)
Effective 1 May 2018 (cont’d)
• IFRS 9 Financial Instruments (2014). IFRS 9 (2014) replaces IAS 39 Financial Instruments: Recognition and Measurement and supersedes the previously published versions of IFRS 9 that introduced new classifications and measurement requirements (in 2009 and 2010) and a new hedge accounting model (in 2013). IFRS 9 includes revised guidance on the classification and measurement of financial assets, including a new expected credit loss model for calculating impairment, guidance on own credit risk on financial liabilities measured at fair value and the new general hedge accounting requirements. IFRS 9 incorporates new hedge accounting requirements that represent a major overhaul of hedge accounting and introduces significant improvements by aligning the accounting more closely with risk management.
The Group is assessing the potential impact on its financial statements resulting from the application of IFRS 9.
• IFRS 15, Revenue from Contracts with Customers. IFRS 15 was issued in May 2014 by the IASB and establishes a new five-step model that will apply to revenue arising from contracts with customers. Under IFRS 15, revenue is recognised at an amount that reflects the consideration to which an entity expects to be entitled in exchange for transferring goods or services to customers. The principles in IFRS 15 provide a more structured approach to measuring and recognizing revenue.
The Group is currently assessing the impact of the IFRS 15 and plans to adopt this new standard on revenue on the required effective date.
Effective 1 May 2019
• IFRS 16, Leases. IFRS 16 supersedes IAS 17, Leases and the related Interpretations. The new standard introduces a single lease accounting model for lessees under which all major leases are recognised on-balance sheet, removing the lease classification test. Lease accounting for lessors essentially remains unchanged except for a number of details including the application of the new lease definition, new sale-and-leaseback guidance, new sub-lease guidance and new disclosure requirements. Practical expedients and targeted reliefs were introduced including an optional lessee exemption for short-term leases (leases with a term of 12 months or less) and low-value items, as well as the permission of portfolio-level accounting instead of applying the requirements to individual leases. New estimates and judgemental thresholds that affect the identification, classification and measurement of lease transactions, as well as requirements to reassess certain key estimates and judgements at each reporting date were introduced.
The Group is currently assessing the potential impact of IFRS 16 and plans to adopt this new standard on leases on the required effective date.
5. ACQUISITION OF BUSINESS
Acquisition of Sager Creek
The Group, through its wholly-owned U.S. subsidiary, Sager Creek Foods, Inc. (formerly Vegetable Acquisition Corp.), has acquired Sager Creek Vegetable Company’s (“Sager Creek”) vegetable business effective 10 March 2015 in San Francisco, U.S.A. Sager Creek is a producer of specialty vegetables for the foodservice and retail markets headquartered in Siloam Springs, Arkansas. Sager Creek has manufacturing operations located in North Carolina, Arkansas, and Wisconsin. Sager Creek’s well-known brands include Veg-All, Freshlike, Popeye, Princella and Allens’, among others. The cash price paid for the Sager Creek assets is US$75.0 million. Such price was established through an auction process and negotiations between the parties. The acquisition cost was financed through Del Monte Foods, Inc.’s (“DMFI”) revolving credit facility, the payment for which will be secured by the acquired assets.
The acquisition of Sager Creek’s business provides the Group access to new customers and new retail product offerings and the opportunity to expand on Sager Creek’s foodservice business platform, while driving significant operating synergies in the Group’s network of vegetable production facilities.
During the period from the date of acquisition on 10 March 2015 to 30 April 2015, Sager Creek contributed revenue of US$29.5 million and an operating loss of US$0.2 million to the Group’s results. If the acquisition had occurred on 1 May 2014, management estimates that the contribution to the revenue for the year ended 30 April 2015 would have been US$251.6 million, and operating loss would have been US$23.3 million.
(a) Consideration transferred
The consideration for the acquisition of Sager Creek was US$75.0 million and subject to post closing working capital adjustments.
(b) Acquisition-related costs
The Group incurred acquisition-related costs in respect of the acquisition of Sager Creek amounting to US$0.5 million and US$0.8 million for the years ended 30 April 2016 and 2015, respectively. These costs, which include external legal fees and due diligence costs, are included as part of “General and administrative expenses” account in the income statement.
(c) Identifiable assets acquired and liabilities assumed
The transaction was accounted for as a business acquisition under the purchase method of accounting. The following table summarises the recognised amounts of assets acquired and liabilities assumed at the date of the acquisition:
Note
Fair values recognised on acquisition 10 March
2015US$’000
Property, plant and equipment 6 39,511Intangible assets 9 25,400Other non-current assets 2,117Inventories 53,589Assets held for sale 8,113Other current assets 4,412Trade and other payables (31,113)Other non-current liabilities (461)Total identifiable net assets 101,568
Of the US$25.4 million of acquired intangible assets, US$13.5 million was assigned to customer relationships and US$11.9 million was assigned to trademarks and trade names.
AN
NU
AL
RE
PO
RT
FY
20
17
DE
L M
ON
TE
PA
CIF
IC L
IMIT
ED
161160
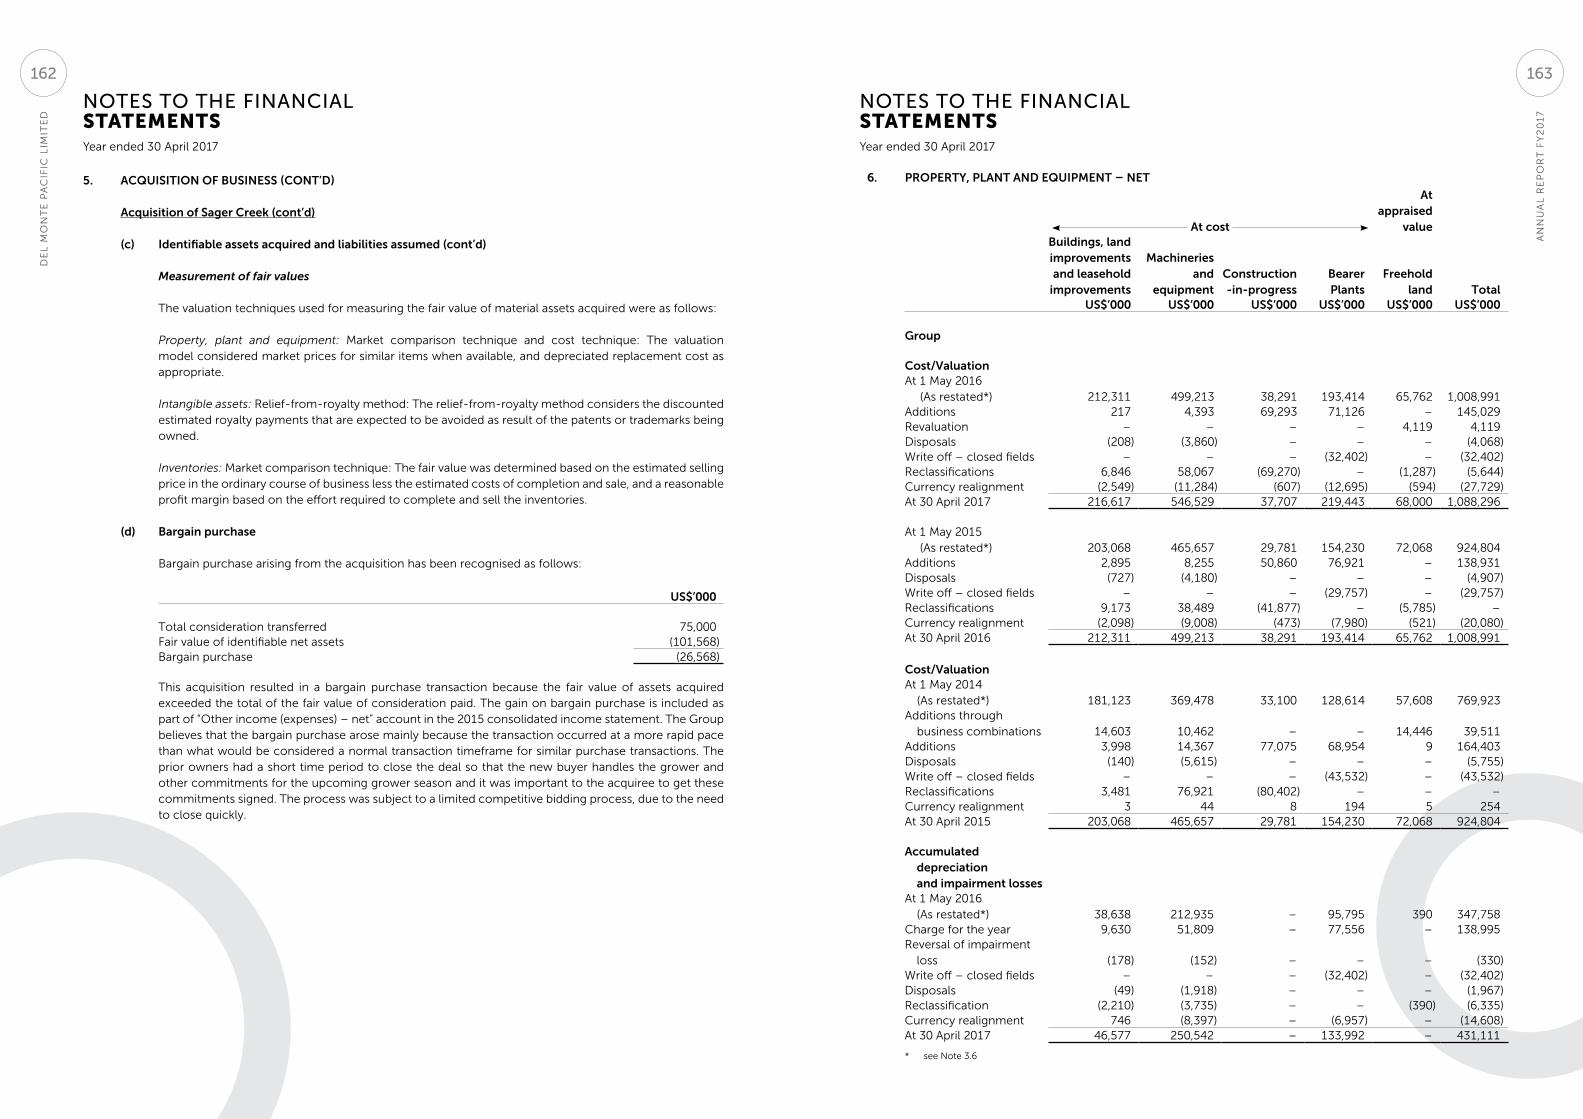
NOTES TO THE FINANCIAL STATEMENTS
NOTES TO THE FINANCIAL STATEMENTS
Year ended 30 April 2017 Year ended 30 April 2017
5. ACQUISITION OF BUSINESS (CONT’D)
Acquisition of Sager Creek (cont’d)
(c) Identifiable assets acquired and liabilities assumed (cont’d)
Measurement of fair values
The valuation techniques used for measuring the fair value of material assets acquired were as follows:
Property, plant and equipment: Market comparison technique and cost technique: The valuation model considered market prices for similar items when available, and depreciated replacement cost as appropriate.
Intangible assets: Relief-from-royalty method: The relief-from-royalty method considers the discounted estimated royalty payments that are expected to be avoided as result of the patents or trademarks being owned.
Inventories: Market comparison technique: The fair value was determined based on the estimated selling price in the ordinary course of business less the estimated costs of completion and sale, and a reasonable profit margin based on the effort required to complete and sell the inventories.
(d) Bargain purchase
Bargain purchase arising from the acquisition has been recognised as follows:
US$’000
Total consideration transferred 75,000Fair value of identifiable net assets (101,568)Bargain purchase (26,568)
This acquisition resulted in a bargain purchase transaction because the fair value of assets acquired exceeded the total of the fair value of consideration paid. The gain on bargain purchase is included as part of “Other income (expenses) – net” account in the 2015 consolidated income statement. The Group believes that the bargain purchase arose mainly because the transaction occurred at a more rapid pace than what would be considered a normal transaction timeframe for similar purchase transactions. The prior owners had a short time period to close the deal so that the new buyer handles the grower and other commitments for the upcoming grower season and it was important to the acquiree to get these commitments signed. The process was subject to a limited competitive bidding process, due to the need to close quickly.
6. PROPERTY, PLANT AND EQUIPMENT – NET
At cost
At appraised
valueBuildings, land improvements and leasehold
improvements
Machineries and
equipmentConstruction -in-progress
Bearer Plants
Freehold land Total
US$’000 US$’000 US$’000 US$’000 US$’000 US$’000
Group
Cost/ValuationAt 1 May 2016
(As restated*) 212,311 499,213 38,291 193,414 65,762 1,008,991Additions 217 4,393 69,293 71,126 – 145,029Revaluation – – – – 4,119 4,119Disposals (208) (3,860) – – – (4,068)Write off – closed fields – – – (32,402) – (32,402)Reclassifications 6,846 58,067 (69,270) – (1,287) (5,644)Currency realignment (2,549) (11,284) (607) (12,695) (594) (27,729)At 30 April 2017 216,617 546,529 37,707 219,443 68,000 1,088,296
At 1 May 2015 (As restated*) 203,068 465,657 29,781 154,230 72,068 924,804
Additions 2,895 8,255 50,860 76,921 – 138,931Disposals (727) (4,180) – – – (4,907)Write off – closed fields – – – (29,757) – (29,757)Reclassifications 9,173 38,489 (41,877) – (5,785) –Currency realignment (2,098) (9,008) (473) (7,980) (521) (20,080)At 30 April 2016 212,311 499,213 38,291 193,414 65,762 1,008,991
Cost/ValuationAt 1 May 2014
(As restated*) 181,123 369,478 33,100 128,614 57,608 769,923Additions through
business combinations 14,603 10,462 – – 14,446 39,511Additions 3,998 14,367 77,075 68,954 9 164,403Disposals (140) (5,615) – – – (5,755)Write off – closed fields – – – (43,532) – (43,532)Reclassifications 3,481 76,921 (80,402) – – –Currency realignment 3 44 8 194 5 254At 30 April 2015 203,068 465,657 29,781 154,230 72,068 924,804
Accumulated depreciation and impairment losses
At 1 May 2016 (As restated*) 38,638 212,935 – 95,795 390 347,758
Charge for the year 9,630 51,809 – 77,556 – 138,995Reversal of impairment
loss (178) (152) – – – (330)Write off – closed fields – – – (32,402) – (32,402) Disposals (49) (1,918) – – – (1,967)Reclassification (2,210) (3,735) – – (390) (6,335)Currency realignment 746 (8,397) – (6,957) – (14,608)At 30 April 2017 46,577 250,542 – 133,992 – 431,111
* see Note 3.6
AN
NU
AL
RE
PO
RT
FY
20
17
DE
L M
ON
TE
PA
CIF
IC L
IMIT
ED
163162

NOTES TO THE FINANCIAL STATEMENTS
NOTES TO THE FINANCIAL STATEMENTS
Year ended 30 April 2017 Year ended 30 April 2017
6. PROPERTY, PLANT AND EQUIPMENT – NET (CONT’D)
At cost
At appraised
valueBuildings, land improvements and leasehold
improvements
Machineries and
equipmentConstruction -in-progress
Bearer Plants
Freehold land Total
US$’000 US$’000 US$’000 US$’000 US$’000 US$’000
Group
Accumulated depreciation and impairment losses
At 1 May 2015 (As restated*) 25,940 166,275 – 53,277 – 245,492
Charge for the year 11,692 53,131 – 75,168 – 139,991Impairment loss 2,159 2,379 – – 390 4,928Write off – closed fields – – – (29,757) – (29,757)Disposals (334) (2,310) – – – (2,644)Currency realignment (819) (6,540) – (2,893) – (10,252)At 30 April 2016 38,638 212,935 – 95,795 390 347,758
At 1 May 2014 (As restated*) 15,914 120,442 – 15,879 – 152,235
Charge for the year 10,316 50,355 – 80,723 – 141,394Reversal of impairment
loss (205) (303) – – – (508)Write off – closed fields – – – (43,532) – (43,532)Disposals (6) (4,145) – – – (4,151)Currency realignment (79) (74) – 207 – 54At 30 April 2015 25,940 166,275 – 53,277 – 245,492
Carrying amountsAt 30 April 2017 170,040 295,987 37,707 85,451 68,000 657,185At 30 April 2016 173,673 286,278 38,291 97,619 65,372 661,233At 1 May 2015 177,128 299,382 29,781 100,953 72,068 679,312
* see Note 3.6
As of 30 April 2017 and 2016, the Group has amounts included in accrued liabilities for Property, Plant and Equipment acquired of US$2.1 million and US$0.7 million, respectively.
Bearer Plants
Group30 April
201730 April
20161 May2015
US$’000 US$’000 US$’000
Hectares planted with growing crops – Pineapples 16,572 15,822 15,227– Papaya 733 205 194
Fruits harvested from the growing crops: (in metric tons)– Pineapples 749,099 622,842 675,584– Papaya 11,455 4,903 8,187
* see Note 3.6
6. PROPERTY, PLANT AND EQUIPMENT – NET (CONT’D)
Bearer Plants (cont’d)
Bearer plants is stated at cost which comprises actual costs incurred in nurturing the crops reduced by the cost of fruits harvested. The cost of fruits harvested from the Group’s plant crops and subsequently used in production is the cost of the actual volume of fruits harvested in a given period. An estimated cost is necessary since the growth cycle of the plant crops is beyond twelve months, hence actual growing costs are not yet known as of reporting date. The estimated cost is developed by allocating estimated growing costs for the estimated growth cycle of two to three years over the estimated harvests to be made during the life cycle of the plant crops. Estimated growing costs are affected by inflation and foreign exchange rates, volume and labour requirements. Estimated harvest is affected by natural phenomenon such as weather patterns and volume of rainfall. Field performance and market demand also affect the level of estimated harvests. The Group reviews and monitors the estimated cost of harvested fruits regularly.
Leasehold Improvements
As at 30 April 2017 and 2016 and 1 May 2015, the Group has no significant legal or constructive obligation to dismantle any of its leasehold improvements as the lease contracts provide, among other things, that the improvements introduced on the leased assets shall become the property of the lessor upon termination of the lease.
Freehold Land
The table below summarises the valuation of freehold land held by the Group as at 30 April 2017 in various locations:
ValuationLocated in US$’000 Date of Valuation
The Philippines 9,171 2016 (Various)
United States of America 49,639 31 December 2016
Singapore 9,190 09 September 201668,000
The Group engaged independent appraisers to determine the fair values of its freehold land. Revaluations are performed at regular intervals to ensure that the fair value of the freehold land does not differ materially from its carrying amount. Management evaluated that the fair values of freehold land at the respective valuation dates approximate their fair values as of the reporting date. The assumptions used in determining the fair value are disclosed in Note 35.
The carrying amount of the freehold land of the Group as at 30 April 2017 would be US$52.7 million (30 April 2016: US$58.7 million, 30 April 2015: US$59.1 million) had the freehold land been carried at cost less impairment losses.
AN
NU
AL
RE
PO
RT
FY
20
17
DE
L M
ON
TE
PA
CIF
IC L
IMIT
ED
165164

NOTES TO THE FINANCIAL STATEMENTS
NOTES TO THE FINANCIAL STATEMENTS
Year ended 30 April 2017 Year ended 30 April 2017
6. PROPERTY, PLANT AND EQUIPMENT – NET (CONT’D)
Construction-in-Progress
Construction-in-progress includes on-going item expansion projects for the Group’s operations.
Plant closure
In April 2016, the Group announced its intention to close Sager Creek’s plant in Turkey, North Carolina. The Group closed the plant’s canning facilities during fiscal 2016 and the remainder of the production lines were redeployed to other production locations as of 30 April 2017. In connection with the plant closure, the Group recognised impairment losses on related property, plant and equipment amounting to US$5.0 million in fiscal year 2016.
Under the termination plan, approximately 300 employees were affected, about two-thirds of which were terminated by the end of fiscal 2016, and the remainder terminated in fiscal 2017. The Group recognised provisions for employee severance benefits amounting to US$1.4 million, with US$1.2 million outstanding as of 30 April 2016. The employee severance benefits are presented under “Employee benefits”. Related equipment removal costs amounting to US$2.3 million, together with other related costs, were recognised in fiscal 2016 and included under “Trade and other payables”. These expenditures were incurred in 2017 and there are no outstanding provisions as of 30 April 2017.
As of 30 April 2017, the Group has sold the Turkey plant and recognised a gain of US$0.7 million.
Source of estimation uncertainty
The Group estimates the useful lives of its buildings, land improvements, leasehold improvements and machineries and equipment based on the period over which the assets are expected to be available for use. The estimated useful lives of property, plant and equipment are reviewed periodically and are updated if expectations differ from previous estimates due to physical wear and tear, technical or commercial obsolescence and legal or other limits on the use of the assets.
In addition, the estimation of the useful lives of property, plant and equipment is based on collective assessment of industry practice, internal technical evaluation and experiences with similar assets. It is possible, however, that future financial performance could be materially affected by changes in estimates brought about by changes in factors mentioned above. The amount and timing of recorded expenses for any period would be affected by changes in these factors and circumstances. A reduction in the estimated useful lives of property, plant and equipment would increase recorded depreciation expense and decrease non-current assets.
The depreciation of bearer plants require estimation of future yield which is affected by natural phenomena and weather patterns.
The valuation of freehold land is based on comparable transaction subject to adjustments. These adjustments require judgment.
7. INVESTMENTS IN SUBSIDIARIES
30 April2017
30 April2016
1 May2015
US$’000 US$’000 US$’000(As restated*) (As restated*)
Unquoted equity shares, at cost 640,699 640,699 640,699Amounts due from subsidiaries (non-trade) 75,243 75,243 75,243
715,942 715,942 715,942
Accumulated share in profit and other comprehensive income at the beginning of the year 44,956 56,177 87,799
Share in profit of subsidiaries, net of tax 62,159 92,585 (7,993)Share in dividend income and others, net of tax 1,522 (89,442) –Share in other comprehensive loss of subsidiaries, net of tax 7,309 (14,364) (23,629)
115,946 44,956 56,177Interests in subsidiaries at the end of the year 831,888 760,898 772,119
* see Note 3.6
The amounts due from subsidiaries are unsecured and interest-free. Settlement of the balances are neither planned nor likely to occur in the foreseeable future as they are, in substance, a part of the Company’s net investments in the subsidiaries.
Details of the Company’s subsidiaries are as follows:
Name of subsidiary Principal activities
Place of in-corporation and business
Effective equity held by the Group
30 April2017
30 April2016
1 May2015
% % %
Held by the CompanyDel Monte Pacific
Resources Limited (“DMPRL”) [6]
Investment holding British Virgin Islands
100.00 100.00 100.00
DMPL India Pte Ltd (“DMPLI”) [2]
Investment holding Singapore 100.00 100.00 100.00
DMPL Management Services Pte Ltd [2]
Providing administrative support and liaison services to the Group
Singapore 100.00 100.00 100.00
GTL Limited [6] Trading food products mainly under the brand names: “Del Monte” and buyer’s own label
Federal Territory
of Labuan, Malaysia
100.00 100.00 100.00
S&W Fine Foods International Limited (“S&W”) [6]
Selling processed and fresh food products under the “S&W” trademark; Owner of the “S&W” trademark in Asia (excluding Australia and New Zealand), the Middle East, Western Europe, Eastern Europe and Africa
British Virgin Islands
100.00 100.00 100.00
DMPL Foods Limited (“DMPLFL”) [7]
Investment holding British Virgin Islands
89.43 89.43 89.43
AN
NU
AL
RE
PO
RT
FY
20
17
DE
L M
ON
TE
PA
CIF
IC L
IMIT
ED
167166
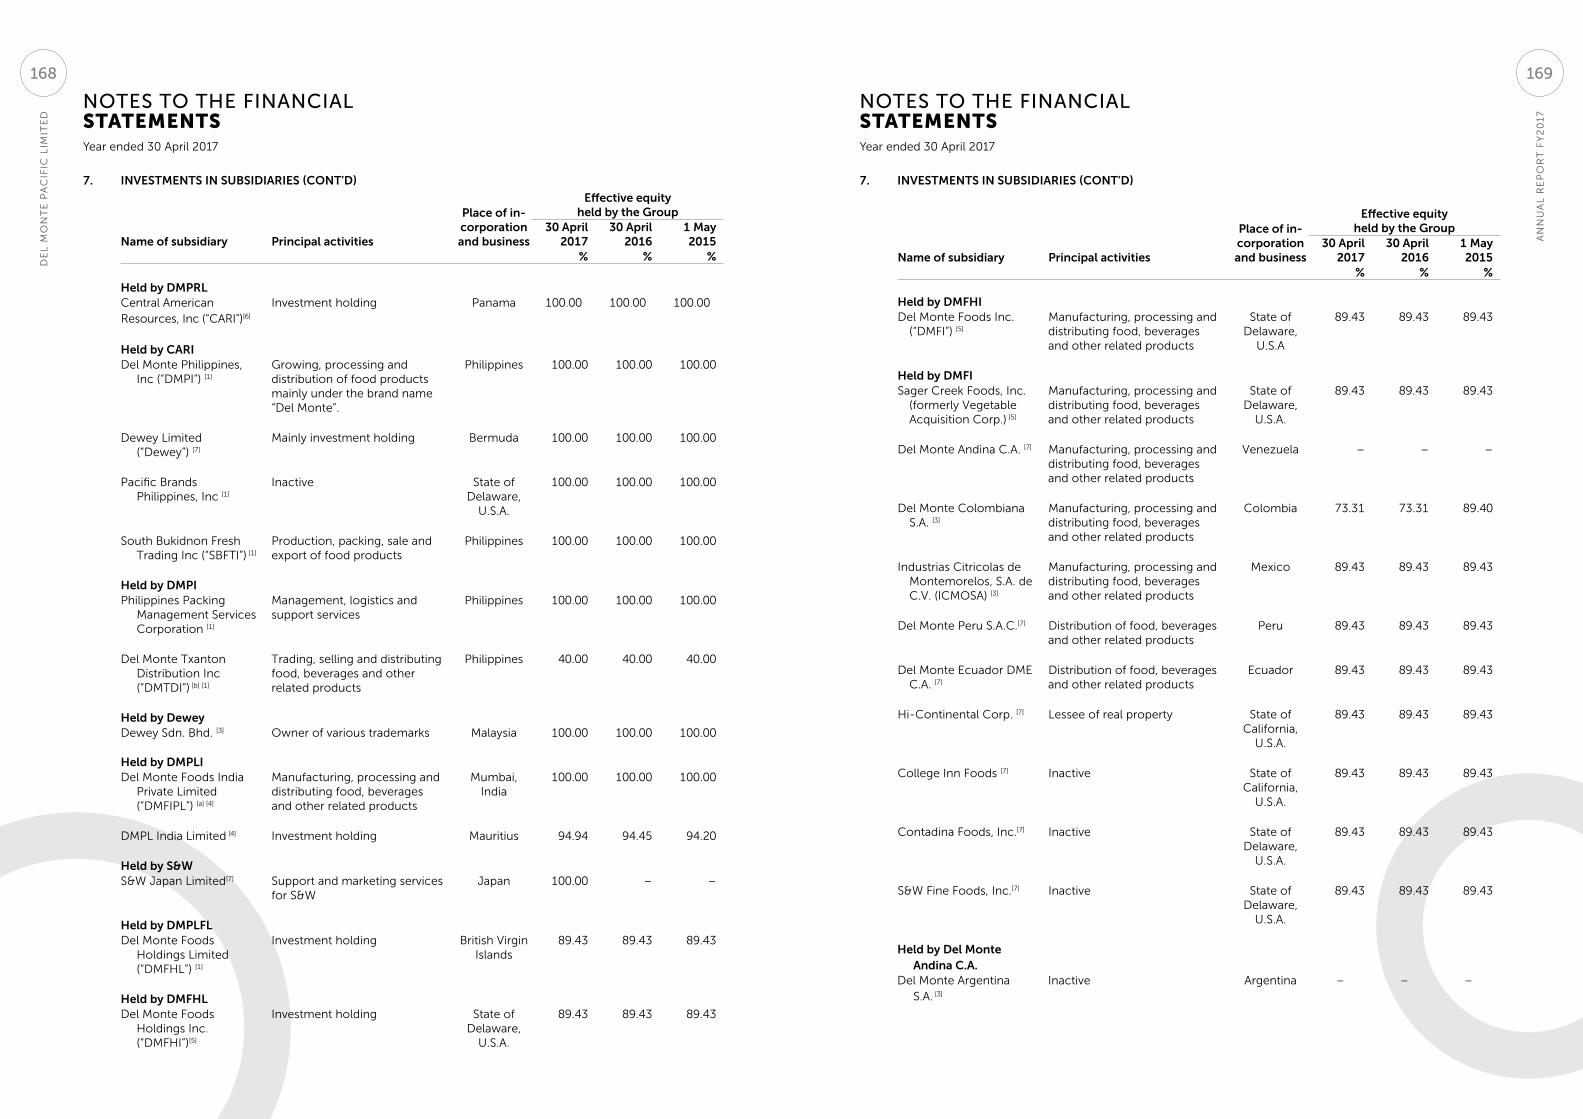
NOTES TO THE FINANCIAL STATEMENTS
NOTES TO THE FINANCIAL STATEMENTS
Year ended 30 April 2017 Year ended 30 April 2017
7. INVESTMENTS IN SUBSIDIARIES (CONT’D)
Name of subsidiary Principal activities
Place of in-corporation and business
Effective equity held by the Group
30 April2017
30 April2016
1 May2015
% % %
Held by DMPRLCentral American Resources, Inc (“CARI”)[6]
Investment holding Panama 100.00 100.00 100.00
Held by CARIDel Monte Philippines,
Inc (“DMPI”) [1]
Growing, processing and distribution of food products mainly under the brand name “Del Monte”.
Philippines 100.00 100.00 100.00
Dewey Limited (“Dewey”) [7]
Mainly investment holding Bermuda 100.00 100.00 100.00
Pacific Brands Philippines, Inc [1]
Inactive State of Delaware,
U.S.A.
100.00 100.00 100.00
South Bukidnon Fresh Trading Inc (“SBFTI”) [1]
Production, packing, sale and export of food products
Philippines 100.00 100.00 100.00
Held by DMPI Philippines Packing
Management Services Corporation [1]
Management, logistics and support services
Philippines 100.00 100.00 100.00
Del Monte Txanton Distribution Inc (“DMTDI”) [b] [1]
Trading, selling and distributing food, beverages and other related products
Philippines 40.00 40.00 40.00
Held by DeweyDewey Sdn. Bhd. [3] Owner of various trademarks Malaysia 100.00 100.00 100.00
Held by DMPLIDel Monte Foods India
Private Limited (“DMFIPL”) [a] [4]
Manufacturing, processing and distributing food, beverages and other related products
Mumbai, India
100.00 100.00 100.00
DMPL India Limited [4] Investment holding Mauritius 94.94 94.45 94.20
Held by S&WS&W Japan Limited[7] Support and marketing services
for S&WJapan 100.00 – –
Held by DMPLFLDel Monte Foods
Holdings Limited (“DMFHL”) [1]
Investment holding British Virgin Islands
89.43 89.43 89.43
Held by DMFHLDel Monte Foods
Holdings Inc. (“DMFHI”)[5]
Investment holding State of Delaware,
U.S.A.
89.43 89.43 89.43
7. INVESTMENTS IN SUBSIDIARIES (CONT’D)
Name of subsidiary Principal activities
Place of in-corporation and business
Effective equity held by the Group
30 April2017
30 April2016
1 May2015
% % %
Held by DMFHIDel Monte Foods Inc.
(“DMFI”) [5]
Manufacturing, processing and distributing food, beverages and other related products
State of Delaware,
U.S.A
89.43 89.43 89.43
Held by DMFISager Creek Foods, Inc.
(formerly Vegetable Acquisition Corp.) [5]
Manufacturing, processing and distributing food, beverages and other related products
State of Delaware,
U.S.A.
89.43 89.43 89.43
Del Monte Andina C.A. [7] Manufacturing, processing and distributing food, beverages and other related products
Venezuela – – –
Del Monte Colombiana S.A. [3]
Manufacturing, processing and distributing food, beverages and other related products
Colombia 73.31 73.31 89.40
Industrias Citricolas de Montemorelos, S.A. de C.V. (ICMOSA) [3]
Manufacturing, processing and distributing food, beverages and other related products
Mexico 89.43 89.43 89.43
Del Monte Peru S.A.C.[7] Distribution of food, beverages and other related products
Peru 89.43 89.43 89.43
Del Monte Ecuador DME C.A. [7]
Distribution of food, beverages and other related products
Ecuador 89.43 89.43 89.43
Hi-Continental Corp. [7] Lessee of real property State of California,
U.S.A.
89.43 89.43 89.43
College Inn Foods [7] Inactive State of California,
U.S.A.
89.43 89.43 89.43
Contadina Foods, Inc.[7] Inactive State of Delaware,
U.S.A.
89.43 89.43 89.43
S&W Fine Foods, Inc.[7] Inactive State of Delaware,
U.S.A.
89.43 89.43 89.43
Held by Del Monte Andina C.A.
Del Monte Argentina S.A. [3]
Inactive Argentina – – –
AN
NU
AL
RE
PO
RT
FY
20
17
DE
L M
ON
TE
PA
CIF
IC L
IMIT
ED
169168

NOTES TO THE FINANCIAL STATEMENTS
NOTES TO THE FINANCIAL STATEMENTS
Year ended 30 April 2017 Year ended 30 April 2017
7. INVESTMENTS IN SUBSIDIARIES (CONT’D)
(a) 0.1% held by DMPRL(b) DMTDI is consolidated as the Group has de facto control over the entity.
Management believes that the Group has control over DTMTDI since it is exposed, or has rights, to variable returns and has the ability to affect those returns through its power over DMTDI. [1] Audited by SyCip Gorres Velayo & Co. (“SGV”)[2] Audited by Ernst and Young LLP (“EY”) Singapore[3] Audited by Ernst & Young member firms in the respective countries[4] Audited by other certified public accountants. Subsidiary is not significant under rule 718 of the SGX-ST Listing Manual[5] Not required to be audited in the country of incorporation. Audited by SGV for the purpose of group reporting[6] Not required to be audited in the country of incorporation. Audited by Ernst and Young LLP, Singapore for the purpose of group reporting [7] Not required to be audited in the country of incorporation
The Company regularly reassesses whether it controls an investee when facts and circumstances indicate that there are changes to one or more of the three elements of control listed on Note 4. The Company determined that it exercised control on all its subsidiaries as it has all elements of control.
In fiscal year 2015, the Group deconsolidated its subsidiary, Del Monte Andina C.A., an entity which has operations in Venezuela. Venezuela has a hyperinflationary economy. The Venezuelan exchange control regulations have resulted in other-than-temporary lack of exchangeability between the Venezuelan Bolivar and US Dollar. This has restricted the Venezuelan entity’s ability to pay dividends and obligations denominated in US Dollars. The exchange regulations, combined with other recent Venezuelan regulations, have constrained the Venezuelan entity’s ability to maintain normal production. Due to the Group’s inability to effectively control the operations of the entity, the Group deconsolidated the subsidiary with effect from February 2015. The equity interest in this entity is determined to be the cost of investment of the entity at the date of deconsolidation. The investment is carried at cost less impairment.
The deconsolidation of the Venezuelan entity resulted in a loss from deconsolidation of US$5.2 million, which was recognised as part of “Other income (expenses) – net” in the 2015 income statement (See Note 26).
Prior to deconsolidation, the Group treated Venezuela as a highly inflationary economy based upon the three-year cumulative inflation rate, effective as of 18 February 2014, the date of the completion of the acquisition of the Consumer Food Business. The functional currency for the Group’s Venezuelan subsidiary is the Venezuelan Bolivar. Management has restated the subsidiary’s financial statements, whereby financial information recorded in the hyperinflationary currency is adjusted using the current cost approach by applying the Venezuelan National Consumer Price Index to calculate the inflation adjustment factor of 1.10 and expressed this in the measuring unit (the hyperinflationary currency) current at the end of the reporting period. The Group used the official SICAD I rate to translate these financial statements for purposes of consolidation. The financial statements for the South American entity are based on a historical cost basis.
Source of estimation uncertainty
When the subsidiary has suffered recurring operating losses, a test is made to assess whether the interests in subsidiary has suffered any impairment by determining the recoverable amount. This determination requires significant judgement and estimation. An estimate is made of the future profitability, cash flow, financial health and near-term business outlook of the subsidiary, including factors such as market demand and performance. The recoverable amount will differ from these estimates as a result of differences between assumptions used and actual operations.
8. INVESTMENTS IN JOINT VENTURES
Name of joint venture Principal activities
Place of incorporation and business
Effective equity held by the Group
30 April2017
30 April2016
1 May2015
% % %
FieldFresh Foods Private Limited (“FFPL”) *
Production and sale of fresh and processed fruits and vegetable food products
India 47.47 47.23 47.08
Nice Fruit Hong Kong Limited (NFHKL) #
Production and sale of frozen fruits and vegetable food products
Hong Kong 35.00 35.00 35.00
* Audited by Deloitte Haskins & Sells, Gurgaon, India.# Audited by Ernst and Young Hong Kong. Not material to the Group as at 30 April 2017.
The summarised financial information of a material joint venture, FFPL, not adjusted for the percentage ownership held by the Group, is as follows:
Year ended 30 April 2017
Year ended 30 April 2016
Year ended 30 April 2015
US$’000 US$’000 US$’000
Revenue 72,914 65,838 62,285
Loss from continuing operations a (3,140) (3,398) (4,564)Other comprehensive income – (3) (369)Total comprehensive income (3,140) (3,401) (4,933)a Includes:– depreciation 177 168 264– interest expense 2,086 2,605 2,876
Non-current assets 15,877 17,110 18,365Current assets b 20,907 23,842 19,292Non-current liabilities c (19,927) (25,271) (25,821)Current liabilities d (11,616) (14,283) (10,807)Net assets 5,241 1,398 1,029Proportion of the Group’s ownership including
non-controlling interest 50% 50% 50%2,621 699 515
Goodwill 20,000 20,000 20,000Valuation difference 1,251 (38) (96)Carrying amount of investment 23,872 20,661 20,419
Includes:b Cash and cash equivalents 111 96 70c Non-current financial liabilities (excluding trade and
other payables) 8,187 13,548 25,821d Current financial liabilities (excluding
trade and other payables) 10,828 11,727 –
AN
NU
AL
RE
PO
RT
FY
20
17
DE
L M
ON
TE
PA
CIF
IC L
IMIT
ED
171170
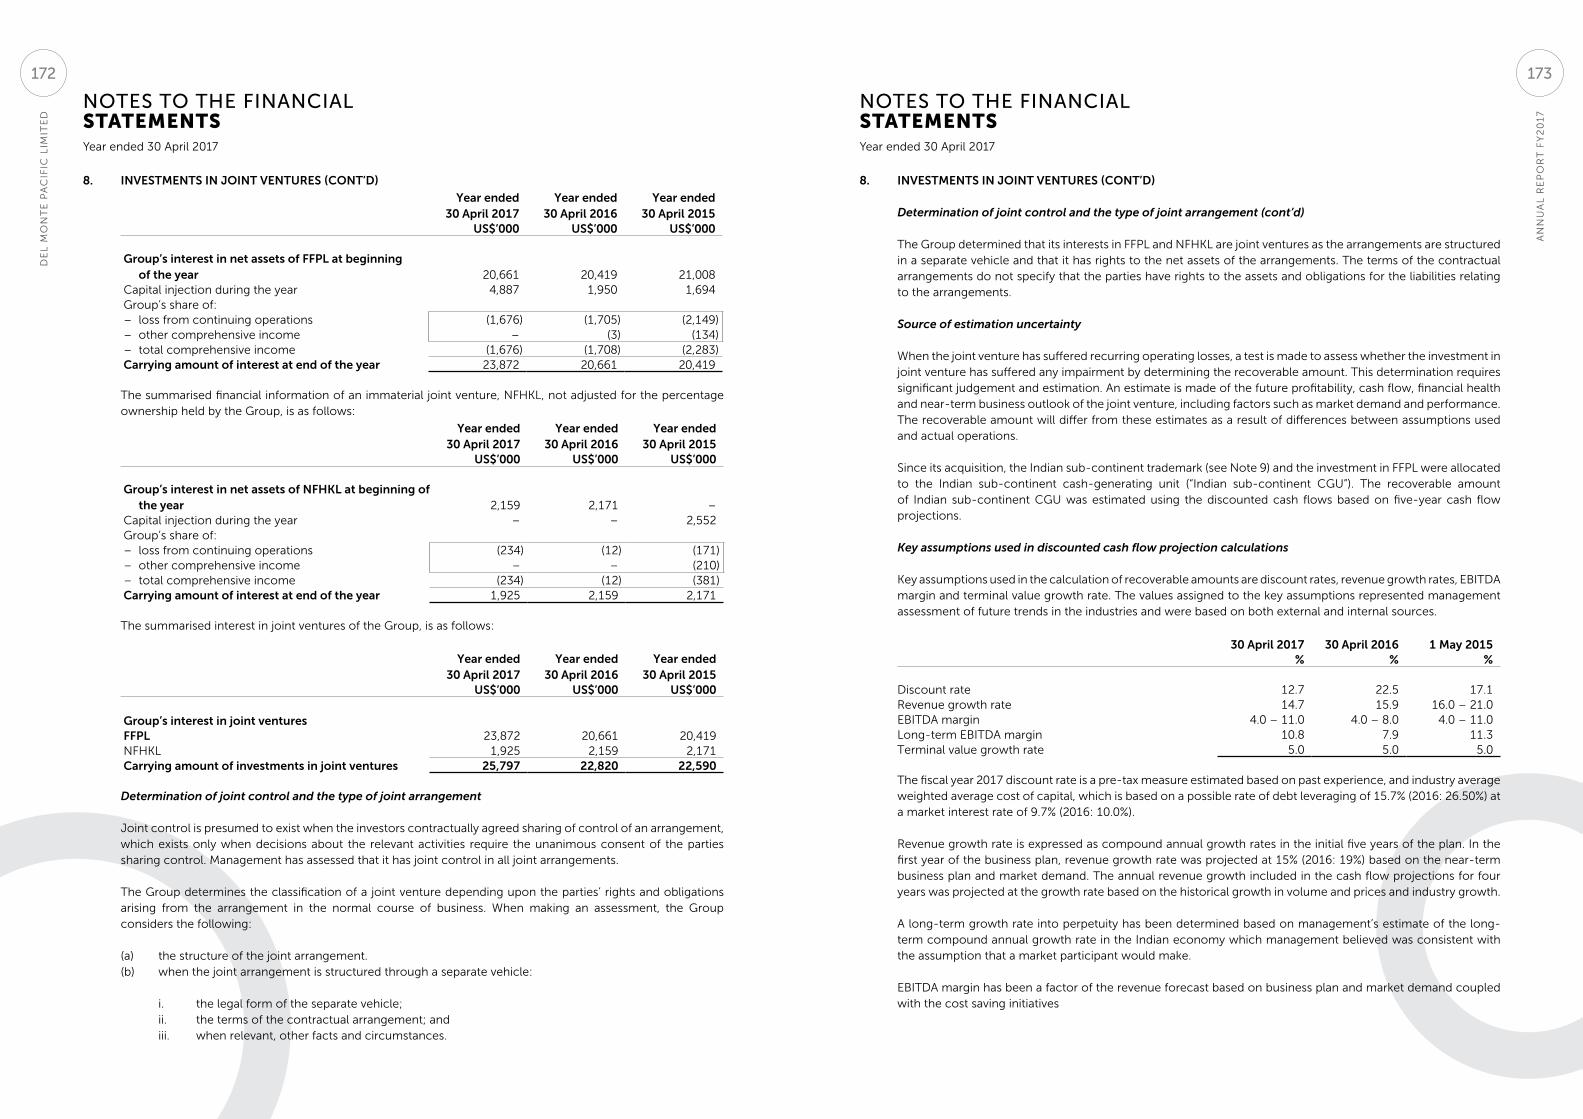
NOTES TO THE FINANCIAL STATEMENTS
NOTES TO THE FINANCIAL STATEMENTS
Year ended 30 April 2017 Year ended 30 April 2017
8. INVESTMENTS IN JOINT VENTURES (CONT’D)
Year ended 30 April 2017
Year ended 30 April 2016
Year ended 30 April 2015
US$’000 US$’000 US$’000
Group’s interest in net assets of FFPL at beginning of the year 20,661 20,419 21,008
Capital injection during the year 4,887 1,950 1,694Group’s share of:– loss from continuing operations (1,676) (1,705) (2,149)– other comprehensive income – (3) (134)– total comprehensive income (1,676) (1,708) (2,283)Carrying amount of interest at end of the year 23,872 20,661 20,419
The summarised financial information of an immaterial joint venture, NFHKL, not adjusted for the percentage ownership held by the Group, is as follows:
Year ended 30 April 2017
Year ended 30 April 2016
Year ended 30 April 2015
US$’000 US$’000 US$’000
Group’s interest in net assets of NFHKL at beginning of the year 2,159 2,171 –
Capital injection during the year – – 2,552Group’s share of:– loss from continuing operations (234) (12) (171)– other comprehensive income – – (210)– total comprehensive income (234) (12) (381)Carrying amount of interest at end of the year 1,925 2,159 2,171
The summarised interest in joint ventures of the Group, is as follows:
Year ended 30 April 2017
Year ended 30 April 2016
Year ended 30 April 2015
US$’000 US$’000 US$’000
Group’s interest in joint venturesFFPL 23,872 20,661 20,419NFHKL 1,925 2,159 2,171Carrying amount of investments in joint ventures 25,797 22,820 22,590
Determination of joint control and the type of joint arrangement
Joint control is presumed to exist when the investors contractually agreed sharing of control of an arrangement, which exists only when decisions about the relevant activities require the unanimous consent of the parties sharing control. Management has assessed that it has joint control in all joint arrangements.
The Group determines the classification of a joint venture depending upon the parties’ rights and obligations arising from the arrangement in the normal course of business. When making an assessment, the Group considers the following:
(a) the structure of the joint arrangement.(b) when the joint arrangement is structured through a separate vehicle:
i. the legal form of the separate vehicle;ii. the terms of the contractual arrangement; andiii. when relevant, other facts and circumstances.
8. INVESTMENTS IN JOINT VENTURES (CONT’D)
Determination of joint control and the type of joint arrangement (cont’d)
The Group determined that its interests in FFPL and NFHKL are joint ventures as the arrangements are structured in a separate vehicle and that it has rights to the net assets of the arrangements. The terms of the contractual arrangements do not specify that the parties have rights to the assets and obligations for the liabilities relating to the arrangements.
Source of estimation uncertainty
When the joint venture has suffered recurring operating losses, a test is made to assess whether the investment in joint venture has suffered any impairment by determining the recoverable amount. This determination requires significant judgement and estimation. An estimate is made of the future profitability, cash flow, financial health and near-term business outlook of the joint venture, including factors such as market demand and performance. The recoverable amount will differ from these estimates as a result of differences between assumptions used and actual operations.
Since its acquisition, the Indian sub-continent trademark (see Note 9) and the investment in FFPL were allocated to the Indian sub-continent cash-generating unit (“Indian sub-continent CGU”). The recoverable amount of Indian sub-continent CGU was estimated using the discounted cash flows based on five-year cash flow projections.
Key assumptions used in discounted cash flow projection calculations
Key assumptions used in the calculation of recoverable amounts are discount rates, revenue growth rates, EBITDA margin and terminal value growth rate. The values assigned to the key assumptions represented management assessment of future trends in the industries and were based on both external and internal sources.
30 April 2017 30 April 2016 1 May 2015% % %
Discount rate 12.7 22.5 17.1Revenue growth rate 14.7 15.9 16.0 – 21.0EBITDA margin 4.0 – 11.0 4.0 – 8.0 4.0 – 11.0Long-term EBITDA margin 10.8 7.9 11.3Terminal value growth rate 5.0 5.0 5.0
The fiscal year 2017 discount rate is a pre-tax measure estimated based on past experience, and industry average weighted average cost of capital, which is based on a possible rate of debt leveraging of 15.7% (2016: 26.50%) at a market interest rate of 9.7% (2016: 10.0%).
Revenue growth rate is expressed as compound annual growth rates in the initial five years of the plan. In the first year of the business plan, revenue growth rate was projected at 15% (2016: 19%) based on the near-term business plan and market demand. The annual revenue growth included in the cash flow projections for four years was projected at the growth rate based on the historical growth in volume and prices and industry growth.
A long-term growth rate into perpetuity has been determined based on management’s estimate of the long-term compound annual growth rate in the Indian economy which management believed was consistent with the assumption that a market participant would make.
EBITDA margin has been a factor of the revenue forecast based on business plan and market demand coupled with the cost saving initiatives
AN
NU
AL
RE
PO
RT
FY
20
17
DE
L M
ON
TE
PA
CIF
IC L
IMIT
ED
173172
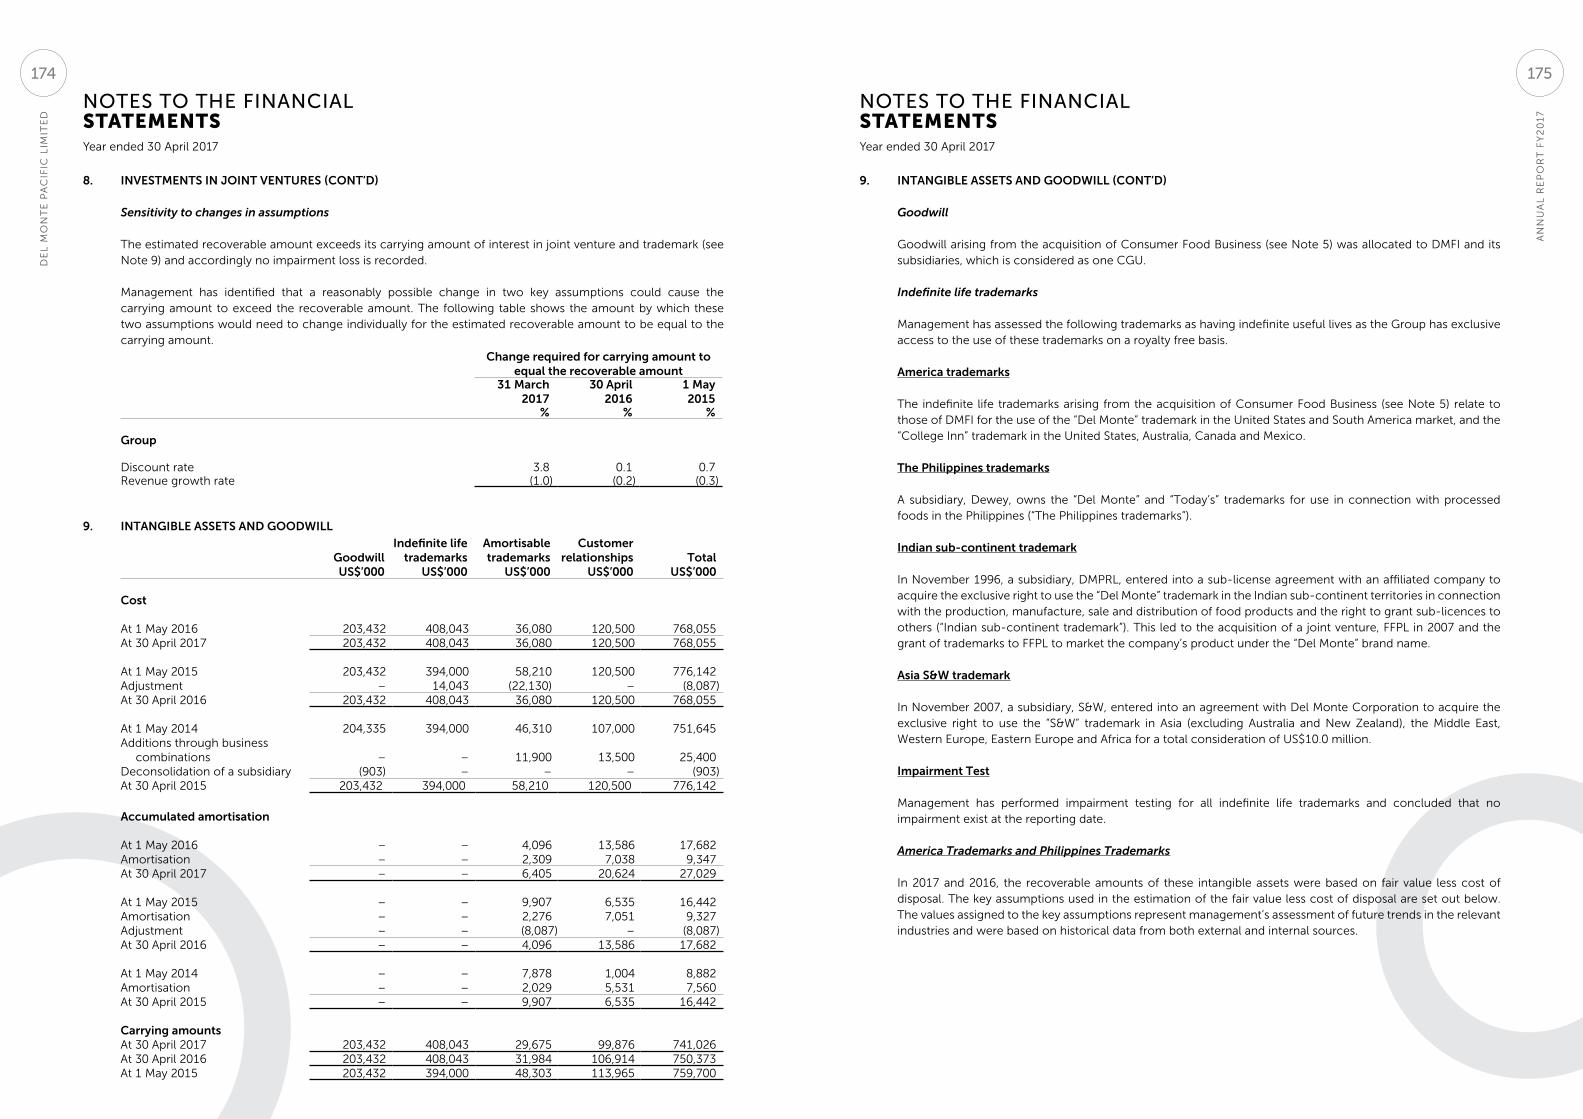
NOTES TO THE FINANCIAL STATEMENTS
NOTES TO THE FINANCIAL STATEMENTS
Year ended 30 April 2017 Year ended 30 April 2017
8. INVESTMENTS IN JOINT VENTURES (CONT’D)
Sensitivity to changes in assumptions
The estimated recoverable amount exceeds its carrying amount of interest in joint venture and trademark (see Note 9) and accordingly no impairment loss is recorded.
Management has identified that a reasonably possible change in two key assumptions could cause the carrying amount to exceed the recoverable amount. The following table shows the amount by which these two assumptions would need to change individually for the estimated recoverable amount to be equal to the carrying amount.
Change required for carrying amount to equal the recoverable amount
31 March 2017
30 April 2016
1 May 2015
% % %
Group
Discount rate 3.8 0.1 0.7Revenue growth rate (1.0) (0.2) (0.3)
9. INTANGIBLE ASSETS AND GOODWILL
GoodwillIndefinite life
trademarksAmortisable trademarks
Customer relationships Total
US$’000 US$’000 US$’000 US$’000 US$’000
Cost
At 1 May 2016 203,432 408,043 36,080 120,500 768,055At 30 April 2017 203,432 408,043 36,080 120,500 768,055
At 1 May 2015 203,432 394,000 58,210 120,500 776,142Adjustment – 14,043 (22,130) – (8,087)At 30 April 2016 203,432 408,043 36,080 120,500 768,055
At 1 May 2014 204,335 394,000 46,310 107,000 751,645Additions through business
combinations – – 11,900 13,500 25,400Deconsolidation of a subsidiary (903) – – – (903)At 30 April 2015 203,432 394,000 58,210 120,500 776,142
Accumulated amortisation
At 1 May 2016 – – 4,096 13,586 17,682 Amortisation – – 2,309 7,038 9,347 At 30 April 2017 – – 6,405 20,624 27,029
At 1 May 2015 – – 9,907 6,535 16,442Amortisation – – 2,276 7,051 9,327Adjustment – – (8,087) – (8,087)At 30 April 2016 – – 4,096 13,586 17,682
At 1 May 2014 – – 7,878 1,004 8,882Amortisation – – 2,029 5,531 7,560At 30 April 2015 – – 9,907 6,535 16,442
Carrying amountsAt 30 April 2017 203,432 408,043 29,675 99,876 741,026At 30 April 2016 203,432 408,043 31,984 106,914 750,373 At 1 May 2015 203,432 394,000 48,303 113,965 759,700
9. INTANGIBLE ASSETS AND GOODWILL (CONT’D)
Goodwill
Goodwill arising from the acquisition of Consumer Food Business (see Note 5) was allocated to DMFI and its subsidiaries, which is considered as one CGU.
Indefinite life trademarks
Management has assessed the following trademarks as having indefinite useful lives as the Group has exclusive access to the use of these trademarks on a royalty free basis.
America trademarks
The indefinite life trademarks arising from the acquisition of Consumer Food Business (see Note 5) relate to those of DMFI for the use of the “Del Monte” trademark in the United States and South America market, and the “College Inn” trademark in the United States, Australia, Canada and Mexico.
The Philippines trademarks
A subsidiary, Dewey, owns the “Del Monte” and “Today’s” trademarks for use in connection with processed foods in the Philippines (“The Philippines trademarks”).
Indian sub-continent trademark
In November 1996, a subsidiary, DMPRL, entered into a sub-license agreement with an affiliated company to acquire the exclusive right to use the “Del Monte” trademark in the Indian sub-continent territories in connection with the production, manufacture, sale and distribution of food products and the right to grant sub-licences to others (“Indian sub-continent trademark”). This led to the acquisition of a joint venture, FFPL in 2007 and the grant of trademarks to FFPL to market the company’s product under the “Del Monte” brand name.
Asia S&W trademark
In November 2007, a subsidiary, S&W, entered into an agreement with Del Monte Corporation to acquire the exclusive right to use the “S&W” trademark in Asia (excluding Australia and New Zealand), the Middle East, Western Europe, Eastern Europe and Africa for a total consideration of US$10.0 million.
Impairment Test
Management has performed impairment testing for all indefinite life trademarks and concluded that no impairment exist at the reporting date.
America Trademarks and Philippines Trademarks
In 2017 and 2016, the recoverable amounts of these intangible assets were based on fair value less cost of disposal. The key assumptions used in the estimation of the fair value less cost of disposal are set out below. The values assigned to the key assumptions represent management’s assessment of future trends in the relevant industries and were based on historical data from both external and internal sources.
AN
NU
AL
RE
PO
RT
FY
20
17
DE
L M
ON
TE
PA
CIF
IC L
IMIT
ED
175174
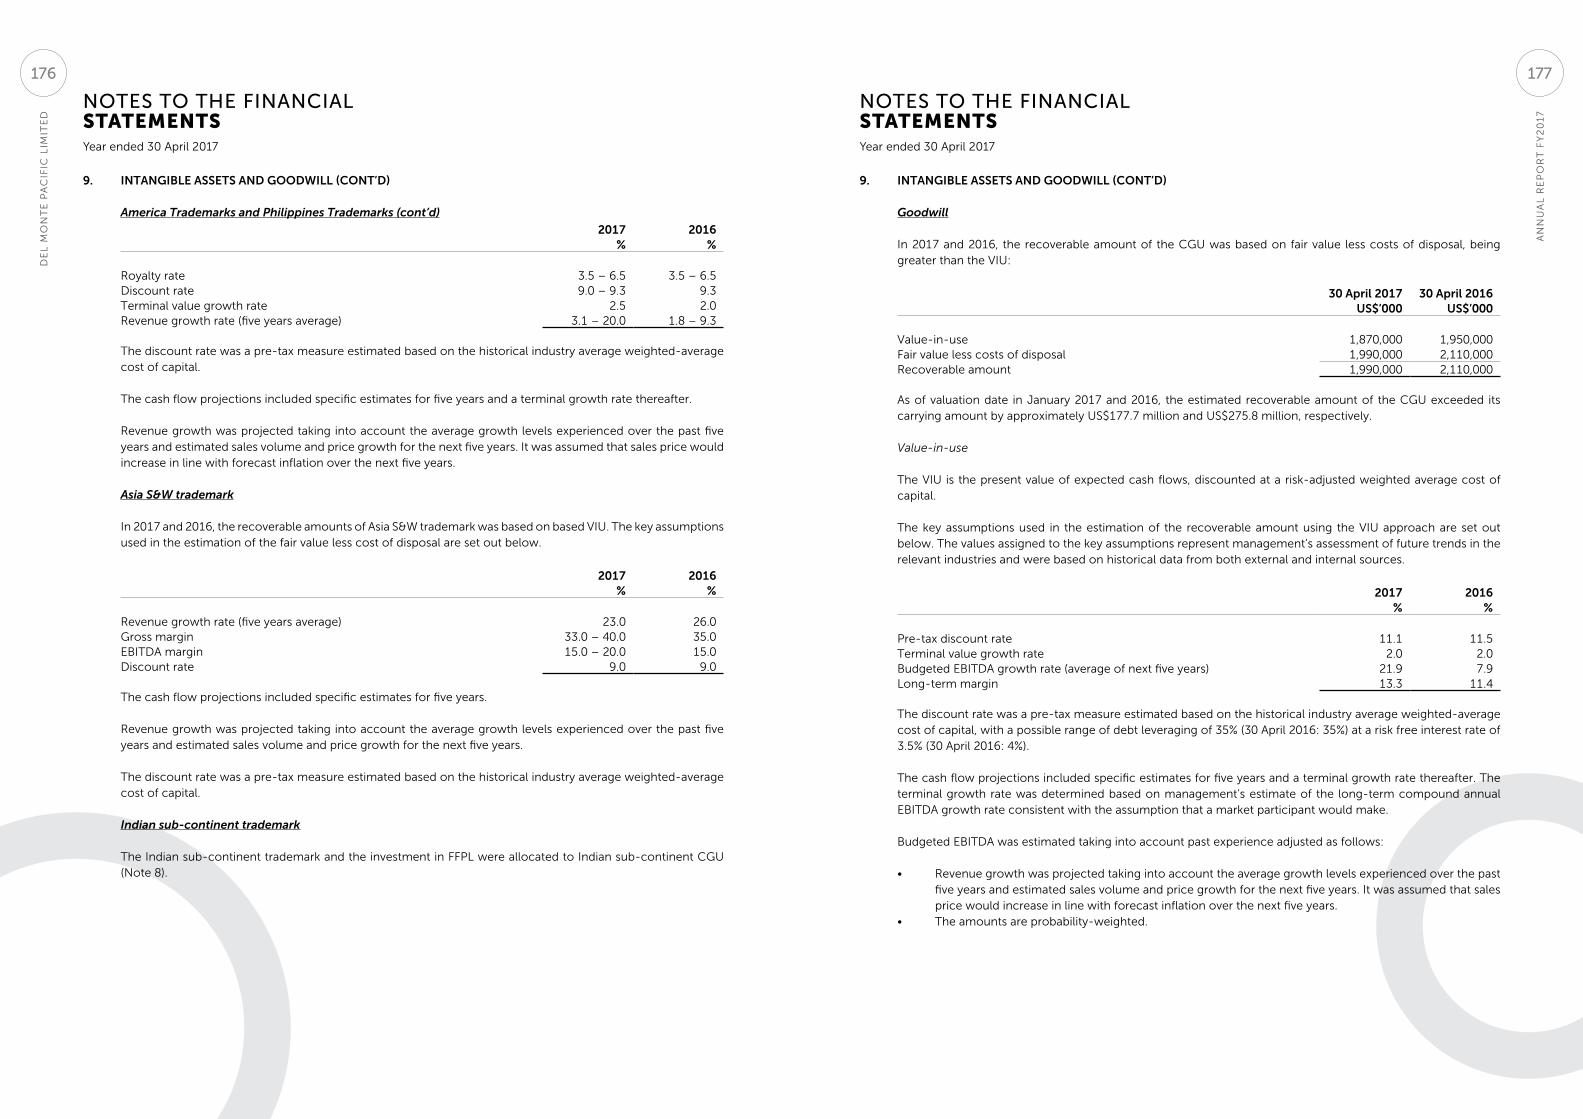
NOTES TO THE FINANCIAL STATEMENTS
NOTES TO THE FINANCIAL STATEMENTS
Year ended 30 April 2017 Year ended 30 April 2017
9. INTANGIBLE ASSETS AND GOODWILL (CONT’D)
America Trademarks and Philippines Trademarks (cont’d)
2017 2016% %
Royalty rate 3.5 – 6.5 3.5 – 6.5Discount rate 9.0 – 9.3 9.3Terminal value growth rate 2.5 2.0Revenue growth rate (five years average) 3.1 – 20.0 1.8 – 9.3
The discount rate was a pre-tax measure estimated based on the historical industry average weighted-average cost of capital.
The cash flow projections included specific estimates for five years and a terminal growth rate thereafter.
Revenue growth was projected taking into account the average growth levels experienced over the past five years and estimated sales volume and price growth for the next five years. It was assumed that sales price would increase in line with forecast inflation over the next five years.
Asia S&W trademark
In 2017 and 2016, the recoverable amounts of Asia S&W trademark was based on based VIU. The key assumptions used in the estimation of the fair value less cost of disposal are set out below.
2017 2016% %
Revenue growth rate (five years average) 23.0 26.0Gross margin 33.0 – 40.0 35.0EBITDA margin 15.0 – 20.0 15.0Discount rate 9.0 9.0
The cash flow projections included specific estimates for five years.
Revenue growth was projected taking into account the average growth levels experienced over the past five years and estimated sales volume and price growth for the next five years.
The discount rate was a pre-tax measure estimated based on the historical industry average weighted-average cost of capital.
Indian sub-continent trademark
The Indian sub-continent trademark and the investment in FFPL were allocated to Indian sub-continent CGU (Note 8).
9. INTANGIBLE ASSETS AND GOODWILL (CONT’D)
Goodwill
In 2017 and 2016, the recoverable amount of the CGU was based on fair value less costs of disposal, being greater than the VIU:
30 April 2017 30 April 2016 US$’000 US$’000
Value-in-use 1,870,000 1,950,000Fair value less costs of disposal 1,990,000 2,110,000Recoverable amount 1,990,000 2,110,000
As of valuation date in January 2017 and 2016, the estimated recoverable amount of the CGU exceeded its carrying amount by approximately US$177.7 million and US$275.8 million, respectively.
Value-in-use
The VIU is the present value of expected cash flows, discounted at a risk-adjusted weighted average cost of capital.
The key assumptions used in the estimation of the recoverable amount using the VIU approach are set out below. The values assigned to the key assumptions represent management’s assessment of future trends in the relevant industries and were based on historical data from both external and internal sources.
2017 2016% %
Pre-tax discount rate 11.1 11.5Terminal value growth rate 2.0 2.0Budgeted EBITDA growth rate (average of next five years) 21.9 7.9Long-term margin 13.3 11.4
The discount rate was a pre-tax measure estimated based on the historical industry average weighted-average cost of capital, with a possible range of debt leveraging of 35% (30 April 2016: 35%) at a risk free interest rate of 3.5% (30 April 2016: 4%).
The cash flow projections included specific estimates for five years and a terminal growth rate thereafter. The terminal growth rate was determined based on management’s estimate of the long-term compound annual EBITDA growth rate consistent with the assumption that a market participant would make.
Budgeted EBITDA was estimated taking into account past experience adjusted as follows:
• Revenue growth was projected taking into account the average growth levels experienced over the past five years and estimated sales volume and price growth for the next five years. It was assumed that sales price would increase in line with forecast inflation over the next five years.
• The amounts are probability-weighted.
AN
NU
AL
RE
PO
RT
FY
20
17
DE
L M
ON
TE
PA
CIF
IC L
IMIT
ED
177176
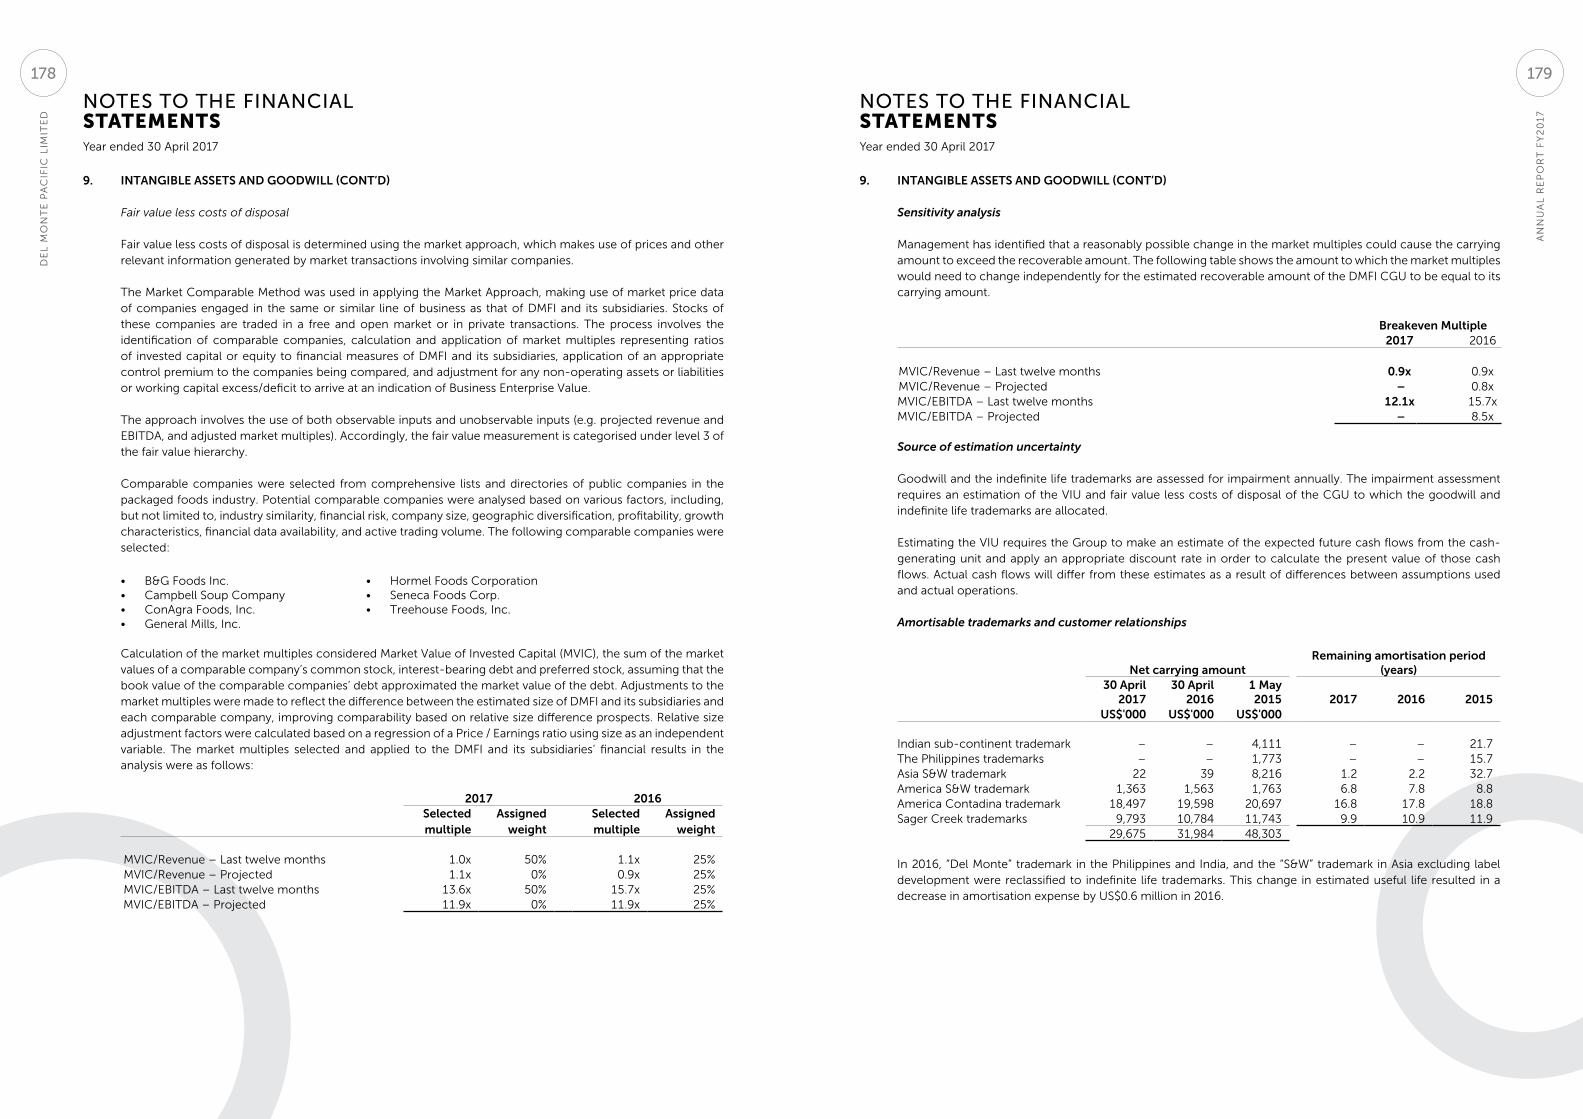
NOTES TO THE FINANCIAL STATEMENTS
NOTES TO THE FINANCIAL STATEMENTS
Year ended 30 April 2017 Year ended 30 April 2017
9. INTANGIBLE ASSETS AND GOODWILL (CONT’D)
Fair value less costs of disposal
Fair value less costs of disposal is determined using the market approach, which makes use of prices and other relevant information generated by market transactions involving similar companies.
The Market Comparable Method was used in applying the Market Approach, making use of market price data of companies engaged in the same or similar line of business as that of DMFI and its subsidiaries. Stocks of these companies are traded in a free and open market or in private transactions. The process involves the identification of comparable companies, calculation and application of market multiples representing ratios of invested capital or equity to financial measures of DMFI and its subsidiaries, application of an appropriate control premium to the companies being compared, and adjustment for any non-operating assets or liabilities or working capital excess/deficit to arrive at an indication of Business Enterprise Value.
The approach involves the use of both observable inputs and unobservable inputs (e.g. projected revenue and EBITDA, and adjusted market multiples). Accordingly, the fair value measurement is categorised under level 3 of the fair value hierarchy.
Comparable companies were selected from comprehensive lists and directories of public companies in the packaged foods industry. Potential comparable companies were analysed based on various factors, including, but not limited to, industry similarity, financial risk, company size, geographic diversification, profitability, growth characteristics, financial data availability, and active trading volume. The following comparable companies were selected:
• B&G Foods Inc.• Campbell Soup Company• ConAgra Foods, Inc.• General Mills, Inc.
• Hormel Foods Corporation• Seneca Foods Corp.• Treehouse Foods, Inc.
Calculation of the market multiples considered Market Value of Invested Capital (MVIC), the sum of the market values of a comparable company’s common stock, interest-bearing debt and preferred stock, assuming that the book value of the comparable companies’ debt approximated the market value of the debt. Adjustments to the market multiples were made to reflect the difference between the estimated size of DMFI and its subsidiaries and each comparable company, improving comparability based on relative size difference prospects. Relative size adjustment factors were calculated based on a regression of a Price / Earnings ratio using size as an independent variable. The market multiples selected and applied to the DMFI and its subsidiaries’ financial results in the analysis were as follows:
2017 2016Selected multiple
Assigned weight
Selected multiple
Assigned weight
MVIC/Revenue – Last twelve months 1.0x 50% 1.1x 25%MVIC/Revenue – Projected 1.1x 0% 0.9x 25%MVIC/EBITDA – Last twelve months 13.6x 50% 15.7x 25%MVIC/EBITDA – Projected 11.9x 0% 11.9x 25%
9. INTANGIBLE ASSETS AND GOODWILL (CONT’D)
Sensitivity analysis
Management has identified that a reasonably possible change in the market multiples could cause the carrying amount to exceed the recoverable amount. The following table shows the amount to which the market multiples would need to change independently for the estimated recoverable amount of the DMFI CGU to be equal to its carrying amount.
Breakeven Multiple2017 2016
MVIC/Revenue – Last twelve months 0.9x 0.9xMVIC/Revenue – Projected – 0.8xMVIC/EBITDA – Last twelve months 12.1x 15.7xMVIC/EBITDA – Projected – 8.5x
Source of estimation uncertainty
Goodwill and the indefinite life trademarks are assessed for impairment annually. The impairment assessment requires an estimation of the VIU and fair value less costs of disposal of the CGU to which the goodwill and indefinite life trademarks are allocated.
Estimating the VIU requires the Group to make an estimate of the expected future cash flows from the cash-generating unit and apply an appropriate discount rate in order to calculate the present value of those cash flows. Actual cash flows will differ from these estimates as a result of differences between assumptions used and actual operations.
Amortisable trademarks and customer relationships
Net carrying amountRemaining amortisation period
(years)30 April
201730 April
20161 May 2015 2017 2016 2015
US$'000 US$'000 US$'000
Indian sub-continent trademark – – 4,111 – – 21.7The Philippines trademarks – – 1,773 – – 15.7Asia S&W trademark 22 39 8,216 1.2 2.2 32.7America S&W trademark 1,363 1,563 1,763 6.8 7.8 8.8America Contadina trademark 18,497 19,598 20,697 16.8 17.8 18.8Sager Creek trademarks 9,793 10,784 11,743 9.9 10.9 11.9
29,675 31,984 48,303
In 2016, “Del Monte” trademark in the Philippines and India, and the “S&W” trademark in Asia excluding label development were reclassified to indefinite life trademarks. This change in estimated useful life resulted in a decrease in amortisation expense by US$0.6 million in 2016.
AN
NU
AL
RE
PO
RT
FY
20
17
DE
L M
ON
TE
PA
CIF
IC L
IMIT
ED
179178

NOTES TO THE FINANCIAL STATEMENTS
NOTES TO THE FINANCIAL STATEMENTS
Year ended 30 April 2017 Year ended 30 April 2017
9. INTANGIBLE ASSETS AND GOODWILL (CONT’D)
Amortisable trademarks and customer relationships (cont’d)
Asia S&W trademark
The amortisable trademark pertains to “Label Development” trademark.
America trademarks
The amortisable trademarks relate to the exclusive right to use of the “S&W” trademark in the United States, Canada, Mexico and certain countries in Central and South America and “Contadina” trademark in the United States, Canada, Mexico South Africa and certain countries in Asia Pacific, Central America, Europe, Middle East and South America market.
Sager Creek trademarks
The trademarks were acquired when the Group acquired the Sager Creek business in March 2015. Sager Creek’s well-known brands include Veg-All, Freshlike, Popeye, Princella and Allens’, among others. Management has included these trademarks in the CGU impairment assessment. The Group did not recognise any impairment for these trademarks as of 30 April 2017 and 2016 respectively.
Customer relationships
Customer relationships relate to the network of customers where DMFI and Sager Creek has established relationships with the customers, particularly in the United States market through contracts.
Net carrying amountRemaining amortisation period
(years)30 April
201730 April
20161 May 2015 2017 2016 2015
US$'000 US$'000 US$'000
DMFI customer relationships 89,962 95,313 100,663 16.8 17.8 18.8
Sager Creek customer relationships 9,914 11,601 13,302 5.9 6.9 7.9
99,876 106,914 113,965
Management has included the DMFI trademarks and customer relationships in the DMFI CGU impairment assessment and concluded that no impairment exists at the reporting date. On the other hand, no impairment loss was recognised on Sager Creek trademark and customer relationships.
Source of estimation uncertainty
The Group estimates the useful lives of its amortisable trademarks and customer relationships based on the period over which the assets are expected to be available for use. The estimated useful lives of the trademarks and customer relationships are reviewed periodically and are updated if expectations differ from previous estimates due to legal or other limits on the use of the assets. A reduction in the estimated useful lives of amortisable trademarks and customer relationships would increase recorded amortisation expense and decrease non-current assets.
10. DEFERRED TAX
Deferred tax liabilities and assets are offset when there is a legally enforceable right to set-off current tax assets against current tax liabilities and when the deferred taxes relate to the same tax authority.
Deferred tax assets and liabilities of the Group are attributable to the following:
Assets Liabilities30 April
201730 April
20161 May2015
30 April2017
30 April2016
1 May2015
US$’000 US$’000 US$’000 US$’000 US$’000 US$’000(As
restated*)(As
restated*)(As
restated*)(As
restated*)
GroupProvisions 5,437 6,675 4,162 – – –Employee benefits 36,554 43,485 32,013 – – –Property, plant and
equipment – net – – – (40,216) (34,667) (29,025)Intangible assets and
goodwill – – – (64,890) (44,794) (20,394)Effective portion of
changes in fair value of cash flow hedges 5,809 13,403 7,324 – – –
Tax loss carry-forwards 138,299 103,643 78,618 – – –Inventories 1,518 3,256 5,170 – – –Biological assets – – – (2,436) (1,616) (1,125)Others 8,798 8,807 7,656 – – –Deferred tax assets/
(liabilities) 196,415 179,269 134,943 (107,542)
(81,077) (50,544)Set off of tax (103,629) (79,985) (49,452) 103,629 79,985 49,452 Deferred Taxes 92,786 99,284 85,491 (3,913) (1,092) (1,092)
* see Note 3.6
Movements in deferred tax assets and deferred tax liabilities of the Group during the year are as follows:
At 1 May 2016
Recognised in profit
or loss
Recognised in other
comprehen-sive income
Currency realignment
At 30 April
2017US$’000 US$’000 US$’000 US$’000 US$’000
(As restated*) (Note 28)
30 April 2017Provisions 6,675 (203) – (1,035) 5,437 Employee benefits 43,485 (416) (6,360) (155) 36,554 Property, plant and equipment
– net (34,667) (4,445) (1,236) 132 (40,216)Intangible assets and goodwill (44,794) (20,096) – – (64,890)Effective portion of changes in fair
value of cash flow hedges 13,403 (701) (6,893) – 5,809 Tax loss carry-forwards 103,643 34,670 – (14) 138,299 Inventories 3,256 (1,738) – – 1,518 Biological assets (1,616) (831) – 11 (2,436)Others 8,807 (61) – 52 8,798
98,192 6,179 (14,489) (1,009) 88,873
* see Note 3.6
AN
NU
AL
RE
PO
RT
FY
20
17
DE
L M
ON
TE
PA
CIF
IC L
IMIT
ED
181180
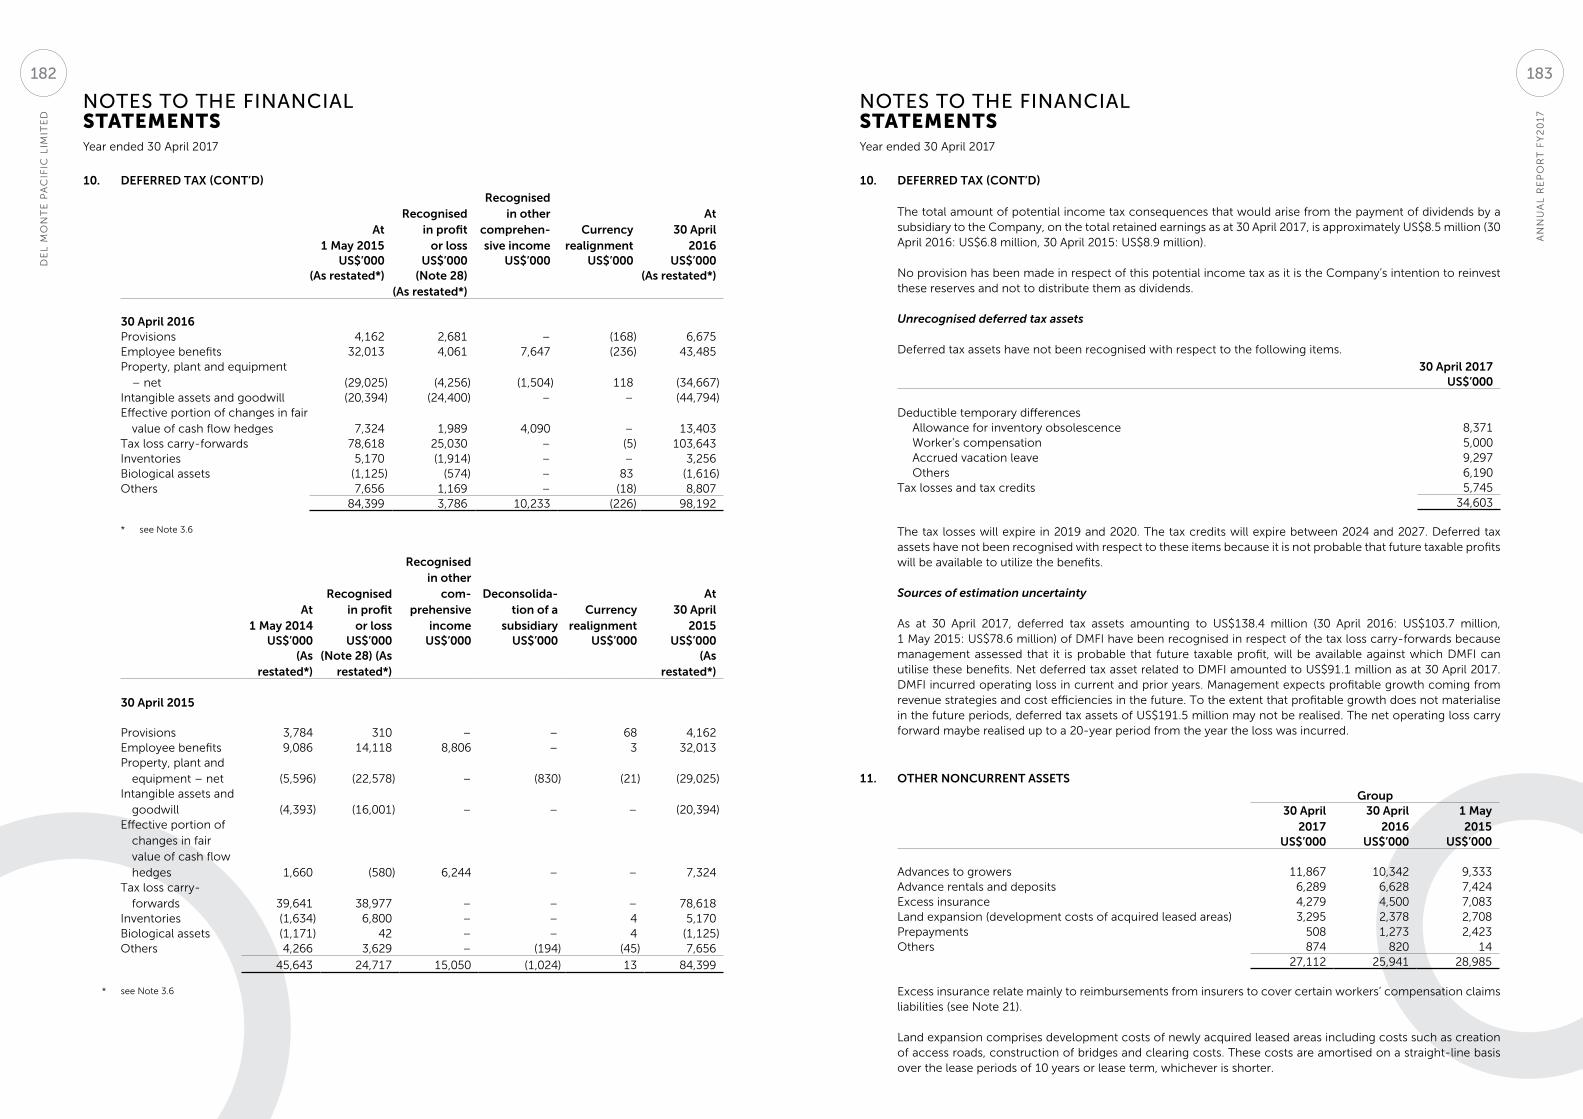
NOTES TO THE FINANCIAL STATEMENTS
NOTES TO THE FINANCIAL STATEMENTS
Year ended 30 April 2017 Year ended 30 April 2017
10. DEFERRED TAX (CONT’D)
At 1 May 2015
Recognised in profit
or loss
Recognised in other
comprehen-sive income
Currency realignment
At 30 April
2016US$’000 US$’000 US$’000 US$’000 US$’000
(As restated*) (Note 28)(As restated*)
(As restated*)
30 April 2016Provisions 4,162 2,681 – (168) 6,675Employee benefits 32,013 4,061 7,647 (236) 43,485Property, plant and equipment
– net (29,025) (4,256) (1,504) 118 (34,667)Intangible assets and goodwill (20,394) (24,400) – – (44,794)Effective portion of changes in fair
value of cash flow hedges 7,324 1,989 4,090 – 13,403Tax loss carry-forwards 78,618 25,030 – (5) 103,643Inventories 5,170 (1,914) – – 3,256Biological assets (1,125) (574) – 83 (1,616)Others 7,656 1,169 – (18) 8,807
84,399 3,786 10,233 (226) 98,192
* see Note 3.6
At 1 May 2014
Recognised in profit
or loss
Recognised in other
com-prehensive
income
Deconsolida-tion of a
subsidiaryCurrency
realignment
At 30 April
2015US$’000 US$’000 US$’000 US$’000 US$’000 US$’000
(As restated*)
(Note 28) (As restated*)
(As restated*)
30 April 2015
Provisions 3,784 310 – – 68 4,162Employee benefits 9,086 14,118 8,806 – 3 32,013Property, plant and
equipment – net (5,596) (22,578) – (830) (21) (29,025)Intangible assets and
goodwill (4,393) (16,001) – – – (20,394)Effective portion of
changes in fair value of cash flow hedges 1,660 (580) 6,244 – – 7,324
Tax loss carry-forwards 39,641 38,977 – – – 78,618
Inventories (1,634) 6,800 – – 4 5,170Biological assets (1,171) 42 – – 4 (1,125)Others 4,266 3,629 – (194) (45) 7,656
45,643 24,717 15,050 (1,024) 13 84,399
* see Note 3.6
10. DEFERRED TAX (CONT’D)
The total amount of potential income tax consequences that would arise from the payment of dividends by a subsidiary to the Company, on the total retained earnings as at 30 April 2017, is approximately US$8.5 million (30 April 2016: US$6.8 million, 30 April 2015: US$8.9 million).
No provision has been made in respect of this potential income tax as it is the Company’s intention to reinvest these reserves and not to distribute them as dividends.
Unrecognised deferred tax assets
Deferred tax assets have not been recognised with respect to the following items.
30 April 2017US$’000
Deductible temporary differencesAllowance for inventory obsolescence 8,371Worker’s compensation 5,000Accrued vacation leave 9,297Others 6,190
Tax losses and tax credits 5,74534,603
The tax losses will expire in 2019 and 2020. The tax credits will expire between 2024 and 2027. Deferred tax assets have not been recognised with respect to these items because it is not probable that future taxable profits will be available to utilize the benefits.
Sources of estimation uncertainty
As at 30 April 2017, deferred tax assets amounting to US$138.4 million (30 April 2016: US$103.7 million, 1 May 2015: US$78.6 million) of DMFI have been recognised in respect of the tax loss carry-forwards because management assessed that it is probable that future taxable profit, will be available against which DMFI can utilise these benefits. Net deferred tax asset related to DMFI amounted to US$91.1 million as at 30 April 2017. DMFI incurred operating loss in current and prior years. Management expects profitable growth coming from revenue strategies and cost efficiencies in the future. To the extent that profitable growth does not materialise in the future periods, deferred tax assets of US$191.5 million may not be realised. The net operating loss carry forward maybe realised up to a 20-year period from the year the loss was incurred.
11. OTHER NONCURRENT ASSETS
Group30 April
201730 April
20161 May2015
US$’000 US$’000 US$’000
Advances to growers 11,867 10,342 9,333Advance rentals and deposits 6,289 6,628 7,424Excess insurance 4,279 4,500 7,083Land expansion (development costs of acquired leased areas) 3,295 2,378 2,708Prepayments 508 1,273 2,423Others 874 820 14
27,112 25,941 28,985
Excess insurance relate mainly to reimbursements from insurers to cover certain workers’ compensation claims liabilities (see Note 21).
Land expansion comprises development costs of newly acquired leased areas including costs such as creation of access roads, construction of bridges and clearing costs. These costs are amortised on a straight-line basis over the lease periods of 10 years or lease term, whichever is shorter.
AN
NU
AL
RE
PO
RT
FY
20
17
DE
L M
ON
TE
PA
CIF
IC L
IMIT
ED
183182
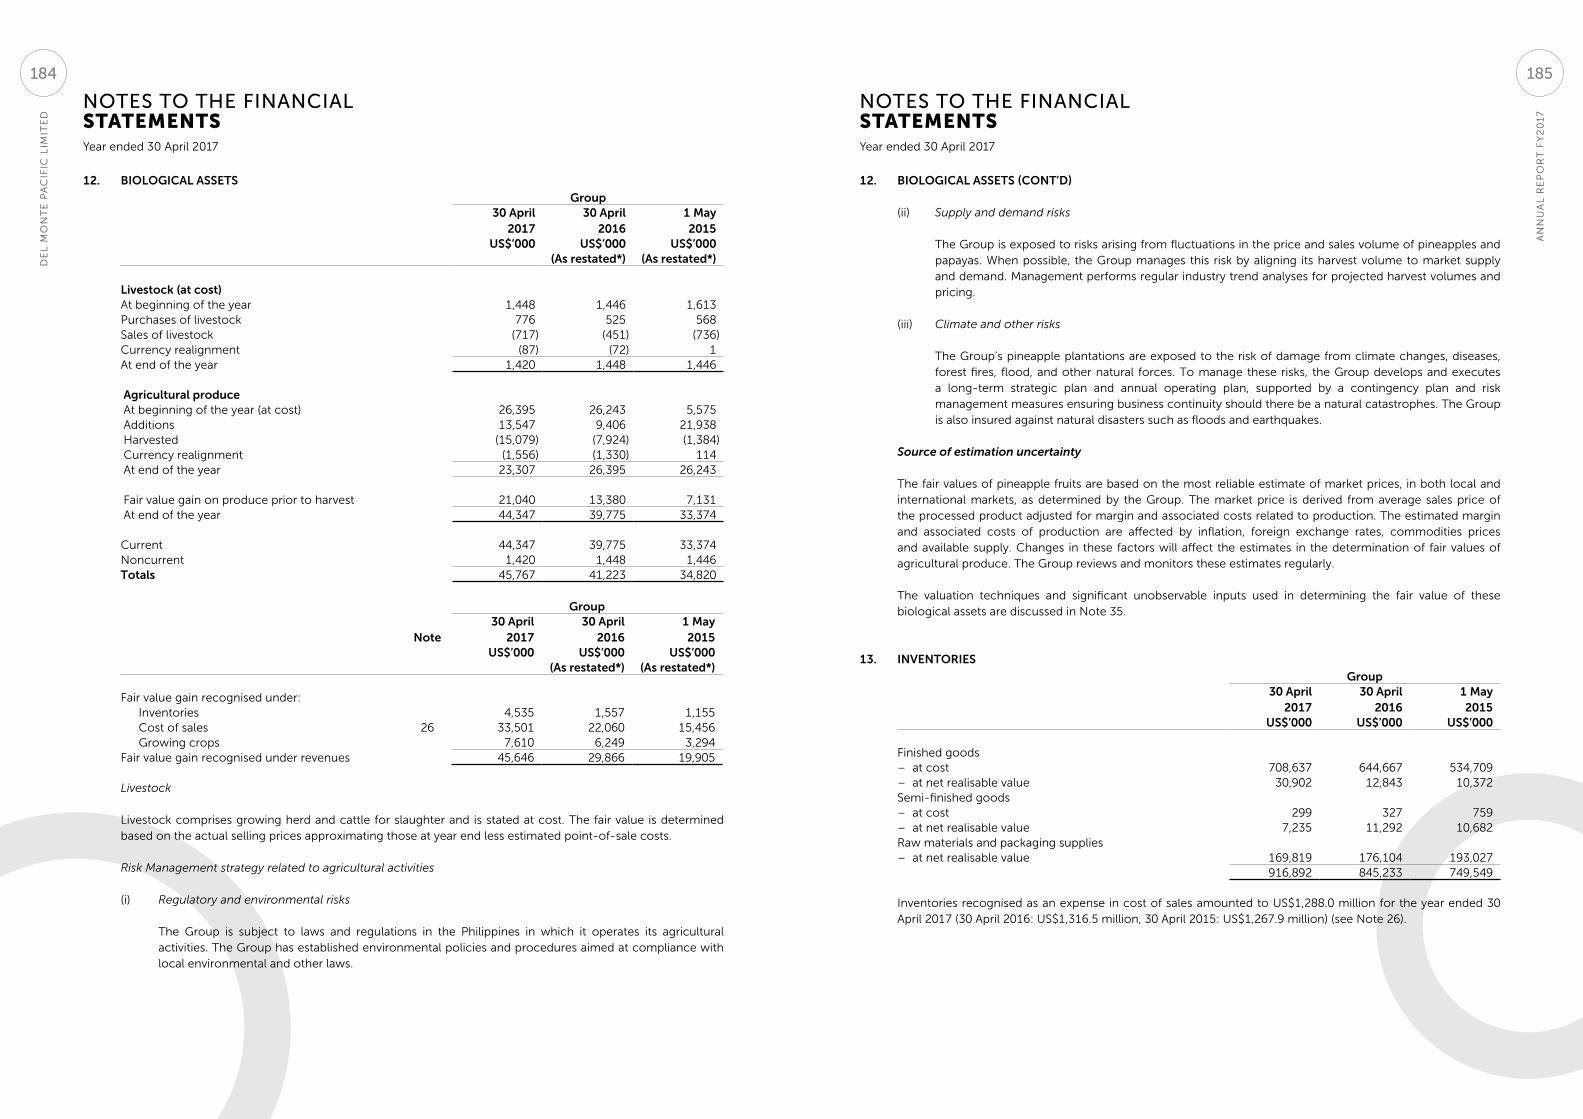
NOTES TO THE FINANCIAL STATEMENTS
NOTES TO THE FINANCIAL STATEMENTS
Year ended 30 April 2017 Year ended 30 April 2017
12. BIOLOGICAL ASSETS
Group30 April
201730 April
20161 May2015
US$’000 US$’000 US$’000(As restated*) (As restated*)
Livestock (at cost)At beginning of the year 1,448 1,446 1,613Purchases of livestock 776 525 568Sales of livestock (717) (451) (736)Currency realignment (87) (72) 1At end of the year 1,420 1,448 1,446
Agricultural produceAt beginning of the year (at cost) 26,395 26,243 5,575Additions 13,547 9,406 21,938Harvested (15,079) (7,924) (1,384)Currency realignment (1,556) (1,330) 114At end of the year 23,307 26,395 26,243
Fair value gain on produce prior to harvest 21,040 13,380 7,131At end of the year 44,347 39,775 33,374
Current 44,347 39,775 33,374Noncurrent 1,420 1,448 1,446Totals 45,767 41,223 34,820
Group
Note30 April
201730 April
20161 May 2015
US$’000 US$’000 US$’000(As restated*) (As restated*)
Fair value gain recognised under:Inventories 4,535 1,557 1,155 Cost of sales 26 33,501 22,060 15,456 Growing crops 7,610 6,249 3,294
Fair value gain recognised under revenues 45,646 29,866 19,905
Livestock
Livestock comprises growing herd and cattle for slaughter and is stated at cost. The fair value is determined based on the actual selling prices approximating those at year end less estimated point-of-sale costs.
Risk Management strategy related to agricultural activities
(i) Regulatory and environmental risks
The Group is subject to laws and regulations in the Philippines in which it operates its agricultural activities. The Group has established environmental policies and procedures aimed at compliance with local environmental and other laws.
12. BIOLOGICAL ASSETS (CONT’D)
(ii) Supply and demand risks
The Group is exposed to risks arising from fluctuations in the price and sales volume of pineapples and papayas. When possible, the Group manages this risk by aligning its harvest volume to market supply and demand. Management performs regular industry trend analyses for projected harvest volumes and pricing.
(iii) Climate and other risks
The Group’s pineapple plantations are exposed to the risk of damage from climate changes, diseases, forest fires, flood, and other natural forces. To manage these risks, the Group develops and executes a long-term strategic plan and annual operating plan, supported by a contingency plan and risk management measures ensuring business continuity should there be a natural catastrophes. The Group is also insured against natural disasters such as floods and earthquakes.
Source of estimation uncertainty
The fair values of pineapple fruits are based on the most reliable estimate of market prices, in both local and international markets, as determined by the Group. The market price is derived from average sales price of the processed product adjusted for margin and associated costs related to production. The estimated margin and associated costs of production are affected by inflation, foreign exchange rates, commodities prices and available supply. Changes in these factors will affect the estimates in the determination of fair values of agricultural produce. The Group reviews and monitors these estimates regularly.
The valuation techniques and significant unobservable inputs used in determining the fair value of these biological assets are discussed in Note 35.
13. INVENTORIES
Group30 April
201730 April
20161 May2015
US$’000 US$’000 US$’000
Finished goods– at cost 708,637 644,667 534,709– at net realisable value 30,902 12,843 10,372 Semi-finished goods– at cost 299 327 759 – at net realisable value 7,235 11,292 10,682 Raw materials and packaging supplies– at net realisable value 169,819 176,104 193,027
916,892 845,233 749,549
Inventories recognised as an expense in cost of sales amounted to US$1,288.0 million for the year ended 30 April 2017 (30 April 2016: US$1,316.5 million, 30 April 2015: US$1,267.9 million) (see Note 26).
AN
NU
AL
RE
PO
RT
FY
20
17
DE
L M
ON
TE
PA
CIF
IC L
IMIT
ED
185184
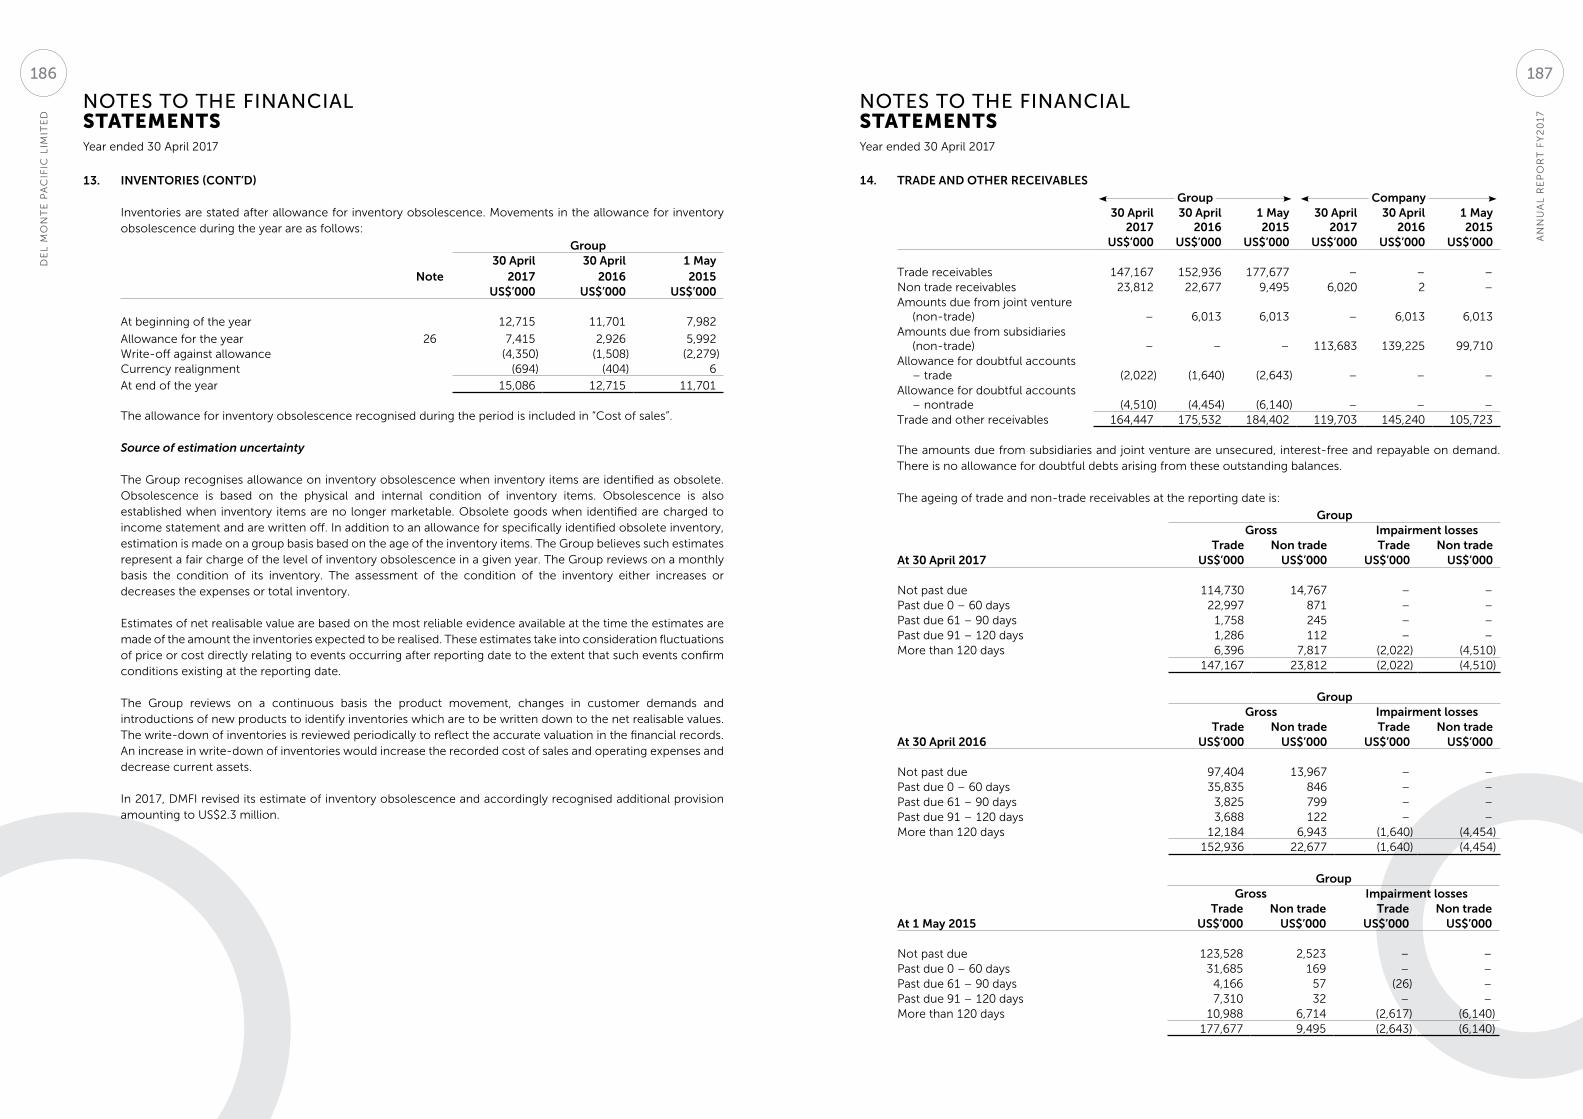
NOTES TO THE FINANCIAL STATEMENTS
NOTES TO THE FINANCIAL STATEMENTS
Year ended 30 April 2017 Year ended 30 April 2017
13. INVENTORIES (CONT’D)
Inventories are stated after allowance for inventory obsolescence. Movements in the allowance for inventory obsolescence during the year are as follows:
Group
Note30 April
201730 April
20161 May2015
US$’000 US$’000 US$’000
At beginning of the year 12,715 11,701 7,982
Allowance for the year 26 7,415 2,926 5,992Write-off against allowance (4,350) (1,508) (2,279)Currency realignment (694) (404) 6
At end of the year 15,086 12,715 11,701
The allowance for inventory obsolescence recognised during the period is included in “Cost of sales”.
Source of estimation uncertainty
The Group recognises allowance on inventory obsolescence when inventory items are identified as obsolete. Obsolescence is based on the physical and internal condition of inventory items. Obsolescence is also established when inventory items are no longer marketable. Obsolete goods when identified are charged to income statement and are written off. In addition to an allowance for specifically identified obsolete inventory, estimation is made on a group basis based on the age of the inventory items. The Group believes such estimates represent a fair charge of the level of inventory obsolescence in a given year. The Group reviews on a monthly basis the condition of its inventory. The assessment of the condition of the inventory either increases or decreases the expenses or total inventory.
Estimates of net realisable value are based on the most reliable evidence available at the time the estimates are made of the amount the inventories expected to be realised. These estimates take into consideration fluctuations of price or cost directly relating to events occurring after reporting date to the extent that such events confirm conditions existing at the reporting date.
The Group reviews on a continuous basis the product movement, changes in customer demands and introductions of new products to identify inventories which are to be written down to the net realisable values. The write-down of inventories is reviewed periodically to reflect the accurate valuation in the financial records. An increase in write-down of inventories would increase the recorded cost of sales and operating expenses and decrease current assets.
In 2017, DMFI revised its estimate of inventory obsolescence and accordingly recognised additional provision amounting to US$2.3 million.
14. TRADE AND OTHER RECEIVABLES
Group Company 30 April
201730 April
20161 May2015
30 April2017
30 April2016
1 May2015
US$’000 US$’000 US$’000 US$’000 US$’000 US$’000
Trade receivables 147,167 152,936 177,677 – – –Non trade receivables 23,812 22,677 9,495 6,020 2 –Amounts due from joint venture
(non-trade) – 6,013 6,013 – 6,013 6,013 Amounts due from subsidiaries
(non-trade) – – – 113,683 139,225 99,710 Allowance for doubtful accounts
– trade (2,022) (1,640) (2,643) – – –Allowance for doubtful accounts
– nontrade (4,510) (4,454) (6,140) – – –Trade and other receivables 164,447 175,532 184,402 119,703 145,240 105,723
The amounts due from subsidiaries and joint venture are unsecured, interest-free and repayable on demand. There is no allowance for doubtful debts arising from these outstanding balances.
The ageing of trade and non-trade receivables at the reporting date is:
GroupGross Impairment losses
Trade Non trade Trade Non tradeAt 30 April 2017 US$’000 US$’000 US$’000 US$’000
Not past due 114,730 14,767 – –Past due 0 – 60 days 22,997 871 – – Past due 61 – 90 days 1,758 245 – – Past due 91 – 120 days 1,286 112 – – More than 120 days 6,396 7,817 (2,022) (4,510)
147,167 23,812 (2,022) (4,510)
GroupGross Impairment losses
Trade Non trade Trade Non tradeAt 30 April 2016 US$’000 US$’000 US$’000 US$’000
Not past due 97,404 13,967 – –Past due 0 – 60 days 35,835 846 – –Past due 61 – 90 days 3,825 799 – –Past due 91 – 120 days 3,688 122 – –More than 120 days 12,184 6,943 (1,640) (4,454)
152,936 22,677 (1,640) (4,454)
Group Gross Impairment losses
Trade Non trade Trade Non tradeAt 1 May 2015 US$’000 US$’000 US$’000 US$’000
Not past due 123,528 2,523 – –Past due 0 – 60 days 31,685 169 – –Past due 61 – 90 days 4,166 57 (26) –Past due 91 – 120 days 7,310 32 – –More than 120 days 10,988 6,714 (2,617) (6,140)
177,677 9,495 (2,643) (6,140)
AN
NU
AL
RE
PO
RT
FY
20
17
DE
L M
ON
TE
PA
CIF
IC L
IMIT
ED
187186
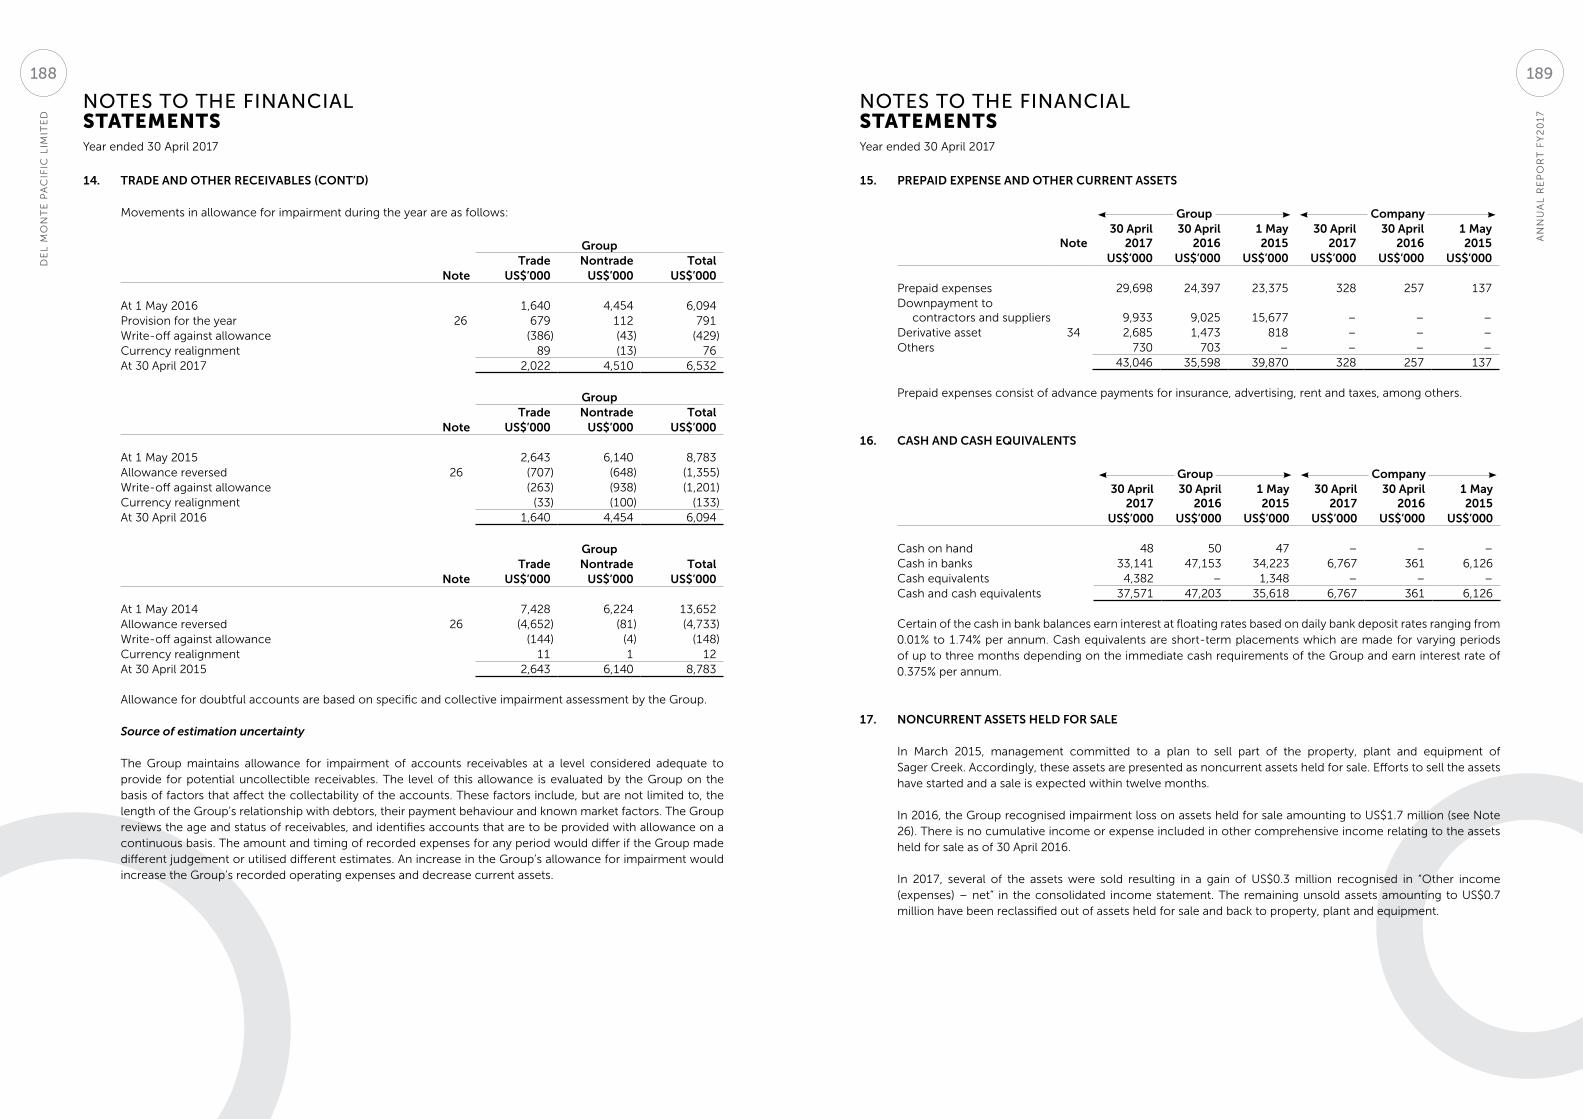
NOTES TO THE FINANCIAL STATEMENTS
NOTES TO THE FINANCIAL STATEMENTS
Year ended 30 April 2017 Year ended 30 April 2017
14. TRADE AND OTHER RECEIVABLES (CONT’D)
Movements in allowance for impairment during the year are as follows:
GroupTrade Nontrade Total
Note US$’000 US$’000 US$’000
At 1 May 2016 1,640 4,454 6,094Provision for the year 26 679 112 791Write-off against allowance (386) (43) (429)Currency realignment 89 (13) 76At 30 April 2017 2,022 4,510 6,532
GroupTrade Nontrade Total
Note US$’000 US$’000 US$’000
At 1 May 2015 2,643 6,140 8,783Allowance reversed 26 (707) (648) (1,355)Write-off against allowance (263) (938) (1,201)Currency realignment (33) (100) (133)At 30 April 2016 1,640 4,454 6,094
GroupTrade Nontrade Total
Note US$’000 US$’000 US$’000
At 1 May 2014 7,428 6,224 13,652Allowance reversed 26 (4,652) (81) (4,733)Write-off against allowance (144) (4) (148)Currency realignment 11 1 12At 30 April 2015 2,643 6,140 8,783
Allowance for doubtful accounts are based on specific and collective impairment assessment by the Group.
Source of estimation uncertainty
The Group maintains allowance for impairment of accounts receivables at a level considered adequate to provide for potential uncollectible receivables. The level of this allowance is evaluated by the Group on the basis of factors that affect the collectability of the accounts. These factors include, but are not limited to, the length of the Group’s relationship with debtors, their payment behaviour and known market factors. The Group reviews the age and status of receivables, and identifies accounts that are to be provided with allowance on a continuous basis. The amount and timing of recorded expenses for any period would differ if the Group made different judgement or utilised different estimates. An increase in the Group’s allowance for impairment would increase the Group’s recorded operating expenses and decrease current assets.
15. PREPAID EXPENSE AND OTHER CURRENT ASSETS
Group Company
Note30 April
201730 April
20161 May2015
30 April2017
30 April2016
1 May2015
US$’000 US$’000 US$’000 US$’000 US$’000 US$’000
Prepaid expenses 29,698 24,397 23,375 328 257 137Downpayment to
contractors and suppliers 9,933 9,025 15,677 – – –Derivative asset 34 2,685 1,473 818 – – –Others 730 703 – – – –
43,046 35,598 39,870 328 257 137 Prepaid expenses consist of advance payments for insurance, advertising, rent and taxes, among others.
16. CASH AND CASH EQUIVALENTS
Group Company 30 April
201730 April
20161 May2015
30 April2017
30 April2016
1 May2015
US$’000 US$’000 US$’000 US$’000 US$’000 US$’000
Cash on hand 48 50 47 – – –Cash in banks 33,141 47,153 34,223 6,767 361 6,126Cash equivalents 4,382 – 1,348 – – –Cash and cash equivalents 37,571 47,203 35,618 6,767 361 6,126
Certain of the cash in bank balances earn interest at floating rates based on daily bank deposit rates ranging from 0.01% to 1.74% per annum. Cash equivalents are short-term placements which are made for varying periods of up to three months depending on the immediate cash requirements of the Group and earn interest rate of 0.375% per annum.
17. NONCURRENT ASSETS HELD FOR SALE
In March 2015, management committed to a plan to sell part of the property, plant and equipment of Sager Creek. Accordingly, these assets are presented as noncurrent assets held for sale. Efforts to sell the assets have started and a sale is expected within twelve months.
In 2016, the Group recognised impairment loss on assets held for sale amounting to US$1.7 million (see Note 26). There is no cumulative income or expense included in other comprehensive income relating to the assets held for sale as of 30 April 2016.
In 2017, several of the assets were sold resulting in a gain of US$0.3 million recognised in “Other income (expenses) – net” in the consolidated income statement. The remaining unsold assets amounting to US$0.7 million have been reclassified out of assets held for sale and back to property, plant and equipment.
AN
NU
AL
RE
PO
RT
FY
20
17
DE
L M
ON
TE
PA
CIF
IC L
IMIT
ED
189188
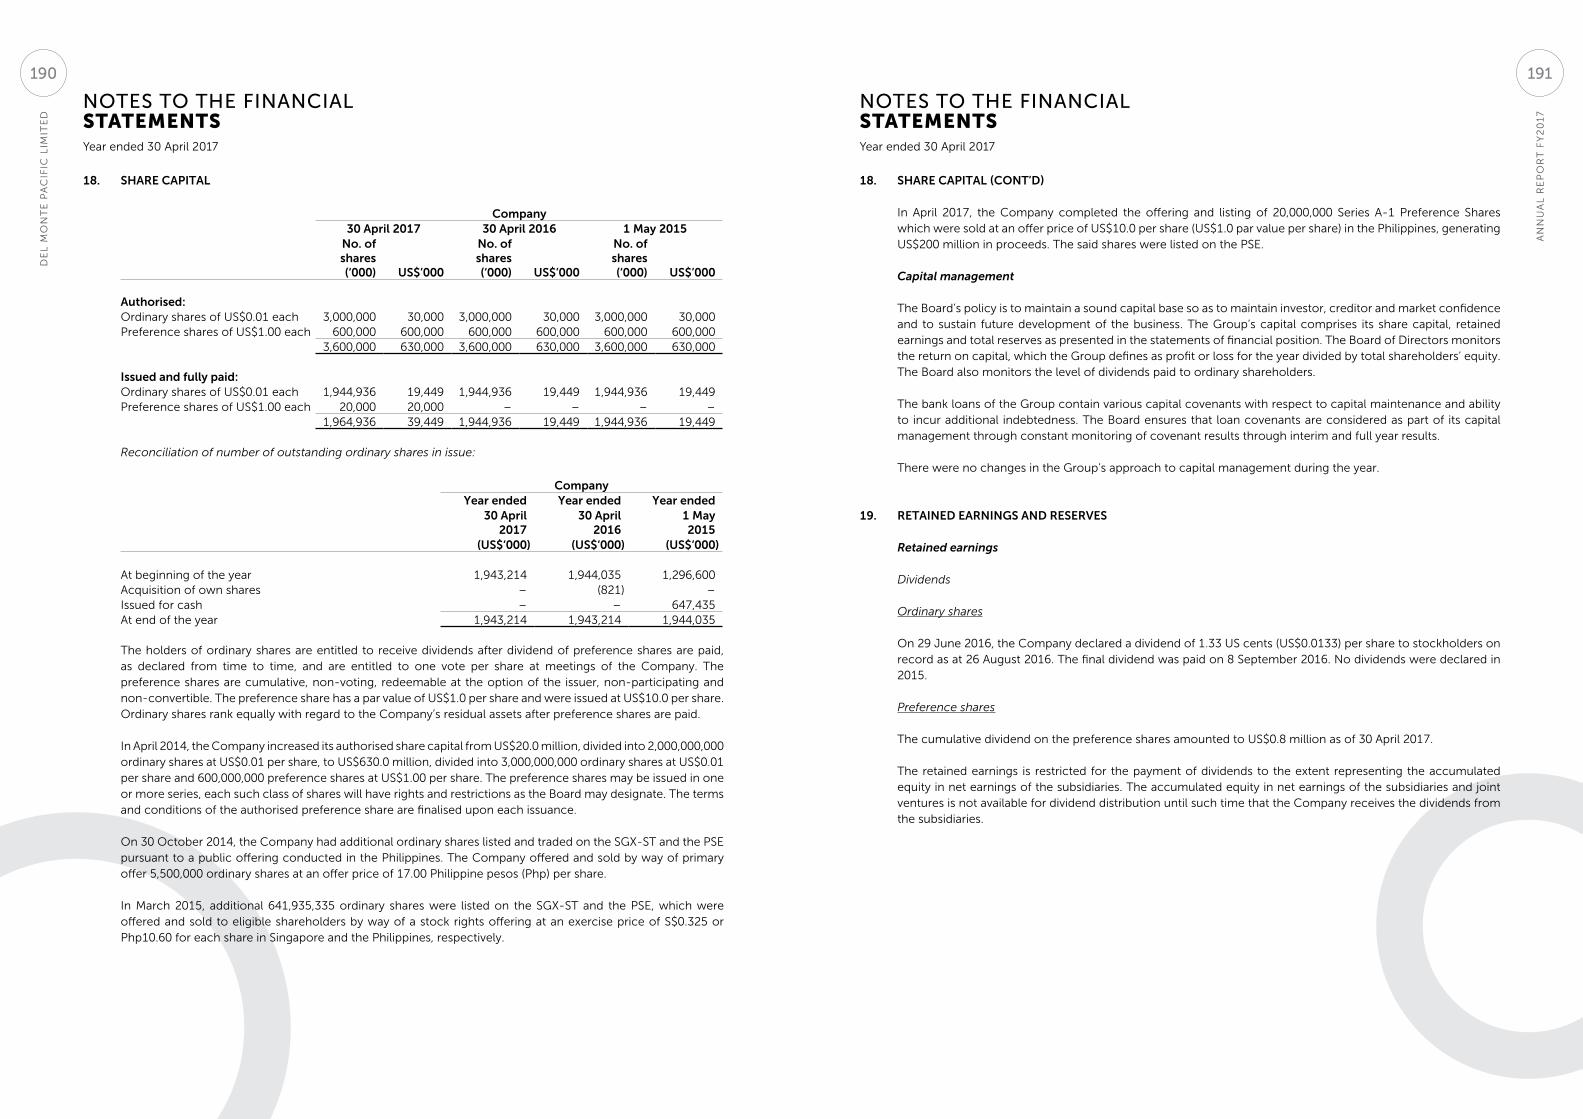
NOTES TO THE FINANCIAL STATEMENTS
NOTES TO THE FINANCIAL STATEMENTS
Year ended 30 April 2017 Year ended 30 April 2017
18. SHARE CAPITAL
Company30 April 2017 30 April 2016 1 May 2015
No. of shares(‘000) US$’000
No. of shares(‘000) US$’000
No. of shares(‘000) US$’000
Authorised:Ordinary shares of US$0.01 each 3,000,000 30,000 3,000,000 30,000 3,000,000 30,000Preference shares of US$1.00 each 600,000 600,000 600,000 600,000 600,000 600,000
3,600,000 630,000 3,600,000 630,000 3,600,000 630,000
Issued and fully paid:Ordinary shares of US$0.01 each 1,944,936 19,449 1,944,936 19,449 1,944,936 19,449Preference shares of US$1.00 each 20,000 20,000 – – – –
1,964,936 39,449 1,944,936 19,449 1,944,936 19,449
Reconciliation of number of outstanding ordinary shares in issue:
CompanyYear ended Year ended Year ended
30 April2017
30 April2016
1 May2015
(US$‘000) (US$‘000) (US$‘000)
At beginning of the year 1,943,214 1,944,035 1,296,600Acquisition of own shares – (821) –Issued for cash – – 647,435At end of the year 1,943,214 1,943,214 1,944,035
The holders of ordinary shares are entitled to receive dividends after dividend of preference shares are paid, as declared from time to time, and are entitled to one vote per share at meetings of the Company. The preference shares are cumulative, non-voting, redeemable at the option of the issuer, non-participating and non-convertible. The preference share has a par value of US$1.0 per share and were issued at US$10.0 per share. Ordinary shares rank equally with regard to the Company’s residual assets after preference shares are paid.
In April 2014, the Company increased its authorised share capital from US$20.0 million, divided into 2,000,000,000 ordinary shares at US$0.01 per share, to US$630.0 million, divided into 3,000,000,000 ordinary shares at US$0.01 per share and 600,000,000 preference shares at US$1.00 per share. The preference shares may be issued in one or more series, each such class of shares will have rights and restrictions as the Board may designate. The terms and conditions of the authorised preference share are finalised upon each issuance.
On 30 October 2014, the Company had additional ordinary shares listed and traded on the SGX-ST and the PSE pursuant to a public offering conducted in the Philippines. The Company offered and sold by way of primary offer 5,500,000 ordinary shares at an offer price of 17.00 Philippine pesos (Php) per share.
In March 2015, additional 641,935,335 ordinary shares were listed on the SGX-ST and the PSE, which were offered and sold to eligible shareholders by way of a stock rights offering at an exercise price of S$0.325 or Php10.60 for each share in Singapore and the Philippines, respectively.
18. SHARE CAPITAL (CONT’D)
In April 2017, the Company completed the offering and listing of 20,000,000 Series A-1 Preference Shares which were sold at an offer price of US$10.0 per share (US$1.0 par value per share) in the Philippines, generating US$200 million in proceeds. The said shares were listed on the PSE.
Capital management
The Board’s policy is to maintain a sound capital base so as to maintain investor, creditor and market confidence and to sustain future development of the business. The Group’s capital comprises its share capital, retained earnings and total reserves as presented in the statements of financial position. The Board of Directors monitors the return on capital, which the Group defines as profit or loss for the year divided by total shareholders’ equity. The Board also monitors the level of dividends paid to ordinary shareholders.
The bank loans of the Group contain various capital covenants with respect to capital maintenance and ability to incur additional indebtedness. The Board ensures that loan covenants are considered as part of its capital management through constant monitoring of covenant results through interim and full year results.
There were no changes in the Group’s approach to capital management during the year.
19. RETAINED EARNINGS AND RESERVES
Retained earnings
Dividends
Ordinary shares
On 29 June 2016, the Company declared a dividend of 1.33 US cents (US$0.0133) per share to stockholders on record as at 26 August 2016. The final dividend was paid on 8 September 2016. No dividends were declared in 2015.
Preference shares
The cumulative dividend on the preference shares amounted to US$0.8 million as of 30 April 2017.
The retained earnings is restricted for the payment of dividends to the extent representing the accumulated equity in net earnings of the subsidiaries. The accumulated equity in net earnings of the subsidiaries and joint ventures is not available for dividend distribution until such time that the Company receives the dividends from the subsidiaries.
AN
NU
AL
RE
PO
RT
FY
20
17
DE
L M
ON
TE
PA
CIF
IC L
IMIT
ED
191190
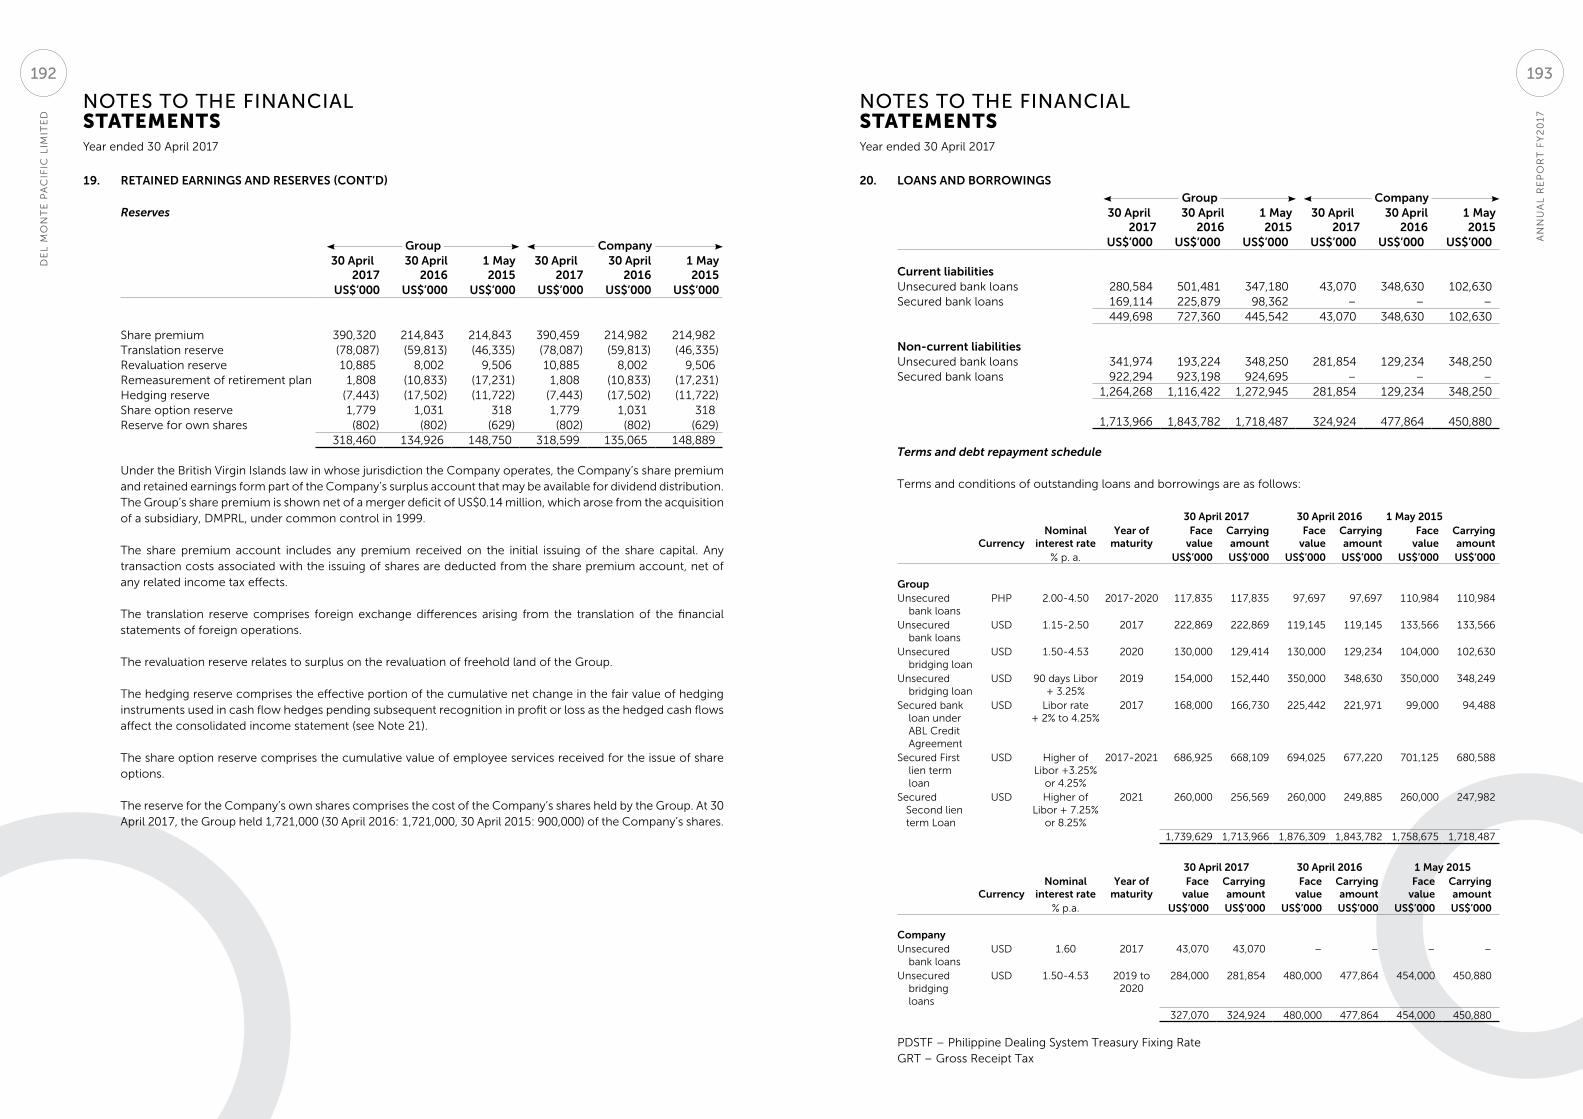
NOTES TO THE FINANCIAL STATEMENTS
NOTES TO THE FINANCIAL STATEMENTS
Year ended 30 April 2017 Year ended 30 April 2017
19. RETAINED EARNINGS AND RESERVES (CONT’D)
Reserves
Group Company 30 April
201730 April
20161 May2015
30 April2017
30 April2016
1 May2015
US$’000 US$’000 US$’000 US$’000 US$’000 US$’000
Share premium 390,320 214,843 214,843 390,459 214,982 214,982Translation reserve (78,087) (59,813) (46,335) (78,087) (59,813) (46,335)Revaluation reserve 10,885 8,002 9,506 10,885 8,002 9,506Remeasurement of retirement plan 1,808 (10,833) (17,231) 1,808 (10,833) (17,231)Hedging reserve (7,443) (17,502) (11,722) (7,443) (17,502) (11,722)Share option reserve 1,779 1,031 318 1,779 1,031 318Reserve for own shares (802) (802) (629) (802) (802) (629)
318,460 134,926 148,750 318,599 135,065 148,889
Under the British Virgin Islands law in whose jurisdiction the Company operates, the Company’s share premium and retained earnings form part of the Company’s surplus account that may be available for dividend distribution. The Group’s share premium is shown net of a merger deficit of US$0.14 million, which arose from the acquisition of a subsidiary, DMPRL, under common control in 1999.
The share premium account includes any premium received on the initial issuing of the share capital. Any transaction costs associated with the issuing of shares are deducted from the share premium account, net of any related income tax effects.
The translation reserve comprises foreign exchange differences arising from the translation of the financial statements of foreign operations.
The revaluation reserve relates to surplus on the revaluation of freehold land of the Group.
The hedging reserve comprises the effective portion of the cumulative net change in the fair value of hedging instruments used in cash flow hedges pending subsequent recognition in profit or loss as the hedged cash flows affect the consolidated income statement (see Note 21).
The share option reserve comprises the cumulative value of employee services received for the issue of share options.
The reserve for the Company’s own shares comprises the cost of the Company’s shares held by the Group. At 30 April 2017, the Group held 1,721,000 (30 April 2016: 1,721,000, 30 April 2015: 900,000) of the Company’s shares.
20. LOANS AND BORROWINGS
Group Company 30 April
201730 April
20161 May2015
30 April2017
30 April2016
1 May2015
US$’000 US$’000 US$’000 US$’000 US$’000 US$’000
Current liabilitiesUnsecured bank loans 280,584 501,481 347,180 43,070 348,630 102,630Secured bank loans 169,114 225,879 98,362 – – –
449,698 727,360 445,542 43,070 348,630 102,630
Non-current liabilitiesUnsecured bank loans 341,974 193,224 348,250 281,854 129,234 348,250Secured bank loans 922,294 923,198 924,695 – – –
1,264,268 1,116,422 1,272,945 281,854 129,234 348,250
1,713,966 1,843,782 1,718,487 324,924 477,864 450,880
Terms and debt repayment schedule
Terms and conditions of outstanding loans and borrowings are as follows:
30 April 2017 30 April 2016 1 May 2015
CurrencyNominal
interest rateYear of
maturityFace
valueCarrying amount
Face value
Carrying amount
Face value
Carrying amount
% p. a. US$’000 US$’000 US$’000 US$’000 US$’000 US$’000
GroupUnsecured
bank loansPHP 2.00-4.50 2017-2020 117,835 117,835 97,697 97,697 110,984 110,984
Unsecured bank loans
USD 1.15-2.50 2017 222,869 222,869 119,145 119,145 133,566 133,566
Unsecured bridging loan
USD 1.50-4.53 2020 130,000 129,414 130,000 129,234 104,000 102,630
Unsecured bridging loan
USD 90 days Libor + 3.25%
2019 154,000 152,440 350,000 348,630 350,000 348,249
Secured bank loan under ABL Credit Agreement
USD Libor rate + 2% to 4.25%
2017 168,000 166,730 225,442 221,971 99,000 94,488
Secured First lien term loan
USD Higher of Libor +3.25%
or 4.25%
2017-2021 686,925 668,109 694,025 677,220 701,125 680,588
Secured Second lien term Loan
USD Higher of Libor + 7.25%
or 8.25%
2021 260,000 256,569 260,000 249,885 260,000 247,982
1,739,629 1,713,966 1,876,309 1,843,782 1,758,675 1,718,487
30 April 2017 30 April 2016 1 May 2015
CurrencyNominal
interest rateYear of
maturityFace
valueCarrying amount
Face value
Carrying amount
Face value
Carrying amount
% p.a. US$’000 US$’000 US$’000 US$’000 US$’000 US$’000
CompanyUnsecured
bank loansUSD 1.60 2017 43,070 43,070 – – – –
Unsecured bridging loans
USD 1.50-4.53 2019 to 2020
284,000 281,854 480,000 477,864 454,000 450,880
327,070 324,924 480,000 477,864 454,000 450,880
PDSTF – Philippine Dealing System Treasury Fixing RateGRT – Gross Receipt Tax
AN
NU
AL
RE
PO
RT
FY
20
17
DE
L M
ON
TE
PA
CIF
IC L
IMIT
ED
193192
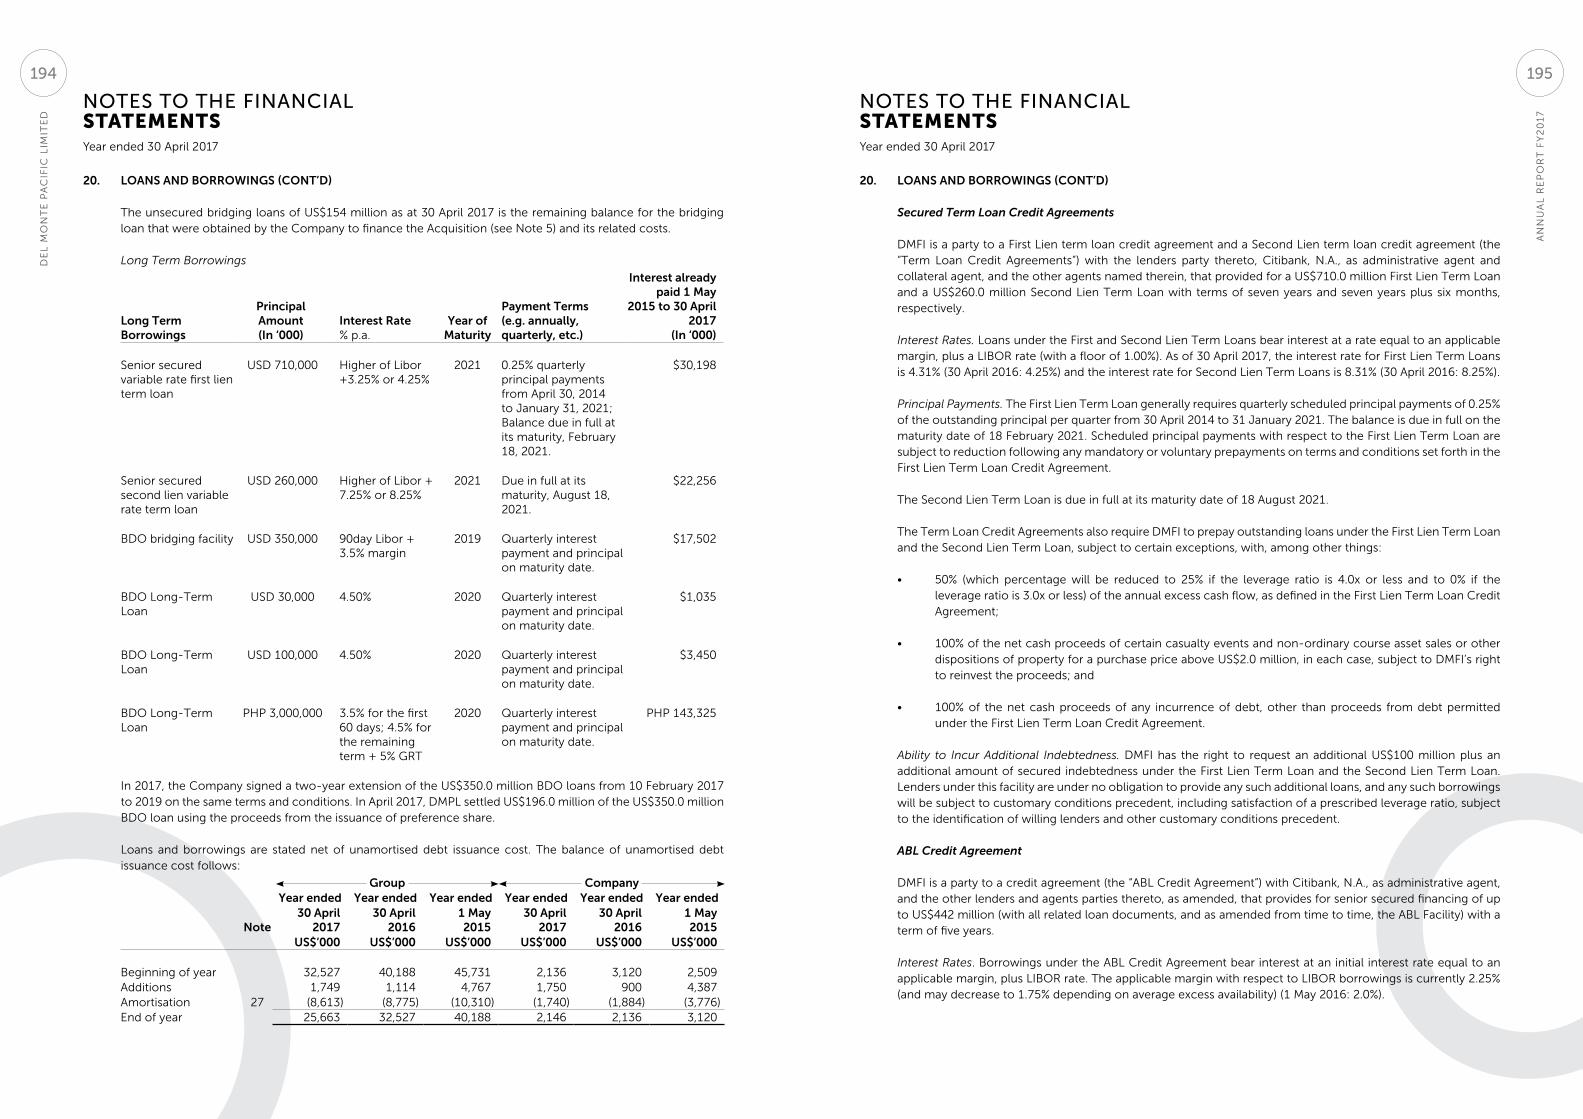
NOTES TO THE FINANCIAL STATEMENTS
NOTES TO THE FINANCIAL STATEMENTS
Year ended 30 April 2017 Year ended 30 April 2017
20. LOANS AND BORROWINGS (CONT’D)
The unsecured bridging loans of US$154 million as at 30 April 2017 is the remaining balance for the bridging loan that were obtained by the Company to finance the Acquisition (see Note 5) and its related costs.
Long Term Borrowings
Long Term Borrowings
Principal Amount(In ‘000)
Interest Rate% p.a.
Year of Maturity
Payment Terms (e.g. annually, quarterly, etc.)
Interest already paid 1 May
2015 to 30 April 2017
(In ‘000)
Senior secured variable rate first lien term loan
USD 710,000 Higher of Libor +3.25% or 4.25%
2021 0.25% quarterly principal payments from April 30, 2014 to January 31, 2021; Balance due in full at its maturity, February 18, 2021.
$30,198
Senior secured second lien variable rate term loan
USD 260,000 Higher of Libor + 7.25% or 8.25%
2021 Due in full at its maturity, August 18, 2021.
$22,256
BDO bridging facility USD 350,000 90day Libor + 3.5% margin
2019 Quarterly interest payment and principal on maturity date.
$17,502
BDO Long-Term Loan
USD 30,000 4.50% 2020 Quarterly interest payment and principal on maturity date.
$1,035
BDO Long-Term Loan
USD 100,000 4.50% 2020 Quarterly interest payment and principal on maturity date.
$3,450
BDO Long-Term Loan
PHP 3,000,000 3.5% for the first 60 days; 4.5% for the remaining term + 5% GRT
2020 Quarterly interest payment and principal on maturity date.
PHP 143,325
In 2017, the Company signed a two-year extension of the US$350.0 million BDO loans from 10 February 2017 to 2019 on the same terms and conditions. In April 2017, DMPL settled US$196.0 million of the US$350.0 million BDO loan using the proceeds from the issuance of preference share.
Loans and borrowings are stated net of unamortised debt issuance cost. The balance of unamortised debt issuance cost follows:
Group Company Year ended Year ended Year ended Year ended Year ended Year ended
Note30 April
201730 April
20161 May2015
30 April2017
30 April2016
1 May2015
US$’000 US$’000 US$’000 US$’000 US$’000 US$’000
Beginning of year 32,527 40,188 45,731 2,136 3,120 2,509Additions 1,749 1,114 4,767 1,750 900 4,387Amortisation 27 (8,613) (8,775) (10,310) (1,740) (1,884) (3,776)End of year 25,663 32,527 40,188 2,146 2,136 3,120
20. LOANS AND BORROWINGS (CONT’D)
Secured Term Loan Credit Agreements
DMFI is a party to a First Lien term loan credit agreement and a Second Lien term loan credit agreement (the “Term Loan Credit Agreements”) with the lenders party thereto, Citibank, N.A., as administrative agent and collateral agent, and the other agents named therein, that provided for a US$710.0 million First Lien Term Loan and a US$260.0 million Second Lien Term Loan with terms of seven years and seven years plus six months, respectively.
Interest Rates. Loans under the First and Second Lien Term Loans bear interest at a rate equal to an applicable margin, plus a LIBOR rate (with a floor of 1.00%). As of 30 April 2017, the interest rate for First Lien Term Loans is 4.31% (30 April 2016: 4.25%) and the interest rate for Second Lien Term Loans is 8.31% (30 April 2016: 8.25%).
Principal Payments. The First Lien Term Loan generally requires quarterly scheduled principal payments of 0.25% of the outstanding principal per quarter from 30 April 2014 to 31 January 2021. The balance is due in full on the maturity date of 18 February 2021. Scheduled principal payments with respect to the First Lien Term Loan are subject to reduction following any mandatory or voluntary prepayments on terms and conditions set forth in the First Lien Term Loan Credit Agreement.
The Second Lien Term Loan is due in full at its maturity date of 18 August 2021.
The Term Loan Credit Agreements also require DMFI to prepay outstanding loans under the First Lien Term Loan and the Second Lien Term Loan, subject to certain exceptions, with, among other things:
• 50% (which percentage will be reduced to 25% if the leverage ratio is 4.0x or less and to 0% if the leverage ratio is 3.0x or less) of the annual excess cash flow, as defined in the First Lien Term Loan Credit Agreement;
• 100% of the net cash proceeds of certain casualty events and non-ordinary course asset sales or other dispositions of property for a purchase price above US$2.0 million, in each case, subject to DMFI’s right to reinvest the proceeds; and
• 100% of the net cash proceeds of any incurrence of debt, other than proceeds from debt permitted under the First Lien Term Loan Credit Agreement.
Ability to Incur Additional Indebtedness. DMFI has the right to request an additional US$100 million plus an additional amount of secured indebtedness under the First Lien Term Loan and the Second Lien Term Loan. Lenders under this facility are under no obligation to provide any such additional loans, and any such borrowings will be subject to customary conditions precedent, including satisfaction of a prescribed leverage ratio, subject to the identification of willing lenders and other customary conditions precedent.
ABL Credit Agreement
DMFI is a party to a credit agreement (the “ABL Credit Agreement”) with Citibank, N.A., as administrative agent, and the other lenders and agents parties thereto, as amended, that provides for senior secured financing of up to US$442 million (with all related loan documents, and as amended from time to time, the ABL Facility) with a term of five years.
Interest Rates. Borrowings under the ABL Credit Agreement bear interest at an initial interest rate equal to an applicable margin, plus LIBOR rate. The applicable margin with respect to LIBOR borrowings is currently 2.25% (and may decrease to 1.75% depending on average excess availability) (1 May 2016: 2.0%).
AN
NU
AL
RE
PO
RT
FY
20
17
DE
L M
ON
TE
PA
CIF
IC L
IMIT
ED
195194
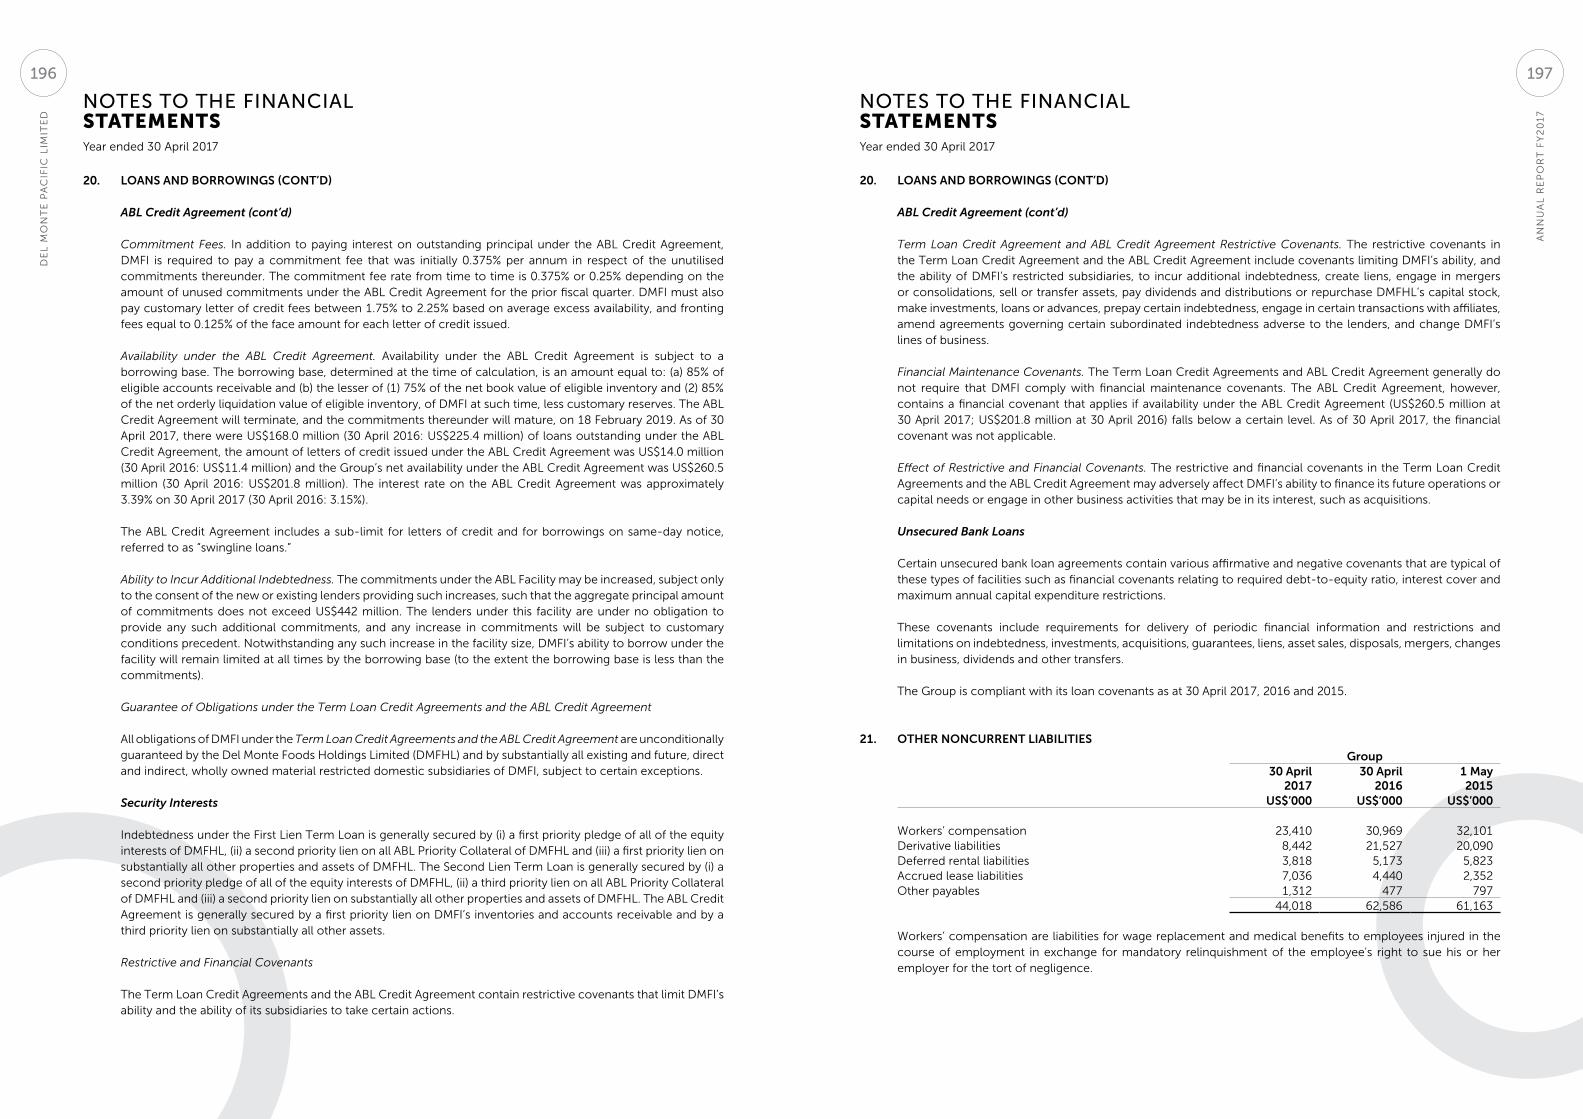
NOTES TO THE FINANCIAL STATEMENTS
NOTES TO THE FINANCIAL STATEMENTS
Year ended 30 April 2017 Year ended 30 April 2017
20. LOANS AND BORROWINGS (CONT’D)
ABL Credit Agreement (cont’d)
Commitment Fees. In addition to paying interest on outstanding principal under the ABL Credit Agreement, DMFI is required to pay a commitment fee that was initially 0.375% per annum in respect of the unutilised commitments thereunder. The commitment fee rate from time to time is 0.375% or 0.25% depending on the amount of unused commitments under the ABL Credit Agreement for the prior fiscal quarter. DMFI must also pay customary letter of credit fees between 1.75% to 2.25% based on average excess availability, and fronting fees equal to 0.125% of the face amount for each letter of credit issued.
Availability under the ABL Credit Agreement. Availability under the ABL Credit Agreement is subject to a borrowing base. The borrowing base, determined at the time of calculation, is an amount equal to: (a) 85% of eligible accounts receivable and (b) the lesser of (1) 75% of the net book value of eligible inventory and (2) 85% of the net orderly liquidation value of eligible inventory, of DMFI at such time, less customary reserves. The ABL Credit Agreement will terminate, and the commitments thereunder will mature, on 18 February 2019. As of 30 April 2017, there were US$168.0 million (30 April 2016: US$225.4 million) of loans outstanding under the ABL Credit Agreement, the amount of letters of credit issued under the ABL Credit Agreement was US$14.0 million (30 April 2016: US$11.4 million) and the Group’s net availability under the ABL Credit Agreement was US$260.5 million (30 April 2016: US$201.8 million). The interest rate on the ABL Credit Agreement was approximately 3.39% on 30 April 2017 (30 April 2016: 3.15%).
The ABL Credit Agreement includes a sub-limit for letters of credit and for borrowings on same-day notice, referred to as “swingline loans.”
Ability to Incur Additional Indebtedness. The commitments under the ABL Facility may be increased, subject only to the consent of the new or existing lenders providing such increases, such that the aggregate principal amount of commitments does not exceed US$442 million. The lenders under this facility are under no obligation to provide any such additional commitments, and any increase in commitments will be subject to customary conditions precedent. Notwithstanding any such increase in the facility size, DMFI’s ability to borrow under the facility will remain limited at all times by the borrowing base (to the extent the borrowing base is less than the commitments).
Guarantee of Obligations under the Term Loan Credit Agreements and the ABL Credit Agreement
All obligations of DMFI under the Term Loan Credit Agreements and the ABL Credit Agreement are unconditionally guaranteed by the Del Monte Foods Holdings Limited (DMFHL) and by substantially all existing and future, direct and indirect, wholly owned material restricted domestic subsidiaries of DMFI, subject to certain exceptions.
Security Interests
Indebtedness under the First Lien Term Loan is generally secured by (i) a first priority pledge of all of the equity interests of DMFHL, (ii) a second priority lien on all ABL Priority Collateral of DMFHL and (iii) a first priority lien on substantially all other properties and assets of DMFHL. The Second Lien Term Loan is generally secured by (i) a second priority pledge of all of the equity interests of DMFHL, (ii) a third priority lien on all ABL Priority Collateral of DMFHL and (iii) a second priority lien on substantially all other properties and assets of DMFHL. The ABL Credit Agreement is generally secured by a first priority lien on DMFI’s inventories and accounts receivable and by a third priority lien on substantially all other assets.
Restrictive and Financial Covenants
The Term Loan Credit Agreements and the ABL Credit Agreement contain restrictive covenants that limit DMFI’s ability and the ability of its subsidiaries to take certain actions.
20. LOANS AND BORROWINGS (CONT’D)
ABL Credit Agreement (cont’d)
Term Loan Credit Agreement and ABL Credit Agreement Restrictive Covenants. The restrictive covenants in the Term Loan Credit Agreement and the ABL Credit Agreement include covenants limiting DMFI’s ability, and the ability of DMFI’s restricted subsidiaries, to incur additional indebtedness, create liens, engage in mergers or consolidations, sell or transfer assets, pay dividends and distributions or repurchase DMFHL’s capital stock, make investments, loans or advances, prepay certain indebtedness, engage in certain transactions with affiliates, amend agreements governing certain subordinated indebtedness adverse to the lenders, and change DMFI’s lines of business.
Financial Maintenance Covenants. The Term Loan Credit Agreements and ABL Credit Agreement generally do not require that DMFI comply with financial maintenance covenants. The ABL Credit Agreement, however, contains a financial covenant that applies if availability under the ABL Credit Agreement (US$260.5 million at 30 April 2017; US$201.8 million at 30 April 2016) falls below a certain level. As of 30 April 2017, the financial covenant was not applicable.
Effect of Restrictive and Financial Covenants. The restrictive and financial covenants in the Term Loan Credit Agreements and the ABL Credit Agreement may adversely affect DMFI’s ability to finance its future operations or capital needs or engage in other business activities that may be in its interest, such as acquisitions.
Unsecured Bank Loans
Certain unsecured bank loan agreements contain various affirmative and negative covenants that are typical of these types of facilities such as financial covenants relating to required debt-to-equity ratio, interest cover and maximum annual capital expenditure restrictions.
These covenants include requirements for delivery of periodic financial information and restrictions and limitations on indebtedness, investments, acquisitions, guarantees, liens, asset sales, disposals, mergers, changes in business, dividends and other transfers.
The Group is compliant with its loan covenants as at 30 April 2017, 2016 and 2015.
21. OTHER NONCURRENT LIABILITIES
Group30 April
201730 April
20161 May2015
US$’000 US$’000 US$’000
Workers’ compensation 23,410 30,969 32,101Derivative liabilities 8,442 21,527 20,090Deferred rental liabilities 3,818 5,173 5,823Accrued lease liabilities 7,036 4,440 2,352Other payables 1,312 477 797
44,018 62,586 61,163
Workers’ compensation are liabilities for wage replacement and medical benefits to employees injured in the course of employment in exchange for mandatory relinquishment of the employee's right to sue his or her employer for the tort of negligence.
AN
NU
AL
RE
PO
RT
FY
20
17
DE
L M
ON
TE
PA
CIF
IC L
IMIT
ED
197196
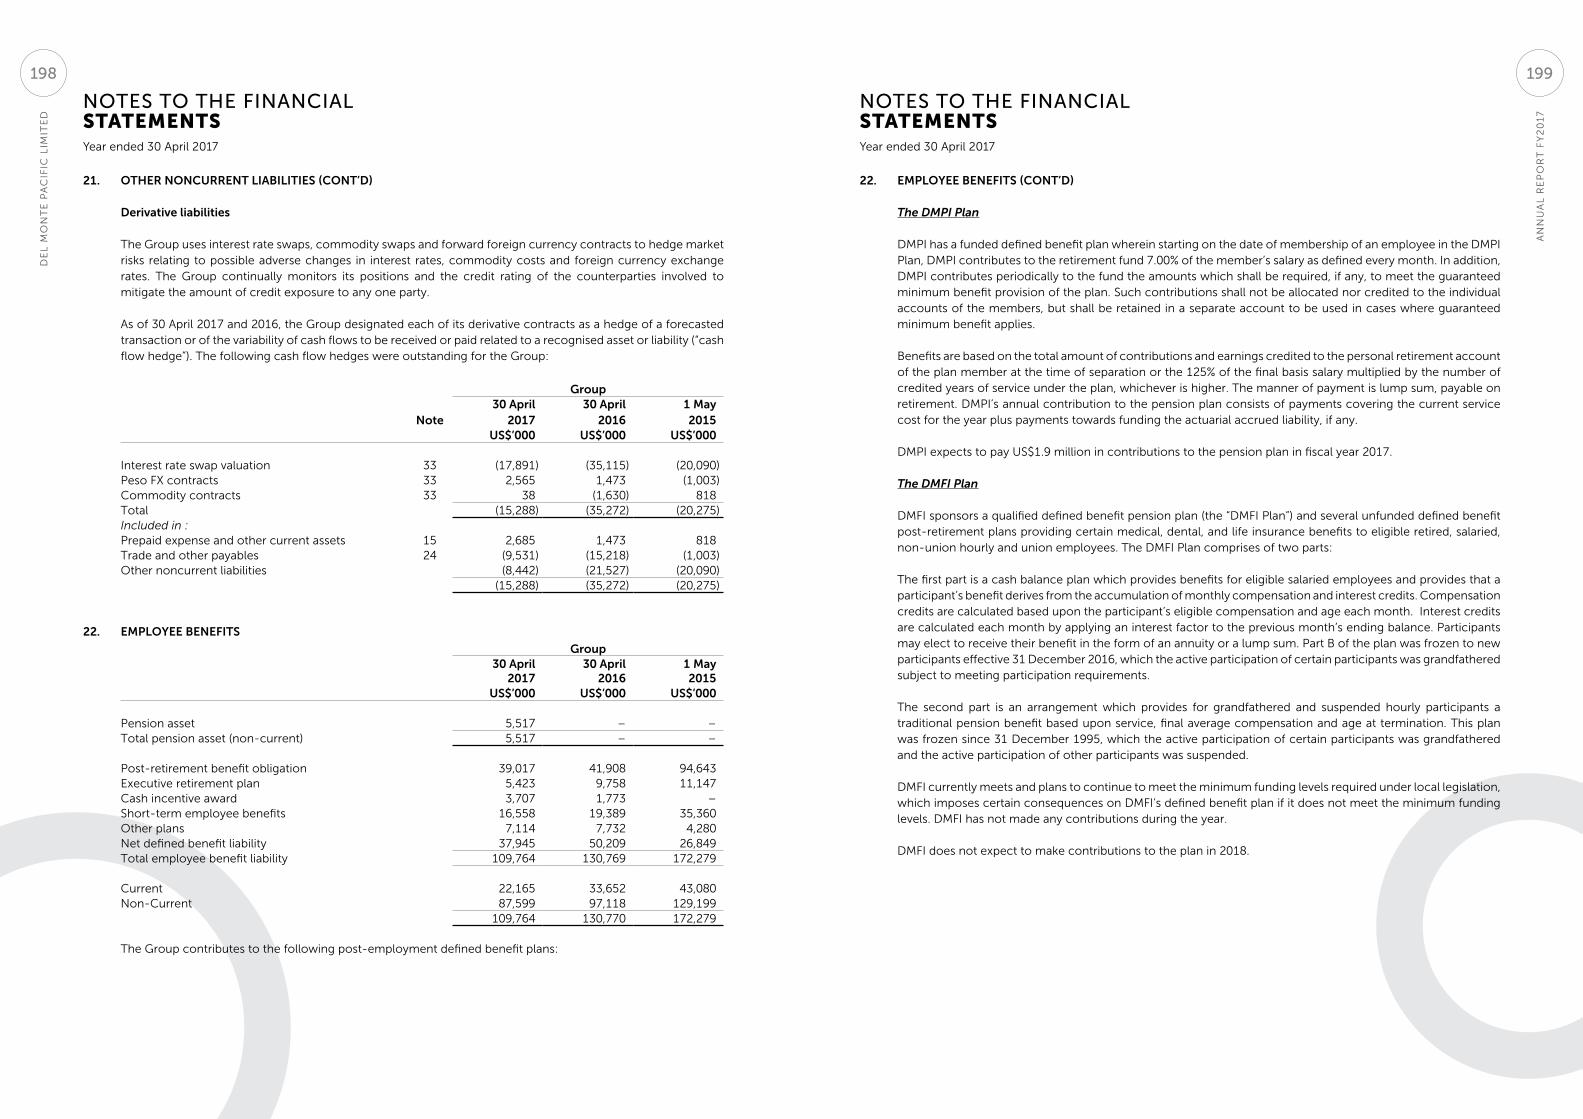
NOTES TO THE FINANCIAL STATEMENTS
NOTES TO THE FINANCIAL STATEMENTS
Year ended 30 April 2017 Year ended 30 April 2017
21. OTHER NONCURRENT LIABILITIES (CONT’D)
Derivative liabilities
The Group uses interest rate swaps, commodity swaps and forward foreign currency contracts to hedge market risks relating to possible adverse changes in interest rates, commodity costs and foreign currency exchange rates. The Group continually monitors its positions and the credit rating of the counterparties involved to mitigate the amount of credit exposure to any one party.
As of 30 April 2017 and 2016, the Group designated each of its derivative contracts as a hedge of a forecasted transaction or of the variability of cash flows to be received or paid related to a recognised asset or liability (“cash flow hedge”). The following cash flow hedges were outstanding for the Group:
Group
Note30 April
201730 April
20161 May2015
US$’000 US$’000 US$’000
Interest rate swap valuation 33 (17,891) (35,115) (20,090)Peso FX contracts 33 2,565 1,473 (1,003)Commodity contracts 33 38 (1,630) 818Total (15,288) (35,272) (20,275)Included in :Prepaid expense and other current assets 15 2,685 1,473 818Trade and other payables 24 (9,531) (15,218) (1,003)Other noncurrent liabilities (8,442) (21,527) (20,090)
(15,288) (35,272) (20,275)
22. EMPLOYEE BENEFITS
Group30 April
201730 April
20161 May2015
US$’000 US$’000 US$’000
Pension asset 5,517 – –Total pension asset (non-current) 5,517 – –
Post-retirement benefit obligation 39,017 41,908 94,643Executive retirement plan 5,423 9,758 11,147Cash incentive award 3,707 1,773 –Short-term employee benefits 16,558 19,389 35,360Other plans 7,114 7,732 4,280Net defined benefit liability 37,945 50,209 26,849Total employee benefit liability 109,764 130,769 172,279
Current 22,165 33,652 43,080Non-Current 87,599 97,118 129,199
109,764 130,770 172,279
The Group contributes to the following post-employment defined benefit plans:
22. EMPLOYEE BENEFITS (CONT’D)
The DMPI Plan
DMPI has a funded defined benefit plan wherein starting on the date of membership of an employee in the DMPI Plan, DMPI contributes to the retirement fund 7.00% of the member’s salary as defined every month. In addition, DMPI contributes periodically to the fund the amounts which shall be required, if any, to meet the guaranteed minimum benefit provision of the plan. Such contributions shall not be allocated nor credited to the individual accounts of the members, but shall be retained in a separate account to be used in cases where guaranteed minimum benefit applies.
Benefits are based on the total amount of contributions and earnings credited to the personal retirement account of the plan member at the time of separation or the 125% of the final basis salary multiplied by the number of credited years of service under the plan, whichever is higher. The manner of payment is lump sum, payable on retirement. DMPI’s annual contribution to the pension plan consists of payments covering the current service cost for the year plus payments towards funding the actuarial accrued liability, if any.
DMPI expects to pay US$1.9 million in contributions to the pension plan in fiscal year 2017.
The DMFI Plan
DMFI sponsors a qualified defined benefit pension plan (the “DMFI Plan”) and several unfunded defined benefit post-retirement plans providing certain medical, dental, and life insurance benefits to eligible retired, salaried, non-union hourly and union employees. The DMFI Plan comprises of two parts:
The first part is a cash balance plan which provides benefits for eligible salaried employees and provides that a participant’s benefit derives from the accumulation of monthly compensation and interest credits. Compensation credits are calculated based upon the participant’s eligible compensation and age each month. Interest credits are calculated each month by applying an interest factor to the previous month’s ending balance. Participants may elect to receive their benefit in the form of an annuity or a lump sum. Part B of the plan was frozen to new participants effective 31 December 2016, which the active participation of certain participants was grandfathered subject to meeting participation requirements.
The second part is an arrangement which provides for grandfathered and suspended hourly participants a traditional pension benefit based upon service, final average compensation and age at termination. This plan was frozen since 31 December 1995, which the active participation of certain participants was grandfathered and the active participation of other participants was suspended.
DMFI currently meets and plans to continue to meet the minimum funding levels required under local legislation, which imposes certain consequences on DMFI’s defined benefit plan if it does not meet the minimum funding levels. DMFI has not made any contributions during the year.
DMFI does not expect to make contributions to the plan in 2018.
AN
NU
AL
RE
PO
RT
FY
20
17
DE
L M
ON
TE
PA
CIF
IC L
IMIT
ED
199198
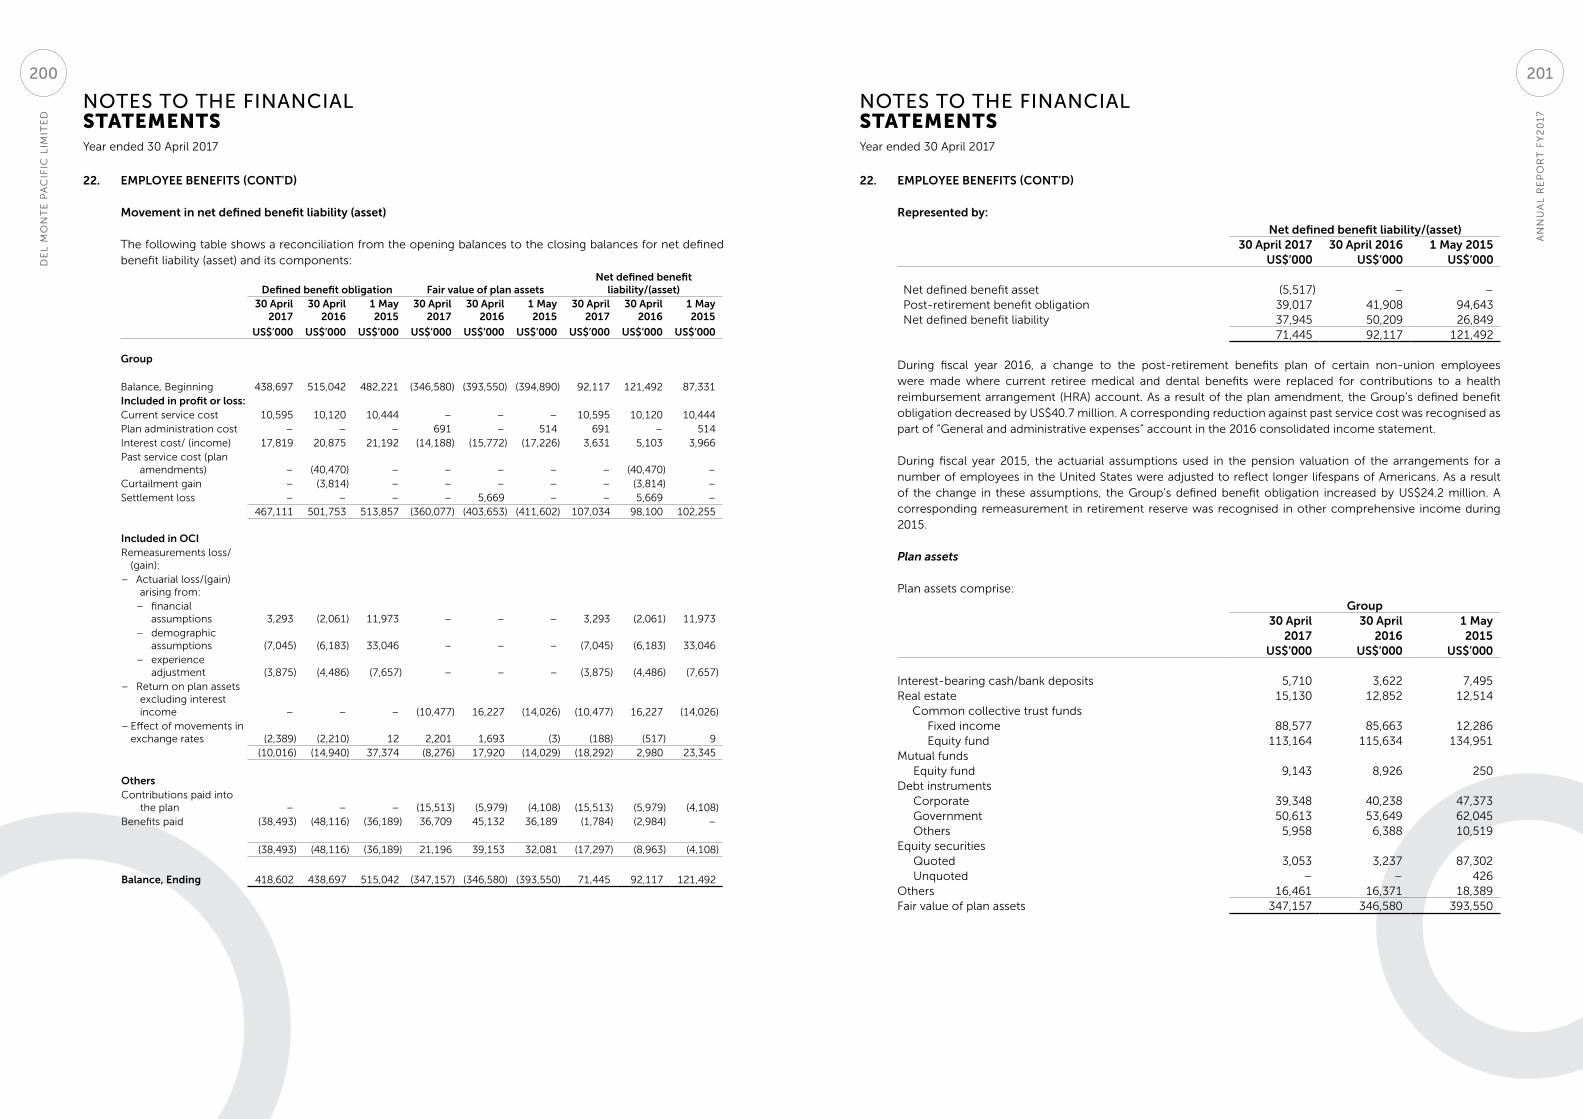
NOTES TO THE FINANCIAL STATEMENTS
NOTES TO THE FINANCIAL STATEMENTS
Year ended 30 April 2017 Year ended 30 April 2017
22. EMPLOYEE BENEFITS (CONT'D)
Movement in net defined benefit liability (asset)
The following table shows a reconciliation from the opening balances to the closing balances for net defined benefit liability (asset) and its components:
Defined benefit obligation Fair value of plan assetsNet defined benefit
liability/(asset)30 April
201730 April
20161 May 2015
30 April 2017
30 April 2016
1 May 2015
30 April 2017
30 April 2016
1 May 2015
US$’000 US$’000 US$’000 US$’000 US$’000 US$’000 US$’000 US$’000 US$’000
Group
Balance, Beginning 438,697 515,042 482,221 (346,580) (393,550) (394,890) 92,117 121,492 87,331Included in profit or loss:Current service cost 10,595 10,120 10,444 – – – 10,595 10,120 10,444Plan administration cost – – – 691 – 514 691 – 514Interest cost/ (income) 17,819 20,875 21,192 (14,188) (15,772) (17,226) 3,631 5,103 3,966Past service cost (plan
amendments) – (40,470) – – – – – (40,470) –Curtailment gain – (3,814) – – – – – (3,814) –Settlement loss – – – – 5,669 – – 5,669 –
467,111 501,753 513,857 (360,077) (403,653) (411,602) 107,034 98,100 102,255
Included in OCIRemeasurements loss/
(gain):– Actuarial loss/(gain)
arising from: – financial
assumptions 3,293 (2,061) 11,973 – – – 3,293 (2,061) 11,973 – demographic
assumptions (7,045) (6,183) 33,046 – – – (7,045) (6,183) 33,046 – experience
adjustment (3,875) (4,486) (7,657) – – – (3,875) (4,486) (7,657)– Return on plan assets
excluding interest income – – – (10,477) 16,227 (14,026) (10,477) 16,227 (14,026)
– Effect of movements in exchange rates (2,389) (2,210) 12 2,201 1,693 (3) (188) (517) 9
(10,016) (14,940) 37,374 (8,276) 17,920 (14,029) (18,292) 2,980 23,345
OthersContributions paid into
the plan – – – (15,513) (5,979) (4,108) (15,513) (5,979) (4,108)Benefits paid (38,493) (48,116) (36,189) 36,709 45,132 36,189 (1,784) (2,984) –
(38,493) (48,116) (36,189) 21,196 39,153 32,081 (17,297) (8,963) (4,108)
Balance, Ending 418,602 438,697 515,042 (347,157) (346,580) (393,550) 71,445 92,117 121,492
22. EMPLOYEE BENEFITS (CONT’D)
Represented by:
Net defined benefit liability/(asset)30 April 2017 30 April 2016 1 May 2015
US$’000 US$’000 US$’000
Net defined benefit asset (5,517) – –Post-retirement benefit obligation 39,017 41,908 94,643Net defined benefit liability 37,945 50,209 26,849
71,445 92,117 121,492
During fiscal year 2016, a change to the post-retirement benefits plan of certain non-union employees were made where current retiree medical and dental benefits were replaced for contributions to a health reimbursement arrangement (HRA) account. As a result of the plan amendment, the Group’s defined benefit obligation decreased by US$40.7 million. A corresponding reduction against past service cost was recognised as part of “General and administrative expenses” account in the 2016 consolidated income statement.
During fiscal year 2015, the actuarial assumptions used in the pension valuation of the arrangements for a number of employees in the United States were adjusted to reflect longer lifespans of Americans. As a result of the change in these assumptions, the Group’s defined benefit obligation increased by US$24.2 million. A corresponding remeasurement in retirement reserve was recognised in other comprehensive income during 2015.
Plan assets
Plan assets comprise:
Group30 April 30 April 1 May
2017 2016 2015US$’000 US$’000 US$’000
Interest-bearing cash/bank deposits 5,710 3,622 7,495Real estate 15,130 12,852 12,514 Common collective trust funds Fixed income 88,577 85,663 12,286 Equity fund 113,164 115,634 134,951Mutual funds Equity fund 9,143 8,926 250Debt instruments Corporate 39,348 40,238 47,373 Government 50,613 53,649 62,045 Others 5,958 6,388 10,519Equity securities Quoted 3,053 3,237 87,302 Unquoted – – 426Others 16,461 16,371 18,389Fair value of plan assets 347,157 346,580 393,550
AN
NU
AL
RE
PO
RT
FY
20
17
DE
L M
ON
TE
PA
CIF
IC L
IMIT
ED
201200
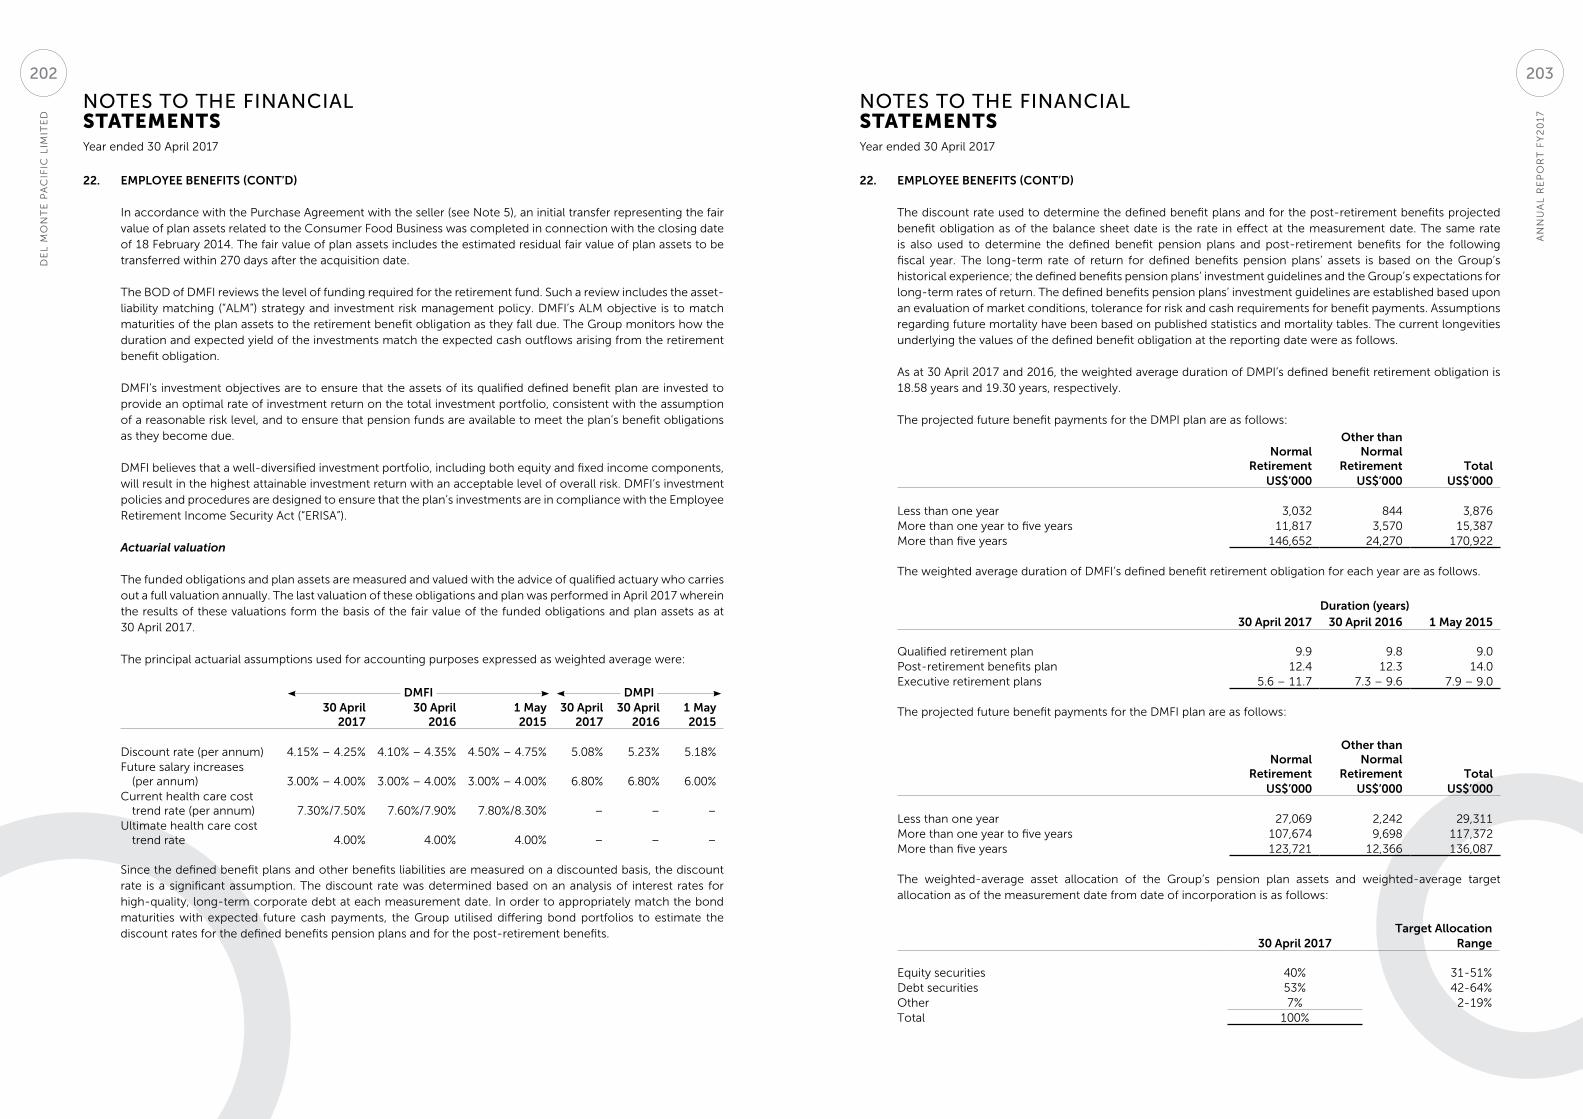
NOTES TO THE FINANCIAL STATEMENTS
NOTES TO THE FINANCIAL STATEMENTS
Year ended 30 April 2017 Year ended 30 April 2017
22. EMPLOYEE BENEFITS (CONT’D)
In accordance with the Purchase Agreement with the seller (see Note 5), an initial transfer representing the fair value of plan assets related to the Consumer Food Business was completed in connection with the closing date of 18 February 2014. The fair value of plan assets includes the estimated residual fair value of plan assets to be transferred within 270 days after the acquisition date.
The BOD of DMFI reviews the level of funding required for the retirement fund. Such a review includes the asset-liability matching (“ALM”) strategy and investment risk management policy. DMFI’s ALM objective is to match maturities of the plan assets to the retirement benefit obligation as they fall due. The Group monitors how the duration and expected yield of the investments match the expected cash outflows arising from the retirement benefit obligation.
DMFI’s investment objectives are to ensure that the assets of its qualified defined benefit plan are invested to provide an optimal rate of investment return on the total investment portfolio, consistent with the assumption of a reasonable risk level, and to ensure that pension funds are available to meet the plan’s benefit obligations as they become due.
DMFI believes that a well-diversified investment portfolio, including both equity and fixed income components, will result in the highest attainable investment return with an acceptable level of overall risk. DMFI’s investment policies and procedures are designed to ensure that the plan’s investments are in compliance with the Employee Retirement Income Security Act (“ERISA”).
Actuarial valuation
The funded obligations and plan assets are measured and valued with the advice of qualified actuary who carries out a full valuation annually. The last valuation of these obligations and plan was performed in April 2017 wherein the results of these valuations form the basis of the fair value of the funded obligations and plan assets as at 30 April 2017.
The principal actuarial assumptions used for accounting purposes expressed as weighted average were:
DMFI DMPI 30 April
201730 April
20161 May2015
30 April2017
30 April2016
1 May2015
Discount rate (per annum) 4.15% – 4.25% 4.10% – 4.35% 4.50% – 4.75% 5.08% 5.23% 5.18%Future salary increases
(per annum) 3.00% – 4.00% 3.00% – 4.00% 3.00% – 4.00% 6.80% 6.80% 6.00%Current health care cost
trend rate (per annum) 7.30%/7.50% 7.60%/7.90% 7.80%/8.30% – – –Ultimate health care cost
trend rate 4.00% 4.00% 4.00% – – –
Since the defined benefit plans and other benefits liabilities are measured on a discounted basis, the discount rate is a significant assumption. The discount rate was determined based on an analysis of interest rates for high-quality, long-term corporate debt at each measurement date. In order to appropriately match the bond maturities with expected future cash payments, the Group utilised differing bond portfolios to estimate the discount rates for the defined benefits pension plans and for the post-retirement benefits.
22. EMPLOYEE BENEFITS (CONT’D)
The discount rate used to determine the defined benefit plans and for the post-retirement benefits projected benefit obligation as of the balance sheet date is the rate in effect at the measurement date. The same rate is also used to determine the defined benefit pension plans and post-retirement benefits for the following fiscal year. The long-term rate of return for defined benefits pension plans’ assets is based on the Group’s historical experience; the defined benefits pension plans’ investment guidelines and the Group’s expectations for long-term rates of return. The defined benefits pension plans’ investment guidelines are established based upon an evaluation of market conditions, tolerance for risk and cash requirements for benefit payments. Assumptions regarding future mortality have been based on published statistics and mortality tables. The current longevities underlying the values of the defined benefit obligation at the reporting date were as follows.
As at 30 April 2017 and 2016, the weighted average duration of DMPI’s defined benefit retirement obligation is 18.58 years and 19.30 years, respectively.
The projected future benefit payments for the DMPI plan are as follows:
Normal Retirement
Other than Normal
Retirement TotalUS$’000 US$’000 US$’000
Less than one year 3,032 844 3,876More than one year to five years 11,817 3,570 15,387More than five years 146,652 24,270 170,922
The weighted average duration of DMFI’s defined benefit retirement obligation for each year are as follows.
Duration (years)30 April 2017 30 April 2016 1 May 2015
Qualified retirement plan 9.9 9.8 9.0Post-retirement benefits plan 12.4 12.3 14.0Executive retirement plans 5.6 – 11.7 7.3 – 9.6 7.9 – 9.0
The projected future benefit payments for the DMFI plan are as follows:
Normal Retirement
Other than Normal
Retirement TotalUS$’000 US$’000 US$’000
Less than one year 27,069 2,242 29,311 More than one year to five years 107,674 9,698 117,372 More than five years 123,721 12,366 136,087
The weighted-average asset allocation of the Group’s pension plan assets and weighted-average target allocation as of the measurement date from date of incorporation is as follows:
Target Allocation30 April 2017 Range
Equity securities 40% 31-51%Debt securities 53% 42-64%Other 7% 2-19%Total 100%
AN
NU
AL
RE
PO
RT
FY
20
17
DE
L M
ON
TE
PA
CIF
IC L
IMIT
ED
203202
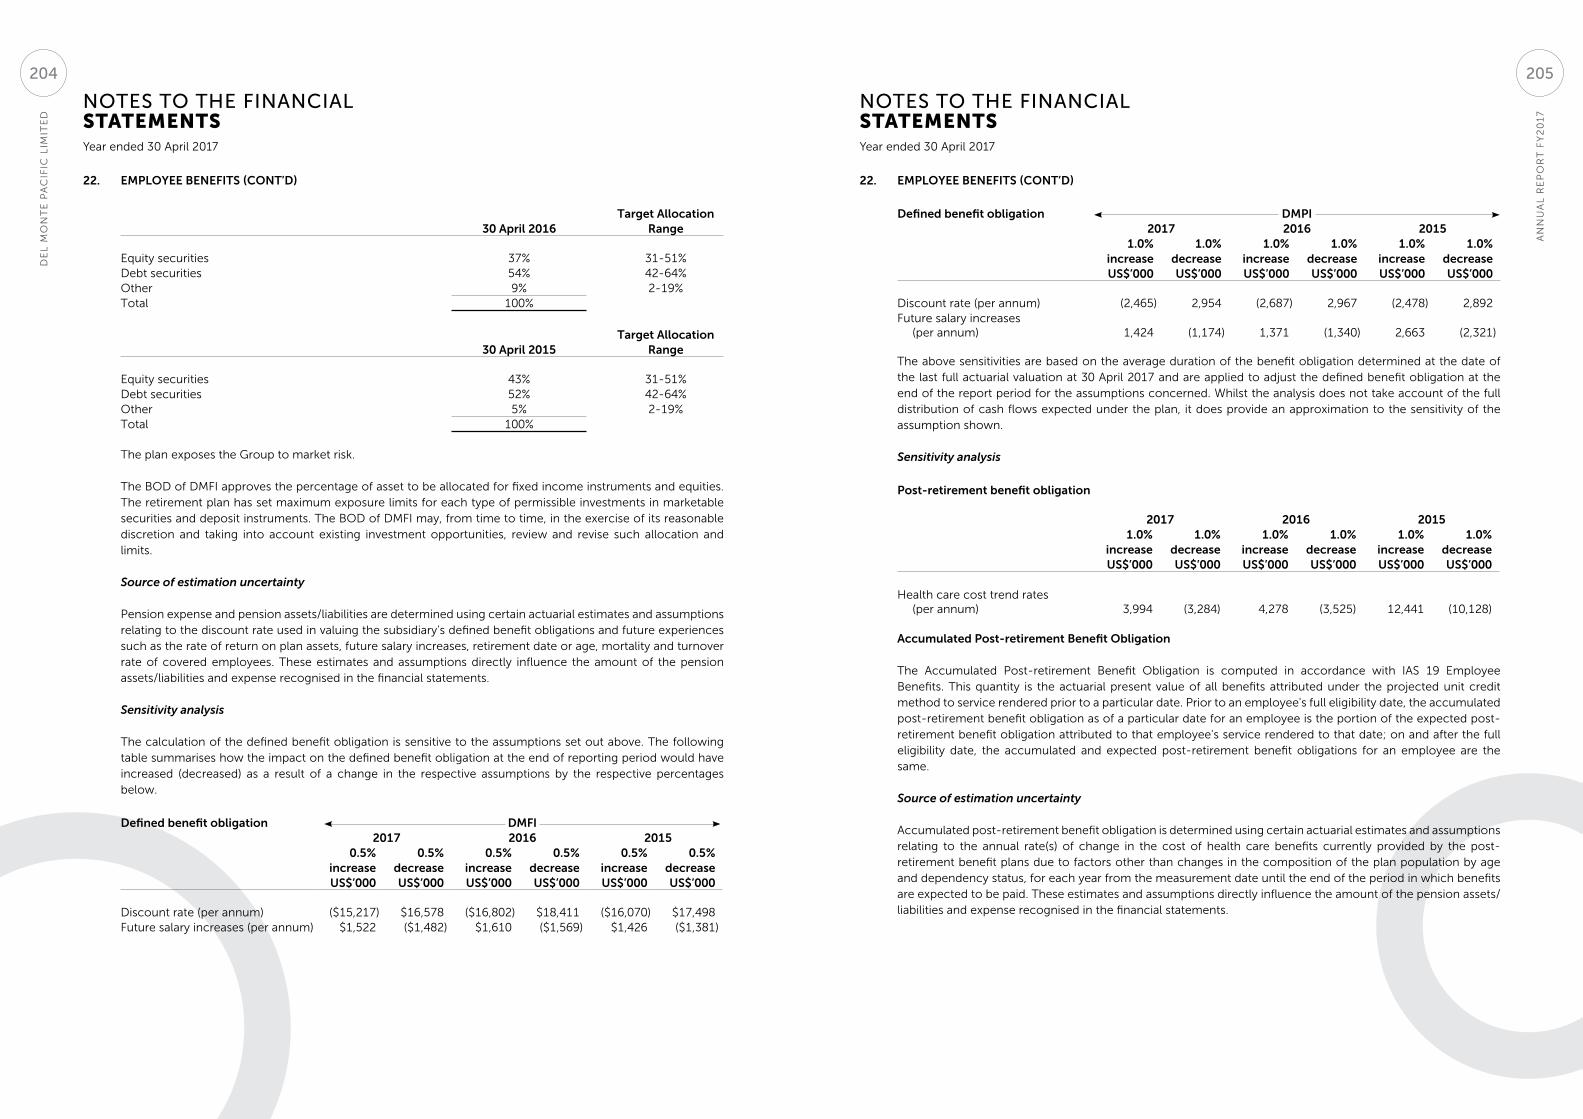
NOTES TO THE FINANCIAL STATEMENTS
NOTES TO THE FINANCIAL STATEMENTS
Year ended 30 April 2017 Year ended 30 April 2017
22. EMPLOYEE BENEFITS (CONT’D)
Target Allocation30 April 2016 Range
Equity securities 37% 31-51%Debt securities 54% 42-64%Other 9% 2-19%Total 100%
Target Allocation30 April 2015 Range
Equity securities 43% 31-51%Debt securities 52% 42-64%Other 5% 2-19%Total 100%
The plan exposes the Group to market risk.
The BOD of DMFI approves the percentage of asset to be allocated for fixed income instruments and equities. The retirement plan has set maximum exposure limits for each type of permissible investments in marketable securities and deposit instruments. The BOD of DMFI may, from time to time, in the exercise of its reasonable discretion and taking into account existing investment opportunities, review and revise such allocation and limits.
Source of estimation uncertainty
Pension expense and pension assets/liabilities are determined using certain actuarial estimates and assumptions relating to the discount rate used in valuing the subsidiary’s defined benefit obligations and future experiences such as the rate of return on plan assets, future salary increases, retirement date or age, mortality and turnover rate of covered employees. These estimates and assumptions directly influence the amount of the pension assets/liabilities and expense recognised in the financial statements.
Sensitivity analysis
The calculation of the defined benefit obligation is sensitive to the assumptions set out above. The following table summarises how the impact on the defined benefit obligation at the end of reporting period would have increased (decreased) as a result of a change in the respective assumptions by the respective percentages below.
Defined benefit obligation DMFI 2017 2016 2015
0.5% 0.5% 0.5% 0.5% 0.5% 0.5%increase decrease increase decrease increase decreaseUS$’000 US$’000 US$’000 US$’000 US$’000 US$’000
Discount rate (per annum) ($15,217) $16,578 ($16,802) $18,411 ($16,070) $17,498Future salary increases (per annum) $1,522 ($1,482) $1,610 ($1,569) $1,426 ($1,381)
22. EMPLOYEE BENEFITS (CONT’D)
Defined benefit obligation DMPI 2017 2016 2015
1.0% 1.0% 1.0% 1.0% 1.0% 1.0%increase decrease increase decrease increase decreaseUS$’000 US$’000 US$’000 US$’000 US$’000 US$’000
Discount rate (per annum) (2,465) 2,954 (2,687) 2,967 (2,478) 2,892Future salary increases
(per annum) 1,424 (1,174) 1,371 (1,340) 2,663 (2,321)
The above sensitivities are based on the average duration of the benefit obligation determined at the date of the last full actuarial valuation at 30 April 2017 and are applied to adjust the defined benefit obligation at the end of the report period for the assumptions concerned. Whilst the analysis does not take account of the full distribution of cash flows expected under the plan, it does provide an approximation to the sensitivity of the assumption shown.
Sensitivity analysis
Post-retirement benefit obligation
2017 2016 20151.0% 1.0% 1.0% 1.0% 1.0% 1.0%
increase decrease increase decrease increase decreaseUS$’000 US$’000 US$’000 US$’000 US$’000 US$’000
Health care cost trend rates (per annum) 3,994 (3,284) 4,278 (3,525) 12,441 (10,128)
Accumulated Post-retirement Benefit Obligation
The Accumulated Post-retirement Benefit Obligation is computed in accordance with IAS 19 Employee Benefits. This quantity is the actuarial present value of all benefits attributed under the projected unit credit method to service rendered prior to a particular date. Prior to an employee's full eligibility date, the accumulated post-retirement benefit obligation as of a particular date for an employee is the portion of the expected post-retirement benefit obligation attributed to that employee's service rendered to that date; on and after the full eligibility date, the accumulated and expected post-retirement benefit obligations for an employee are the same.
Source of estimation uncertainty
Accumulated post-retirement benefit obligation is determined using certain actuarial estimates and assumptions relating to the annual rate(s) of change in the cost of health care benefits currently provided by the post-retirement benefit plans due to factors other than changes in the composition of the plan population by age and dependency status, for each year from the measurement date until the end of the period in which benefits are expected to be paid. These estimates and assumptions directly influence the amount of the pension assets/liabilities and expense recognised in the financial statements.
AN
NU
AL
RE
PO
RT
FY
20
17
DE
L M
ON
TE
PA
CIF
IC L
IMIT
ED
205204
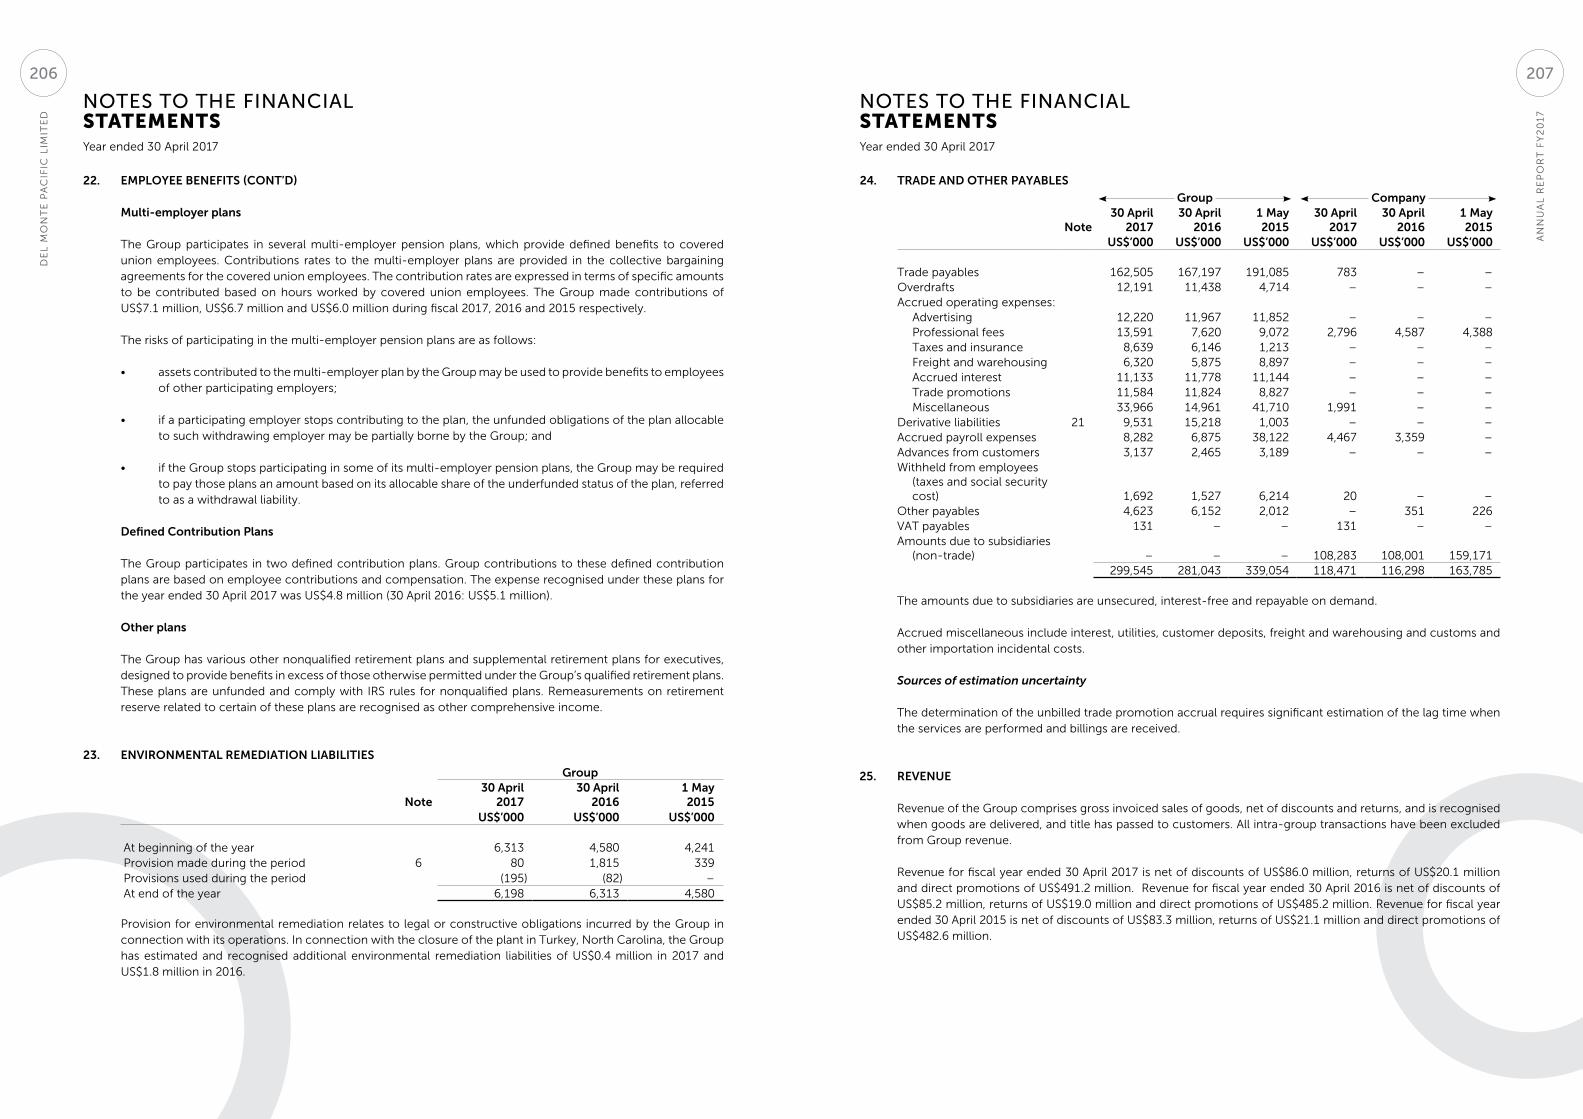
NOTES TO THE FINANCIAL STATEMENTS
NOTES TO THE FINANCIAL STATEMENTS
Year ended 30 April 2017 Year ended 30 April 2017
22. EMPLOYEE BENEFITS (CONT’D)
Multi-employer plans
The Group participates in several multi-employer pension plans, which provide defined benefits to covered union employees. Contributions rates to the multi-employer plans are provided in the collective bargaining agreements for the covered union employees. The contribution rates are expressed in terms of specific amounts to be contributed based on hours worked by covered union employees. The Group made contributions of US$7.1 million, US$6.7 million and US$6.0 million during fiscal 2017, 2016 and 2015 respectively.
The risks of participating in the multi-employer pension plans are as follows:
• assets contributed to the multi-employer plan by the Group may be used to provide benefits to employees of other participating employers;
• if a participating employer stops contributing to the plan, the unfunded obligations of the plan allocable to such withdrawing employer may be partially borne by the Group; and
• if the Group stops participating in some of its multi-employer pension plans, the Group may be required to pay those plans an amount based on its allocable share of the underfunded status of the plan, referred to as a withdrawal liability.
Defined Contribution Plans
The Group participates in two defined contribution plans. Group contributions to these defined contribution plans are based on employee contributions and compensation. The expense recognised under these plans for the year ended 30 April 2017 was US$4.8 million (30 April 2016: US$5.1 million).
Other plans
The Group has various other nonqualified retirement plans and supplemental retirement plans for executives, designed to provide benefits in excess of those otherwise permitted under the Group’s qualified retirement plans. These plans are unfunded and comply with IRS rules for nonqualified plans. Remeasurements on retirement reserve related to certain of these plans are recognised as other comprehensive income.
23. ENVIRONMENTAL REMEDIATION LIABILITIES
Group
Note30 April
201730 April
20161 May2015
US$’000 US$’000 US$’000
At beginning of the year 6,313 4,580 4,241Provision made during the period 6 80 1,815 339Provisions used during the period (195) (82) –At end of the year 6,198 6,313 4,580
Provision for environmental remediation relates to legal or constructive obligations incurred by the Group in connection with its operations. In connection with the closure of the plant in Turkey, North Carolina, the Group has estimated and recognised additional environmental remediation liabilities of US$0.4 million in 2017 and US$1.8 million in 2016.
24. TRADE AND OTHER PAYABLES
Group Company
Note30 April
201730 April
20161 May2015
30 April2017
30 April2016
1 May2015
US$’000 US$’000 US$’000 US$’000 US$’000 US$’000
Trade payables 162,505 167,197 191,085 783 – –Overdrafts 12,191 11,438 4,714 – – –Accrued operating expenses: Advertising 12,220 11,967 11,852 – – – Professional fees 13,591 7,620 9,072 2,796 4,587 4,388 Taxes and insurance 8,639 6,146 1,213 – – – Freight and warehousing 6,320 5,875 8,897 – – – Accrued interest 11,133 11,778 11,144 – – – Trade promotions 11,584 11,824 8,827 – – – Miscellaneous 33,966 14,961 41,710 1,991 – –Derivative liabilities 21 9,531 15,218 1,003 – – –Accrued payroll expenses 8,282 6,875 38,122 4,467 3,359 –Advances from customers 3,137 2,465 3,189 – – –Withheld from employees
(taxes and social security cost) 1,692 1,527 6,214 20 – –
Other payables 4,623 6,152 2,012 – 351 226VAT payables 131 – – 131 – –Amounts due to subsidiaries
(non-trade) – – – 108,283 108,001 159,171299,545 281,043 339,054 118,471 116,298 163,785
The amounts due to subsidiaries are unsecured, interest-free and repayable on demand.
Accrued miscellaneous include interest, utilities, customer deposits, freight and warehousing and customs and other importation incidental costs.
Sources of estimation uncertainty
The determination of the unbilled trade promotion accrual requires significant estimation of the lag time when the services are performed and billings are received.
25. REVENUE
Revenue of the Group comprises gross invoiced sales of goods, net of discounts and returns, and is recognised when goods are delivered, and title has passed to customers. All intra-group transactions have been excluded from Group revenue.
Revenue for fiscal year ended 30 April 2017 is net of discounts of US$86.0 million, returns of US$20.1 million and direct promotions of US$491.2 million. Revenue for fiscal year ended 30 April 2016 is net of discounts of US$85.2 million, returns of US$19.0 million and direct promotions of US$485.2 million. Revenue for fiscal year ended 30 April 2015 is net of discounts of US$83.3 million, returns of US$21.1 million and direct promotions of US$482.6 million.
AN
NU
AL
RE
PO
RT
FY
20
17
DE
L M
ON
TE
PA
CIF
IC L
IMIT
ED
207206
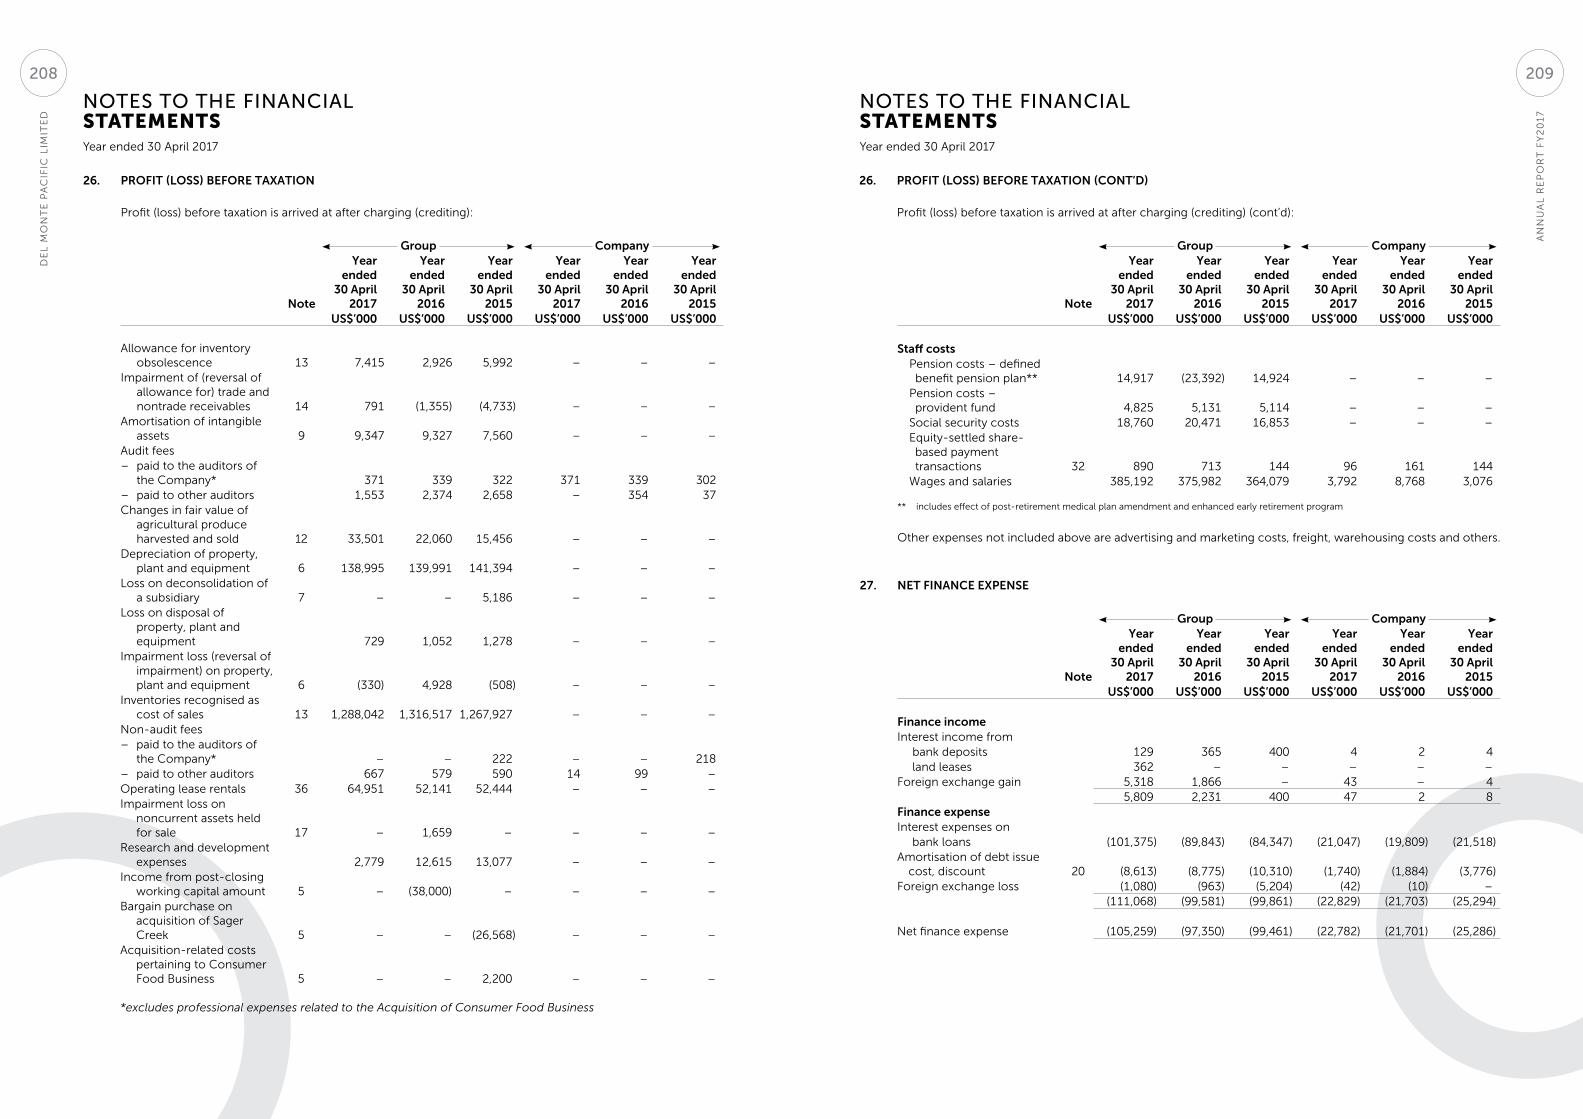
NOTES TO THE FINANCIAL STATEMENTS
NOTES TO THE FINANCIAL STATEMENTS
Year ended 30 April 2017 Year ended 30 April 2017
26. PROFIT (LOSS) BEFORE TAXATION
Profit (loss) before taxation is arrived at after charging (crediting):
Group Company
Note
Year ended
30 April2017
Year ended
30 April 2016
Year ended
30 April 2015
Year ended
30 April2017
Year ended
30 April 2016
Year ended
30 April 2015
US$’000 US$’000 US$’000 US$’000 US$’000 US$’000
Allowance for inventory obsolescence 13 7,415 2,926 5,992 – – –
Impairment of (reversal of allowance for) trade and nontrade receivables 14 791 (1,355) (4,733) – – –
Amortisation of intangible assets 9 9,347 9,327 7,560 – – –
Audit fees– paid to the auditors of
the Company* 371 339 322 371 339 302– paid to other auditors 1,553 2,374 2,658 – 354 37Changes in fair value of
agricultural produce harvested and sold 12 33,501 22,060 15,456 – – –
Depreciation of property, plant and equipment 6 138,995 139,991 141,394 – – –
Loss on deconsolidation of a subsidiary 7 – – 5,186 – – –
Loss on disposal of property, plant and equipment 729 1,052 1,278 – – –
Impairment loss (reversal of impairment) on property, plant and equipment 6 (330) 4,928 (508) – – –
Inventories recognised as cost of sales 13 1,288,042 1,316,517 1,267,927 – – –
Non-audit fees– paid to the auditors of
the Company* – – 222 – – 218– paid to other auditors 667 579 590 14 99 –Operating lease rentals 36 64,951 52,141 52,444 – – –Impairment loss on
noncurrent assets held for sale 17 – 1,659 – – – –
Research and development expenses 2,779 12,615 13,077 – – –
Income from post-closing working capital amount 5 – (38,000) – – – –
Bargain purchase on acquisition of Sager Creek 5 – – (26,568) – – –
Acquisition-related costs pertaining to Consumer Food Business 5 – – 2,200 – – –
*excludes professional expenses related to the Acquisition of Consumer Food Business
26. PROFIT (LOSS) BEFORE TAXATION (CONT’D)
Profit (loss) before taxation is arrived at after charging (crediting) (cont’d):
Group Company
Note
Year ended
30 April2017
Year ended
30 April 2016
Year ended
30 April 2015
Year ended
30 April2017
Year ended
30 April 2016
Year ended
30 April 2015
US$’000 US$’000 US$’000 US$’000 US$’000 US$’000
Staff costsPension costs – defined benefit pension plan** 14,917 (23,392) 14,924 – – –
Pension costs – provident fund 4,825 5,131 5,114 – – –
Social security costs 18,760 20,471 16,853 – – –Equity-settled share-based payment transactions 32 890 713 144 96 161 144
Wages and salaries 385,192 375,982 364,079 3,792 8,768 3,076
** includes effect of post-retirement medical plan amendment and enhanced early retirement program
Other expenses not included above are advertising and marketing costs, freight, warehousing costs and others.
27. NET FINANCE EXPENSE
Group Company
Note
Year ended
30 April2017
Year ended
30 April 2016
Year ended
30 April 2015
Year ended
30 April2017
Year ended
30 April 2016
Year ended
30 April 2015
US$’000 US$’000 US$’000 US$’000 US$’000 US$’000
Finance incomeInterest income from
bank deposits 129 365 400 4 2 4land leases 362 – – – – –
Foreign exchange gain 5,318 1,866 – 43 – 4 5,809 2,231 400 47 2 8
Finance expenseInterest expenses on
bank loans (101,375) (89,843) (84,347) (21,047) (19,809) (21,518)Amortisation of debt issue
cost, discount 20
(8,613) (8,775) (10,310) (1,740) (1,884) (3,776)Foreign exchange loss (1,080) (963) (5,204) (42) (10) –
(111,068) (99,581) (99,861) (22,829) (21,703) (25,294)
Net finance expense (105,259) (97,350) (99,461) (22,782) (21,701) (25,286)
AN
NU
AL
RE
PO
RT
FY
20
17
DE
L M
ON
TE
PA
CIF
IC L
IMIT
ED
209208
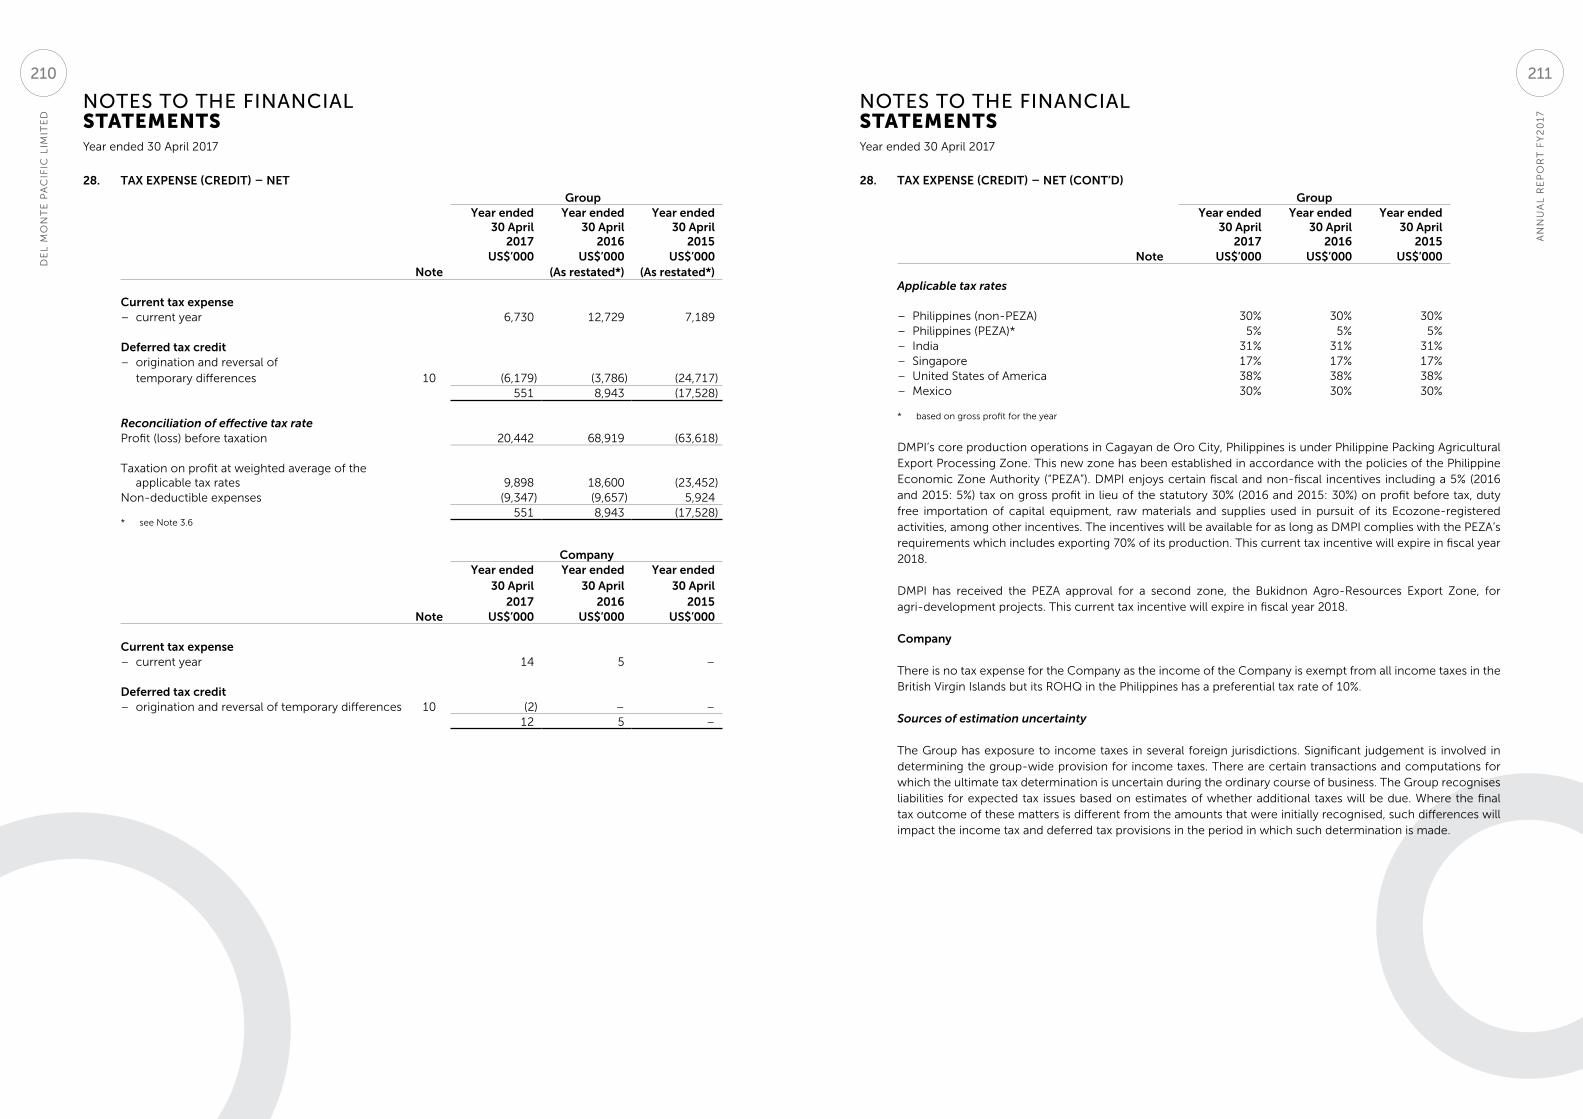
NOTES TO THE FINANCIAL STATEMENTS
NOTES TO THE FINANCIAL STATEMENTS
Year ended 30 April 2017 Year ended 30 April 2017
28. TAX EXPENSE (CREDIT) – NET
Group Year ended
30 April2017
Year ended 30 April
2016
Year ended 30 April
2015US$’000 US$’000 US$’000
Note (As restated*) (As restated*)
Current tax expense– current year 6,730 12,729 7,189
Deferred tax credit– origination and reversal of temporary differences 10 (6,179) (3,786) (24,717)
551 8,943 (17,528)
Reconciliation of effective tax rateProfit (loss) before taxation 20,442 68,919 (63,618)
Taxation on profit at weighted average of the applicable tax rates 9,898 18,600 (23,452)
Non-deductible expenses (9,347) (9,657) 5,924 551 8,943 (17,528)
* see Note 3.6
Company Year ended
30 April2017
Year ended 30 April
2016
Year ended 30 April
2015Note US$’000 US$’000 US$’000
Current tax expense– current year 14 5 –
Deferred tax credit– origination and reversal of temporary differences 10 (2) – –
12 5 –
28. TAX EXPENSE (CREDIT) – NET (CONT’D)
Group Year ended
30 April 2017
Year ended 30 April
2016
Year ended 30 April
2015Note US$’000 US$’000 US$’000
Applicable tax rates
– Philippines (non-PEZA) 30% 30% 30%– Philippines (PEZA)* 5% 5% 5%– India 31% 31% 31%– Singapore 17% 17% 17%– United States of America 38% 38% 38%– Mexico 30% 30% 30%
* based on gross profit for the year
DMPI’s core production operations in Cagayan de Oro City, Philippines is under Philippine Packing Agricultural Export Processing Zone. This new zone has been established in accordance with the policies of the Philippine Economic Zone Authority (“PEZA”). DMPI enjoys certain fiscal and non-fiscal incentives including a 5% (2016 and 2015: 5%) tax on gross profit in lieu of the statutory 30% (2016 and 2015: 30%) on profit before tax, duty free importation of capital equipment, raw materials and supplies used in pursuit of its Ecozone-registered activities, among other incentives. The incentives will be available for as long as DMPI complies with the PEZA’s requirements which includes exporting 70% of its production. This current tax incentive will expire in fiscal year 2018.
DMPI has received the PEZA approval for a second zone, the Bukidnon Agro-Resources Export Zone, for agri-development projects. This current tax incentive will expire in fiscal year 2018.
Company
There is no tax expense for the Company as the income of the Company is exempt from all income taxes in the British Virgin Islands but its ROHQ in the Philippines has a preferential tax rate of 10%.
Sources of estimation uncertainty
The Group has exposure to income taxes in several foreign jurisdictions. Significant judgement is involved in determining the group-wide provision for income taxes. There are certain transactions and computations for which the ultimate tax determination is uncertain during the ordinary course of business. The Group recognises liabilities for expected tax issues based on estimates of whether additional taxes will be due. Where the final tax outcome of these matters is different from the amounts that were initially recognised, such differences will impact the income tax and deferred tax provisions in the period in which such determination is made.
AN
NU
AL
RE
PO
RT
FY
20
17
DE
L M
ON
TE
PA
CIF
IC L
IMIT
ED
211210
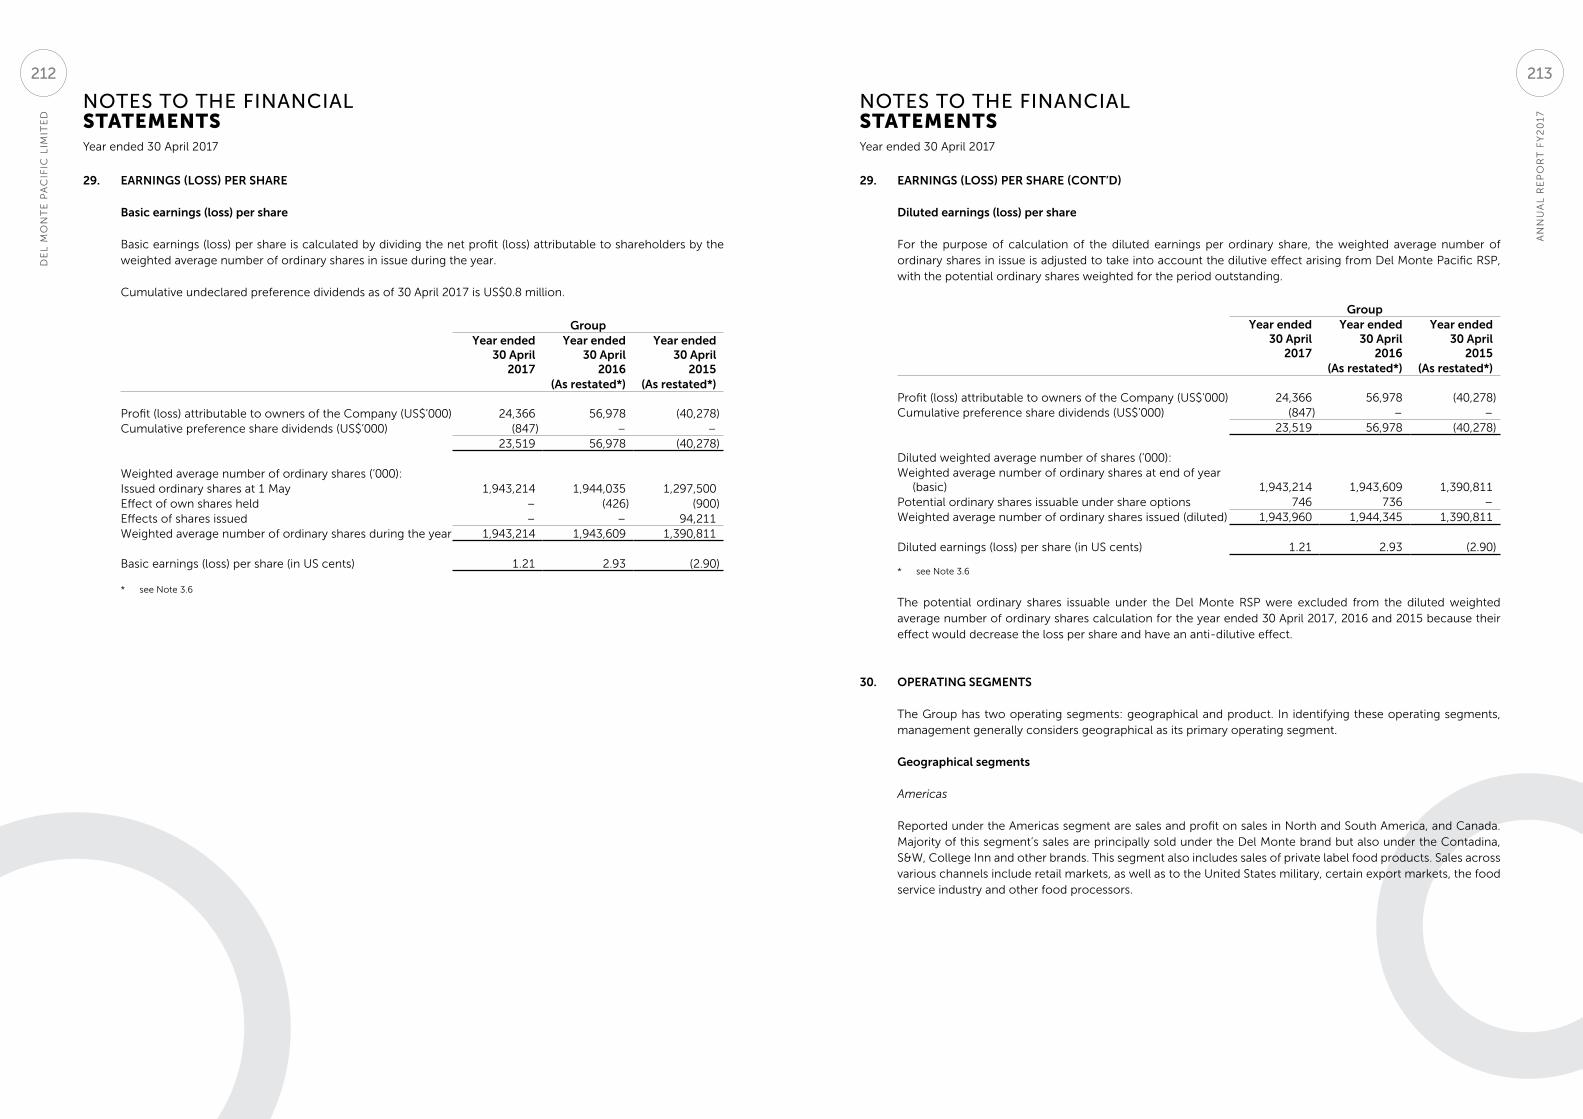
NOTES TO THE FINANCIAL STATEMENTS
NOTES TO THE FINANCIAL STATEMENTS
Year ended 30 April 2017 Year ended 30 April 2017
29. EARNINGS (LOSS) PER SHARE
Basic earnings (loss) per share
Basic earnings (loss) per share is calculated by dividing the net profit (loss) attributable to shareholders by the weighted average number of ordinary shares in issue during the year.
Cumulative undeclared preference dividends as of 30 April 2017 is US$0.8 million.
GroupYear ended
30 April 2017
Year ended 30 April
2016
Year ended 30 April
2015(As restated*) (As restated*)
Profit (loss) attributable to owners of the Company (US$’000) 24,366 56,978 (40,278)Cumulative preference share dividends (US$’000) (847) – –
23,519 56,978 (40,278)
Weighted average number of ordinary shares (’000):Issued ordinary shares at 1 May 1,943,214 1,944,035 1,297,500Effect of own shares held – (426) (900)Effects of shares issued – – 94,211Weighted average number of ordinary shares during the year 1,943,214 1,943,609 1,390,811
Basic earnings (loss) per share (in US cents) 1.21 2.93 (2.90)
* see Note 3.6
29. EARNINGS (LOSS) PER SHARE (CONT’D)
Diluted earnings (loss) per share
For the purpose of calculation of the diluted earnings per ordinary share, the weighted average number of ordinary shares in issue is adjusted to take into account the dilutive effect arising from Del Monte Pacific RSP, with the potential ordinary shares weighted for the period outstanding.
GroupYear ended
30 April 2017
Year ended 30 April
2016
Year ended 30 April
2015(As restated*) (As restated*)
Profit (loss) attributable to owners of the Company (US$’000) 24,366 56,978 (40,278)Cumulative preference share dividends (US$’000) (847) – –
23,519 56,978 (40,278)
Diluted weighted average number of shares (’000):Weighted average number of ordinary shares at end of year
(basic) 1,943,214 1,943,609 1,390,811Potential ordinary shares issuable under share options 746 736 –Weighted average number of ordinary shares issued (diluted) 1,943,960 1,944,345 1,390,811
Diluted earnings (loss) per share (in US cents) 1.21 2.93 (2.90)
* see Note 3.6
The potential ordinary shares issuable under the Del Monte RSP were excluded from the diluted weighted average number of ordinary shares calculation for the year ended 30 April 2017, 2016 and 2015 because their effect would decrease the loss per share and have an anti-dilutive effect.
30. OPERATING SEGMENTS
The Group has two operating segments: geographical and product. In identifying these operating segments, management generally considers geographical as its primary operating segment.
Geographical segments
Americas
Reported under the Americas segment are sales and profit on sales in North and South America, and Canada. Majority of this segment’s sales are principally sold under the Del Monte brand but also under the Contadina, S&W, College Inn and other brands. This segment also includes sales of private label food products. Sales across various channels include retail markets, as well as to the United States military, certain export markets, the food service industry and other food processors.
AN
NU
AL
RE
PO
RT
FY
20
17
DE
L M
ON
TE
PA
CIF
IC L
IMIT
ED
213212
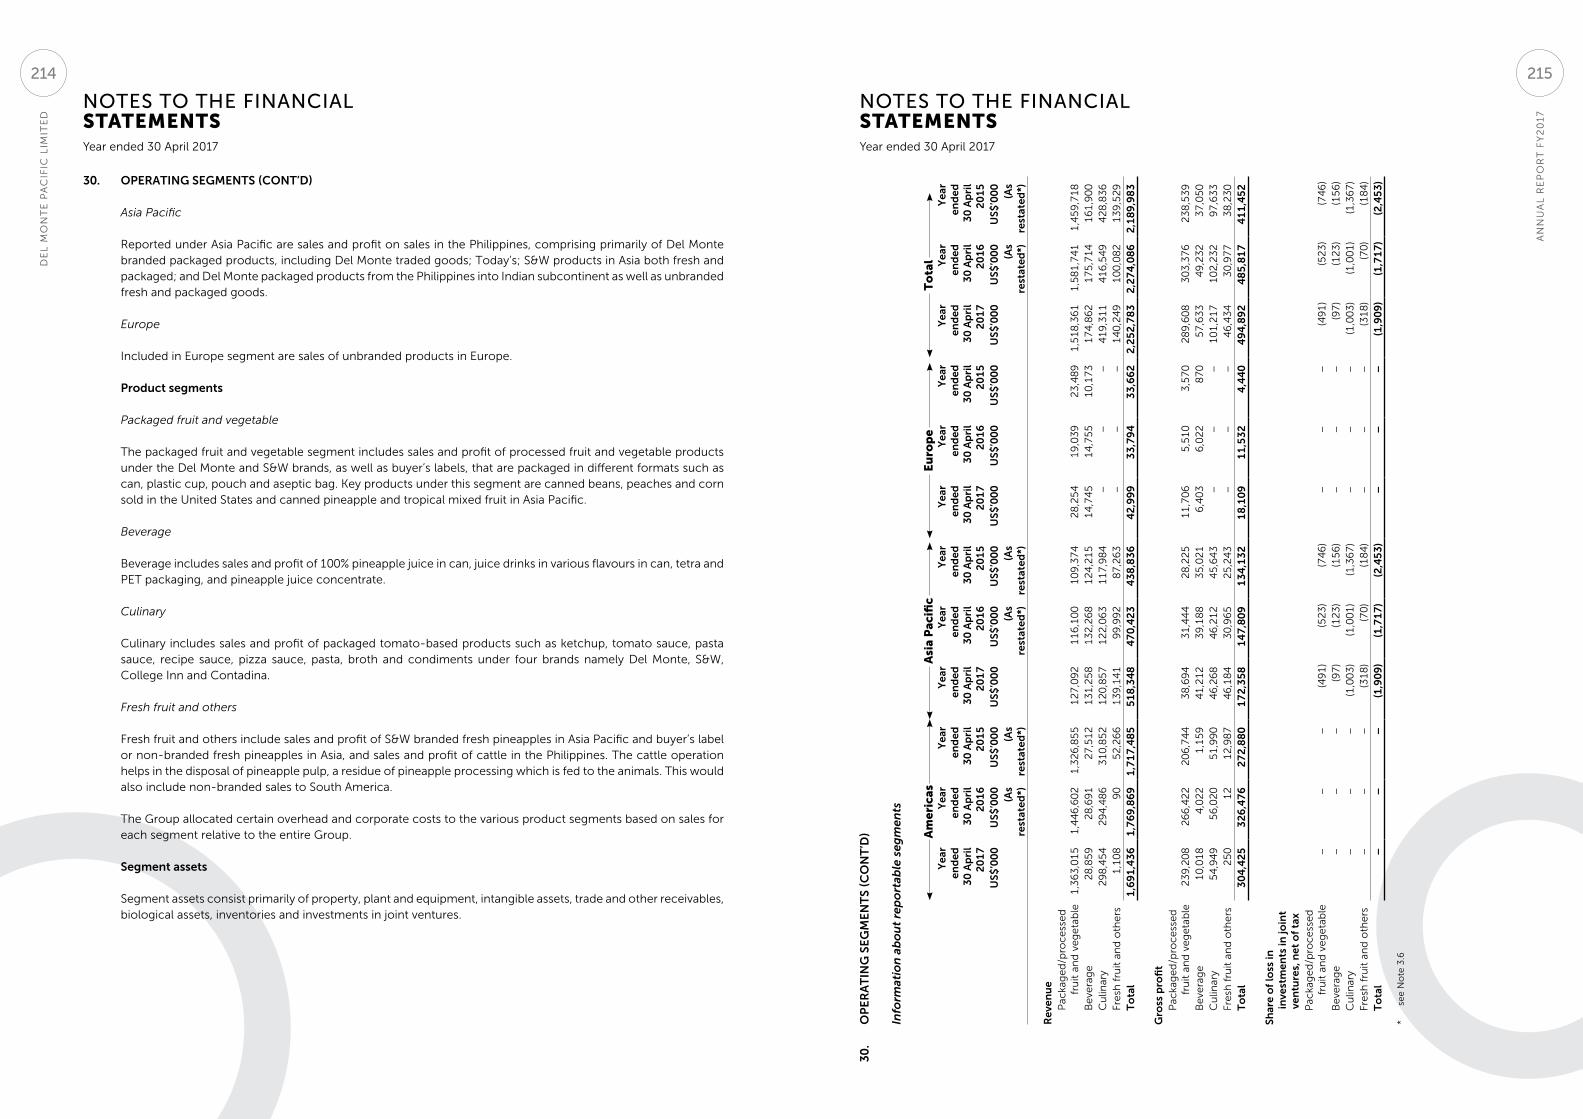
NOTES TO THE FINANCIAL STATEMENTS
NOTES TO THE FINANCIAL STATEMENTS
Year ended 30 April 2017 Year ended 30 April 2017
30. OPERATING SEGMENTS (CONT’D)
Asia Pacific
Reported under Asia Pacific are sales and profit on sales in the Philippines, comprising primarily of Del Monte branded packaged products, including Del Monte traded goods; Today’s; S&W products in Asia both fresh and packaged; and Del Monte packaged products from the Philippines into Indian subcontinent as well as unbranded fresh and packaged goods.
Europe
Included in Europe segment are sales of unbranded products in Europe.
Product segments
Packaged fruit and vegetable
The packaged fruit and vegetable segment includes sales and profit of processed fruit and vegetable products under the Del Monte and S&W brands, as well as buyer’s labels, that are packaged in different formats such as can, plastic cup, pouch and aseptic bag. Key products under this segment are canned beans, peaches and corn sold in the United States and canned pineapple and tropical mixed fruit in Asia Pacific.
Beverage
Beverage includes sales and profit of 100% pineapple juice in can, juice drinks in various flavours in can, tetra and PET packaging, and pineapple juice concentrate.
Culinary
Culinary includes sales and profit of packaged tomato-based products such as ketchup, tomato sauce, pasta sauce, recipe sauce, pizza sauce, pasta, broth and condiments under four brands namely Del Monte, S&W, College Inn and Contadina.
Fresh fruit and others Fresh fruit and others include sales and profit of S&W branded fresh pineapples in Asia Pacific and buyer’s label or non-branded fresh pineapples in Asia, and sales and profit of cattle in the Philippines. The cattle operation helps in the disposal of pineapple pulp, a residue of pineapple processing which is fed to the animals. This would also include non-branded sales to South America.
The Group allocated certain overhead and corporate costs to the various product segments based on sales for each segment relative to the entire Group.
Segment assets
Segment assets consist primarily of property, plant and equipment, intangible assets, trade and other receivables, biological assets, inventories and investments in joint ventures.
30
. O
PE
RA
TIN
G S
EG
ME
NT
S (C
ON
T’D
)
Info
rmat
ion
ab
ou
t re
po
rtab
le s
egm
ents
Am
eric
as
Asi
a P
acifi
c E
uro
pe
To
tal
Yea
r en
ded
30
Ap
ril
20
17
Yea
r en
ded
30
Ap
ril
20
16
Yea
r en
ded
30
Ap
ril
20
15
Yea
r en
ded
30
Ap
ril
20
17
Yea
r en
ded
30
Ap
ril
20
16
Yea
r en
ded
30
Ap
ril
20
15
Yea
r en
ded
30
Ap
ril
20
17
Yea
r en
ded
30
Ap
ril
20
16
Yea
r en
ded
30
Ap
ril
20
15
Yea
r en
ded
30
Ap
ril
20
17
Yea
r en
ded
30
Ap
ril
20
16
Yea
r en
ded
30
Ap
ril
20
15
US$
’00
0U
S$’0
00
US$
’00
0U
S$’0
00
US$
’00
0U
S$’0
00
US$
’00
0U
S$’0
00
US$
’00
0U
S$’0
00
US$
’00
0U
S$’0
00
(As
rest
ated
*)(A
s re
stat
ed*)
(As
rest
ated
*)(A
s re
stat
ed*)
(As
rest
ated
*)(A
s re
stat
ed*)
Rev
enu
eP
acka
ge
d/p
roc
ess
ed
fr
uit
an
d v
eg
eta
ble
1,3
63
,01
5
1,4
46
,60
21
,32
6,8
55
12
7,0
92
1
16
,10
0
10
9,3
74
28
,25
4
19
,03
92
3,4
89
1,5
18
,36
1
1,5
81
,74
1
1,4
59
,71
8B
eve
rag
e
28
,85
9
28
,69
12
7,5
12
13
1,2
58
1
32
,26
8
12
4,2
15
14
,74
5
14
,75
51
0,1
73
17
4,8
62
1
75
,71
4
16
1,9
00
Cu
linar
y 2
98
,45
4
29
4,4
86
31
0,8
52
12
0,8
57
1
22
,06
3
11
7,9
84
––
– 4
19
,31
1
41
6,5
49
4
28
,83
6Fr
esh
fru
it a
nd
oth
ers
1
,10
8
90
52
,26
6 1
39
,14
1
99
,99
2
87
,26
3
––
– 1
40
,24
9
10
0,0
82
1
39
,52
9
To
tal
1,6
91
,43
6
1,7
69
,86
91
,71
7,4
85
51
8,3
48
4
70
,42
3
43
8,8
36
4
2,9
99
3
3,7
94
33
,66
2 2
,25
2,7
83
2
,27
4,0
86
2
,18
9,9
83
Gro
ss p
rofi
tP
acka
ge
d/p
roc
ess
ed
fr
uit
an
d v
eg
eta
ble
2
39
,20
8 2
66
,42
2
20
6,7
44
38
,69
4
31
,44
4
28
,22
5 1
1,7
06
5
,51
03
,57
0 2
89
,60
8
30
3,3
76
2
38
,53
9B
eve
rag
e 1
0,0
18
4
,02
2
1,1
59
41
,21
2
39
,18
8
35
,02
1 6
,40
3
6,0
22
87
0 5
7,6
33
4
9,2
32
3
7,0
50
Cu
linar
y 5
4,9
49
5
6,0
20
5
1,9
90
46
,26
8
46
,21
2
45
,64
3–
––
10
1,2
17
1
02
,23
2
97
,63
3Fr
esh
fru
it a
nd
oth
ers
25
0
12
1
2,9
87
46
,18
4
30
,96
5
25
,24
3
––
– 4
6,4
34
3
0,9
77
3
8,2
30
T
ota
l 3
04
,42
5
32
6,4
76
2
72
,88
0 1
72
,35
8
14
7,8
09
1
34
,13
2
18
,10
9
11
,53
24
,44
0 4
94
,89
2
48
5,8
17
4
11
,45
2
Shar
e o
f lo
ss in
in
vest
men
ts in
join
t ve
ntu
res,
net
of
tax
Pac
kag
ed
/pro
ce
sse
d
fru
it a
nd
ve
ge
tab
le–
––
(4
91
)(5
23
)(7
46
)–
––
(4
91
)(5
23
)(7
46
)B
eve
rag
e–
––
(9
7)
(12
3)
(15
6)
––
– (
97
)(1
23
)(1
56
)C
ulin
ary
––
– (
1,0
03
)(1
,00
1)
(1,3
67
)–
––
(1
,00
3)
(1,0
01
)(1
,36
7)
Fre
sh f
ruit
an
d o
the
rs–
––
(3
18
)(7
0)
(18
4)
––
– (
31
8)
(70
)(1
84
)T
ota
l–
––
(1,9
09
)(1
,71
7)
(2,4
53
)–
––
(1,9
09
)(1
,71
7)
(2,4
53
)
*
see
No
te 3
.6
AN
NU
AL
RE
PO
RT
FY
20
17
DE
L M
ON
TE
PA
CIF
IC L
IMIT
ED
215214

NOTES TO THE FINANCIAL STATEMENTS
NOTES TO THE FINANCIAL STATEMENTS
Year ended 30 April 2017 Year ended 30 April 2017
30
. O
PE
RA
TIN
G S
EG
ME
NT
S (C
ON
T’D
)
Info
rmat
ion
ab
ou
t re
po
rtab
le s
egm
ents
Am
eric
as
Asi
a P
acifi
c E
uro
pe
To
tal
Yea
r en
ded
30
Ap
ril
20
17
Yea
r en
ded
30
Ap
ril
20
16
Yea
r en
ded
30
Ap
ril
20
15
Yea
r en
ded
30
Ap
ril
20
17
Yea
r en
ded
30
Ap
ril
20
16
Yea
r en
ded
30
Ap
ril
20
15
Yea
r en
ded
30
Ap
ril
20
17
Yea
r en
ded
30
Ap
ril
20
16
Yea
r en
ded
30
Ap
ril
20
15
Yea
r en
ded
30
Ap
ril
20
17
Yea
r en
ded
30
Ap
ril
20
16
Yea
r en
ded
30
Ap
ril
20
15
U
S$’0
00
US$
’00
0U
S$’0
00
US$
’00
0U
S$’0
00
US$
’00
0U
S$’0
00
US$
’00
0U
S$’0
00
US$
’00
0U
S$’0
00
US$
’00
0(A
s re
stat
ed*)
(As
rest
ated
*)(A
s re
stat
ed*)
(As
rest
ated
*)(A
s re
stat
ed*)
(As
rest
ated
*)(A
s re
stat
ed*)
(As
rest
ated
*)
Pro
fit
(lo
ss) b
efo
re
taxa
tio
nP
acka
ge
d/p
roc
ess
ed
fr
uit
an
d v
eg
eta
ble
(5
5,3
62
)9
,50
1(6
9,3
83
) 1
7,6
17
1
0,8
28
8,7
37
8,2
65
3
,02
09
(2
9,4
80
)2
3,3
49
(60
,63
7)
Be
vera
ge
1,0
21
(1
,79
5)
(4,7
57
) 1
3,7
52
1
1,5
77
10
,10
3–
4,3
47
(63
5)
14
,77
3
14
,12
94
,71
1C
ulin
ary
(1
3,0
95
)2
,23
3(2
6,2
56
) 1
7,9
15
1
9,1
71
20
,34
5 4
,78
1
––
9,6
01
2
1,4
04
(5,9
11
)Fr
esh
fru
it a
nd
oth
ers
2,7
90
(5
,44
0)
(8,8
03
) 2
2,7
58
1
5,4
77
1
0,0
30
–
––
25
,54
8
10
,03
7
1,2
27
T
ota
l(6
4,6
46
)4
,49
9(1
09
,19
9)
72
,04
2
57
,05
3
49
,21
5
13
,04
6
7,3
67
(62
6)
20
,44
2
68
,91
9
(60
,61
0)
Oth
er M
ater
ial N
on
-C
ash
Item
sD
ep
rec
iati
on
an
d
amo
rtis
atio
n4
7,2
78
56
,97
14
9,5
00
10
1,0
64
92
,34
79
9,4
54
––
–1
48
,34
21
49
,31
81
48
,95
4C
apit
al e
xpen
dit
ure
44
,59
14
2,8
23
57
,33
4
99
,53
29
4,4
07
86
,79
9–
––
14
4,1
23
13
7,2
30
14
4,1
33
Seg
men
t as
sets
2,2
28
,98
62
,24
3,5
08
2,1
37
,74
05
03
,17
74
44
,19
54
58
,80
72
4,9
83
18
,68
73
1,9
02
2,7
57
,14
62
,70
6,3
90
2,6
28
,44
9Se
gm
ent
liab
iliti
es1
,50
8,1
47
1,5
56
,30
01
,52
0,8
78
61
0,4
11
75
0,3
70
76
5,5
27
60
,03
32
2,7
43
11
,54
92
,17
8,5
91
2,3
29
,41
32
,29
7,9
54
*
see
No
te 3
.6
30. OPERATING SEGMENTS (CONT’D)
Reconciliation of reportable segment profit or loss, assets and capital expenditures
GroupYear ended
30 April 2017
Year ended 30 April
2016
Year ended 30 April
2015US$’000 US$’000 US$’000
(As restated*) (As restated*)
Profit (loss) before taxation per operating segment 20,442 68,919 (60,610)Unallocated amounts – acquisition related costs – – (3,008)Profit (loss) before taxation as reported 20,442 68,919 (63,618)
* see Note 3.6
Major customer
Revenues from a major customer of the Americas segment for the year ended 30 April 2017 amounted to approximately US$630.3 million or 28% (year ended 30 April 2016: US$585.0 million or 26%, year ended 30 April 2015: US$496.7 million or 23%) of the Group’s total revenue. The customer accounted for approximately 15% of trade and other receivables at 30 April 2017 (30 April 2016: 16%, 30 April 2015: 15%).
31. SEASONALITY OF OPERATIONS
The Group’s business is subject to seasonal fluctuations as a result of increased demand during the end of year festive season. For Americas, products are sold heavily during the Thanksgiving and Christmas seasons. As such, the Group’s sales are usually highest during the three months from August to October.
The Group operates 15 production facilities (30 April 2016: 16 production facilities) in the U.S., Mexico, Philippines and Venezuela. Fruit plants are located in California and Washington in the United States and Philippines, most of its vegetable plants are located in the U.S. Midwest and its tomato plants are located in California and Indiana.
The US Consumer Food Business has a seasonal production cycle that generally runs between the months of June and October. This seasonal production primarily relates to the majority of processed fruit, vegetable and tomato products, while some of its processed fruit and tomato products and its College Inn broth products are produced throughout the year. Additionally, the Consumer Food Business has contracts to co-pack certain processed fruit and vegetable products for other companies.
AN
NU
AL
RE
PO
RT
FY
20
17
DE
L M
ON
TE
PA
CIF
IC L
IMIT
ED
217216
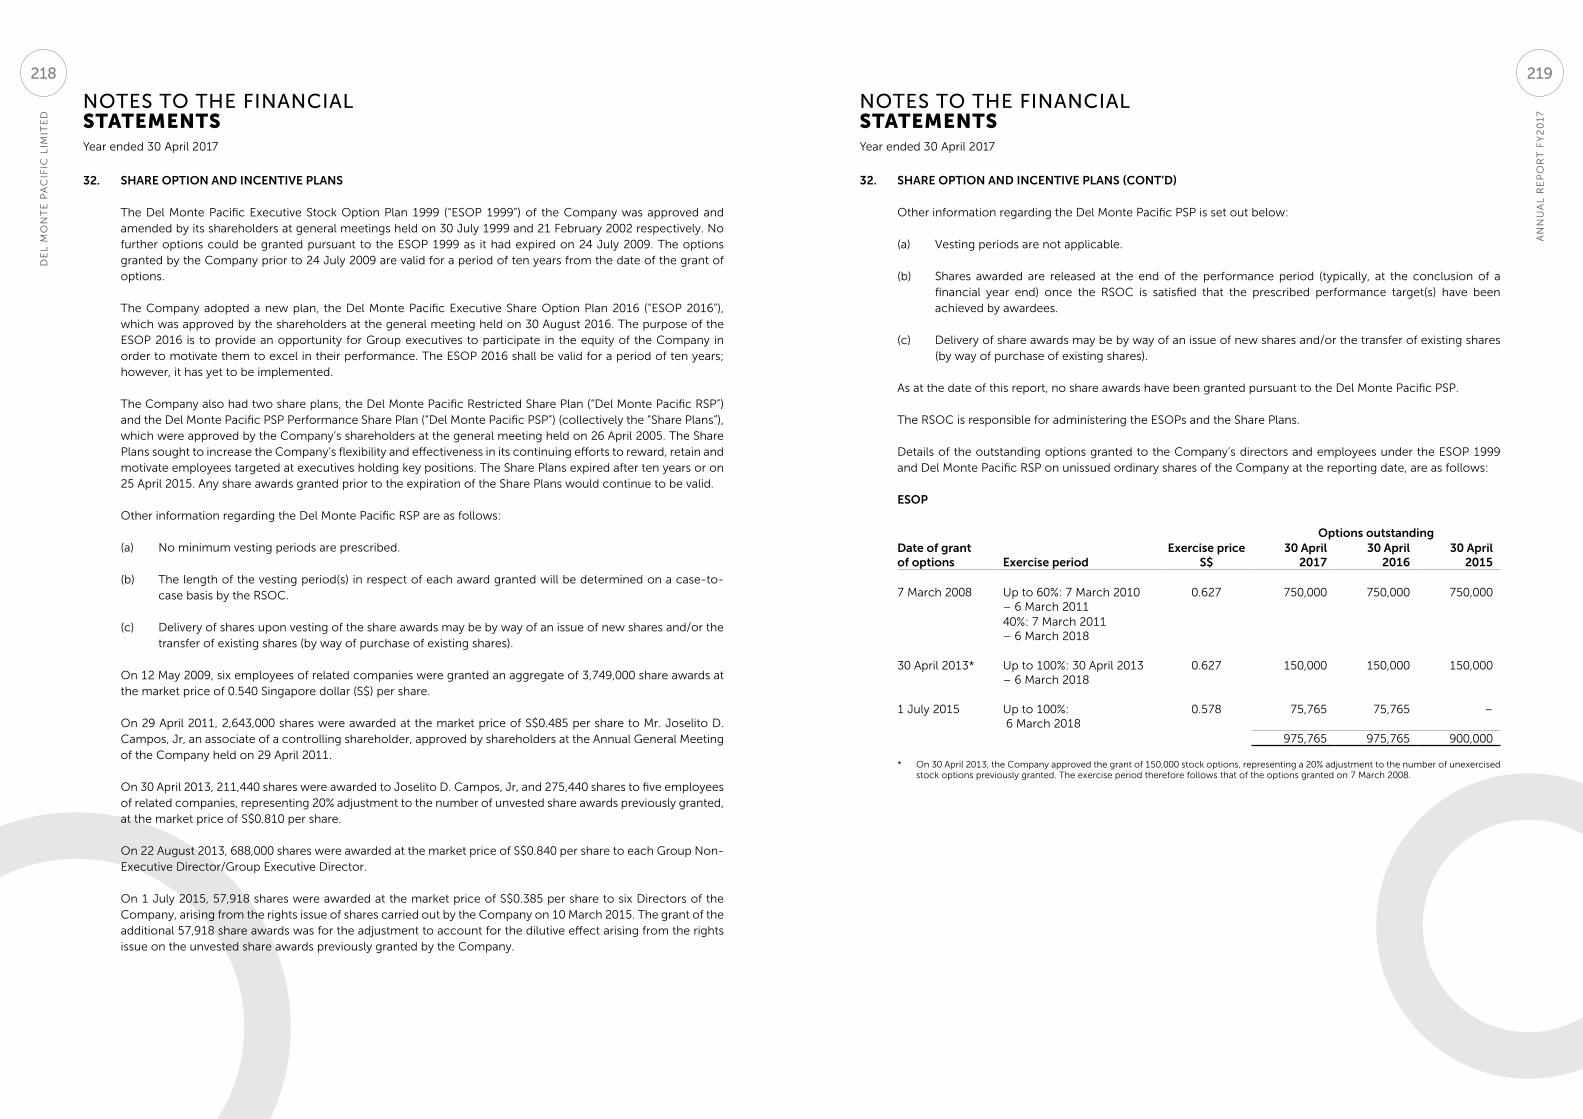
NOTES TO THE FINANCIAL STATEMENTS
NOTES TO THE FINANCIAL STATEMENTS
Year ended 30 April 2017 Year ended 30 April 2017
32. SHARE OPTION AND INCENTIVE PLANS
The Del Monte Pacific Executive Stock Option Plan 1999 (“ESOP 1999”) of the Company was approved and amended by its shareholders at general meetings held on 30 July 1999 and 21 February 2002 respectively. No further options could be granted pursuant to the ESOP 1999 as it had expired on 24 July 2009. The options granted by the Company prior to 24 July 2009 are valid for a period of ten years from the date of the grant of options.
The Company adopted a new plan, the Del Monte Pacific Executive Share Option Plan 2016 (“ESOP 2016”), which was approved by the shareholders at the general meeting held on 30 August 2016. The purpose of the ESOP 2016 is to provide an opportunity for Group executives to participate in the equity of the Company in order to motivate them to excel in their performance. The ESOP 2016 shall be valid for a period of ten years; however, it has yet to be implemented.
The Company also had two share plans, the Del Monte Pacific Restricted Share Plan (“Del Monte Pacific RSP”) and the Del Monte Pacific PSP Performance Share Plan (“Del Monte Pacific PSP”) (collectively the “Share Plans”), which were approved by the Company’s shareholders at the general meeting held on 26 April 2005. The Share Plans sought to increase the Company’s flexibility and effectiveness in its continuing efforts to reward, retain and motivate employees targeted at executives holding key positions. The Share Plans expired after ten years or on 25 April 2015. Any share awards granted prior to the expiration of the Share Plans would continue to be valid.
Other information regarding the Del Monte Pacific RSP are as follows:
(a) No minimum vesting periods are prescribed.
(b) The length of the vesting period(s) in respect of each award granted will be determined on a case-to-case basis by the RSOC.
(c) Delivery of shares upon vesting of the share awards may be by way of an issue of new shares and/or the transfer of existing shares (by way of purchase of existing shares).
On 12 May 2009, six employees of related companies were granted an aggregate of 3,749,000 share awards at the market price of 0.540 Singapore dollar (S$) per share.
On 29 April 2011, 2,643,000 shares were awarded at the market price of S$0.485 per share to Mr. Joselito D. Campos, Jr, an associate of a controlling shareholder, approved by shareholders at the Annual General Meeting of the Company held on 29 April 2011.
On 30 April 2013, 211,440 shares were awarded to Joselito D. Campos, Jr, and 275,440 shares to five employees of related companies, representing 20% adjustment to the number of unvested share awards previously granted, at the market price of S$0.810 per share.
On 22 August 2013, 688,000 shares were awarded at the market price of S$0.840 per share to each Group Non-Executive Director/Group Executive Director.
On 1 July 2015, 57,918 shares were awarded at the market price of S$0.385 per share to six Directors of the Company, arising from the rights issue of shares carried out by the Company on 10 March 2015. The grant of the additional 57,918 share awards was for the adjustment to account for the dilutive effect arising from the rights issue on the unvested share awards previously granted by the Company.
32. SHARE OPTION AND INCENTIVE PLANS (CONT’D)
Other information regarding the Del Monte Pacific PSP is set out below:
(a) Vesting periods are not applicable.
(b) Shares awarded are released at the end of the performance period (typically, at the conclusion of a financial year end) once the RSOC is satisfied that the prescribed performance target(s) have been achieved by awardees.
(c) Delivery of share awards may be by way of an issue of new shares and/or the transfer of existing shares (by way of purchase of existing shares).
As at the date of this report, no share awards have been granted pursuant to the Del Monte Pacific PSP.
The RSOC is responsible for administering the ESOPs and the Share Plans.
Details of the outstanding options granted to the Company’s directors and employees under the ESOP 1999 and Del Monte Pacific RSP on unissued ordinary shares of the Company at the reporting date, are as follows:
ESOP
Date of grantof options Exercise period
Exercise priceS$
Options outstanding30 April
201730 April
201630 April
2015
7 March 2008 Up to 60%: 7 March 2010 – 6 March 2011
0.627 750,000 750,000 750,000
40%: 7 March 2011 – 6 March 2018
30 April 2013* Up to 100%: 30 April 2013 – 6 March 2018
0.627 150,000 150,000 150,000
1 July 2015 Up to 100%: 6 March 2018
0.578 75,765 75,765 –
975,765 975,765 900,000
* On 30 April 2013, the Company approved the grant of 150,000 stock options, representing a 20% adjustment to the number of unexercised stock options previously granted. The exercise period therefore follows that of the options granted on 7 March 2008.
AN
NU
AL
RE
PO
RT
FY
20
17
DE
L M
ON
TE
PA
CIF
IC L
IMIT
ED
219218
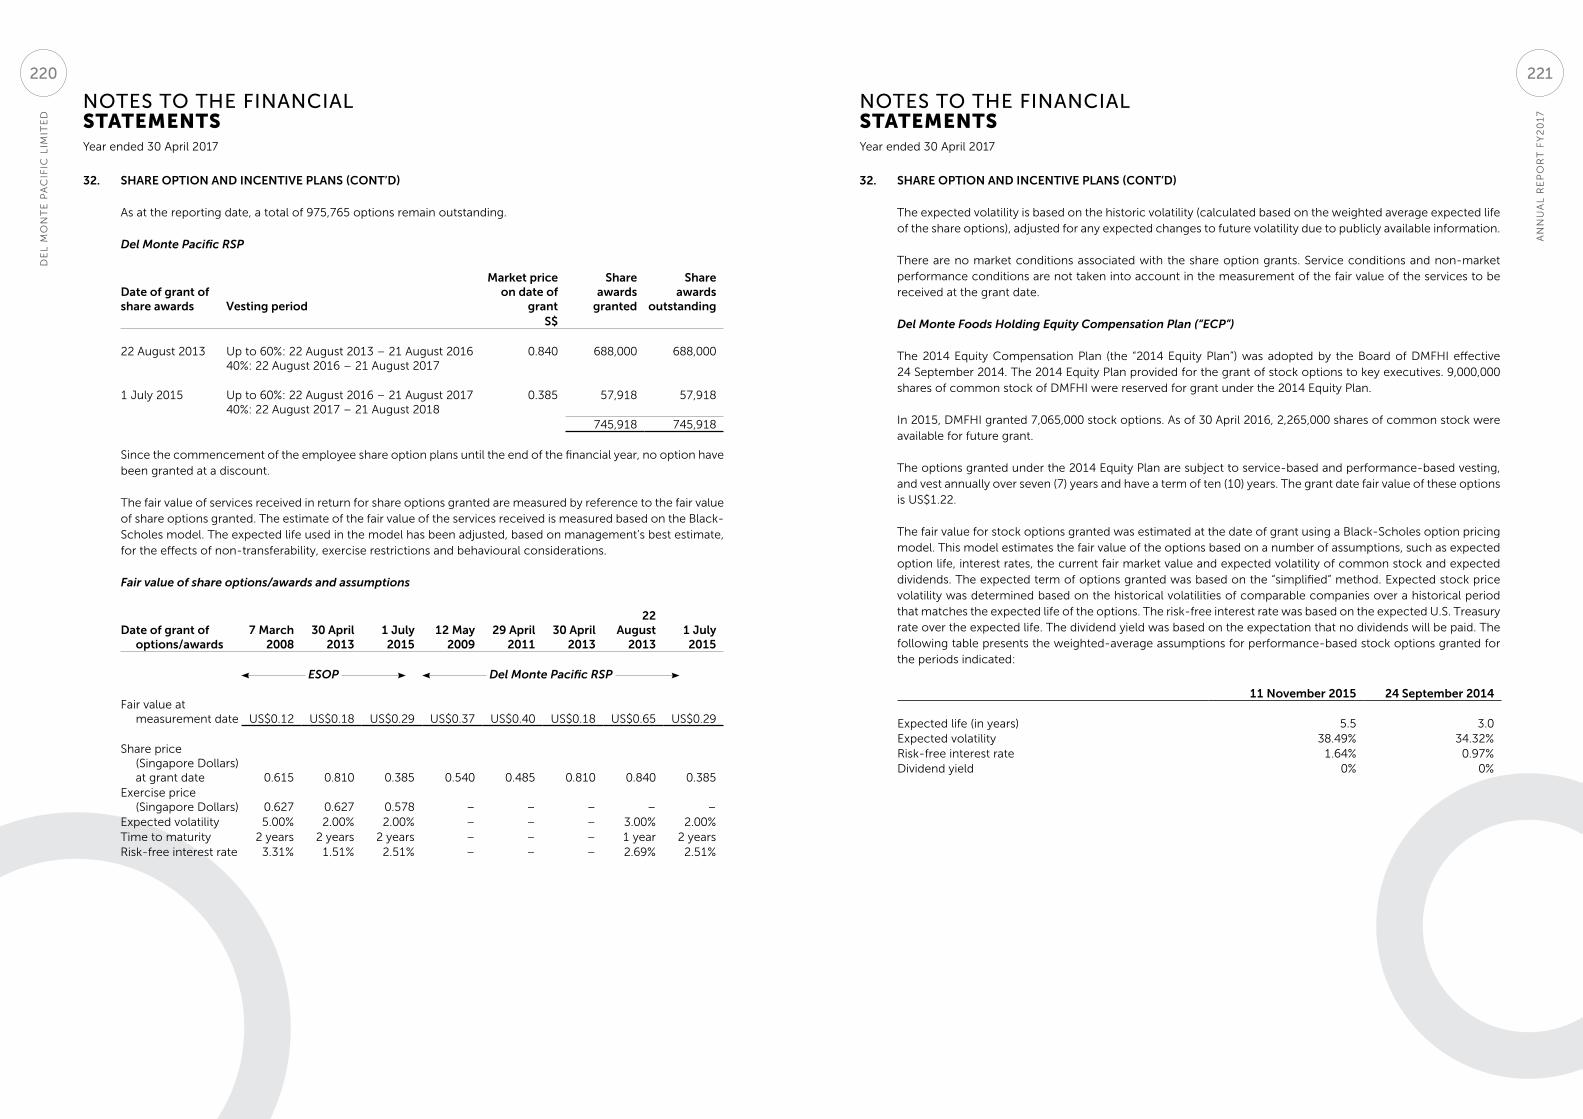
NOTES TO THE FINANCIAL STATEMENTS
NOTES TO THE FINANCIAL STATEMENTS
Year ended 30 April 2017 Year ended 30 April 2017
32. SHARE OPTION AND INCENTIVE PLANS (CONT’D)
As at the reporting date, a total of 975,765 options remain outstanding.
Del Monte Pacific RSP
Date of grant ofshare awards Vesting period
Market priceon date of
grant
Share awards
granted
Share awards
outstandingS$
22 August 2013 Up to 60%: 22 August 2013 – 21 August 201640%: 22 August 2016 – 21 August 2017
0.840 688,000 688,000
1 July 2015 Up to 60%: 22 August 2016 – 21 August 201740%: 22 August 2017 – 21 August 2018
0.385 57,918 57,918
745,918 745,918
Since the commencement of the employee share option plans until the end of the financial year, no option have been granted at a discount.
The fair value of services received in return for share options granted are measured by reference to the fair value of share options granted. The estimate of the fair value of the services received is measured based on the Black-Scholes model. The expected life used in the model has been adjusted, based on management’s best estimate, for the effects of non-transferability, exercise restrictions and behavioural considerations.
Fair value of share options/awards and assumptions
Date of grant of options/awards
7 March2008
30 April 2013
1 July 2015
12 May 2009
29 April 2011
30 April 2013
22 August
20131 July 2015
ESOP Del Monte Pacific RSP
Fair value at measurement date US$0.12 US$0.18 US$0.29 US$0.37 US$0.40 US$0.18 US$0.65 US$0.29
Share price (Singapore Dollars) at grant date 0.615 0.810 0.385 0.540 0.485 0.810 0.840 0.385
Exercise price (Singapore Dollars) 0.627 0.627 0.578 – – – – –
Expected volatility 5.00% 2.00% 2.00% – – – 3.00% 2.00%Time to maturity 2 years 2 years 2 years – – – 1 year 2 yearsRisk-free interest rate 3.31% 1.51% 2.51% – – – 2.69% 2.51%
32. SHARE OPTION AND INCENTIVE PLANS (CONT’D)
The expected volatility is based on the historic volatility (calculated based on the weighted average expected life of the share options), adjusted for any expected changes to future volatility due to publicly available information.
There are no market conditions associated with the share option grants. Service conditions and non-market performance conditions are not taken into account in the measurement of the fair value of the services to be received at the grant date.
Del Monte Foods Holding Equity Compensation Plan (“ECP”)
The 2014 Equity Compensation Plan (the “2014 Equity Plan”) was adopted by the Board of DMFHI effective 24 September 2014. The 2014 Equity Plan provided for the grant of stock options to key executives. 9,000,000 shares of common stock of DMFHI were reserved for grant under the 2014 Equity Plan.
In 2015, DMFHI granted 7,065,000 stock options. As of 30 April 2016, 2,265,000 shares of common stock were available for future grant.
The options granted under the 2014 Equity Plan are subject to service-based and performance-based vesting, and vest annually over seven (7) years and have a term of ten (10) years. The grant date fair value of these options is US$1.22.
The fair value for stock options granted was estimated at the date of grant using a Black-Scholes option pricing model. This model estimates the fair value of the options based on a number of assumptions, such as expected option life, interest rates, the current fair market value and expected volatility of common stock and expected dividends. The expected term of options granted was based on the “simplified” method. Expected stock price volatility was determined based on the historical volatilities of comparable companies over a historical period that matches the expected life of the options. The risk-free interest rate was based on the expected U.S. Treasury rate over the expected life. The dividend yield was based on the expectation that no dividends will be paid. The following table presents the weighted-average assumptions for performance-based stock options granted for the periods indicated:
11 November 2015 24 September 2014
Expected life (in years) 5.5 3.0Expected volatility 38.49% 34.32%Risk-free interest rate 1.64% 0.97%Dividend yield 0% 0%
AN
NU
AL
RE
PO
RT
FY
20
17
DE
L M
ON
TE
PA
CIF
IC L
IMIT
ED
221220
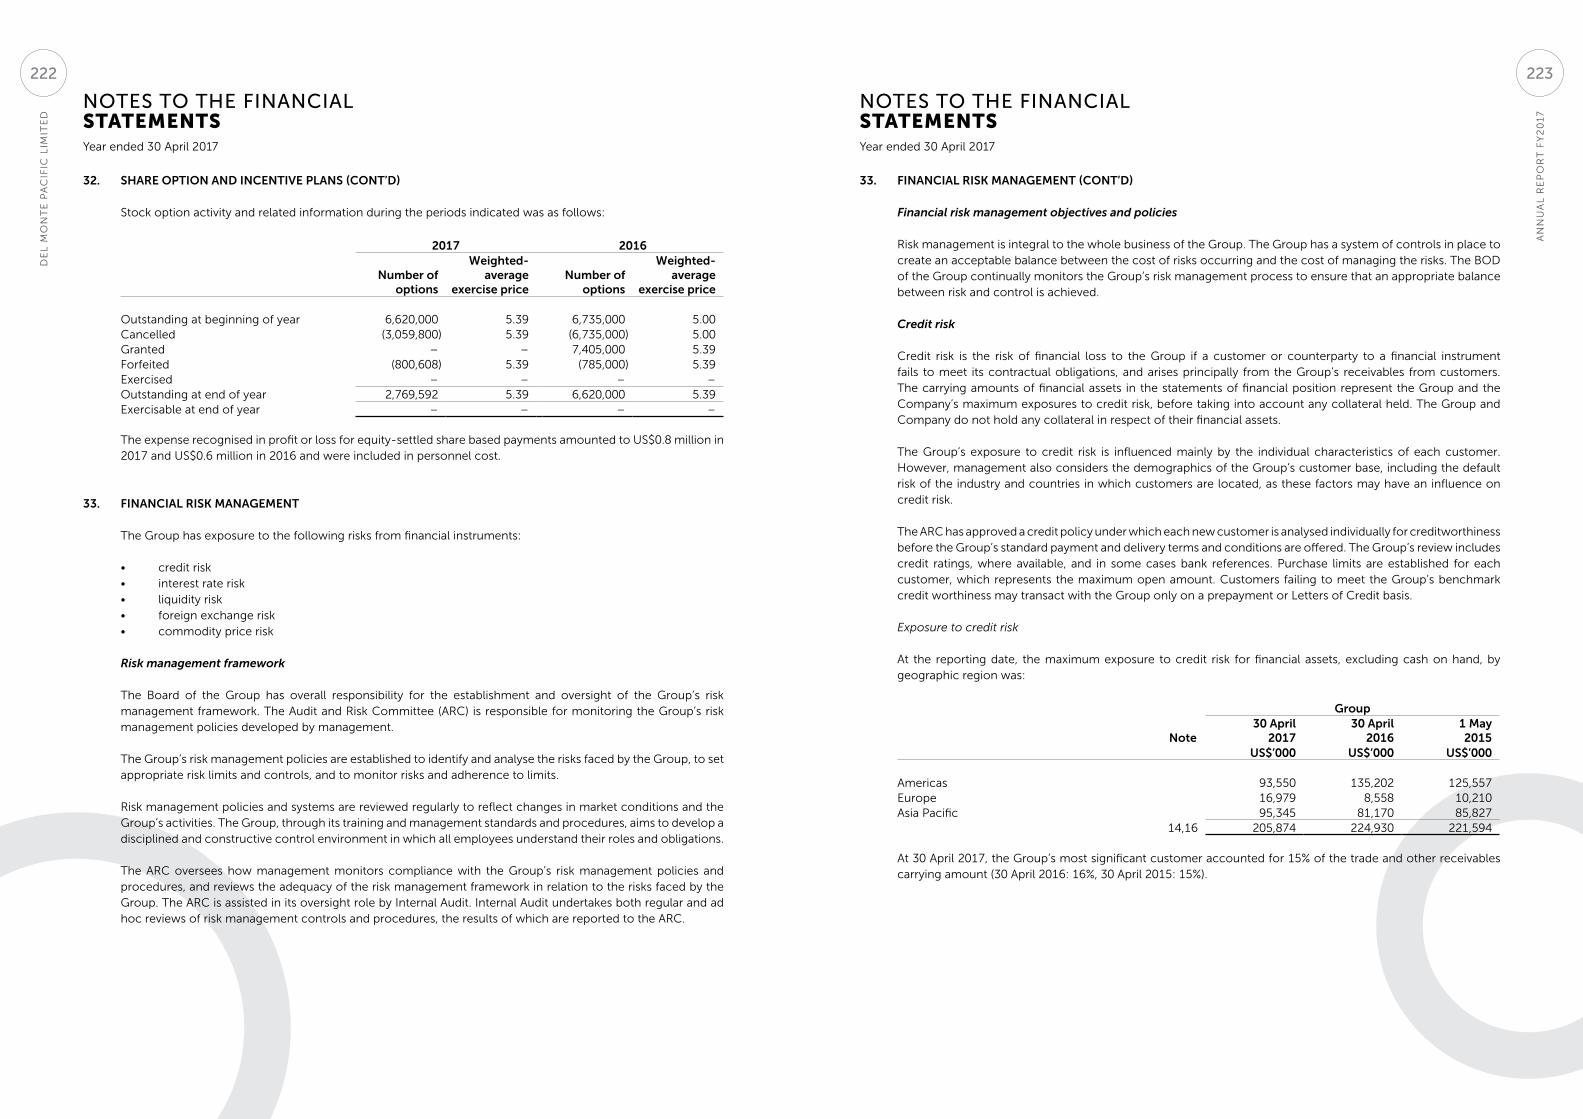
NOTES TO THE FINANCIAL STATEMENTS
NOTES TO THE FINANCIAL STATEMENTS
Year ended 30 April 2017 Year ended 30 April 2017
32. SHARE OPTION AND INCENTIVE PLANS (CONT’D)
Stock option activity and related information during the periods indicated was as follows:
2017 2016
Number of options
Weighted-average
exercise priceNumber of
options
Weighted-average
exercise price
Outstanding at beginning of year 6,620,000 5.39 6,735,000 5.00Cancelled (3,059,800) 5.39 (6,735,000) 5.00Granted – – 7,405,000 5.39Forfeited (800,608) 5.39 (785,000) 5.39Exercised – – – –Outstanding at end of year 2,769,592 5.39 6,620,000 5.39Exercisable at end of year – – – –
The expense recognised in profit or loss for equity-settled share based payments amounted to US$0.8 million in 2017 and US$0.6 million in 2016 and were included in personnel cost.
33. FINANCIAL RISK MANAGEMENT
The Group has exposure to the following risks from financial instruments:
• credit risk• interest rate risk• liquidity risk• foreign exchange risk• commodity price risk
Risk management framework
The Board of the Group has overall responsibility for the establishment and oversight of the Group’s risk management framework. The Audit and Risk Committee (ARC) is responsible for monitoring the Group’s risk management policies developed by management.
The Group’s risk management policies are established to identify and analyse the risks faced by the Group, to set appropriate risk limits and controls, and to monitor risks and adherence to limits.
Risk management policies and systems are reviewed regularly to reflect changes in market conditions and the Group’s activities. The Group, through its training and management standards and procedures, aims to develop a disciplined and constructive control environment in which all employees understand their roles and obligations.
The ARC oversees how management monitors compliance with the Group’s risk management policies and procedures, and reviews the adequacy of the risk management framework in relation to the risks faced by the Group. The ARC is assisted in its oversight role by Internal Audit. Internal Audit undertakes both regular and ad hoc reviews of risk management controls and procedures, the results of which are reported to the ARC.
33. FINANCIAL RISK MANAGEMENT (CONT’D)
Financial risk management objectives and policies
Risk management is integral to the whole business of the Group. The Group has a system of controls in place to create an acceptable balance between the cost of risks occurring and the cost of managing the risks. The BOD of the Group continually monitors the Group’s risk management process to ensure that an appropriate balance between risk and control is achieved.
Credit risk
Credit risk is the risk of financial loss to the Group if a customer or counterparty to a financial instrument fails to meet its contractual obligations, and arises principally from the Group’s receivables from customers. The carrying amounts of financial assets in the statements of financial position represent the Group and the Company’s maximum exposures to credit risk, before taking into account any collateral held. The Group and Company do not hold any collateral in respect of their financial assets.
The Group’s exposure to credit risk is influenced mainly by the individual characteristics of each customer. However, management also considers the demographics of the Group’s customer base, including the default risk of the industry and countries in which customers are located, as these factors may have an influence on credit risk.
The ARC has approved a credit policy under which each new customer is analysed individually for creditworthiness before the Group’s standard payment and delivery terms and conditions are offered. The Group’s review includes credit ratings, where available, and in some cases bank references. Purchase limits are established for each customer, which represents the maximum open amount. Customers failing to meet the Group’s benchmark credit worthiness may transact with the Group only on a prepayment or Letters of Credit basis.
Exposure to credit risk
At the reporting date, the maximum exposure to credit risk for financial assets, excluding cash on hand, by geographic region was:
Group
Note30 April
201730 April
20161 May2015
US$’000 US$’000 US$’000
Americas 93,550 135,202 125,557Europe 16,979 8,558 10,210Asia Pacific 95,345 81,170 85,827
14,16 205,874 224,930 221,594
At 30 April 2017, the Group’s most significant customer accounted for 15% of the trade and other receivables carrying amount (30 April 2016: 16%, 30 April 2015: 15%).
AN
NU
AL
RE
PO
RT
FY
20
17
DE
L M
ON
TE
PA
CIF
IC L
IMIT
ED
223222
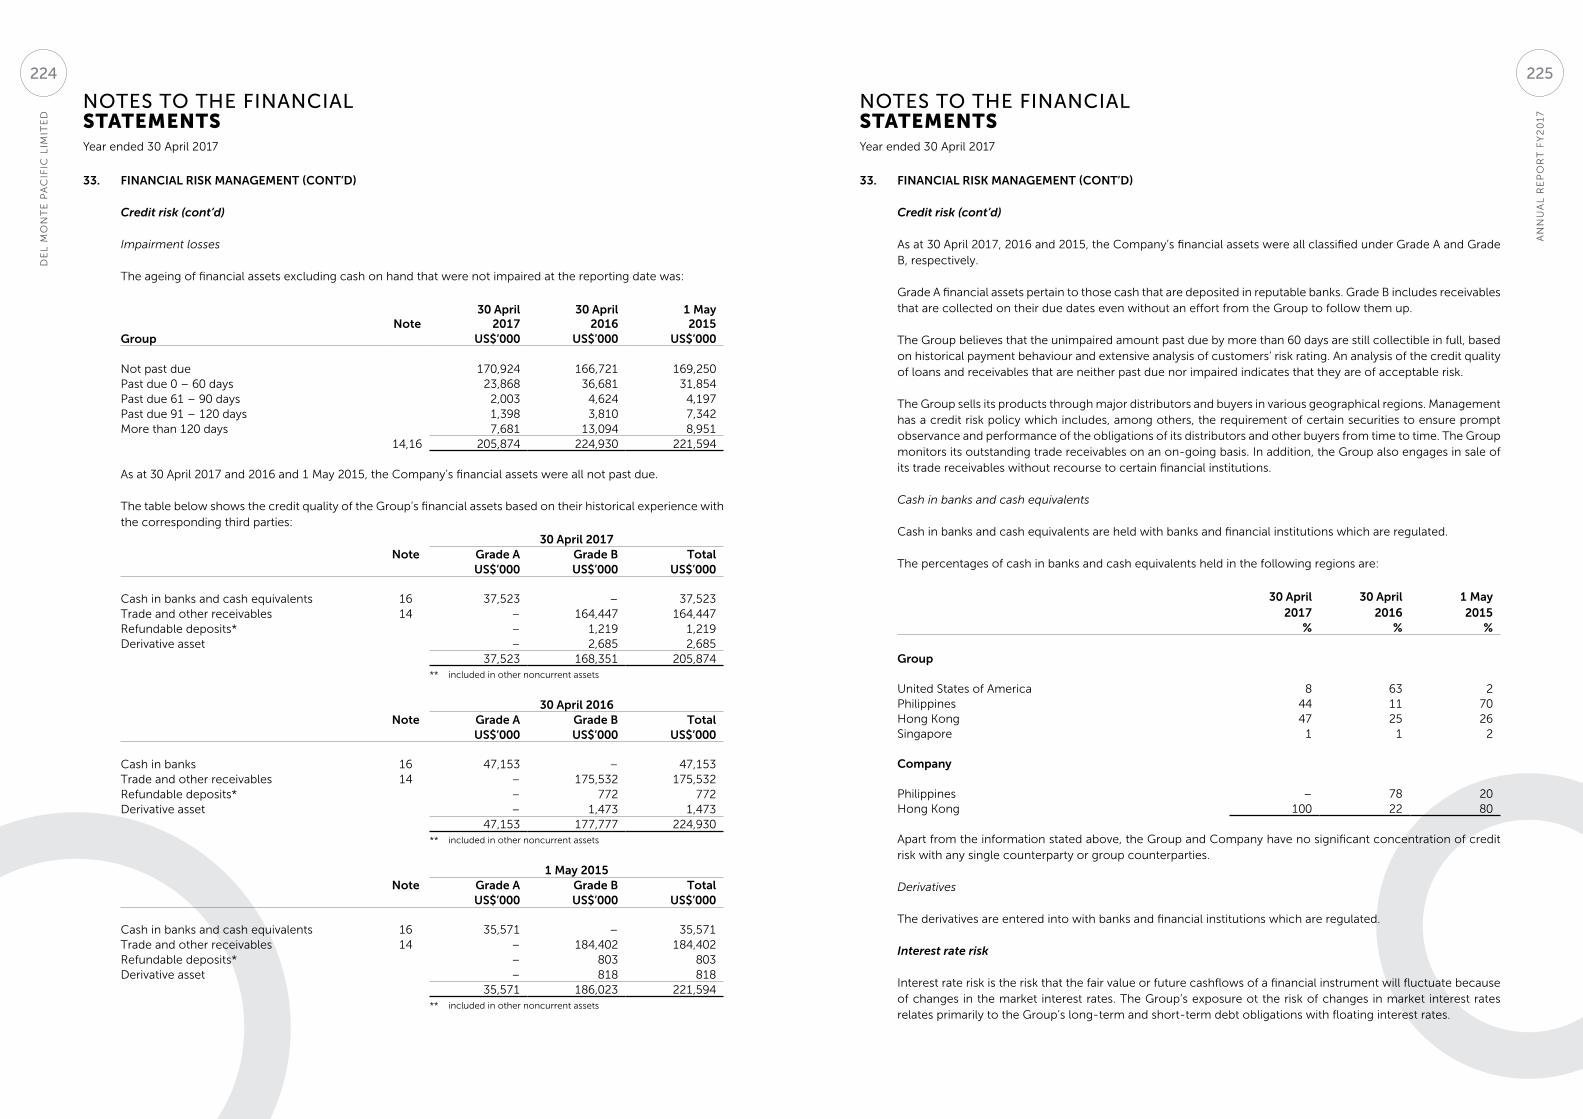
NOTES TO THE FINANCIAL STATEMENTS
NOTES TO THE FINANCIAL STATEMENTS
Year ended 30 April 2017 Year ended 30 April 2017
33. FINANCIAL RISK MANAGEMENT (CONT’D)
Credit risk (cont’d)
Impairment losses
The ageing of financial assets excluding cash on hand that were not impaired at the reporting date was:
Note30 April
201730 April
20161 May2015
Group US$’000 US$’000 US$’000
Not past due 170,924 166,721 169,250Past due 0 – 60 days 23,868 36,681 31,854Past due 61 – 90 days 2,003 4,624 4,197Past due 91 – 120 days 1,398 3,810 7,342More than 120 days 7,681 13,094 8,951
14,16 205,874 224,930 221,594
As at 30 April 2017 and 2016 and 1 May 2015, the Company’s financial assets were all not past due.
The table below shows the credit quality of the Group’s financial assets based on their historical experience with the corresponding third parties:
30 April 2017Note Grade A Grade B Total
US$’000 US$’000 US$’000
Cash in banks and cash equivalents 16 37,523 – 37,523Trade and other receivables 14 – 164,447 164,447Refundable deposits* – 1,219 1,219Derivative asset – 2,685 2,685
37,523 168,351 205,874** included in other noncurrent assets
30 April 2016Note Grade A Grade B Total
US$’000 US$’000 US$’000
Cash in banks 16 47,153 – 47,153Trade and other receivables 14 – 175,532 175,532Refundable deposits* – 772 772Derivative asset – 1,473 1,473
47,153 177,777 224,930** included in other noncurrent assets
1 May 2015Note Grade A Grade B Total
US$’000 US$’000 US$’000
Cash in banks and cash equivalents 16 35,571 – 35,571Trade and other receivables 14 – 184,402 184,402Refundable deposits* – 803 803Derivative asset – 818 818
35,571 186,023 221,594** included in other noncurrent assets
33. FINANCIAL RISK MANAGEMENT (CONT’D)
Credit risk (cont’d)
As at 30 April 2017, 2016 and 2015, the Company’s financial assets were all classified under Grade A and Grade B, respectively.
Grade A financial assets pertain to those cash that are deposited in reputable banks. Grade B includes receivables that are collected on their due dates even without an effort from the Group to follow them up.
The Group believes that the unimpaired amount past due by more than 60 days are still collectible in full, based on historical payment behaviour and extensive analysis of customers’ risk rating. An analysis of the credit quality of loans and receivables that are neither past due nor impaired indicates that they are of acceptable risk.
The Group sells its products through major distributors and buyers in various geographical regions. Management has a credit risk policy which includes, among others, the requirement of certain securities to ensure prompt observance and performance of the obligations of its distributors and other buyers from time to time. The Group monitors its outstanding trade receivables on an on-going basis. In addition, the Group also engages in sale of its trade receivables without recourse to certain financial institutions.
Cash in banks and cash equivalents
Cash in banks and cash equivalents are held with banks and financial institutions which are regulated.
The percentages of cash in banks and cash equivalents held in the following regions are:
30 April2017
30 April2016
1 May2015
% % %
Group
United States of America 8 63 2Philippines 44 11 70Hong Kong 47 25 26Singapore 1 1 2
Company
Philippines – 78 20Hong Kong 100 22 80
Apart from the information stated above, the Group and Company have no significant concentration of credit risk with any single counterparty or group counterparties.
Derivatives
The derivatives are entered into with banks and financial institutions which are regulated.
Interest rate risk
Interest rate risk is the risk that the fair value or future cashflows of a financial instrument will fluctuate because of changes in the market interest rates. The Group’s exposure ot the risk of changes in market interest rates relates primarily to the Group’s long-term and short-term debt obligations with floating interest rates.
AN
NU
AL
RE
PO
RT
FY
20
17
DE
L M
ON
TE
PA
CIF
IC L
IMIT
ED
225224
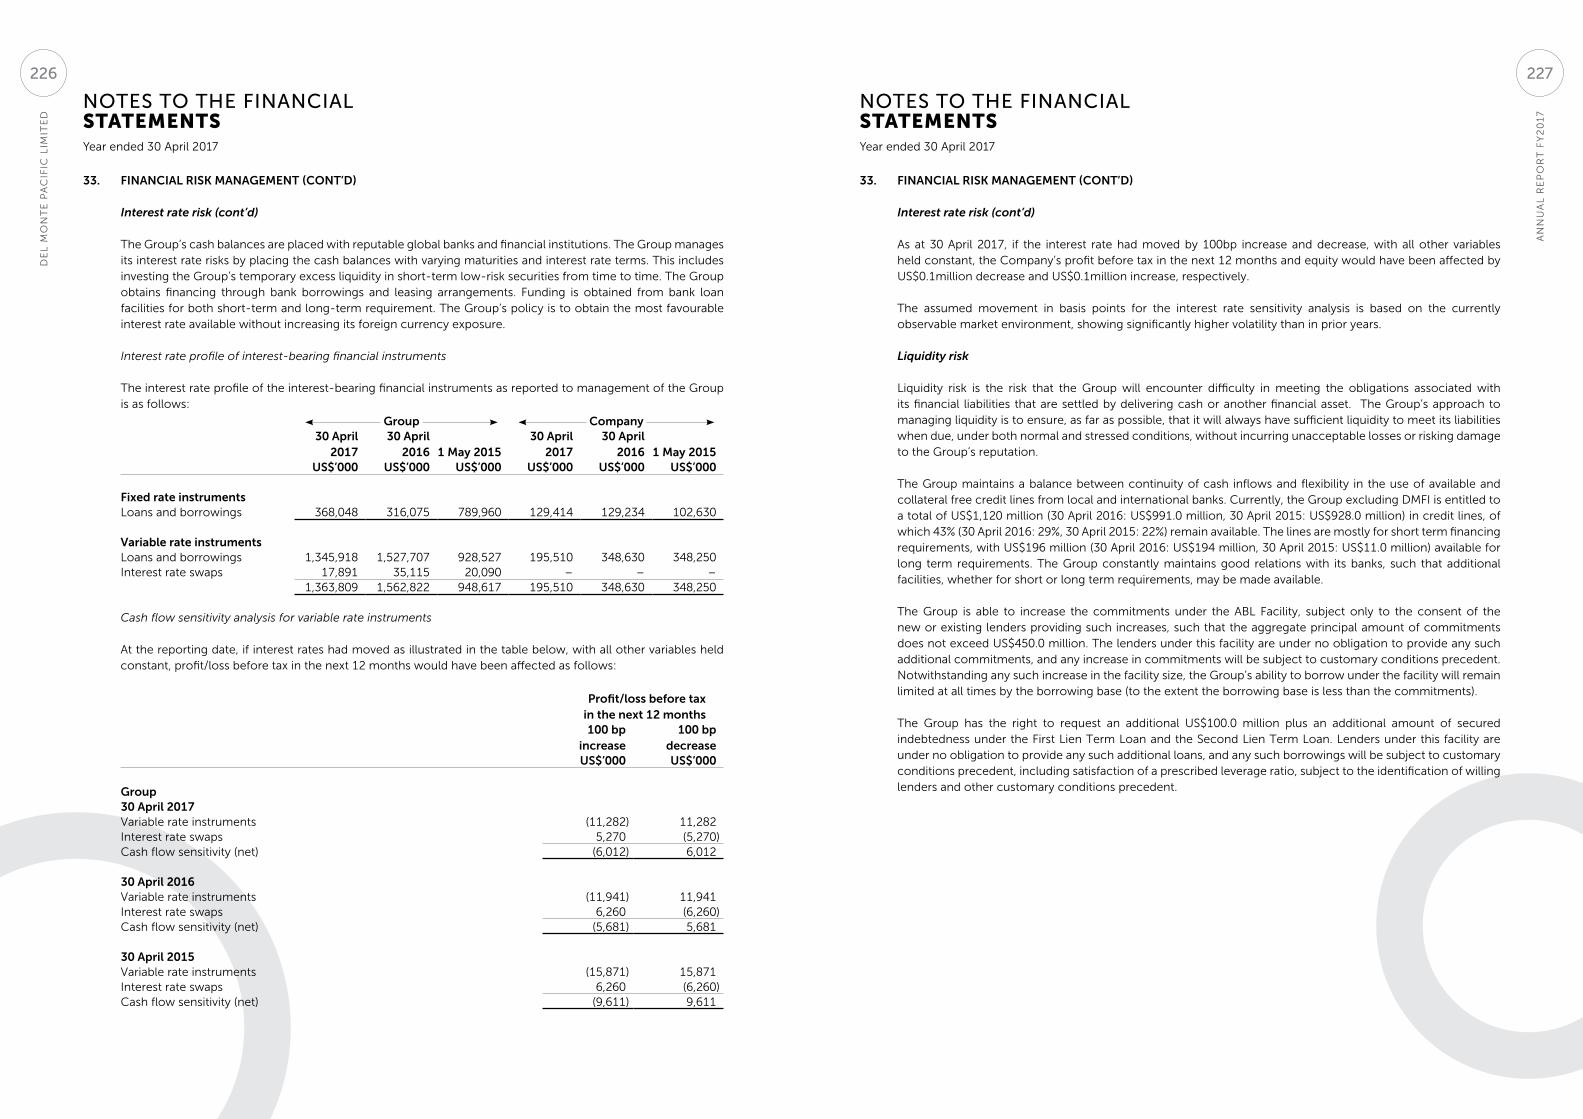
NOTES TO THE FINANCIAL STATEMENTS
NOTES TO THE FINANCIAL STATEMENTS
Year ended 30 April 2017 Year ended 30 April 2017
33. FINANCIAL RISK MANAGEMENT (CONT’D)
Interest rate risk (cont’d)
The Group’s cash balances are placed with reputable global banks and financial institutions. The Group manages its interest rate risks by placing the cash balances with varying maturities and interest rate terms. This includes investing the Group’s temporary excess liquidity in short-term low-risk securities from time to time. The Group obtains financing through bank borrowings and leasing arrangements. Funding is obtained from bank loan facilities for both short-term and long-term requirement. The Group’s policy is to obtain the most favourable interest rate available without increasing its foreign currency exposure.
Interest rate profile of interest-bearing financial instruments
The interest rate profile of the interest-bearing financial instruments as reported to management of the Group is as follows:
Group Company 30 April
201730 April
2016 1 May 201530 April
201730 April
2016 1 May 2015US$’000 US$’000 US$’000 US$’000 US$’000 US$’000
Fixed rate instrumentsLoans and borrowings 368,048 316,075 789,960 129,414 129,234 102,630
Variable rate instrumentsLoans and borrowings 1,345,918 1,527,707 928,527 195,510 348,630 348,250Interest rate swaps 17,891 35,115 20,090 – – –
1,363,809 1,562,822 948,617 195,510 348,630 348,250
Cash flow sensitivity analysis for variable rate instruments
At the reporting date, if interest rates had moved as illustrated in the table below, with all other variables held constant, profit/loss before tax in the next 12 months would have been affected as follows:
Profit/loss before tax in the next 12 months100 bp
increase100 bp
decreaseUS$’000 US$’000
Group30 April 2017Variable rate instruments (11,282) 11,282Interest rate swaps 5,270 (5,270)Cash flow sensitivity (net) (6,012) 6,012
30 April 2016Variable rate instruments (11,941) 11,941Interest rate swaps 6,260 (6,260)Cash flow sensitivity (net) (5,681) 5,681
30 April 2015Variable rate instruments (15,871) 15,871Interest rate swaps 6,260 (6,260)Cash flow sensitivity (net) (9,611) 9,611
33. FINANCIAL RISK MANAGEMENT (CONT’D)
Interest rate risk (cont’d)
As at 30 April 2017, if the interest rate had moved by 100bp increase and decrease, with all other variables held constant, the Company’s profit before tax in the next 12 months and equity would have been affected by US$0.1million decrease and US$0.1million increase, respectively.
The assumed movement in basis points for the interest rate sensitivity analysis is based on the currently observable market environment, showing significantly higher volatility than in prior years.
Liquidity risk
Liquidity risk is the risk that the Group will encounter difficulty in meeting the obligations associated with its financial liabilities that are settled by delivering cash or another financial asset. The Group’s approach to managing liquidity is to ensure, as far as possible, that it will always have sufficient liquidity to meet its liabilities when due, under both normal and stressed conditions, without incurring unacceptable losses or risking damage to the Group’s reputation.
The Group maintains a balance between continuity of cash inflows and flexibility in the use of available and collateral free credit lines from local and international banks. Currently, the Group excluding DMFI is entitled to a total of US$1,120 million (30 April 2016: US$991.0 million, 30 April 2015: US$928.0 million) in credit lines, of which 43% (30 April 2016: 29%, 30 April 2015: 22%) remain available. The lines are mostly for short term financing requirements, with US$196 million (30 April 2016: US$194 million, 30 April 2015: US$11.0 million) available for long term requirements. The Group constantly maintains good relations with its banks, such that additional facilities, whether for short or long term requirements, may be made available.
The Group is able to increase the commitments under the ABL Facility, subject only to the consent of the new or existing lenders providing such increases, such that the aggregate principal amount of commitments does not exceed US$450.0 million. The lenders under this facility are under no obligation to provide any such additional commitments, and any increase in commitments will be subject to customary conditions precedent. Notwithstanding any such increase in the facility size, the Group’s ability to borrow under the facility will remain limited at all times by the borrowing base (to the extent the borrowing base is less than the commitments).
The Group has the right to request an additional US$100.0 million plus an additional amount of secured indebtedness under the First Lien Term Loan and the Second Lien Term Loan. Lenders under this facility are under no obligation to provide any such additional loans, and any such borrowings will be subject to customary conditions precedent, including satisfaction of a prescribed leverage ratio, subject to the identification of willing lenders and other customary conditions precedent.
AN
NU
AL
RE
PO
RT
FY
20
17
DE
L M
ON
TE
PA
CIF
IC L
IMIT
ED
227226
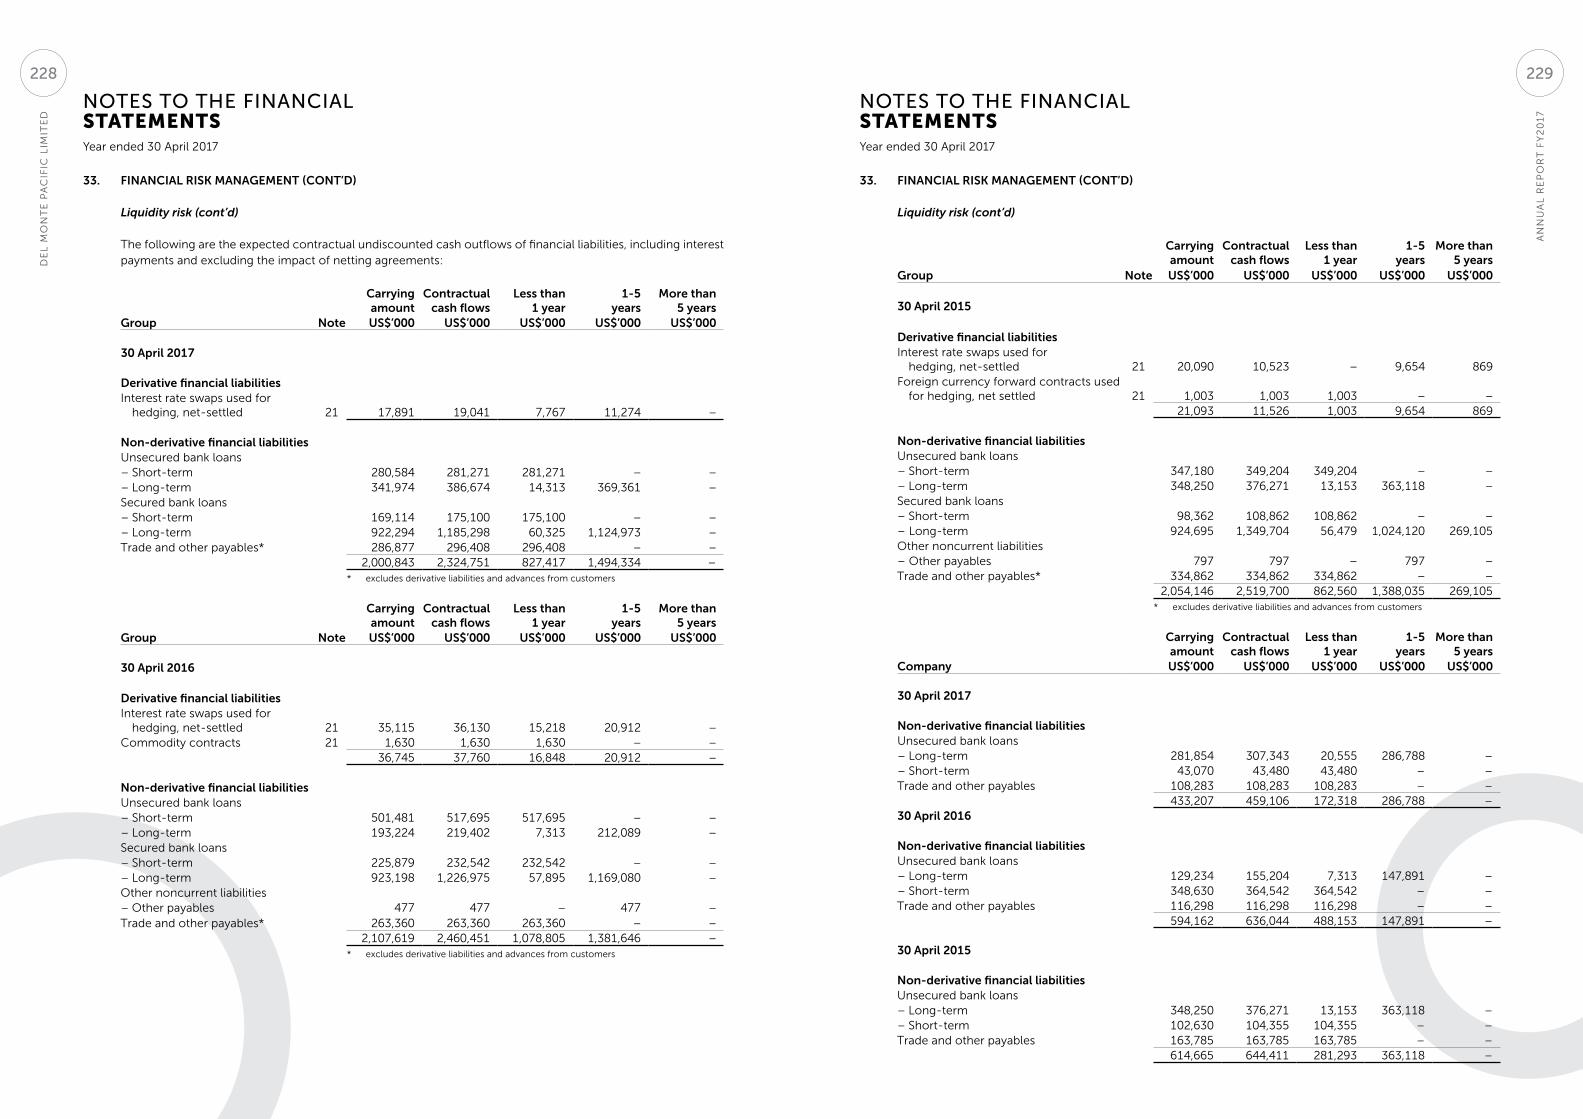
NOTES TO THE FINANCIAL STATEMENTS
NOTES TO THE FINANCIAL STATEMENTS
Year ended 30 April 2017 Year ended 30 April 2017
33. FINANCIAL RISK MANAGEMENT (CONT’D)
Liquidity risk (cont’d)
The following are the expected contractual undiscounted cash outflows of financial liabilities, including interest payments and excluding the impact of netting agreements:
Carrying amount
Contractual cash flows
Less than 1 year
1-5 years
More than 5 years
Group Note US$’000 US$’000 US$’000 US$’000 US$’000
30 April 2017
Derivative financial liabilities Interest rate swaps used for
hedging, net-settled 21 17,891 19,041 7,767 11,274 −
Non-derivative financial liabilitiesUnsecured bank loans– Short-term 280,584 281,271 281,271 − −– Long-term 341,974 386,674 14,313 369,361 −Secured bank loans– Short-term 169,114 175,100 175,100 − −– Long-term 922,294 1,185,298 60,325 1,124,973 −Trade and other payables* 286,877 296,408 296,408 − −
2,000,843 2,324,751 827,417 1,494,334 –* excludes derivative liabilities and advances from customers
Carrying amount
Contractual cash flows
Less than 1 year
1-5 years
More than 5 years
Group Note US$’000 US$’000 US$’000 US$’000 US$’000
30 April 2016
Derivative financial liabilities Interest rate swaps used for
hedging, net-settled 21 35,115 36,130 15,218 20,912 −Commodity contracts 21 1,630 1,630 1,630 − −
36,745 37,760 16,848 20,912 −
Non-derivative financial liabilitiesUnsecured bank loans– Short-term 501,481 517,695 517,695 − −– Long-term 193,224 219,402 7,313 212,089 −Secured bank loans– Short-term 225,879 232,542 232,542 − −– Long-term 923,198 1,226,975 57,895 1,169,080 −Other noncurrent liabilities– Other payables 477 477 − 477 −Trade and other payables* 263,360 263,360 263,360 − −
2,107,619 2,460,451 1,078,805 1,381,646 −* excludes derivative liabilities and advances from customers
33. FINANCIAL RISK MANAGEMENT (CONT’D)
Liquidity risk (cont’d)
Carrying amount
Contractual cash flows
Less than 1 year
1-5 years
More than 5 years
Group Note US$’000 US$’000 US$’000 US$’000 US$’000
30 April 2015
Derivative financial liabilities Interest rate swaps used for
hedging, net-settled 21 20,090 10,523 − 9,654 869Foreign currency forward contracts used
for hedging, net settled 21 1,003 1,003 1,003 − −21,093 11,526 1,003 9,654 869
Non-derivative financial liabilitiesUnsecured bank loans– Short-term 347,180 349,204 349,204 − −– Long-term 348,250 376,271 13,153 363,118 −Secured bank loans– Short-term 98,362 108,862 108,862 − −– Long-term 924,695 1,349,704 56,479 1,024,120 269,105Other noncurrent liabilities– Other payables 797 797 − 797 −Trade and other payables* 334,862 334,862 334,862 − −
2,054,146 2,519,700 862,560 1,388,035 269,105* excludes derivative liabilities and advances from customers
Carrying amount
Contractual cash flows
Less than 1 year
1-5 years
More than 5 years
Company US$’000 US$’000 US$’000 US$’000 US$’000
30 April 2017
Non-derivative financial liabilitiesUnsecured bank loans– Long-term 281,854 307,343 20,555 286,788 –– Short-term 43,070 43,480 43,480 – –Trade and other payables 108,283 108,283 108,283 – –
433,207 459,106 172,318 286,788 –30 April 2016
Non-derivative financial liabilitiesUnsecured bank loans– Long-term 129,234 155,204 7,313 147,891 –– Short-term 348,630 364,542 364,542 – –Trade and other payables 116,298 116,298 116,298 – –
594,162 636,044 488,153 147,891 –
30 April 2015
Non-derivative financial liabilitiesUnsecured bank loans– Long-term 348,250 376,271 13,153 363,118 –– Short-term 102,630 104,355 104,355 – –Trade and other payables 163,785 163,785 163,785 – –
614,665 644,411 281,293 363,118 –
AN
NU
AL
RE
PO
RT
FY
20
17
DE
L M
ON
TE
PA
CIF
IC L
IMIT
ED
229228
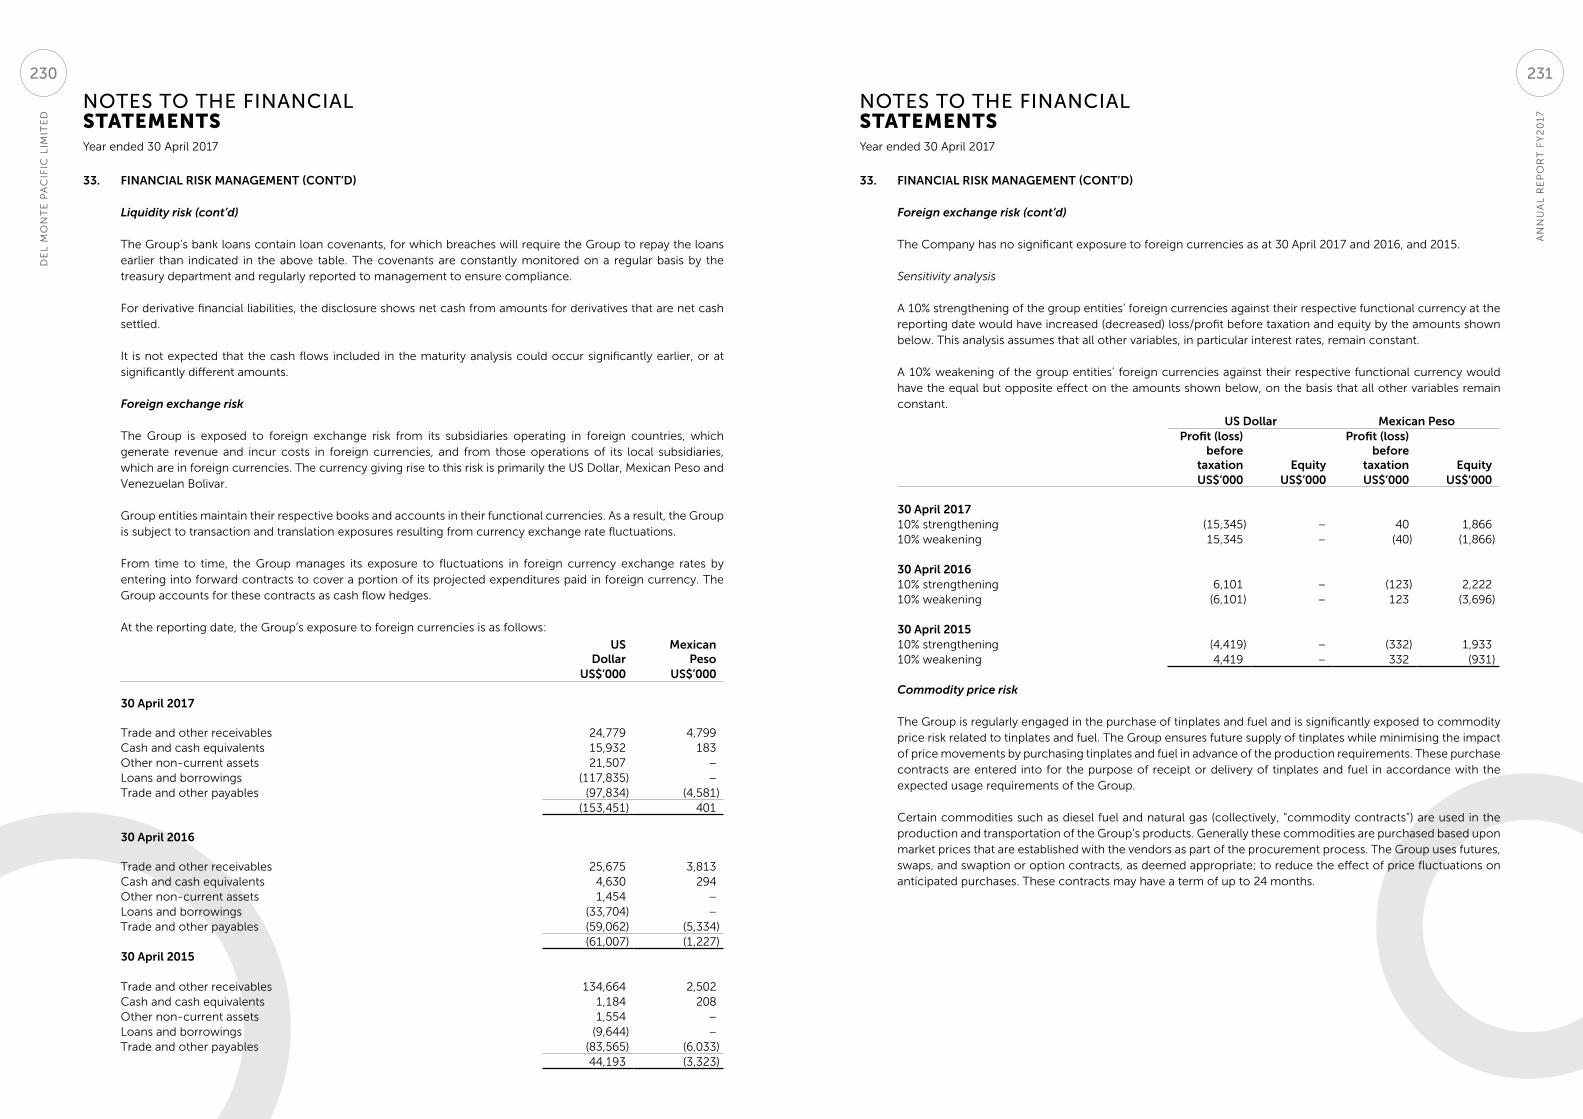
NOTES TO THE FINANCIAL STATEMENTS
NOTES TO THE FINANCIAL STATEMENTS
Year ended 30 April 2017 Year ended 30 April 2017
33. FINANCIAL RISK MANAGEMENT (CONT’D)
Liquidity risk (cont’d)
The Group’s bank loans contain loan covenants, for which breaches will require the Group to repay the loans earlier than indicated in the above table. The covenants are constantly monitored on a regular basis by the treasury department and regularly reported to management to ensure compliance.
For derivative financial liabilities, the disclosure shows net cash from amounts for derivatives that are net cash settled.
It is not expected that the cash flows included in the maturity analysis could occur significantly earlier, or at significantly different amounts.
Foreign exchange risk
The Group is exposed to foreign exchange risk from its subsidiaries operating in foreign countries, which generate revenue and incur costs in foreign currencies, and from those operations of its local subsidiaries, which are in foreign currencies. The currency giving rise to this risk is primarily the US Dollar, Mexican Peso and Venezuelan Bolivar.
Group entities maintain their respective books and accounts in their functional currencies. As a result, the Group is subject to transaction and translation exposures resulting from currency exchange rate fluctuations.
From time to time, the Group manages its exposure to fluctuations in foreign currency exchange rates by entering into forward contracts to cover a portion of its projected expenditures paid in foreign currency. The Group accounts for these contracts as cash flow hedges.
At the reporting date, the Group’s exposure to foreign currencies is as follows:
USDollar
MexicanPeso
US$’000 US$’000
30 April 2017
Trade and other receivables 24,779 4,799Cash and cash equivalents 15,932 183Other non-current assets 21,507 −Loans and borrowings (117,835) −Trade and other payables (97,834) (4,581)
(153,451) 401
30 April 2016
Trade and other receivables 25,675 3,813Cash and cash equivalents 4,630 294Other non-current assets 1,454 −Loans and borrowings (33,704) −Trade and other payables (59,062) (5,334)
(61,007) (1,227)30 April 2015
Trade and other receivables 134,664 2,502Cash and cash equivalents 1,184 208Other non-current assets 1,554 −Loans and borrowings (9,644) −Trade and other payables (83,565) (6,033)
44,193 (3,323)
33. FINANCIAL RISK MANAGEMENT (CONT’D)
Foreign exchange risk (cont’d)
The Company has no significant exposure to foreign currencies as at 30 April 2017 and 2016, and 2015.
Sensitivity analysis
A 10% strengthening of the group entities’ foreign currencies against their respective functional currency at the reporting date would have increased (decreased) loss/profit before taxation and equity by the amounts shown below. This analysis assumes that all other variables, in particular interest rates, remain constant.
A 10% weakening of the group entities’ foreign currencies against their respective functional currency would have the equal but opposite effect on the amounts shown below, on the basis that all other variables remain constant.
US Dollar Mexican PesoProfit (loss)
before taxation Equity
Profit (loss)before
taxation EquityUS$’000 US$’000 US$’000 US$’000
30 April 201710% strengthening (15,345) – 40 1,86610% weakening 15,345 – (40) (1,866)
30 April 201610% strengthening 6,101 – (123) 2,22210% weakening (6,101) – 123 (3,696)
30 April 201510% strengthening (4,419) – (332) 1,93310% weakening 4,419 – 332 (931)
Commodity price risk
The Group is regularly engaged in the purchase of tinplates and fuel and is significantly exposed to commodity price risk related to tinplates and fuel. The Group ensures future supply of tinplates while minimising the impact of price movements by purchasing tinplates and fuel in advance of the production requirements. These purchase contracts are entered into for the purpose of receipt or delivery of tinplates and fuel in accordance with the expected usage requirements of the Group.
Certain commodities such as diesel fuel and natural gas (collectively, “commodity contracts”) are used in the production and transportation of the Group’s products. Generally these commodities are purchased based upon market prices that are established with the vendors as part of the procurement process. The Group uses futures, swaps, and swaption or option contracts, as deemed appropriate; to reduce the effect of price fluctuations on anticipated purchases. These contracts may have a term of up to 24 months.
AN
NU
AL
RE
PO
RT
FY
20
17
DE
L M
ON
TE
PA
CIF
IC L
IMIT
ED
231230
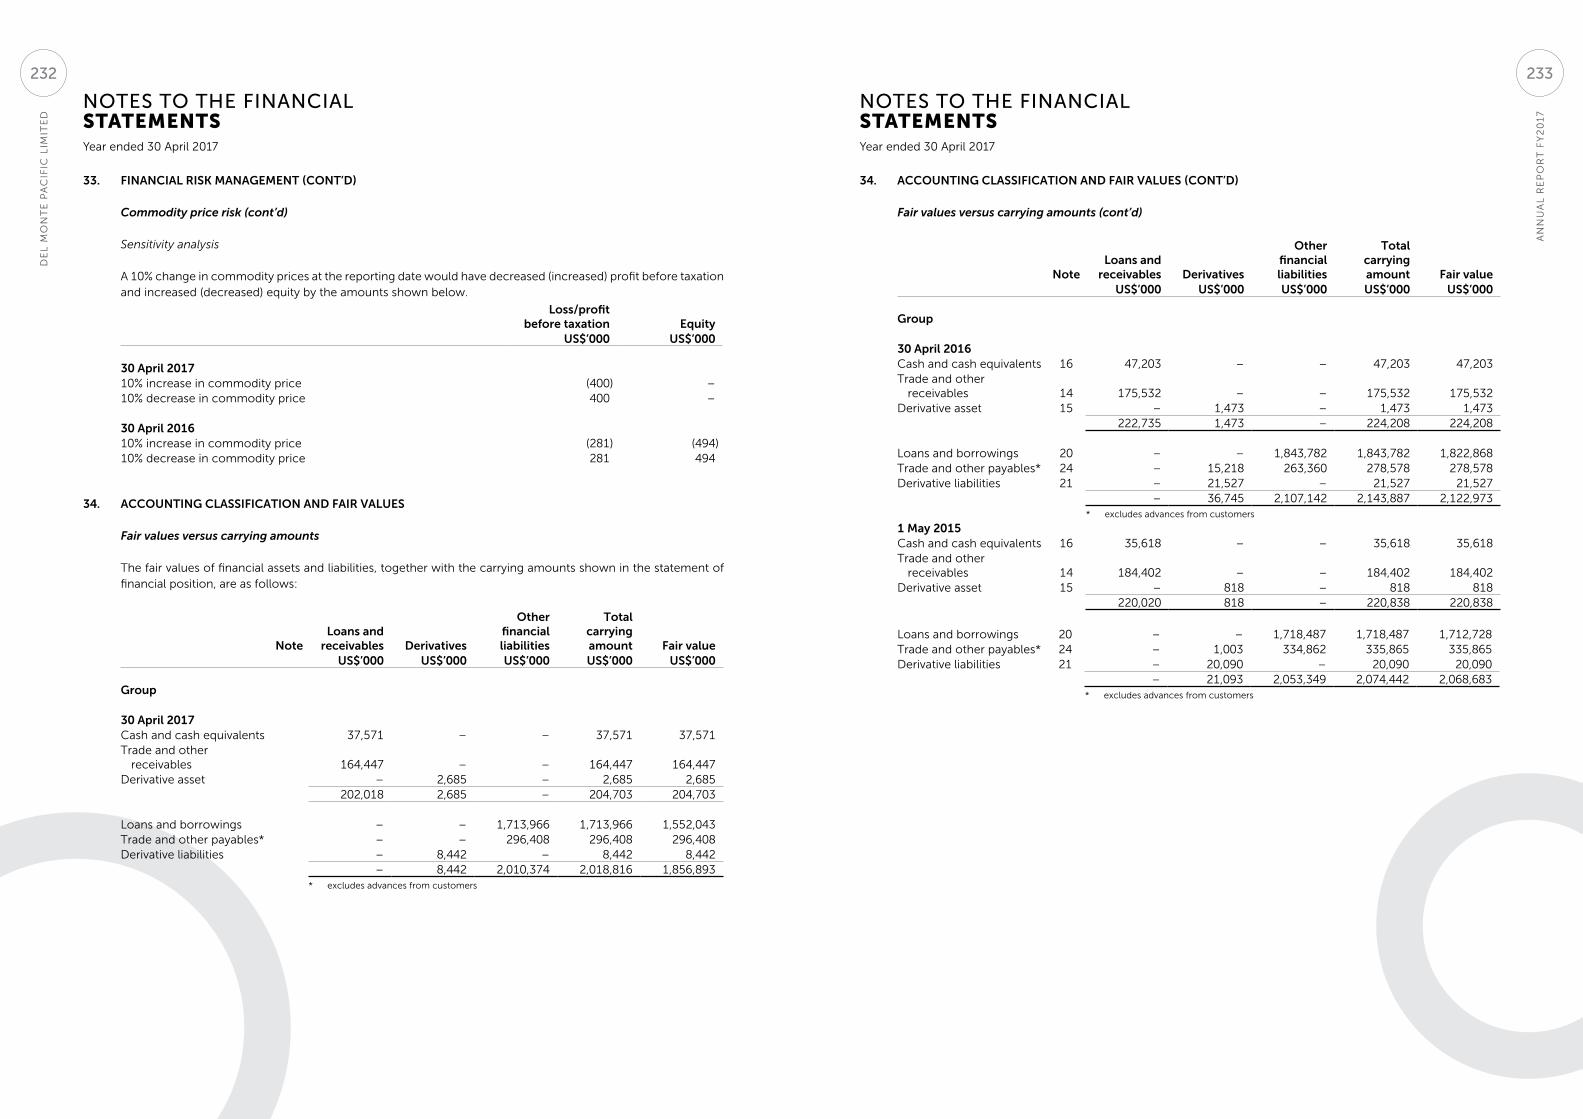
NOTES TO THE FINANCIAL STATEMENTS
NOTES TO THE FINANCIAL STATEMENTS
Year ended 30 April 2017 Year ended 30 April 2017
33. FINANCIAL RISK MANAGEMENT (CONT’D)
Commodity price risk (cont’d)
Sensitivity analysis
A 10% change in commodity prices at the reporting date would have decreased (increased) profit before taxation and increased (decreased) equity by the amounts shown below.
Loss/profitbefore taxation Equity
US$’000 US$’000
30 April 201710% increase in commodity price (400) –10% decrease in commodity price 400 –
30 April 201610% increase in commodity price (281) (494)10% decrease in commodity price 281 494
34. ACCOUNTING CLASSIFICATION AND FAIR VALUES
Fair values versus carrying amounts
The fair values of financial assets and liabilities, together with the carrying amounts shown in the statement of financial position, are as follows:
NoteLoans and
receivables Derivatives
Other financial liabilities
Total carrying amount Fair value
US$’000 US$’000 US$’000 US$’000 US$’000
Group
30 April 2017Cash and cash equivalents 37,571 – – 37,571 37,571Trade and other
receivables 164,447 – – 164,447 164,447 Derivative asset – 2,685 – 2,685 2,685
202,018 2,685 – 204,703 204,703
Loans and borrowings – – 1,713,966 1,713,966 1,552,043 Trade and other payables* – – 296,408 296,408 296,408Derivative liabilities – 8,442 – 8,442 8,442
– 8,442 2,010,374 2,018,816 1,856,893* excludes advances from customers
34. ACCOUNTING CLASSIFICATION AND FAIR VALUES (CONT’D)
Fair values versus carrying amounts (cont’d)
NoteLoans and
receivables Derivatives
Other financial liabilities
Total carrying amount Fair value
US$’000 US$’000 US$’000 US$’000 US$’000
Group
30 April 2016Cash and cash equivalents 16 47,203 – – 47,203 47,203Trade and other
receivables 14 175,532 – – 175,532 175,532Derivative asset 15 – 1,473 – 1,473 1,473
222,735 1,473 – 224,208 224,208
Loans and borrowings 20 – – 1,843,782 1,843,782 1,822,868Trade and other payables* 24 – 15,218 263,360 278,578 278,578Derivative liabilities 21 – 21,527 – 21,527 21,527
– 36,745 2,107,142 2,143,887 2,122,973* excludes advances from customers
1 May 2015Cash and cash equivalents 16 35,618 – – 35,618 35,618Trade and other
receivables 14 184,402 – – 184,402 184,402Derivative asset 15 – 818 – 818 818
220,020 818 – 220,838 220,838
Loans and borrowings 20 – – 1,718,487 1,718,487 1,712,728Trade and other payables* 24 – 1,003 334,862 335,865 335,865Derivative liabilities 21 – 20,090 – 20,090 20,090
– 21,093 2,053,349 2,074,442 2,068,683* excludes advances from customers
AN
NU
AL
RE
PO
RT
FY
20
17
DE
L M
ON
TE
PA
CIF
IC L
IMIT
ED
233232
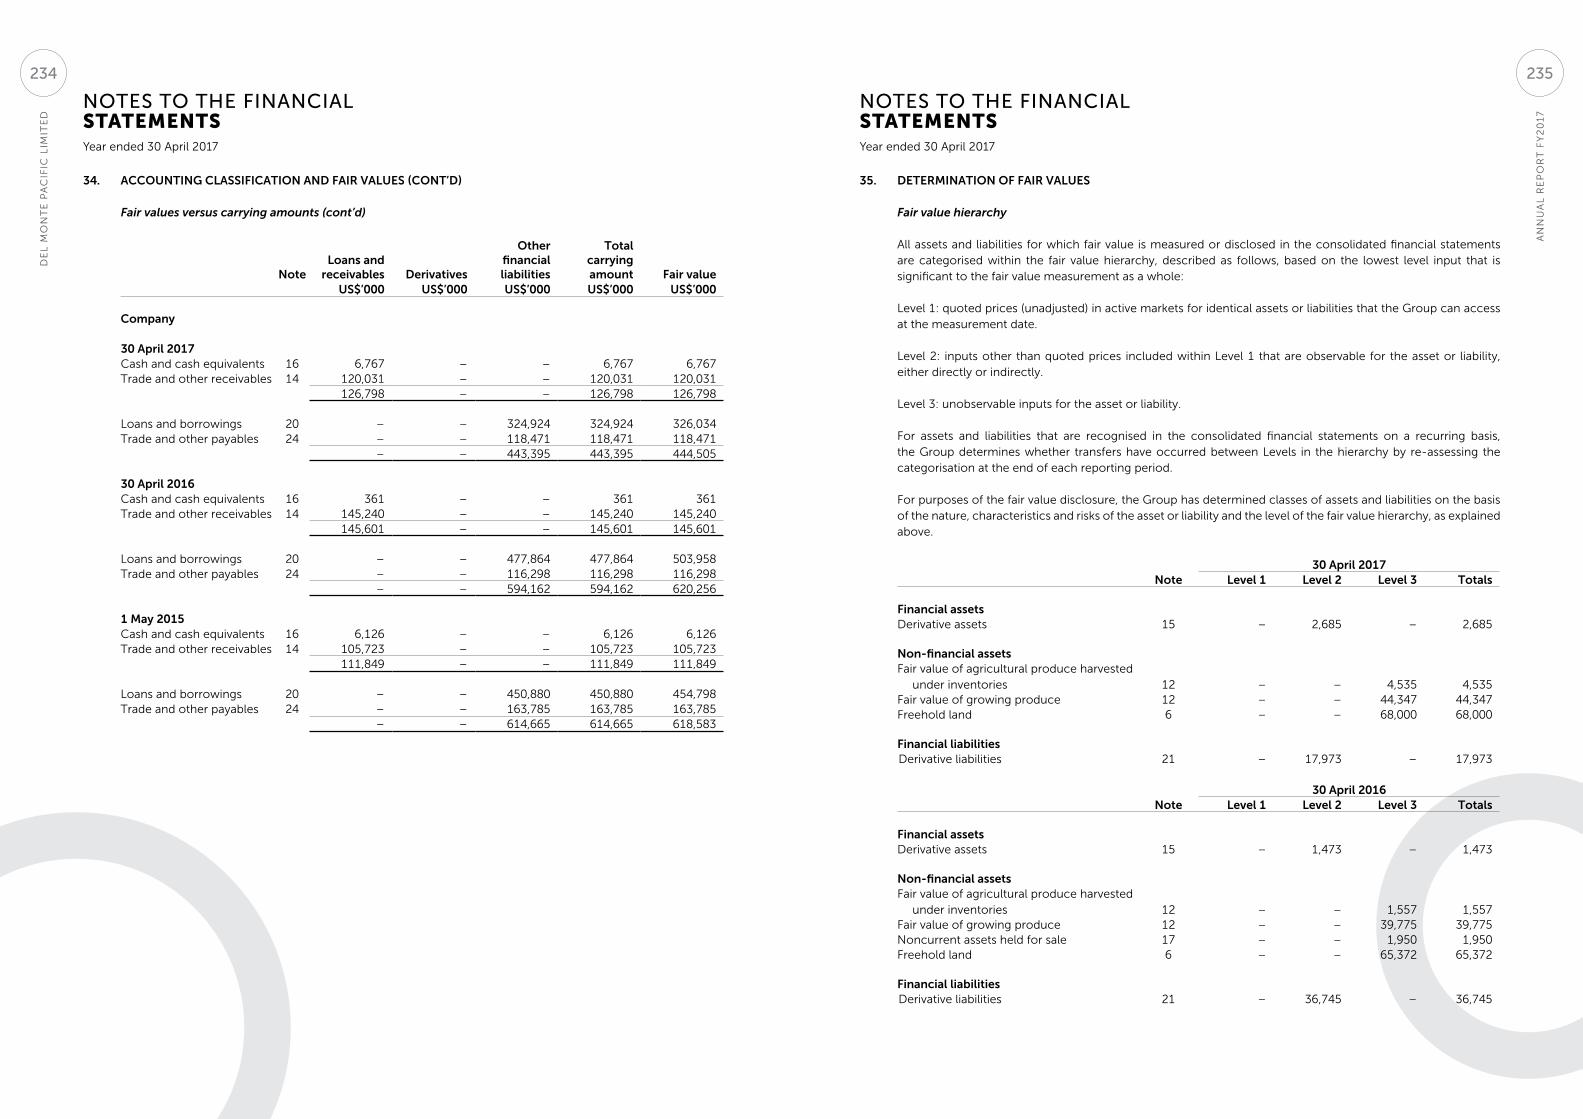
NOTES TO THE FINANCIAL STATEMENTS
NOTES TO THE FINANCIAL STATEMENTS
Year ended 30 April 2017 Year ended 30 April 2017
34. ACCOUNTING CLASSIFICATION AND FAIR VALUES (CONT’D)
Fair values versus carrying amounts (cont’d)
NoteLoans and
receivables Derivatives
Other financial liabilities
Total carrying amount Fair value
US$’000 US$’000 US$’000 US$’000 US$’000
Company
30 April 2017Cash and cash equivalents 16 6,767 – – 6,767 6,767Trade and other receivables 14 120,031 – – 120,031 120,031
126,798 – – 126,798 126,798
Loans and borrowings 20 – – 324,924 324,924 326,034Trade and other payables 24 – – 118,471 118,471 118,471
– – 443,395 443,395 444,505
30 April 2016Cash and cash equivalents 16 361 – – 361 361Trade and other receivables 14 145,240 – – 145,240 145,240
145,601 – – 145,601 145,601
Loans and borrowings 20 – – 477,864 477,864 503,958Trade and other payables 24 – – 116,298 116,298 116,298
– – 594,162 594,162 620,256
1 May 2015Cash and cash equivalents 16 6,126 – – 6,126 6,126Trade and other receivables 14 105,723 – – 105,723 105,723
111,849 – – 111,849 111,849
Loans and borrowings 20 – – 450,880 450,880 454,798Trade and other payables 24 – – 163,785 163,785 163,785
– – 614,665 614,665 618,583
35. DETERMINATION OF FAIR VALUES
Fair value hierarchy
All assets and liabilities for which fair value is measured or disclosed in the consolidated financial statements are categorised within the fair value hierarchy, described as follows, based on the lowest level input that is significant to the fair value measurement as a whole:
Level 1: quoted prices (unadjusted) in active markets for identical assets or liabilities that the Group can access at the measurement date.
Level 2: inputs other than quoted prices included within Level 1 that are observable for the asset or liability, either directly or indirectly.
Level 3: unobservable inputs for the asset or liability.
For assets and liabilities that are recognised in the consolidated financial statements on a recurring basis, the Group determines whether transfers have occurred between Levels in the hierarchy by re-assessing the categorisation at the end of each reporting period.
For purposes of the fair value disclosure, the Group has determined classes of assets and liabilities on the basis of the nature, characteristics and risks of the asset or liability and the level of the fair value hierarchy, as explained above.
30 April 2017Note Level 1 Level 2 Level 3 Totals
Financial assetsDerivative assets 15 – 2,685 – 2,685
Non-financial assetsFair value of agricultural produce harvested
under inventories 12 – – 4,535 4,535Fair value of growing produce 12 – – 44,347 44,347Freehold land 6 – – 68,000 68,000
Financial liabilitiesDerivative liabilities 21 – 17,973 – 17,973
30 April 2016Note Level 1 Level 2 Level 3 Totals
Financial assetsDerivative assets 15 – 1,473 – 1,473
Non-financial assetsFair value of agricultural produce harvested
under inventories 12 – – 1,557 1,557Fair value of growing produce 12 – – 39,775 39,775Noncurrent assets held for sale 17 – – 1,950 1,950Freehold land 6 – – 65,372 65,372
Financial liabilitiesDerivative liabilities 21 – 36,745 – 36,745
AN
NU
AL
RE
PO
RT
FY
20
17
DE
L M
ON
TE
PA
CIF
IC L
IMIT
ED
235234
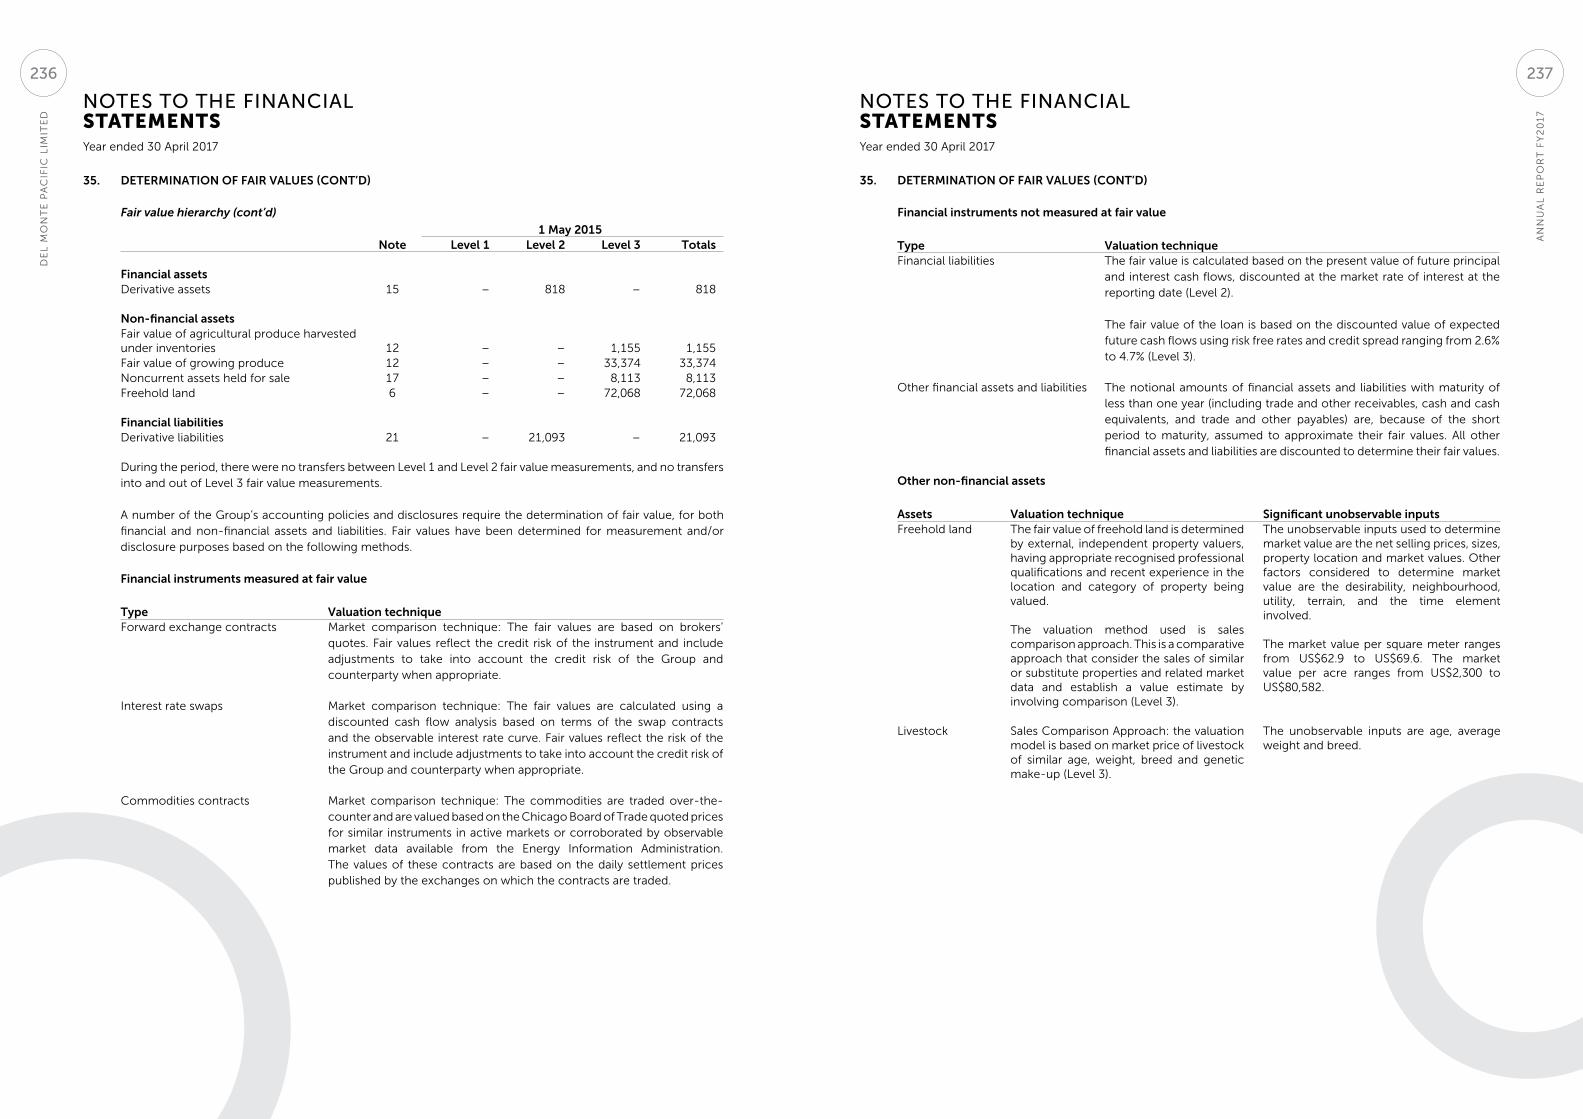
NOTES TO THE FINANCIAL STATEMENTS
NOTES TO THE FINANCIAL STATEMENTS
Year ended 30 April 2017 Year ended 30 April 2017
35. DETERMINATION OF FAIR VALUES (CONT’D)
Fair value hierarchy (cont’d)
1 May 2015Note Level 1 Level 2 Level 3 Totals
Financial assetsDerivative assets 15 – 818 – 818
Non-financial assetsFair value of agricultural produce harvested under inventories 12 – – 1,155 1,155Fair value of growing produce 12 – – 33,374 33,374Noncurrent assets held for sale 17 – – 8,113 8,113Freehold land 6 – – 72,068 72,068
Financial liabilitiesDerivative liabilities 21 – 21,093 – 21,093
During the period, there were no transfers between Level 1 and Level 2 fair value measurements, and no transfers into and out of Level 3 fair value measurements.
A number of the Group’s accounting policies and disclosures require the determination of fair value, for both financial and non-financial assets and liabilities. Fair values have been determined for measurement and/or disclosure purposes based on the following methods.
Financial instruments measured at fair value
Type Valuation techniqueForward exchange contracts Market comparison technique: The fair values are based on brokers’
quotes. Fair values reflect the credit risk of the instrument and include adjustments to take into account the credit risk of the Group and counterparty when appropriate.
Interest rate swaps Market comparison technique: The fair values are calculated using a discounted cash flow analysis based on terms of the swap contracts and the observable interest rate curve. Fair values reflect the risk of the instrument and include adjustments to take into account the credit risk of the Group and counterparty when appropriate.
Commodities contracts Market comparison technique: The commodities are traded over-the-counter and are valued based on the Chicago Board of Trade quoted prices for similar instruments in active markets or corroborated by observable market data available from the Energy Information Administration. The values of these contracts are based on the daily settlement prices published by the exchanges on which the contracts are traded.
35. DETERMINATION OF FAIR VALUES (CONT’D)
Financial instruments not measured at fair value
Type Valuation techniqueFinancial liabilities The fair value is calculated based on the present value of future principal
and interest cash flows, discounted at the market rate of interest at the reporting date (Level 2).
The fair value of the loan is based on the discounted value of expected future cash flows using risk free rates and credit spread ranging from 2.6% to 4.7% (Level 3).
Other financial assets and liabilities The notional amounts of financial assets and liabilities with maturity of less than one year (including trade and other receivables, cash and cash equivalents, and trade and other payables) are, because of the short period to maturity, assumed to approximate their fair values. All other financial assets and liabilities are discounted to determine their fair values.
Other non-financial assets
Assets Valuation technique Significant unobservable inputsFreehold land The fair value of freehold land is determined
by external, independent property valuers, having appropriate recognised professional qualifications and recent experience in the location and category of property being valued.
The valuation method used is sales comparison approach. This is a comparative approach that consider the sales of similar or substitute properties and related market data and establish a value estimate by involving comparison (Level 3).
The unobservable inputs used to determine market value are the net selling prices, sizes, property location and market values. Other factors considered to determine market value are the desirability, neighbourhood, utility, terrain, and the time element involved.
The market value per square meter ranges from US$62.9 to US$69.6. The market value per acre ranges from US$2,300 to US$80,582.
Livestock Sales Comparison Approach: the valuation model is based on market price of livestock of similar age, weight, breed and genetic make-up (Level 3).
The unobservable inputs are age, average weight and breed.
AN
NU
AL
RE
PO
RT
FY
20
17
DE
L M
ON
TE
PA
CIF
IC L
IMIT
ED
237236
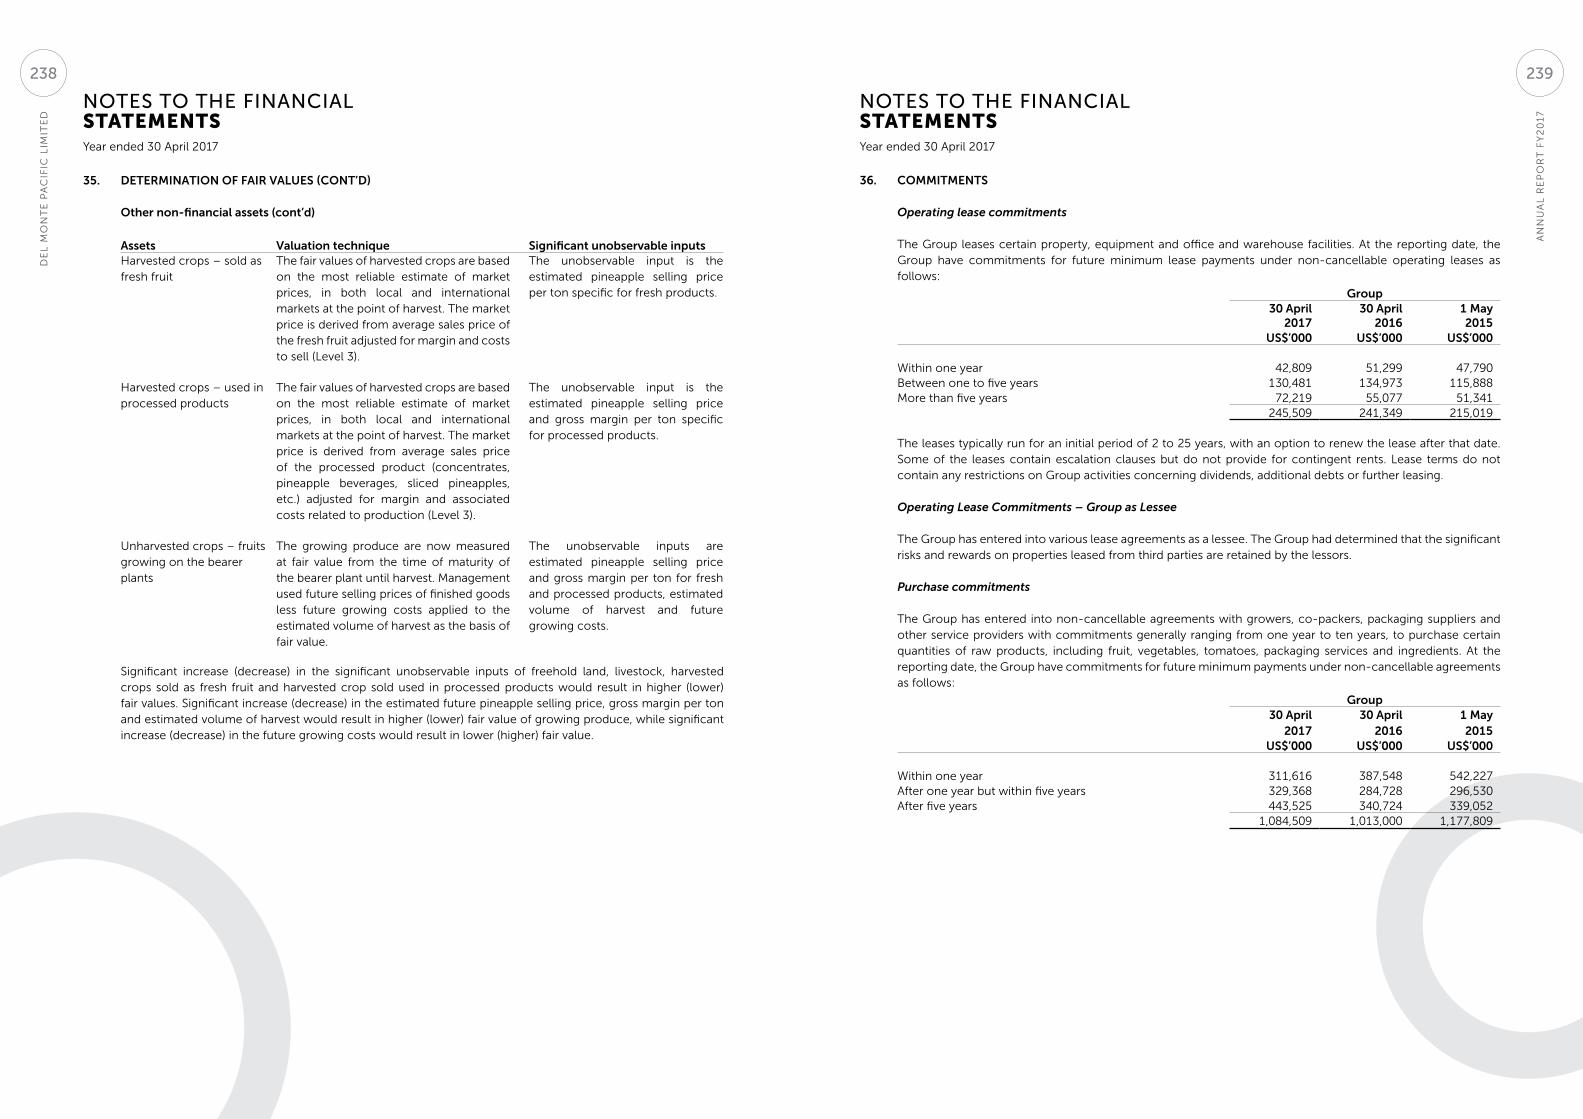
NOTES TO THE FINANCIAL STATEMENTS
NOTES TO THE FINANCIAL STATEMENTS
Year ended 30 April 2017 Year ended 30 April 2017
35. DETERMINATION OF FAIR VALUES (CONT’D)
Other non-financial assets (cont’d)
Assets Valuation technique Significant unobservable inputsHarvested crops – sold as fresh fruit
The fair values of harvested crops are based on the most reliable estimate of market prices, in both local and international markets at the point of harvest. The market price is derived from average sales price of the fresh fruit adjusted for margin and costs to sell (Level 3).
The unobservable input is the estimated pineapple selling price per ton specific for fresh products.
Harvested crops – used in processed products
The fair values of harvested crops are based on the most reliable estimate of market prices, in both local and international markets at the point of harvest. The market price is derived from average sales price of the processed product (concentrates, pineapple beverages, sliced pineapples, etc.) adjusted for margin and associated costs related to production (Level 3).
The unobservable input is the estimated pineapple selling price and gross margin per ton specific for processed products.
Unharvested crops – fruits growing on the bearer plants
The growing produce are now measured at fair value from the time of maturity of the bearer plant until harvest. Management used future selling prices of finished goods less future growing costs applied to the estimated volume of harvest as the basis of fair value.
The unobservable inputs are estimated pineapple selling price and gross margin per ton for fresh and processed products, estimated volume of harvest and future growing costs.
Significant increase (decrease) in the significant unobservable inputs of freehold land, livestock, harvested crops sold as fresh fruit and harvested crop sold used in processed products would result in higher (lower) fair values. Significant increase (decrease) in the estimated future pineapple selling price, gross margin per ton and estimated volume of harvest would result in higher (lower) fair value of growing produce, while significant increase (decrease) in the future growing costs would result in lower (higher) fair value.
36. COMMITMENTS
Operating lease commitments
The Group leases certain property, equipment and office and warehouse facilities. At the reporting date, the Group have commitments for future minimum lease payments under non-cancellable operating leases as follows:
Group30 April
201730 April
20161 May2015
US$’000 US$’000 US$’000
Within one year 42,809 51,299 47,790Between one to five years 130,481 134,973 115,888More than five years 72,219 55,077 51,341
245,509 241,349 215,019
The leases typically run for an initial period of 2 to 25 years, with an option to renew the lease after that date. Some of the leases contain escalation clauses but do not provide for contingent rents. Lease terms do not contain any restrictions on Group activities concerning dividends, additional debts or further leasing.
Operating Lease Commitments – Group as Lessee
The Group has entered into various lease agreements as a lessee. The Group had determined that the significant risks and rewards on properties leased from third parties are retained by the lessors.
Purchase commitments
The Group has entered into non-cancellable agreements with growers, co-packers, packaging suppliers and other service providers with commitments generally ranging from one year to ten years, to purchase certain quantities of raw products, including fruit, vegetables, tomatoes, packaging services and ingredients. At the reporting date, the Group have commitments for future minimum payments under non-cancellable agreements as follows:
Group30 April
201730 April
20161 May2015
US$’000 US$’000 US$’000
Within one year 311,616 387,548 542,227After one year but within five years 329,368 284,728 296,530After five years 443,525 340,724 339,052
1,084,509 1,013,000 1,177,809
AN
NU
AL
RE
PO
RT
FY
20
17
DE
L M
ON
TE
PA
CIF
IC L
IMIT
ED
239238
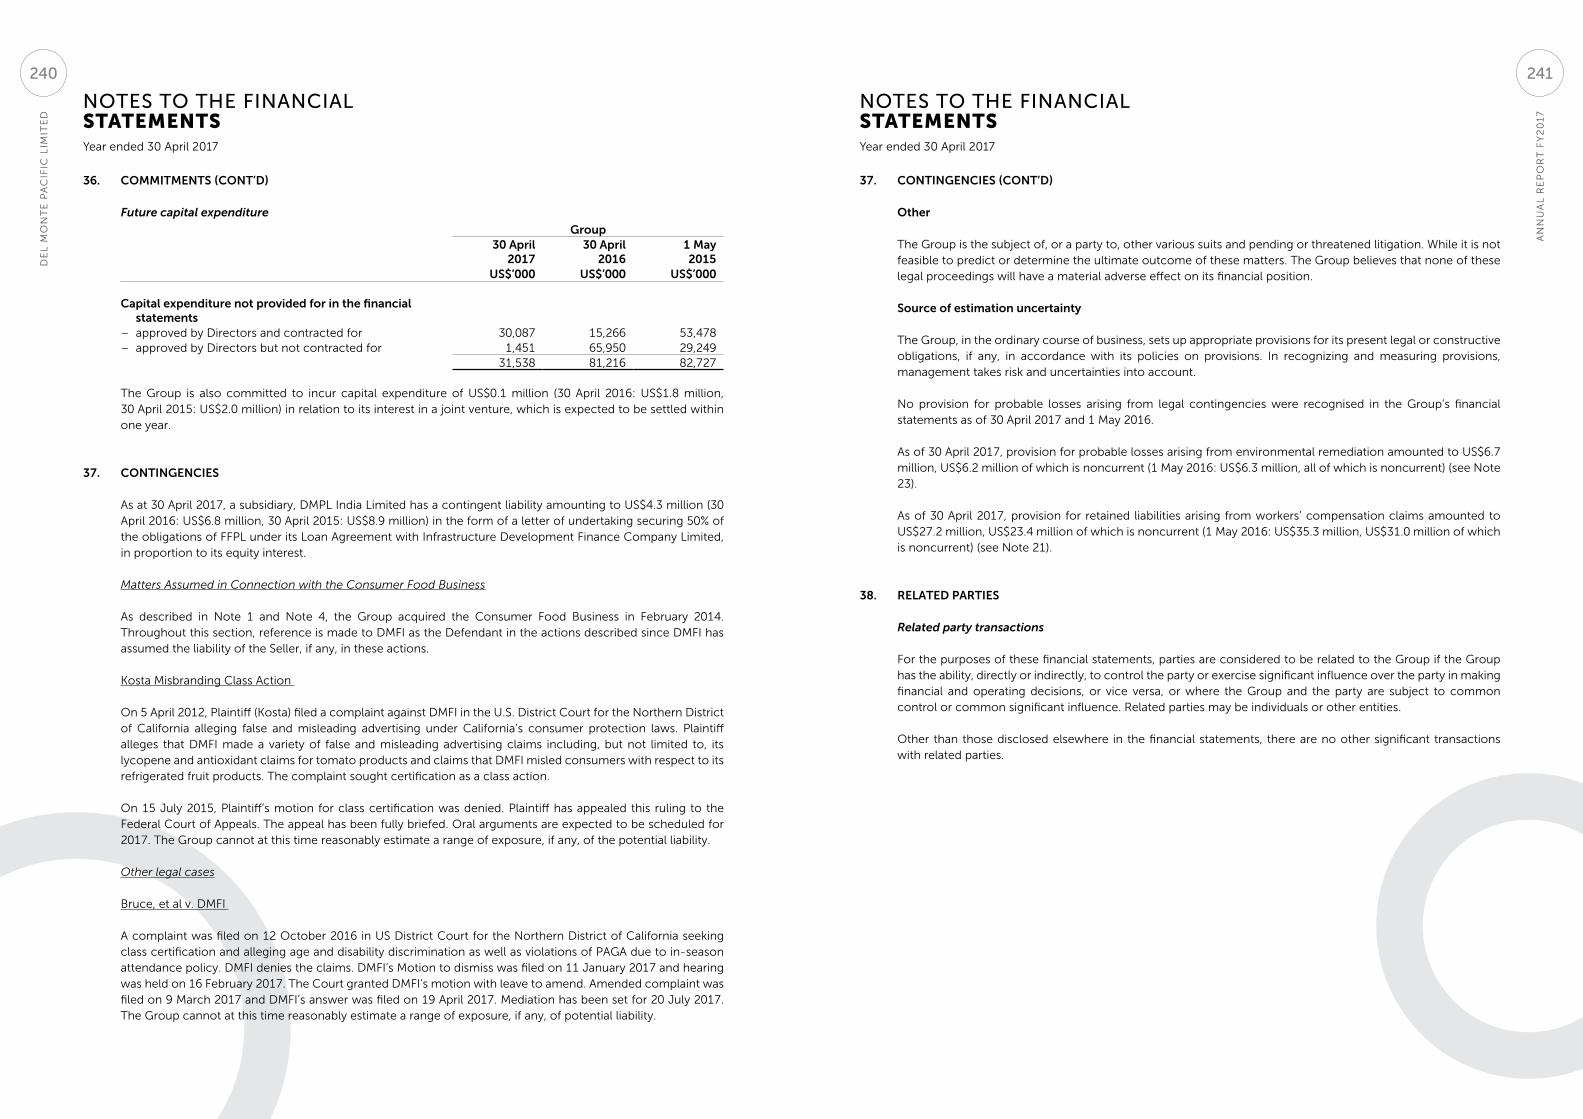
NOTES TO THE FINANCIAL STATEMENTS
NOTES TO THE FINANCIAL STATEMENTS
Year ended 30 April 2017 Year ended 30 April 2017
36. COMMITMENTS (CONT’D)
Future capital expenditure
Group30 April
201730 April
20161 May2015
US$’000 US$’000 US$’000
Capital expenditure not provided for in the financial statements
– approved by Directors and contracted for 30,087 15,266 53,478– approved by Directors but not contracted for 1,451 65,950 29,249
31,538 81,216 82,727
The Group is also committed to incur capital expenditure of US$0.1 million (30 April 2016: US$1.8 million, 30 April 2015: US$2.0 million) in relation to its interest in a joint venture, which is expected to be settled within one year.
37. CONTINGENCIES
As at 30 April 2017, a subsidiary, DMPL India Limited has a contingent liability amounting to US$4.3 million (30 April 2016: US$6.8 million, 30 April 2015: US$8.9 million) in the form of a letter of undertaking securing 50% of the obligations of FFPL under its Loan Agreement with Infrastructure Development Finance Company Limited, in proportion to its equity interest.
Matters Assumed in Connection with the Consumer Food Business
As described in Note 1 and Note 4, the Group acquired the Consumer Food Business in February 2014. Throughout this section, reference is made to DMFI as the Defendant in the actions described since DMFI has assumed the liability of the Seller, if any, in these actions.
Kosta Misbranding Class Action
On 5 April 2012, Plaintiff (Kosta) filed a complaint against DMFI in the U.S. District Court for the Northern District of California alleging false and misleading advertising under California’s consumer protection laws. Plaintiff alleges that DMFI made a variety of false and misleading advertising claims including, but not limited to, its lycopene and antioxidant claims for tomato products and claims that DMFI misled consumers with respect to its refrigerated fruit products. The complaint sought certification as a class action.
On 15 July 2015, Plaintiff’s motion for class certification was denied. Plaintiff has appealed this ruling to the Federal Court of Appeals. The appeal has been fully briefed. Oral arguments are expected to be scheduled for 2017. The Group cannot at this time reasonably estimate a range of exposure, if any, of the potential liability.
Other legal cases
Bruce, et al v. DMFI
A complaint was filed on 12 October 2016 in US District Court for the Northern District of California seeking class certification and alleging age and disability discrimination as well as violations of PAGA due to in-season attendance policy. DMFI denies the claims. DMFI’s Motion to dismiss was filed on 11 January 2017 and hearing was held on 16 February 2017. The Court granted DMFI’s motion with leave to amend. Amended complaint was filed on 9 March 2017 and DMFI’s answer was filed on 19 April 2017. Mediation has been set for 20 July 2017. The Group cannot at this time reasonably estimate a range of exposure, if any, of potential liability.
37. CONTINGENCIES (CONT’D)
Other
The Group is the subject of, or a party to, other various suits and pending or threatened litigation. While it is not feasible to predict or determine the ultimate outcome of these matters. The Group believes that none of these legal proceedings will have a material adverse effect on its financial position.
Source of estimation uncertainty
The Group, in the ordinary course of business, sets up appropriate provisions for its present legal or constructive obligations, if any, in accordance with its policies on provisions. In recognizing and measuring provisions, management takes risk and uncertainties into account.
No provision for probable losses arising from legal contingencies were recognised in the Group’s financial statements as of 30 April 2017 and 1 May 2016.
As of 30 April 2017, provision for probable losses arising from environmental remediation amounted to US$6.7 million, US$6.2 million of which is noncurrent (1 May 2016: US$6.3 million, all of which is noncurrent) (see Note 23).
As of 30 April 2017, provision for retained liabilities arising from workers’ compensation claims amounted to US$27.2 million, US$23.4 million of which is noncurrent (1 May 2016: US$35.3 million, US$31.0 million of which is noncurrent) (see Note 21).
38. RELATED PARTIES
Related party transactions
For the purposes of these financial statements, parties are considered to be related to the Group if the Group has the ability, directly or indirectly, to control the party or exercise significant influence over the party in making financial and operating decisions, or vice versa, or where the Group and the party are subject to common control or common significant influence. Related parties may be individuals or other entities.
Other than those disclosed elsewhere in the financial statements, there are no other significant transactions with related parties.
AN
NU
AL
RE
PO
RT
FY
20
17
DE
L M
ON
TE
PA
CIF
IC L
IMIT
ED
241240
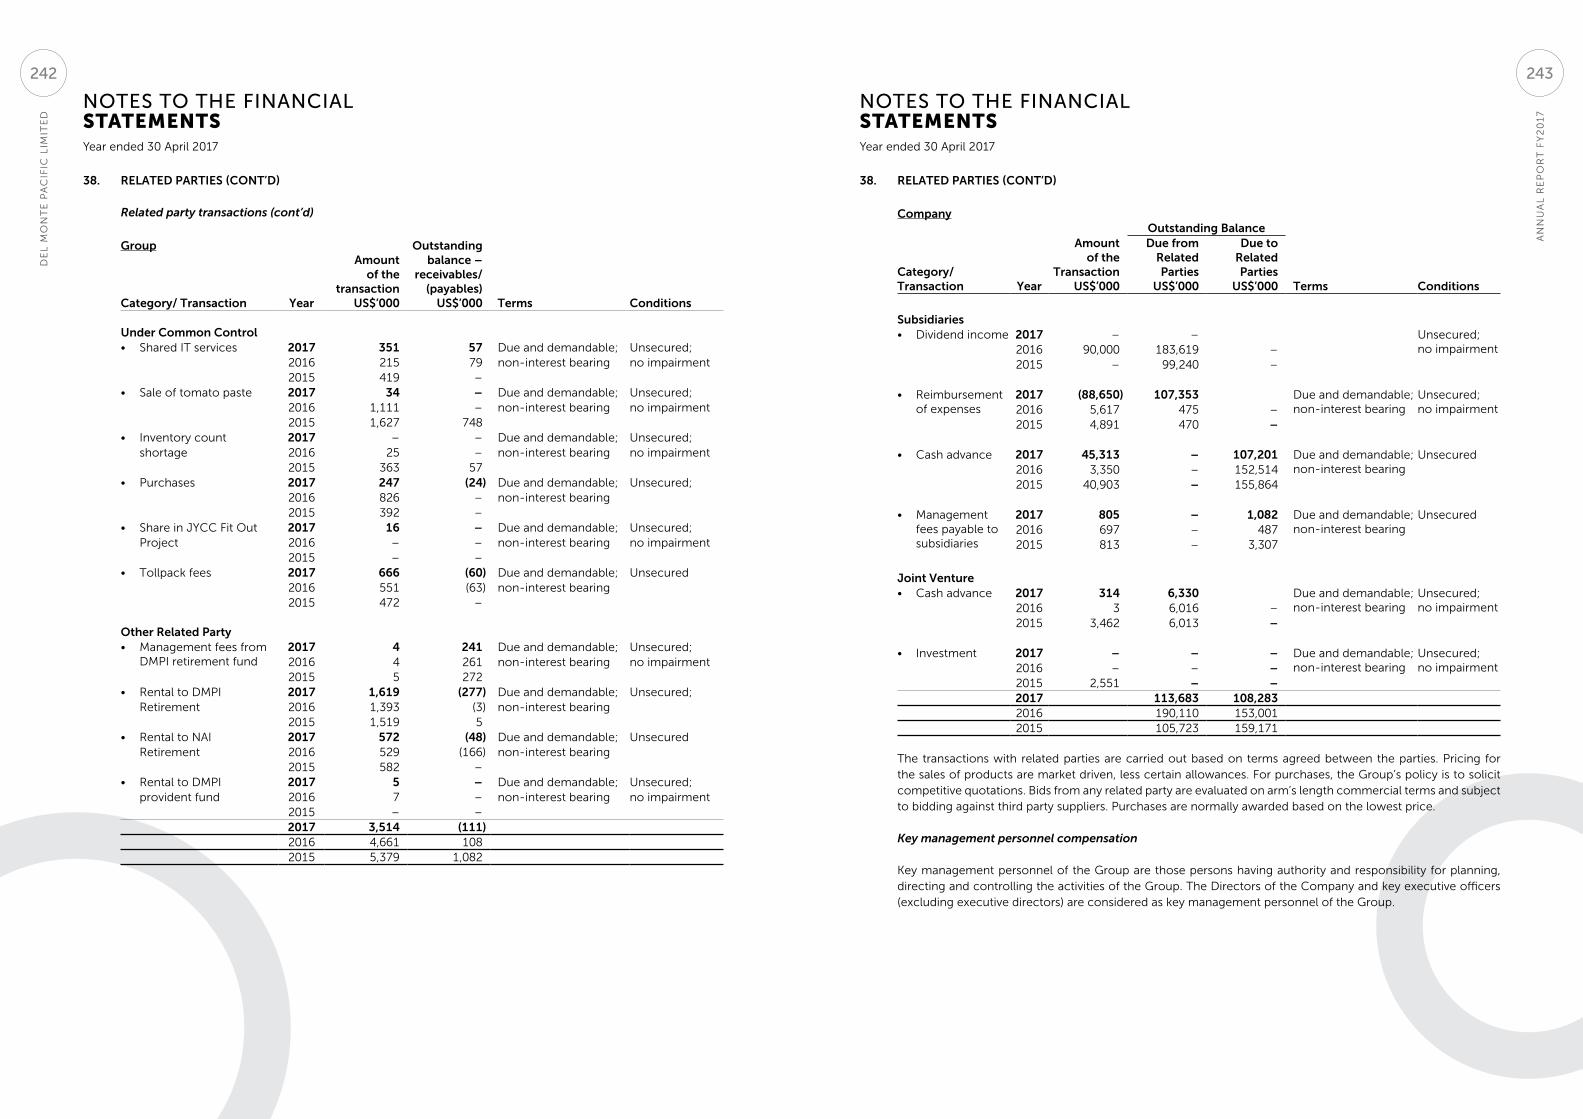
NOTES TO THE FINANCIAL STATEMENTS
NOTES TO THE FINANCIAL STATEMENTS
Year ended 30 April 2017 Year ended 30 April 2017
38. RELATED PARTIES (CONT’D)
Related party transactions (cont’d)
Group
Category/ Transaction Year
Amountof the
transactionUS$’000
Outstandingbalance –
receivables/(payables)
US$’000 Terms Conditions
Under Common Control• Shared IT services 2017 351 57 Due and demandable; Unsecured;
2016 215 79 non-interest bearing no impairment2015 419 –
• Sale of tomato paste 2017 34 – Due and demandable; Unsecured; 2016 1,111 – non-interest bearing no impairment2015 1,627 748
• Inventory count 2017 – – Due and demandable; Unsecured; shortage 2016 25 – non-interest bearing no impairment
2015 363 57 • Purchases 2017 247 (24) Due and demandable; Unsecured;
2016 826 – non-interest bearing2015 392 –
• Share in JYCC Fit Out 2017 16 – Due and demandable; Unsecured; Project 2016 – – non-interest bearing no impairment
2015 – –• Tollpack fees 2017 666 (60) Due and demandable; Unsecured
2016 551 (63) non-interest bearing2015 472 –
Other Related Party• Management fees from
DMPI retirement fund2017 4 241 Due and demandable; Unsecured; 2016 4 261 non-interest bearing no impairment2015 5 272
• Rental to DMPI 2017 1,619 (277) Due and demandable; Unsecured; Retirement 2016 1,393 (3) non-interest bearing
2015 1,519 5 • Rental to NAI 2017 572 (48) Due and demandable; Unsecured Retirement 2016 529 (166) non-interest bearing
2015 582 – • Rental to DMPI 2017 5 – Due and demandable; Unsecured; provident fund 2016 7 – non-interest bearing no impairment
2015 – – 2017 3,514 (111)2016 4,661 108 2015 5,379 1,082
38. RELATED PARTIES (CONT’D)
CompanyOutstanding Balance
Category/Transaction Year
Amount of the
TransactionUS$’000
Due from Related Parties
US$’000
Due toRelated Parties
US$’000 Terms Conditions
Subsidiaries• Dividend income 2017 – – Unsecured;
no impairment2016 90,000 183,619 – 2015 – 99,240 –
• Reimbursement of expenses
2017 (88,650) 107,353 Due and demandable; non-interest bearing
Unsecured; no impairment2016 5,617 475 –
2015 4,891 470 –
• Cash advance 2017 45,313 – 107,201 Due and demandable; non-interest bearing
Unsecured 2016 3,350 – 152,5142015 40,903 – 155,864
• Management fees payable to subsidiaries
2017 805 – 1,082 Due and demandable; non-interest bearing
Unsecured 2016 697 – 4872015 813 – 3,307
Joint Venture• Cash advance 2017 314 6,330 Due and demandable;
non-interest bearingUnsecured; no impairment2016 3 6,016 –
2015 3,462 6,013 –
• Investment 2017 – – – Due and demandable; non-interest bearing
Unsecured; no impairment2016 – – –
2015 2,551 – –2017 113,683 108,2832016 190,110 153,0012015 105,723 159,171
The transactions with related parties are carried out based on terms agreed between the parties. Pricing for the sales of products are market driven, less certain allowances. For purchases, the Group’s policy is to solicit competitive quotations. Bids from any related party are evaluated on arm’s length commercial terms and subject to bidding against third party suppliers. Purchases are normally awarded based on the lowest price.
Key management personnel compensation Key management personnel of the Group are those persons having authority and responsibility for planning, directing and controlling the activities of the Group. The Directors of the Company and key executive officers (excluding executive directors) are considered as key management personnel of the Group.
AN
NU
AL
RE
PO
RT
FY
20
17
DE
L M
ON
TE
PA
CIF
IC L
IMIT
ED
243242
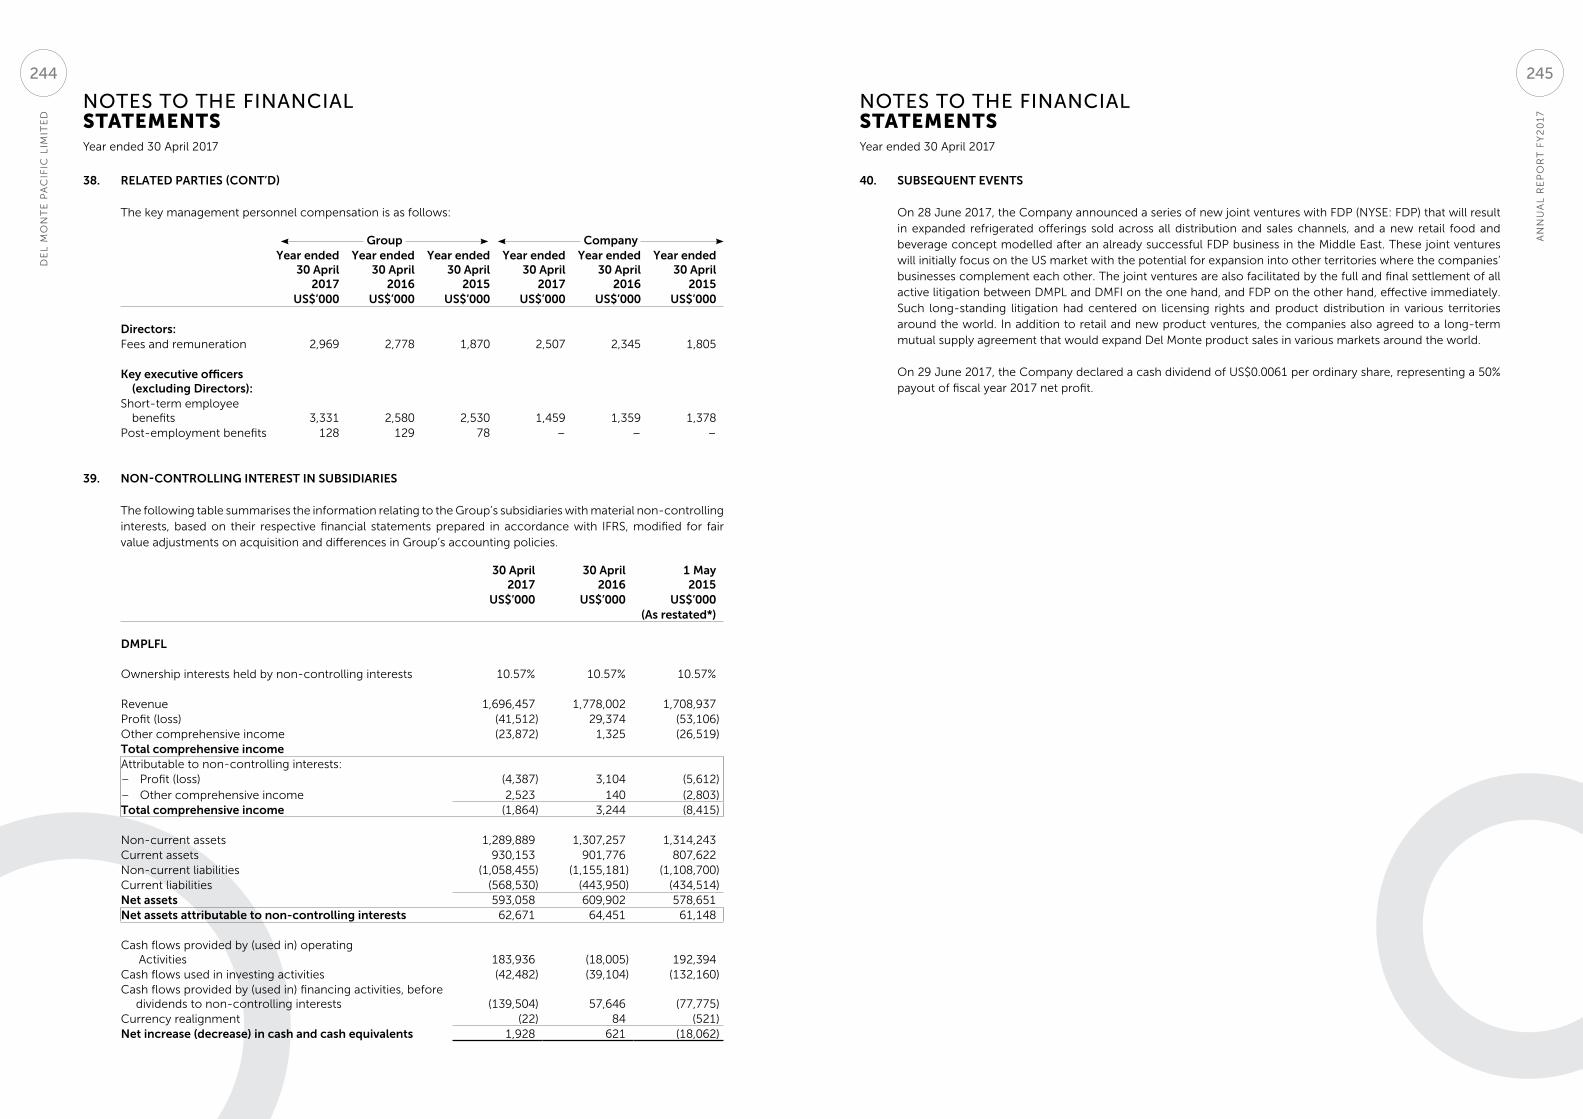
NOTES TO THE FINANCIAL STATEMENTS
NOTES TO THE FINANCIAL STATEMENTS
Year ended 30 April 2017 Year ended 30 April 2017
38. RELATED PARTIES (CONT’D)
The key management personnel compensation is as follows:
Group Company Year ended
30 April 2017
Year ended 30 April
2016
Year ended 30 April
2015
Year ended 30 April
2017
Year ended 30 April
2016
Year ended 30 April
2015US$’000 US$’000 US$’000 US$’000 US$’000 US$’000
Directors:Fees and remuneration 2,969 2,778 1,870 2,507 2,345 1,805
Key executive officers (excluding Directors):
Short-term employee benefits 3,331 2,580 2,530 1,459 1,359 1,378
Post-employment benefits 128 129 78 – – –
39. NON-CONTROLLING INTEREST IN SUBSIDIARIES
The following table summarises the information relating to the Group’s subsidiaries with material non-controlling interests, based on their respective financial statements prepared in accordance with IFRS, modified for fair value adjustments on acquisition and differences in Group’s accounting policies.
30 April2017
30 April2016
1 May2015
US$’000 US$’000 US$’000(As restated*)
DMPLFL
Ownership interests held by non-controlling interests 10.57% 10.57% 10.57%
Revenue 1,696,457 1,778,002 1,708,937Profit (loss) (41,512) 29,374 (53,106)Other comprehensive income (23,872) 1,325 (26,519)Total comprehensive incomeAttributable to non-controlling interests:– Profit (loss) (4,387) 3,104 (5,612)– Other comprehensive income 2,523 140 (2,803)Total comprehensive income (1,864) 3,244 (8,415)
Non-current assets 1,289,889 1,307,257 1,314,243Current assets 930,153 901,776 807,622Non-current liabilities (1,058,455) (1,155,181) (1,108,700)Current liabilities (568,530) (443,950) (434,514)Net assets 593,058 609,902 578,651Net assets attributable to non-controlling interests 62,671 64,451 61,148
Cash flows provided by (used in) operatingActivities 183,936 (18,005) 192,394
Cash flows used in investing activities (42,482) (39,104) (132,160)Cash flows provided by (used in) financing activities, before
dividends to non-controlling interests (139,504) 57,646 (77,775)Currency realignment (22) 84 (521)Net increase (decrease) in cash and cash equivalents 1,928 621 (18,062)
40. SUBSEQUENT EVENTS
On 28 June 2017, the Company announced a series of new joint ventures with FDP (NYSE: FDP) that will result in expanded refrigerated offerings sold across all distribution and sales channels, and a new retail food and beverage concept modelled after an already successful FDP business in the Middle East. These joint ventures will initially focus on the US market with the potential for expansion into other territories where the companies’ businesses complement each other. The joint ventures are also facilitated by the full and final settlement of all active litigation between DMPL and DMFI on the one hand, and FDP on the other hand, effective immediately. Such long-standing litigation had centered on licensing rights and product distribution in various territories around the world. In addition to retail and new product ventures, the companies also agreed to a long-term mutual supply agreement that would expand Del Monte product sales in various markets around the world.
On 29 June 2017, the Company declared a cash dividend of US$0.0061 per ordinary share, representing a 50% payout of fiscal year 2017 net profit.
AN
NU
AL
RE
PO
RT
FY
20
17
DE
L M
ON
TE
PA
CIF
IC L
IMIT
ED
245244
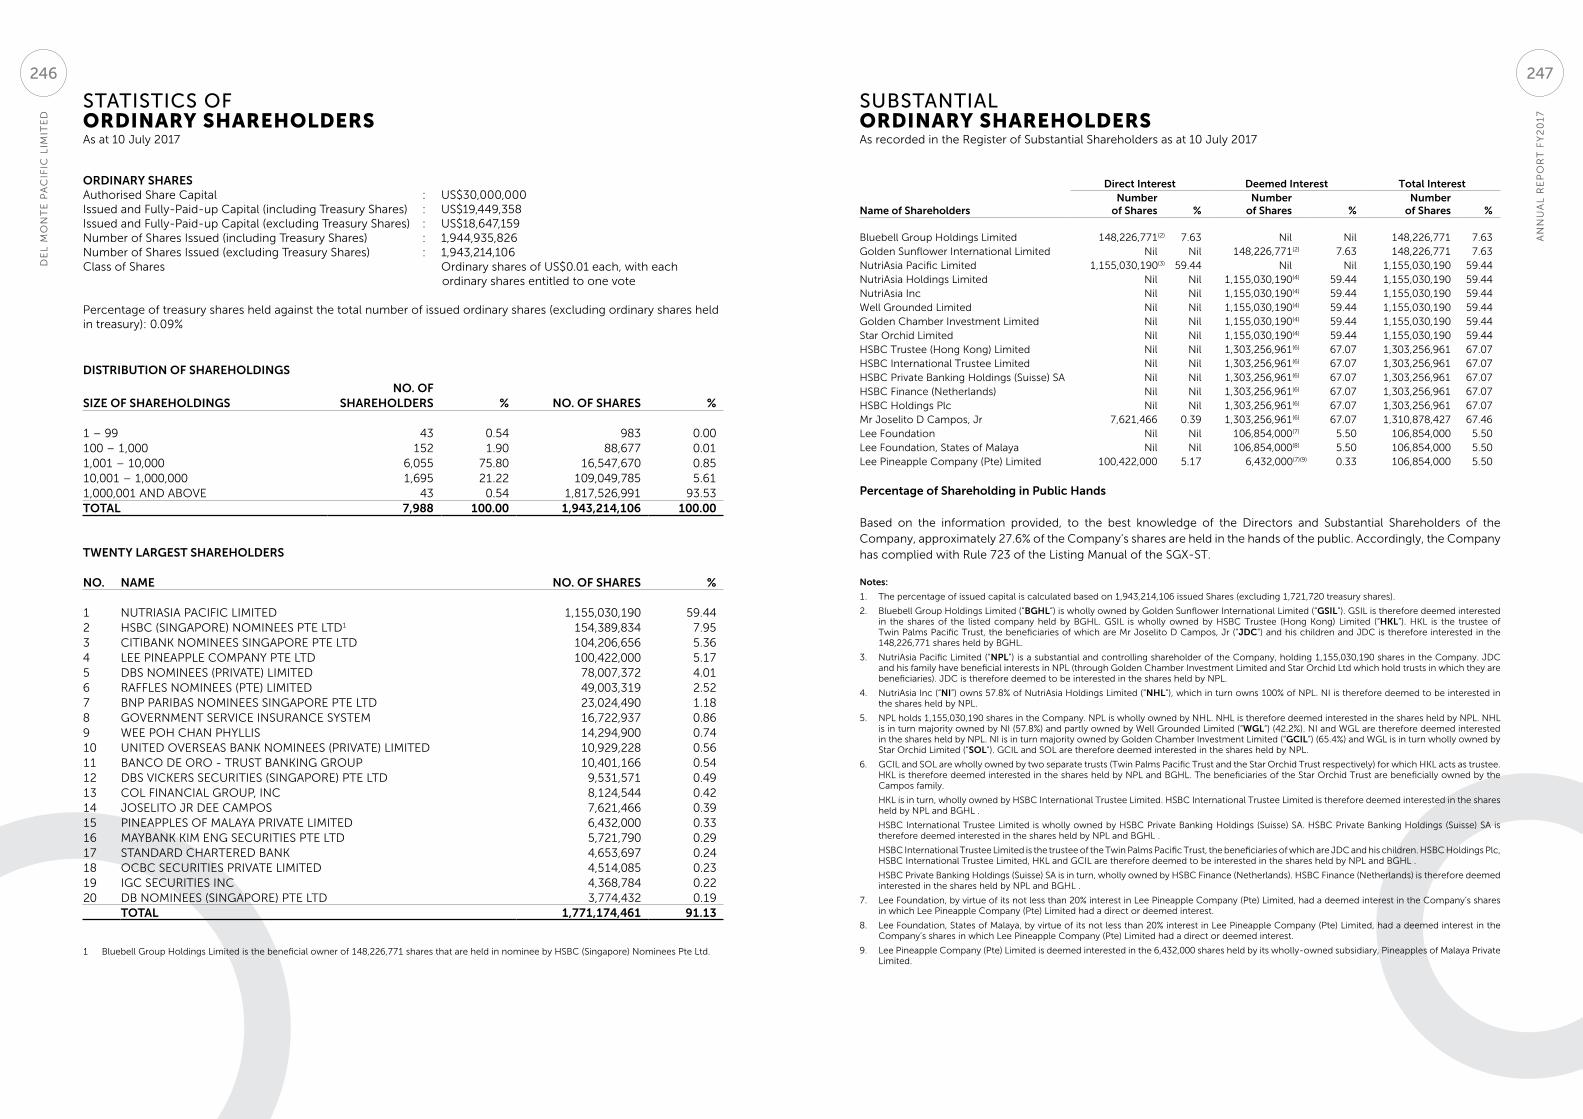
STATISTICS OF ORDINARY SHAREHOLDERS As at 10 July 2017
ORDINARY SHARES Authorised Share Capital : US$30,000,000 Issued and Fully-Paid-up Capital (including Treasury Shares) : US$19,449,358 Issued and Fully-Paid-up Capital (excluding Treasury Shares) : US$18,647,159 Number of Shares Issued (including Treasury Shares) : 1,944,935,826 Number of Shares Issued (excluding Treasury Shares) : 1,943,214,106 Class of Shares Ordinary shares of US$0.01 each, with each
ordinary shares entitled to one vote
Percentage of treasury shares held against the total number of issued ordinary shares (excluding ordinary shares held in treasury): 0.09%
DISTRIBUTION OF SHAREHOLDINGS
NO. OFSIZE OF SHAREHOLDINGS SHAREHOLDERS % NO. OF SHARES %
1 – 99 43 0.54 983 0.00100 – 1,000 152 1.90 88,677 0.011,001 – 10,000 6,055 75.80 16,547,670 0.8510,001 – 1,000,000 1,695 21.22 109,049,785 5.611,000,001 AND ABOVE 43 0.54 1,817,526,991 93.53TOTAL 7,988 100.00 1,943,214,106 100.00
TWENTY LARGEST SHAREHOLDERS
NO. NAME NO. OF SHARES %
1 NUTRIASIA PACIFIC LIMITED 1,155,030,190 59.442 HSBC (SINGAPORE) NOMINEES PTE LTD1 154,389,834 7.953 CITIBANK NOMINEES SINGAPORE PTE LTD 104,206,656 5.364 LEE PINEAPPLE COMPANY PTE LTD 100,422,000 5.175 DBS NOMINEES (PRIVATE) LIMITED 78,007,372 4.016 RAFFLES NOMINEES (PTE) LIMITED 49,003,319 2.527 BNP PARIBAS NOMINEES SINGAPORE PTE LTD 23,024,490 1.188 GOVERNMENT SERVICE INSURANCE SYSTEM 16,722,937 0.869 WEE POH CHAN PHYLLIS 14,294,900 0.7410 UNITED OVERSEAS BANK NOMINEES (PRIVATE) LIMITED 10,929,228 0.5611 BANCO DE ORO - TRUST BANKING GROUP 10,401,166 0.5412 DBS VICKERS SECURITIES (SINGAPORE) PTE LTD 9,531,571 0.4913 COL FINANCIAL GROUP, INC 8,124,544 0.4214 JOSELITO JR DEE CAMPOS 7,621,466 0.3915 PINEAPPLES OF MALAYA PRIVATE LIMITED 6,432,000 0.3316 MAYBANK KIM ENG SECURITIES PTE LTD 5,721,790 0.2917 STANDARD CHARTERED BANK 4,653,697 0.2418 OCBC SECURITIES PRIVATE LIMITED 4,514,085 0.2319 IGC SECURITIES INC 4,368,784 0.2220 DB NOMINEES (SINGAPORE) PTE LTD 3,774,432 0.19
TOTAL 1,771,174,461 91.13
1 Bluebell Group Holdings Limited is the beneficial owner of 148,226,771 shares that are held in nominee by HSBC (Singapore) Nominees Pte Ltd.
SUBSTANTIAL ORDINARY SHAREHOLDERS As recorded in the Register of Substantial Shareholders as at 10 July 2017
Name of Shareholders
Direct Interest Deemed Interest Total InterestNumber
of Shares %Number
of Shares %Number
of Shares %
Bluebell Group Holdings Limited 148,226,771(2) 7.63 Nil Nil 148,226,771 7.63Golden Sunflower International Limited Nil Nil 148,226,771(2) 7.63 148,226,771 7.63NutriAsia Pacific Limited 1,155,030,190(3) 59.44 Nil Nil 1,155,030,190 59.44NutriAsia Holdings Limited Nil Nil 1,155,030,190(4) 59.44 1,155,030,190 59.44NutriAsia Inc Nil Nil 1,155,030,190(4) 59.44 1,155,030,190 59.44Well Grounded Limited Nil Nil 1,155,030,190(4) 59.44 1,155,030,190 59.44Golden Chamber Investment Limited Nil Nil 1,155,030,190(4) 59.44 1,155,030,190 59.44Star Orchid Limited Nil Nil 1,155,030,190(4) 59.44 1,155,030,190 59.44HSBC Trustee (Hong Kong) Limited Nil Nil 1,303,256,961(6) 67.07 1,303,256,961 67.07HSBC International Trustee Limited Nil Nil 1,303,256,961(6) 67.07 1,303,256,961 67.07HSBC Private Banking Holdings (Suisse) SA Nil Nil 1,303,256,961(6) 67.07 1,303,256,961 67.07HSBC Finance (Netherlands) Nil Nil 1,303,256,961(6) 67.07 1,303,256,961 67.07HSBC Holdings Plc Nil Nil 1,303,256,961(6) 67.07 1,303,256,961 67.07Mr Joselito D Campos, Jr 7,621,466 0.39 1,303,256,961(6) 67.07 1,310,878,427 67.46Lee Foundation Nil Nil 106,854,000(7) 5.50 106,854,000 5.50Lee Foundation, States of Malaya Nil Nil 106,854,000(8) 5.50 106,854,000 5.50Lee Pineapple Company (Pte) Limited 100,422,000 5.17 6,432,000(7)(9) 0.33 106,854,000 5.50
Percentage of Shareholding in Public Hands
Based on the information provided, to the best knowledge of the Directors and Substantial Shareholders of the Company, approximately 27.6% of the Company’s shares are held in the hands of the public. Accordingly, the Company has complied with Rule 723 of the Listing Manual of the SGX-ST.
Notes:
1. The percentage of issued capital is calculated based on 1,943,214,106 issued Shares (excluding 1,721,720 treasury shares).
2. Bluebell Group Holdings Limited (“BGHL”) is wholly owned by Golden Sunflower International Limited (“GSIL”). GSIL is therefore deemed interested in the shares of the listed company held by BGHL. GSIL is wholly owned by HSBC Trustee (Hong Kong) Limited (“HKL”). HKL is the trustee of Twin Palms Pacific Trust, the beneficiaries of which are Mr Joselito D Campos, Jr (“JDC”) and his children and JDC is therefore interested in the 148,226,771 shares held by BGHL.
3. NutriAsia Pacific Limited (“NPL”) is a substantial and controlling shareholder of the Company, holding 1,155,030,190 shares in the Company. JDC and his family have beneficial interests in NPL (through Golden Chamber Investment Limited and Star Orchid Ltd which hold trusts in which they are beneficiaries). JDC is therefore deemed to be interested in the shares held by NPL.
4. NutriAsia Inc (“NI”) owns 57.8% of NutriAsia Holdings Limited (“NHL”), which in turn owns 100% of NPL. NI is therefore deemed to be interested in the shares held by NPL.
5. NPL holds 1,155,030,190 shares in the Company. NPL is wholly owned by NHL. NHL is therefore deemed interested in the shares held by NPL. NHL is in turn majority owned by NI (57.8%) and partly owned by Well Grounded Limited (“WGL”) (42.2%). NI and WGL are therefore deemed interested in the shares held by NPL. NI is in turn majority owned by Golden Chamber Investment Limited (“GCIL”) (65.4%) and WGL is in turn wholly owned by Star Orchid Limited (“SOL”). GCIL and SOL are therefore deemed interested in the shares held by NPL.
6. GCIL and SOL are wholly owned by two separate trusts (Twin Palms Pacific Trust and the Star Orchid Trust respectively) for which HKL acts as trustee. HKL is therefore deemed interested in the shares held by NPL and BGHL. The beneficiaries of the Star Orchid Trust are beneficially owned by the Campos family.
HKL is in turn, wholly owned by HSBC International Trustee Limited. HSBC International Trustee Limited is therefore deemed interested in the shares held by NPL and BGHL .
HSBC International Trustee Limited is wholly owned by HSBC Private Banking Holdings (Suisse) SA. HSBC Private Banking Holdings (Suisse) SA is therefore deemed interested in the shares held by NPL and BGHL .
HSBC International Trustee Limited is the trustee of the Twin Palms Pacific Trust, the beneficiaries of which are JDC and his children. HSBC Holdings Plc, HSBC International Trustee Limited, HKL and GCIL are therefore deemed to be interested in the shares held by NPL and BGHL .
HSBC Private Banking Holdings (Suisse) SA is in turn, wholly owned by HSBC Finance (Netherlands). HSBC Finance (Netherlands) is therefore deemed interested in the shares held by NPL and BGHL .
7. Lee Foundation, by virtue of its not less than 20% interest in Lee Pineapple Company (Pte) Limited, had a deemed interest in the Company’s shares in which Lee Pineapple Company (Pte) Limited had a direct or deemed interest.
8. Lee Foundation, States of Malaya, by virtue of its not less than 20% interest in Lee Pineapple Company (Pte) Limited, had a deemed interest in the Company’s shares in which Lee Pineapple Company (Pte) Limited had a direct or deemed interest.
9. Lee Pineapple Company (Pte) Limited is deemed interested in the 6,432,000 shares held by its wholly-owned subsidiary, Pineapples of Malaya Private Limited.
AN
NU
AL
RE
PO
RT
FY
20
17
DE
L M
ON
TE
PA
CIF
IC L
IMIT
ED
247246
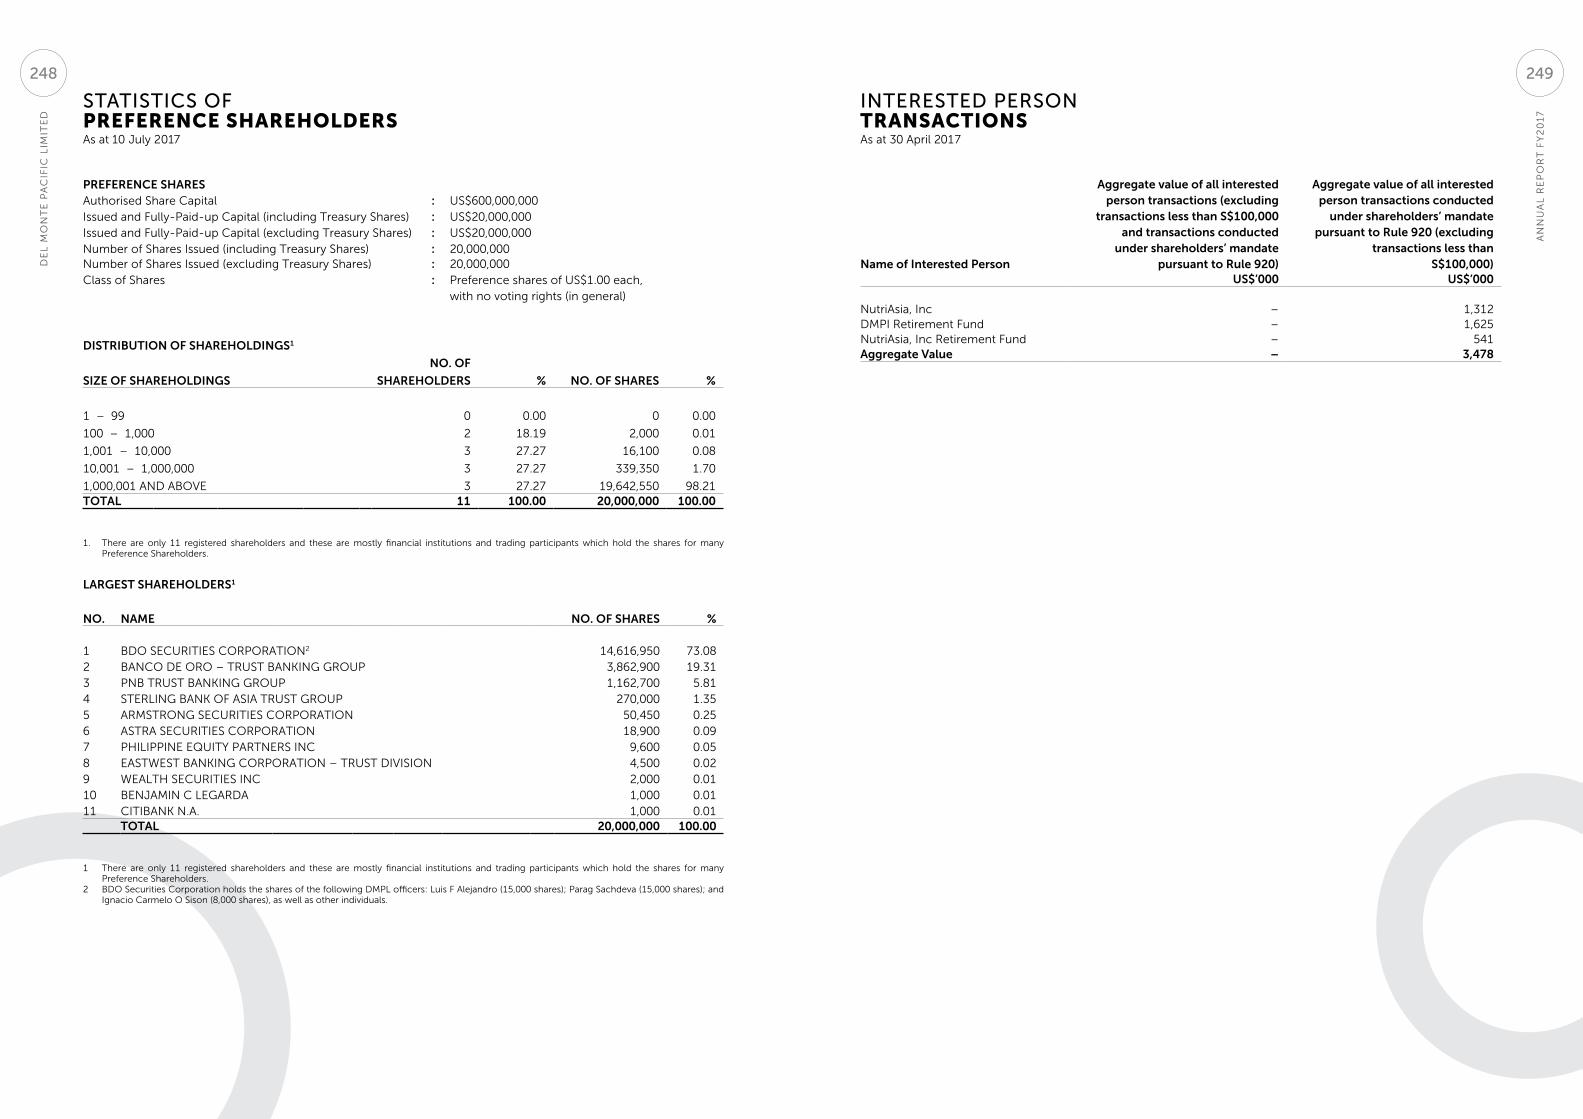
STATISTICS OF PREFERENCE SHAREHOLDERS As at 10 July 2017
PREFERENCE SHARESAuthorised Share Capital : US$600,000,000Issued and Fully-Paid-up Capital (including Treasury Shares) : US$20,000,000Issued and Fully-Paid-up Capital (excluding Treasury Shares) : US$20,000,000Number of Shares Issued (including Treasury Shares) : 20,000,000Number of Shares Issued (excluding Treasury Shares) : 20,000,000Class of Shares : Preference shares of US$1.00 each,
with no voting rights (in general)
DISTRIBUTION OF SHAREHOLDINGS1
NO. OF
SIZE OF SHAREHOLDINGS SHAREHOLDERS % NO. OF SHARES %
1 – 99 0 0.00 0 0.00
100 – 1,000 2 18.19 2,000 0.01
1,001 – 10,000 3 27.27 16,100 0.08
10,001 – 1,000,000 3 27.27 339,350 1.70
1,000,001 AND ABOVE 3 27.27 19,642,550 98.21TOTAL 11 100.00 20,000,000 100.00
1. There are only 11 registered shareholders and these are mostly financial institutions and trading participants which hold the shares for many Preference Shareholders.
LARGEST SHAREHOLDERS1
NO. NAME NO. OF SHARES %
1 BDO SECURITIES CORPORATION2 14,616,950 73.082 BANCO DE ORO – TRUST BANKING GROUP 3,862,900 19.313 PNB TRUST BANKING GROUP 1,162,700 5.814 STERLING BANK OF ASIA TRUST GROUP 270,000 1.355 ARMSTRONG SECURITIES CORPORATION 50,450 0.256 ASTRA SECURITIES CORPORATION 18,900 0.097 PHILIPPINE EQUITY PARTNERS INC 9,600 0.058 EASTWEST BANKING CORPORATION – TRUST DIVISION 4,500 0.029 WEALTH SECURITIES INC 2,000 0.0110 BENJAMIN C LEGARDA 1,000 0.0111 CITIBANK N.A. 1,000 0.01
TOTAL 20,000,000 100.00
1 There are only 11 registered shareholders and these are mostly financial institutions and trading participants which hold the shares for many Preference Shareholders.
2 BDO Securities Corporation holds the shares of the following DMPL officers: Luis F Alejandro (15,000 shares); Parag Sachdeva (15,000 shares); and Ignacio Carmelo O Sison (8,000 shares), as well as other individuals.
INTERESTED PERSON TRANSACTIONSAs at 30 April 2017
Name of Interested Person
Aggregate value of all interestedperson transactions (excluding
transactions less than S$100,000and transactions conducted
under shareholders’ mandatepursuant to Rule 920)
Aggregate value of all interestedperson transactions conducted
under shareholders’ mandatepursuant to Rule 920 (excluding
transactions less thanS$100,000)
US$’000 US$’000
NutriAsia, Inc – 1,312DMPI Retirement Fund – 1,625NutriAsia, Inc Retirement Fund – 541Aggregate Value – 3,478
AN
NU
AL
RE
PO
RT
FY
20
17
DE
L M
ON
TE
PA
CIF
IC L
IMIT
ED
249248
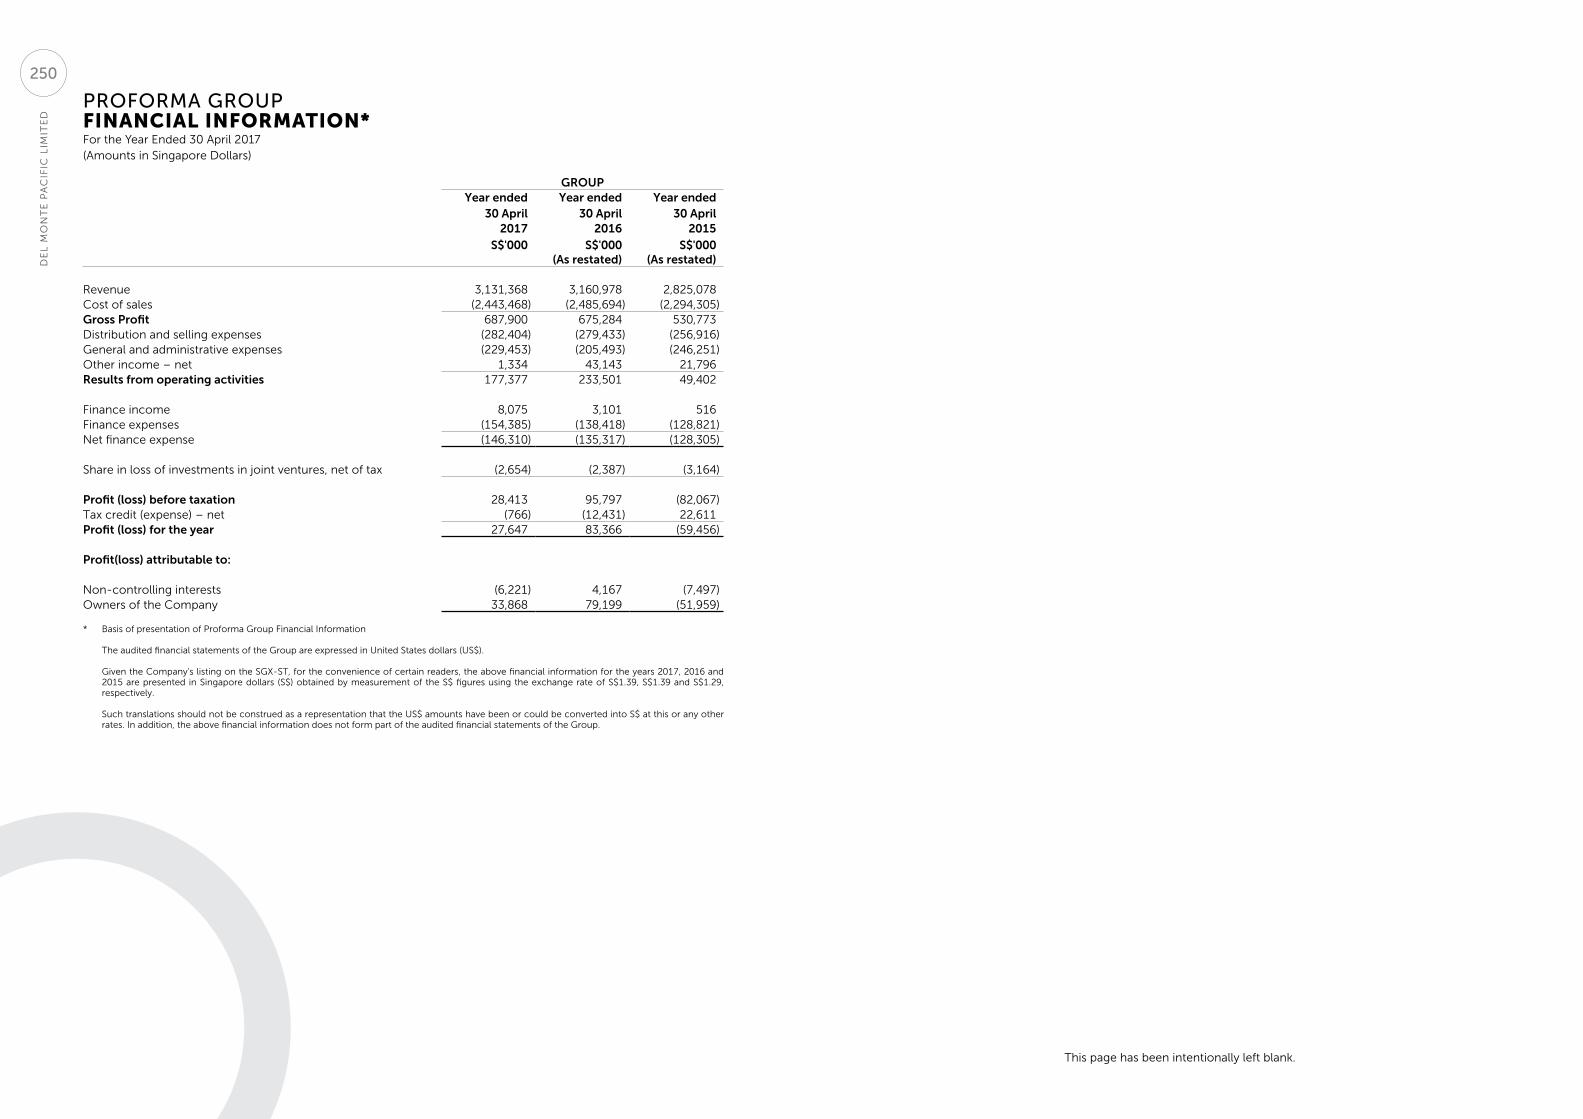
PROFORMA GROUP FINANCIAL INFORMATION*For the Year Ended 30 April 2017 (Amounts in Singapore Dollars)
This page has been intentionally left blank.
GROUPYear ended
30 AprilYear ended
30 AprilYear ended
30 April2017 2016 2015
S$'000 S$'000(As restated)
S$'000 (As restated)
Revenue 3,131,368 3,160,978 2,825,078 Cost of sales (2,443,468) (2,485,694) (2,294,305)Gross Profit 687,900 675,284 530,773 Distribution and selling expenses (282,404) (279,433) (256,916)General and administrative expenses (229,453) (205,493) (246,251)Other income – net 1,334 43,143 21,796 Results from operating activities 177,377 233,501 49,402 Finance income 8,075 3,101 516 Finance expenses (154,385) (138,418) (128,821)Net finance expense (146,310) (135,317) (128,305)
Share in loss of investments in joint ventures, net of tax (2,654) (2,387) (3,164)
Profit (loss) before taxation 28,413 95,797 (82,067)Tax credit (expense) – net (766) (12,431) 22,611 Profit (loss) for the year 27,647 83,366 (59,456) Profit(loss) attributable to:
Non-controlling interests (6,221) 4,167 (7,497)Owners of the Company 33,868 79,199 (51,959) * Basis of presentation of Proforma Group Financial Information
The audited financial statements of the Group are expressed in United States dollars (US$).
Given the Company's listing on the SGX-ST, for the convenience of certain readers, the above financial information for the years 2017, 2016 and 2015 are presented in Singapore dollars (S$) obtained by measurement of the S$ figures using the exchange rate of S$1.39, S$1.39 and S$1.29, respectively.
Such translations should not be construed as a representation that the US$ amounts have been or could be converted into S$ at this or any other rates. In addition, the above financial information does not form part of the audited financial statements of the Group.
DE
L M
ON
TE
PA
CIF
IC L
IMIT
ED
250

CorporateinforMation
board oF direCtors
Mr Rolando C Gapud executive Chairman
Mr Joselito D Campos, Jr Managing Director and Ceo
Mr edgardo M Cruz, Jrexecutive Director
Mr Benedict Kwek Gim Songlead Independent Director
Mr Godfrey e Scotchbrook Independent Director
Dr emil q JavierIndependent Director
Mrs Yvonne Goh Independent Director
audit and risk Committee
Mr Benedict Kwek Gim SongChairman and lead Independent Director
Mr Godfrey e Scotchbrook Independent Director
Dr emil q Javier Independent Director
Mrs Yvonne GohIndependent Director
nominating and Corporate goVernanCe Committee
Mr Godfrey e Scotchbrook Chairman and Independent Director
Mr Benedict Kwek Gim Songlead Independent Director
Dr emil q Javier Independent Director
Mrs Yvonne GohIndependent Director
Mr Rolando C Gapud Board executive Chairman
Mr edgardo M Cruz, Jrexecutive Director
remuneration and share option Committee
Mr Godfrey e Scotchbrook Chairman and Independent Director
Mr Benedict Kwek Gim Songlead Independent Director
Dr emil q Javier Independent Director
Mrs Yvonne GohIndependent Director
eXeCutiVe oFFiCers
Mr Joselito D Campos, Jr Managing Director and Chief executive officer
Mr luis F AlejandroChief operating officer
Mr Ignacio C o Sison Chief Corporate officer
Mr parag Sachdeva Chief Financial officer
Mr Antonio e S ungsonChief legal Counsel, Chief Compliance officer andCompany Secretary
Mr Ruiz G SalazarChief Human Resource officer
Ms Ma Bella B JavierChief Scientific officer
Company seCretary
Mr Antonio e S ungson10/F JY Campos Centre9th Avenue corner 30th StreetBonifacio Global Citytaguig City 1634philippinestel : +632 856 2888 Fax: +632 856 2628
auditors
SyCip Gorres Velayo & Co(A member firm of ernst and Young)6760 Ayala Avenue1226 Makati Cityphilippinespartner in-charge: Catherine e lopez(Date of appointment: since financial year ended 30 April 2016)
ernst & Young llpone Raffles quaynorth tower, level 18Singapore 048583partner in-charge: phua, Chun Yen Alvin(Date of appointment: since financial year ended 30 April 2016)
bankers
BDo universal Bank, IncBank of the philippines IslandsBank of tokyo Mitsubishi – uFJ ltd Citibank nADBS Bank ltdHongkong and Shanghai Banking Corp ltdMetropolitan Bank and trust Cophilippine national BankRabobank InternationalRizal Commercial Banking Corporation
registered oFFiCe
Craigmuir Chamberspo Box 71 Road town, tortola, British Virgin Islands tel : +284 494 2233 Fax : +284 494 3547
singapore share transFer agent
Boardroom Corporate & Advisory Services pte ltd50 Raffles place #32-01 Singapore land tower Singapore 048623 tel: +65 6536 5355Fax: +65 6536 1360
philippines share transFer agent
BDo unibank Inc - Securities Services and Corporate Agencies Department15F South tower, BDo Corporate Center7899 Makati Ave, Makati City 0726, philippinestel: +632 878 4963Fax: +632 878 4056
bVi registrar and share transFer oFFiCe
nerine trust Company (BVI) limited po Box 905 quastisky BuildingRoad town, tortola VG 1110, British Virgin Islands
listing & trading symbols
listed on 2 August 1999 on the Singapore exchange listed on 10 June 2013 on the philippine Stock exchangeBloomberg: DelM Sp and DMpl pM, and DMpA1 pM for the preference SharesReuters: DMpl.SI and DMpl.pS, and DMpA1.pS for the preference Shares
trademarks
Del Monte, Del Monte Quality and Shield in Colour are principal registered trademarks of the Group for packaged food and beverage products in the uSA, South America, the philippines, Myanmar and Indian subcontinent territories. the Group owns the S&W trademarks worldwide except for Australia and new Zealand. the Group’s other trademarks include, amongst other trademarks in various jurisdictions, Contadina, College Inn, Fruit Naturals, Orchard Select, SunFresh, Fruit Refreshers, Veg-All, Freshlike, Popeye, Princella and Allens’ in the uSA, and Today’s, Fiesta, 202, Fit ‘n Right, Heart Smart and Quick ‘N Easy in the philippines.
For further enquiries please contact:
Investor Relations and Business office Ms Jennifer Y luyDMpl Management Services pte ltd 17 Bukit pasoh RdSingapore 089831 tel : +65 6324 6822 Fax : +65 6221 9477 [email protected] page has been intentionally left blank.

Del Monte Pacific liMiteDc/o 17 Bukit Pasoh Rd, Singapore 089831Tel +65 6324 6822 | Fax +65 6221 9477
Email: [email protected]
www.delmontepacific.com