deicing impacts on the danforth campus, fall 2020
TRANSCRIPT

I405: Sustainability
Exchange
Lucy Armstrong, Kaela Evans, Kelly Fujimoto,
Sydney Hornitschek, and Genna Torgan
Focal Pointe Clients: Cody Azotea and Chris
Anderson
Instructor: Dr. Avni Solanki
December 20, 2020
Deicing Impacts on the Danforth Campus
1
Table of Contents
Introduction ..................................................................................................... 2
Objectives ................................................................................................................ 3
Methodology ..................................................................................................... 3
Procedure ................................................................................................................ 4
Results ............................................................................................................... 5
Discussion ............................................................................................................... 7
Soil Amendments .................................................................................................. 8
GIS Development ............................................................................................. 8
Recommendations and Conclusion ................................................................ 9
References ............................................................................................................. 10
Appendices ..................................................................................................... 11
Appendix A: Raw Data.......................................................................................... 11
Appendix B: Soil Amendments Procedure ......................................................... 13
Appendix C: Description of GIS Trajectory .................................................. 14
2
INTRODUCTION
Deicing is a practice utilized to remove snow or ice from a surface. Salts such as sodium
chloride (NaCl) and magnesium chloride (MgCl2) are commonly used as deicing materials because
they lower the freezing point of water, thus allowing snow and ice to melt more easily. Chloride-
based deicers are generally the least expensive and most common deicers on the market. NaCl is
the material most often used for deicing in the United States, whereas MgCl2 is generally more
expensive and allows for an even lower practical melting temperature.1
It is crucial that deicing is conducted on Washington University’s Danforth campus to
prevent pedestrians from slipping and falling on walkways. Insufficient salting could create a
public safety risk, but over-salting also has its drawbacks. Although deicing is necessary to
maintain pedestrian safety, the salts used in deicers can lead to visible deterioration of the soil,
killing grass and other foliage. One indicator of this damage is the soil’s electrical conductivity,
which is a measure of salt content; it can signify crop yield, plant nutrient availability, and general
soil health. According to the USDA, increasing electrical conductivity has an inverse effect on
soil microorganism activity, impacting a number of different soil processes including respiration,
residue decomposition, nitrification, and denitrification.2 Additionally, conductivity levels can
indicate water and nutrient availability, which impacts the soil’s needs and treatment methods.
Thus, excessive salting not only can lead to inefficient spending and environmental damage, but
also contributes indirect costs to the university such as those incurred by damaged property and
plant material.
These consequences are some of the primary examples of the negative implications of
under- and over-salting. Hence, the direct purpose of this project is to minimize these effects,
ultimately working to strike a balance between maintaining public safety and respecting nature.
Indirectly, these efforts also aim to encourage students and other passersby to become more
conscious of how seemingly insignificant acts, such as straying from a walkway or shuffling to
class in the snow, can have severe consequences on the environment. To achieve this goal, this
project’s principal objective was to collect samples at three different areas on Washington
University’s Danforth campus and compare their conductivity, pH, and temperature readings to a
fourth, baseline location. In addition to this, a GIS application was further developed to facilitate
reporting of over- and under-salting on campus. Finally, an experimental plan was established to

3
evaluate the efficacy of select soil amendments and their ability to improve soil health. The main
project objectives and associated plan of action can be found in Table 1.
Table 1 Project objectives and primary action taken to implement goals
Objective Plan of Action
1. Analyze soil quality on campus Measure conductivity, pH, and temperature of
soil from 4 different locations on campus
2. Mitigate under-salting and over-salting on
campus
Develop GIS application with crowd-sourcing
feature
3. Improve soil health on campus Investigate potential of certain soil
amendments
METHODOLOGY
Soil samples were collected from Mudd Field, Oak Allée, and the East End of Washington
University’s Campus; these locations are marked on Figure 1. Given that certain areas of
Brookings Quadrangle experience minimal foot traffic and no deicing, this location was used as a
control or baseline site. These areas were chosen based on their varying soil types and levels of
foot traffic.
Fig. 1 Map of Danforth Campus containing sampling sites (1. Mudd Field, 2. Oak Allée, 3.
East End) obtained from ArcGIS.
The soil on Mudd Field is dry and clay-like and experiences heavy foot traffic during the
school year. Oak Allée is more of a “classic” soil and is located near a drain. The East End,
meanwhile, has relatively healthy, sandy soil. Sampling days were chosen based on weather
events, as rain, snow, and lack thereof can have varying effects on the soil’s properties. The
4
samples were taken in 30-centimeter increments starting from the edge of the sidewalk and moving
outwards, which allowed soil properties to be analyzed at different distances from primary
walkways. Given that people kick salt onto the grass and soil when they utilize these sidewalks, it
is expected that salt concentration and conductivity will decrease with increasing distance from
the walkways.
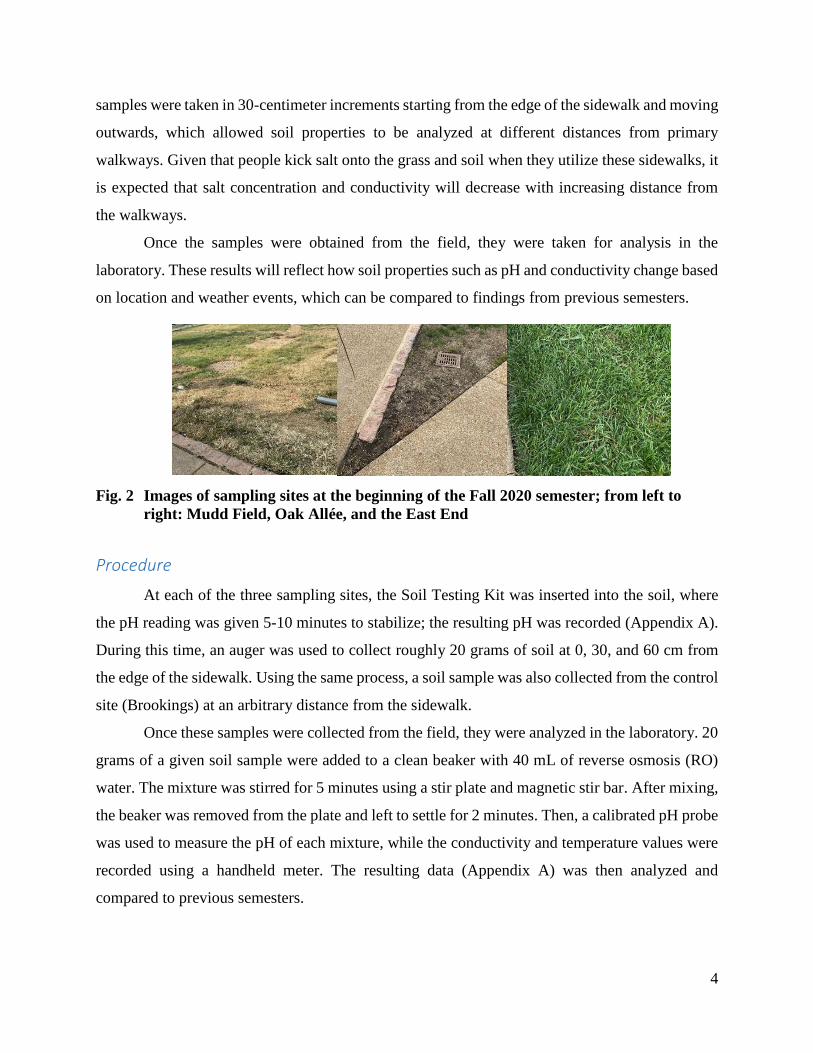
Once the samples were obtained from the field, they were taken for analysis in the
laboratory. These results will reflect how soil properties such as pH and conductivity change based
on location and weather events, which can be compared to findings from previous semesters.
Fig. 2 Images of sampling sites at the beginning of the Fall 2020 semester; from left to
right: Mudd Field, Oak Allée, and the East End
Procedure
At each of the three sampling sites, the Soil Testing Kit was inserted into the soil, where
the pH reading was given 5-10 minutes to stabilize; the resulting pH was recorded (Appendix A).
During this time, an auger was used to collect roughly 20 grams of soil at 0, 30, and 60 cm from
the edge of the sidewalk. Using the same process, a soil sample was also collected from the control
site (Brookings) at an arbitrary distance from the sidewalk.
Once these samples were collected from the field, they were analyzed in the laboratory. 20
grams of a given soil sample were added to a clean beaker with 40 mL of reverse osmosis (RO)
water. The mixture was stirred for 5 minutes using a stir plate and magnetic stir bar. After mixing,
the beaker was removed from the plate and left to settle for 2 minutes. Then, a calibrated pH probe
was used to measure the pH of each mixture, while the conductivity and temperature values were
recorded using a handheld meter. The resulting data (Appendix A) was then analyzed and
compared to previous semesters.
5
0
500
1000
1500
2000
2500
3000
3500
4000
1
Conduct
ivit
y (
μS
/cm
)
Distance From Sidewalk (cm)
Mudd Field East End Oak Allee Brookings
RESULTS
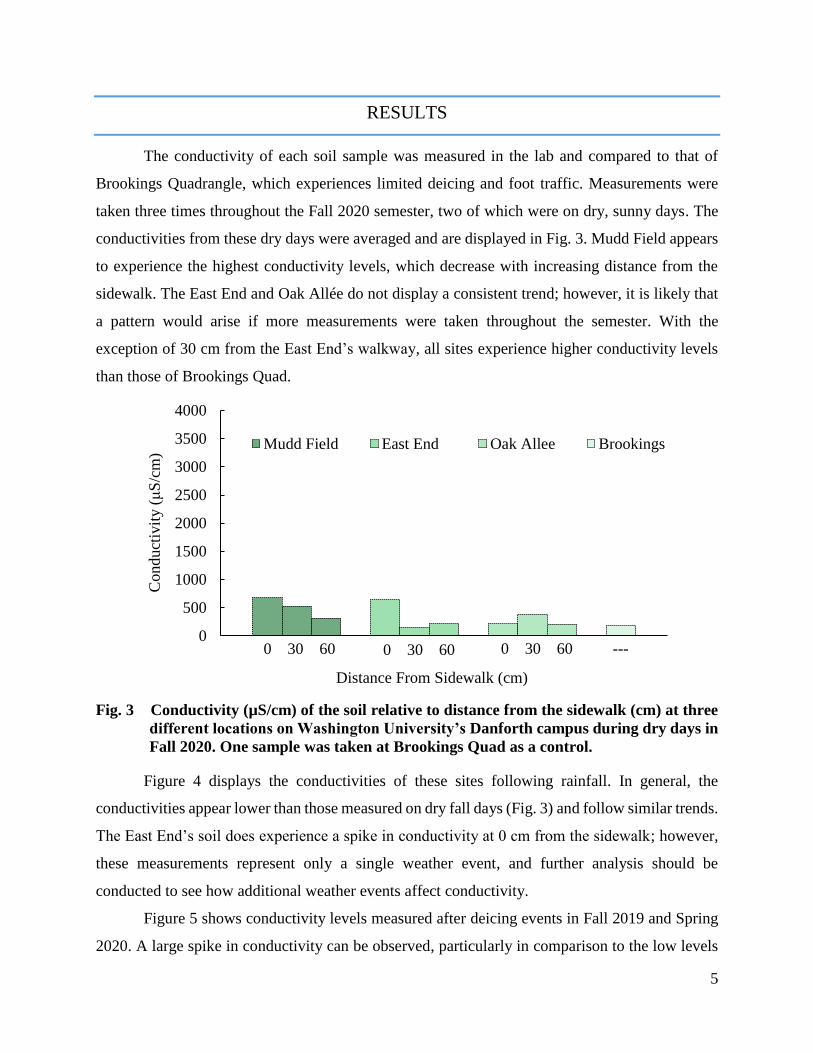
The conductivity of each soil sample was measured in the lab and compared to that of
Brookings Quadrangle, which experiences limited deicing and foot traffic. Measurements were
taken three times throughout the Fall 2020 semester, two of which were on dry, sunny days. The
conductivities from these dry days were averaged and are displayed in Fig. 3. Mudd Field appears
to experience the highest conductivity levels, which decrease with increasing distance from the
sidewalk. The East End and Oak Allée do not display a consistent trend; however, it is likely that
a pattern would arise if more measurements were taken throughout the semester. With the
exception of 30 cm from the East End’s walkway, all sites experience higher conductivity levels
than those of Brookings Quad.
Fig. 3 Conductivity (µS/cm) of the soil relative to distance from the sidewalk (cm) at three
different locations on Washington University’s Danforth campus during dry days in
Fall 2020. One sample was taken at Brookings Quad as a control.
Figure 4 displays the conductivities of these sites following rainfall. In general, the
conductivities appear lower than those measured on dry fall days (Fig. 3) and follow similar trends.
The East End’s soil does experience a spike in conductivity at 0 cm from the sidewalk; however,
these measurements represent only a single weather event, and further analysis should be
conducted to see how additional weather events affect conductivity.
Figure 5 shows conductivity levels measured after deicing events in Fall 2019 and Spring
2020. A large spike in conductivity can be observed, particularly in comparison to the low levels
0 30 60 0 30 60 0 30 60 ---

6
depicted in Fig. 6, which displays the average conductivity following rainfall in previous
semesters. As observed in the Fall 2020 semester, Mudd Field appears to have the highest
conductivity of the locations analyzed.
Fig. 4 Soil conductivity relative to distance from the sidewalk at three different locations
on Washington University’s Danforth campus following rainfall in Fall 2020. One
sample was taken at Brookings Quad as a control.
Fig. 5 Soil conductivity relative to distance from the sidewalk at three different locations
on Washington University’s Danforth campus in Fall 2019 and Spring 2020 after
snow and deicing had recently occurred. One sample was taken at Brookings Quad
as a control.
0
500
1000
1500
2000
2500
3000
3500
4000
1
Co
nduct
ivit
y (
μS
/cm
)
Distance From Sidewalk (cm)
Mudd Field East End Oak Allee Brookings
0 30 60 0 30 60 0 30 60 ---
0
500
1000
1500
2000
2500
3000
3500
4000
1
Conduct
ivit
y (
μS
/cm
)
Distance From Sidewalk (cm)
Mudd Field East End Oak Allee Brookings
0 30 60 0 30 60 0 30 60 ---

7
Fig. 6 Soil conductivity relative to distance from the sidewalk at three different locations
on Washington University’s Danforth campus following rainfall in Fall 2019 and
Spring 2020. One sample was taken at Brookings Quad as a control.
Discussion
Comparing the results in Fig. 5 to the data collected on days not following a deicing event,
it is clear that the soil’s conductivity levels increase following deicing events. This can be
expected, as the primary deicing materials used on campus have a high salt content and will
naturally give rise to higher conductivity levels. Both Fig. 4 and 6 show that rainfall has the
opposite effect on conductivity, with levels decreasing even lower than those observed on dry
days. This trend can be attributed to the fact that salts move with water, meaning that rain will
carry soluble salts deeper into the soil or into nearby drains, thus lowering the conductivity.
Regardless of weather conditions, Mudd Field most often displays the highest conductivity
of the sites measured. This could be for a variety of reasons, one of which may be the soil type
itself. Clay soils typically give rise to higher conductivity than other soil textures, and so Mudd
Field may naturally retain greater salt content.3 Furthermore, it is likely that Mudd Field
experiences the most foot traffic of the locations considered, and more people will trek deicers
onto the grass and soil as a result. While no deicing events were observed in the Fall 2020 semester,
it could be valuable to see how this trend may change in Spring 2021; given that COVID testing
now occurs on Mudd Field, more pedestrians will be drawn to this site than other areas of campus.
In contrast, the East End encounters the least amount of foot traffic of the three primary locations,
which may explain its relatively low conductivity levels.
0
500
1000
1500
2000
2500
3000
3500
4000
1
Conduct
ivit
y (
μS
/cm
)
Distance From Sidewalk (cm)
Mudd Field East End Oak Allee Brookings
0 30 60 0 30 60 0 30 60 ---

8
Soil Amendments
Although deicers cause significant damage to soil, adding soil amendments can help restore
the soil’s nutrients. Currently, Focal Pointe applies gypsum to the campus soil annually; while
gypsum does help aerate the soil and retain its moisture, it is not the only option that does so. This
semester, biochar, sphagnum peat moss, and lime were investigated as possible amendments of
interest. Biochar can potentially lower salinity and improve soil health; similarly, sphagnum peat
lowers pH and holds moisture in the soil. Lime can also be used to adjust soil pH, and although it
is slightly less promising than the others, experimentation would still provide valuable information
on its effects.4 Unfortunately, time did not permit for these effects to be tested. A preliminary
procedure (Appendix B) was developed to provide a starting point for future groups that may wish
to pursue this research. By conducting these experiments and analyzing the results, future groups
could provide useful recommendations to Focal Pointe regarding the use of soil amendments.
GIS Development
Building off the progress made in Spring 2020, the trajectory of the GIS component of this
project was altered during the Fall 2020 semester. The purpose of this project was to utilize
feedback from the WashU community to determine where there may be over- or under-salting on
the Danforth campus. As previously discussed, there are dangers to both over- and under-salting;
too much can be hazardous to the soil, but too little increases the likelihood of pedestrians injuring
themselves. The creation of a GIS application could allow these deicing techniques to be
monitored. In the previous semester, the app consisted of a survey that students and staff could
complete upon noticing either inadequate or extreme salting. This semester, the app was enhanced
and based off a crowdsourcing application consisting of a map of the Danforth Campus; this allows
for WashU students and staff to pinpoint the exact location of the observed discrepancy. Using QR
codes that will be placed throughout campus, the WashU community can report on any
questionable salting they encounter. This data will be accessible to Focal Pointe and enable them
to monitor and adjust their salting practices. Unfortunately, due to time constraints and other
roadblocks, the app is not yet at a working stage. The same goes with the establishment of the QR
codes, but more time and effort, it should be up and running by next semester if the incoming
group chooses to further its development. A preliminary procedure detailing the app’s progress
and future steps can be found in Appendix C.

9
RECOMMENDATIONS & CONCLUSION
In nearly all sampling cases, an expected decrease in soil conductivity with increasing
distance from the sidewalk was observed. This trend becomes most evident following snow and
subsequent deicing events, as pedestrians track salt onto the grass when they utilize freshly treated
walkways. Following rainfall, however, conductivity levels decrease dramatically, as water travels
through the soil and carries soluble ions away from sampling sites. It is recommended that future
groups investigate ways to mitigate the resulting soil damage through the exploration of soil
amendments, which would involve laboratory tests and a cost-benefit analysis. Furthermore, the
groundwork has been laid for the development of a GIS app that will allow members of the WashU
community to report on over-salting and under-salting on the Danforth campus. While the
application is not currently operable, future groups can work to enhance its robustness so that it
can be implemented and utilized by Focal Pointe. It is the hope that with these recommendations,
future groups can find further success in not only minimizing the campus’s costs and soil damage,
but also making it a safer and more flourishing environment.
10
References
(1) How Salt Works and Overview of Deicing Chemicals. https://stormwater.pca.state.mn.
us/index.php/How_salt_works_and_overview_of_deicing_chemicals (accessed Dec 14, 2020).
(2) Soil Electrical Conductivity. https://www.nrcs.usda.gov/Internet/FSE_DOCUMENTS/nr
cs142p2_053280.pdf (accessed Dec 14, 2020).
(3) Soil Quality Indicators. https://www.nrcs.usda.gov/wps/PA_NRCSConsumption/downloa
d?cid=nrcs142p2_053136&ext=pdf (accessed Dec. 27, 2020).
(4) Preparing Soil for Planting. https://www.almanac.com/preparing-soil-planting (accessed
Dec 14, 2020)
(5) Salinity Conversion Calculator. https://www.hamzasreef.com/Contents/Calculators/Salin
ityConversion.php (accessed Dec. 14, 2020).
(6) Wakefield BioChar. Test. Test. And Test Again. How Much Biochar Should You Use?
https://www.wakefieldbiochar.com/test-test-and-test-again-how-much-biochar-should-you-use/
(accessed Dec. 14, 2020).
(7) Epic Gardening. Peat Moss in the Garden – Sphagnum Peat Moss Uses.
https://www.epicgardening.com/peat-moss/ (accessed Dec. 14, 2020).
(8) Lawn Solutions Australia. Should I apply lime to my lawn?
https://lawnsolutionsaustralia.com.au/lawn-care/apply-lime lawn/#:~:text=Lime%20treatment&
text=If%20you%20have%20a%20heavier,any%20shock%20to%20your%20lawn.

11
APPENDICES
The following appendices include raw data from the lab experiments and field
measurements, a procedure for soil amendment experiments to be performed in the future, and a
detailed description of the next steps for the GIS application development.
Appendix A: Raw Data Collection
Tables A1-A3 display the values measured (temperature, pH, and conductivity) for each
sample in the lab in addition to calculated values (total dissolved solids and salinity). The total
dissolved solids (TDS) values were calculated as follows:
TDS = 0.64σ
where TDS represents the total dissolved solids in the soil (ppm) and σ represents the electrical
conductivity of the soil (μS). The salinity values (ppt) were calculated from the conductivities
using an online conversion tool.5 Tables A4-A6, meanwhile, display the raw data from field testing
at each of the soil sites.
Table A1 Sampling data from 10/08/2020, including distance from the sidewalk (cm),
temperature (°C), pH, conductivity (μS), TDS (ppm), and salinity (ppt). In
addition to the three main locations, one sample was also taken at Brookings
Quadrangle as a control.
Location Distance
(cm) Temperature
(°C) pH
Conductivity (μS)
TDS (ppm)
Salinity (ppt)
East End 0 22.8 7.57 305.0 195.2 0.15
30 22.0 7.62 197.2 126.2 0.10
60 21.9 7.50 193.1 123.6 0.09
Oak Allee 0 21.7 8.29 230.0 147.2 0.11
30 21.5 7.71 561.0 359.0 0.27
60 21.7 7.05 303.0 193.9 0.15
Mudd Field 0 21.2 8.46 968.0 619.5 0.48
30 22.3 7.85 738.0 472.3 0.36
60 21.2 7.11 496.0 317.4 0.24
Brookings - 21.7 7.06 182.5 116.8 0.09
12
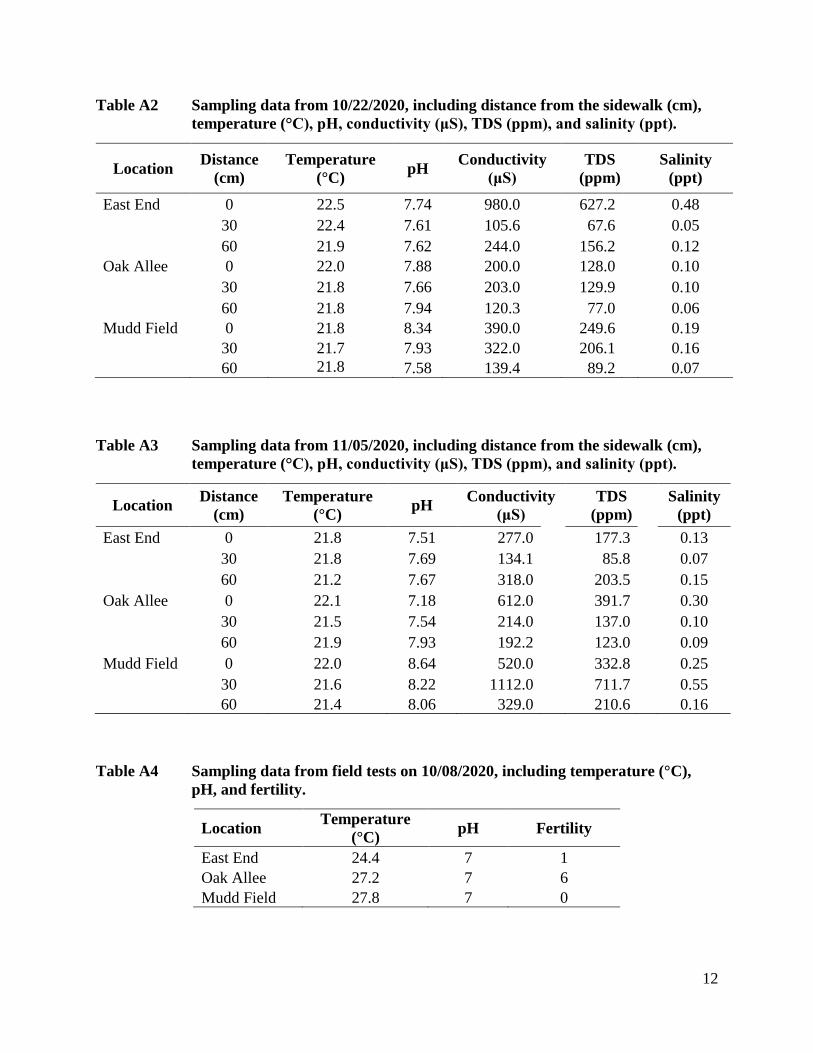
Table A2 Sampling data from 10/22/2020, including distance from the sidewalk (cm),
temperature (°C), pH, conductivity (μS), TDS (ppm), and salinity (ppt).
Location Distance
(cm)
Temperature
(°C) pH
Conductivity
(μS)
TDS
(ppm)
Salinity
(ppt)
East End 0 22.5 7.74 980.0 627.2 0.48
30 22.4 7.61 105.6 67.6 0.05
60 21.9 7.62 244.0 156.2 0.12
Oak Allee 0 22.0 7.88 200.0 128.0 0.10
30 21.8 7.66 203.0 129.9 0.10
60 21.8 7.94 120.3 77.0 0.06
Mudd Field 0 21.8 8.34 390.0 249.6 0.19
30 21.7 7.93 322.0 206.1 0.16
60 21.8 7.58 139.4 89.2 0.07
Table A3 Sampling data from 11/05/2020, including distance from the sidewalk (cm),
temperature (°C), pH, conductivity (μS), TDS (ppm), and salinity (ppt).
Location Distance
(cm)
Temperature
(°C) pH
Conductivity
(μS)
TDS
(ppm)
Salinity
(ppt)
East End 0 21.8 7.51 277.0 177.3 0.13
30 21.8 7.69 134.1 85.8 0.07
60 21.2 7.67 318.0 203.5 0.15
Oak Allee 0 22.1 7.18 612.0 391.7 0.30
30 21.5 7.54 214.0 137.0 0.10
60 21.9 7.93 192.2 123.0 0.09
Mudd Field 0 22.0 8.64 520.0 332.8 0.25
30 21.6 8.22 1112.0 711.7 0.55
60 21.4 8.06 329.0 210.6 0.16
Table A4 Sampling data from field tests on 10/08/2020, including temperature (°C),
pH, and fertility.
Location Temperature
(°C) pH Fertility
East End 24.4 7 1
Oak Allee 27.2 7 6
Mudd Field 27.8 7 0

13
Table A5 Sampling data from field tests on 10/22/2020, including temperature (°C),
pH, and fertility.
Location Temperature pH Fertility
(°C)
East End 25.6 1 7
Oak Allee 22.8 5 5.9
Mudd Field 30.0 4 7
Table A6 Sampling data from field tests on 11/05/2020, including temperature (°C),
pH, and fertility.
Location Temperature pH Fertility
(°C)
East End 16.1 0 7
Oak Allee 19.4 5 7
Mudd Field 20.6 0 7
Appendix B: Soil Amendments Procedure
To test the effect of soil amendments on soil health, future groups should consider using a
procedure similar to that utilized for soil sampling. While any of the sampling sites can be used as
the soil base, it is recommended that samples from Mudd Field be chosen, as this clay-like soil’s
health has the most room for improvement. 20 grams of this soil should be added to a beaker with
the corresponding amount of amendment listed in Table A7. After adding 40 mL of RO water to
the mixture, the solution should be mixed for 5 minutes with a stir plate and magnetic stir bar.
After this, it should be removed from the stir plate and given 2 minutes to rest. Once the solution
has settled, the pH, temperature, and conductivity of the mixture can be measured, and this process
should be repeated for each amendment listed in Table A7. By comparing these results to the
control sample, recommendations can be made about the potential of soil amendments investigated
in this experiment.
Table A7 Amounts of soil and soil amendment to be mixed in a 100 mL beaker with 40
mL of RO water
Amendment g of Amendment Added g of Soil Added
None (Control) 0 20
Biochar 6 10 10
Sphagnum Peat 7 5 15
Lime 8 *units must be converted 300-400 *Per 1 m2 of soil
14
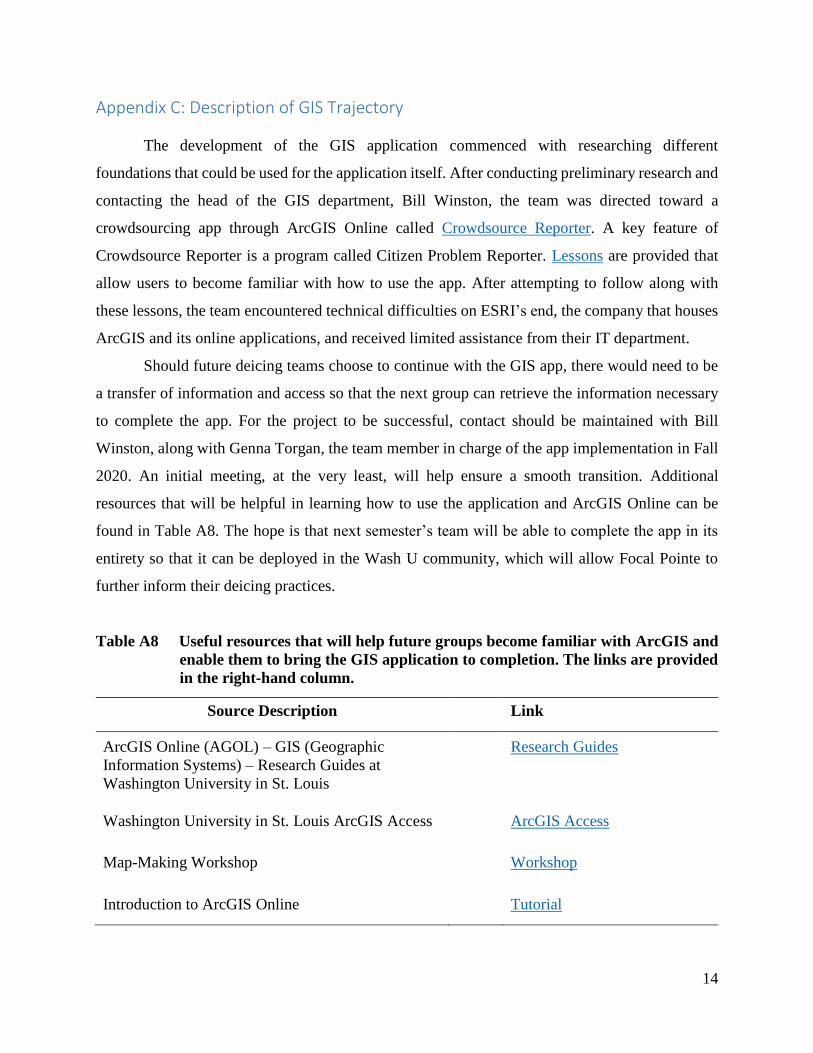
Appendix C: Description of GIS Trajectory
The development of the GIS application commenced with researching different
foundations that could be used for the application itself. After conducting preliminary research and
contacting the head of the GIS department, Bill Winston, the team was directed toward a
crowdsourcing app through ArcGIS Online called Crowdsource Reporter. A key feature of
Crowdsource Reporter is a program called Citizen Problem Reporter. Lessons are provided that
allow users to become familiar with how to use the app. After attempting to follow along with
these lessons, the team encountered technical difficulties on ESRI’s end, the company that houses
ArcGIS and its online applications, and received limited assistance from their IT department.
Should future deicing teams choose to continue with the GIS app, there would need to be
a transfer of information and access so that the next group can retrieve the information necessary
to complete the app. For the project to be successful, contact should be maintained with Bill
Winston, along with Genna Torgan, the team member in charge of the app implementation in Fall
2020. An initial meeting, at the very least, will help ensure a smooth transition. Additional
resources that will be helpful in learning how to use the application and ArcGIS Online can be
found in Table A8. The hope is that next semester’s team will be able to complete the app in its
entirety so that it can be deployed in the Wash U community, which will allow Focal Pointe to
further inform their deicing practices.
Table A8 Useful resources that will help future groups become familiar with ArcGIS and
enable them to bring the GIS application to completion. The links are provided
in the right-hand column.
Source Description Link
ArcGIS Online (AGOL) – GIS (Geographic
Information Systems) – Research Guides at
Washington University in St. Louis
Research Guides
Washington University in St. Louis ArcGIS Access ArcGIS Access
Map-Making Workshop Workshop
Introduction to ArcGIS Online Tutorial