degrees of freedom in low rank matrix estimationmy2550/papers/matcp.pdf1971; gower and hand, 1996),...
TRANSCRIPT

Degrees of Freedom in Low Rank Matrix Estimation
Ming Yuan†
Georgia Institute of Technology
(November 18, 2011)
Abstract
The objective of this paper is to quantify the complexity of rank and nuclear norm
constrained methods for low rank matrix estimation problems. Specifically, we derive
analytic forms of the degrees of freedom for these types of estimators in several com-
mon settings. These results provide efficient ways of comparing different estimators
and eliciting tuning parameters. Moreover, our analyses reveal new insights on the be-
havior of these low rank matrix estimators. These observations are of great theoretical
and practical importance. In particular, they suggest that, contrary to conventional
wisdom, for rank constrained estimators the total number of free parameters underes-
timates the degrees of freedom, whereas for nuclear norm penalization, it overestimates
the degrees of freedom. In addition, when using most model selection criteria to choose
the tuning parameter for nuclear norm penalization, it oftentimes suffices to entertain a
finite number of candidates as opposed to a continuum of choices. Numerical examples
are also presented to illustrate the practical implications of our results.
Keywords: Degrees of freedom, low rank matrix approximation, matrix completion, model
selection, multivariate linear regression, nuclear norm penalization, reduced rank regression,
singular value decomposition, Stein’s unbiased risk estimator.
† H. Milton Stewart School of Industrial and Systems Engineering, Georgia Institute of Technology,
Atlanta, GA 30332. This research was supported in part by NSF Career Award DMS-0846234.
1

1 Introduction
The problem of low-rank matrix estimation naturally arises in a number of statistical and
machine learning tasks. Prominent examples include multivariate linear regression, factor
analysis, relational learning, multi-task learning, and matrix completion among many others.
Numerous estimation methods have been developed in these contexts. Two of the most
popular approaches are the rank constrained estimator, also called as reduced rank regression
in the context of multivariate linear regression; and the nuclear norm regularized estimator,
oftentimes referred to as matrix Lasso. A challenge common to both methods is how to
effectively choose the tuning parameter and more fundamentally, how to assess the accuracy
of an estimator having constructed it from a set of observations. It is well known that this
goal cannot be achieved by simply measuring the estimator’s fidelity to the same data on
which it is computed, which inevitably leads to overoptimism about its performance (see, e.g.,
Efron, 1983; 1986). This issue is usually addressed by recalibrating the goodness of fit of an
estimating procedure according to its complexity, a familiar idea behind the likes of Akaike
information criterion (Akaike, 1973), Mallow’s Cp (Mallows, 1973), Bayesian information
criterion (Schwartz, 1978), generalized cross-validation (Craven and Wahba, 1979), Stein’s
unbiased risk estimate (Stein, 1981), and risk inflation criterion (Foster and George, 1994),
to name a few. A recurring notion among these techniques is the so-called degrees of freedom
which measures the complexity of an estimating procedure.
The importance of degrees of freedom in model assessment has long been recognized.
Donoho and Johnstone (1995) derived an unbiased estimator of the degrees of freedom for
soft thresholding and used it to find the optimal shrinkage factor in a wavelet denoising
setting. More recently Efron (2004) showed that when using the correct degrees of freedom,
a Cp type of statistic provides unbiased estimator of the prediction error, and in many cases
offers substantial improvement over alternative techniques such as cross-validation. The
significance of degrees of freedom has also been noted by Ye (1998), Shen and Ye (2002),
Shen, Huang and Ye (2004), Zou, Hastie and Tibshirani (2007), among others.
The concept of degrees of freedom is most well-understood for linear estimators in the
usual regression setting where it is identified with the trace of the so-called “hat” matrix
(see, e.g., Hastie and Tibshirani, 1990). In particular, when considering the classical lin-
ear regression or the analysis of variance (ANOVA), it is often associated with the number
2

of variables in the model. In general, degrees of freedom can be rigorously defined in the
framework of Stein’s unbiased risk estimate (see, e.g., Ye, 1998; Efron, 2004). Its interpre-
tation, however, is unclear in the context of low rank matrix estimation problems where the
estimators are highly nonlinear in nature. Consider, for example, the popular reduced rank
regression for multivariate linear regression. The number of free parameters in specifying
a low rank matrix is often used as the degrees of freedom in this case (see, e.g., Reinsel
and Velu, 1994). Although intuitive, it remains an open problem to what extent this ap-
propriately measures the complexity of the rank constrained estimator. The main goal of
this paper is to address such issues in a large class of low rank matrix estimation problems
including among others the noisy singular value decomposition, reduced rank regression, and
the more recently developed nuclear norm penalization.
Low rank matrix estimation methods often draw comparison with approaches for vari-
able selection in the classical linear regression. In particular, the rank constrained estimator
and the nuclear norm regularized estimator are reminiscent of the subset selection and the
Lasso for linear regression whose degrees of freedom can be conveniently interpreted as the
number of variables (Stein, 1981; Zou, Hastie and Tibshirani, 2006). This connection seem-
ingly vindicates the number of free parameters as the degrees of freedom for their matrix
analogues. However, as we show here, the number of free parameters incorrectly measures
the complexity of either estimator. For the rank constrained estimator, the number of free
parameters underestimates the degrees of freedom, whereas for the nuclear normal penaliza-
tion, it overestimates the degrees of freedom. Furthermore, we provide explicit bias correc-
tion terms to rectify such a problem. Unlike the earlier developments where the degrees of
freedom are estimated only through computationally intensive numerical methods such as
data-perturbation or resampling procedures, we derive easily computable analytic forms of
the degrees of freedom for several commonly used estimation procedures. In addition to the
reduction of computational cost, our results reveal interesting insights about the behavior of
these methods. These insights are of great theoretical and practical importance. For exam-
ple, they suggest that when eliciting the tuning parameters for nuclear norm penalization, it
may suffice to entertain a finite number of candidates rather than entertaining a continuum
of choices.
The rest of the paper is organized as follows. We start in the next section with a canonical
3

low rank approximation/estimation problem where the goal is to estimate a low rank Gaus-
sian mean matrix. Examples of such a problem include singular value decomposition with
noise (Hoff, 2006), the analysis of relational data (Harshman et al., 1982), biplot (Gabriel,
1971; Gower and Hand, 1996), and reduced-rank interaction models for factorial designs
(Gabriel 1978, 1998), among many others. We propose closed-form degrees of freedom esti-
mators for both the rank constrained and nuclear norm penalized estimators.
In Section 3, we consider a couple related low rank matrix estimation problems, namely
reduced rank regression for the multivariate linear regression (see, e.g., Reinsel and Velu,
1998) and nuclear norm penalization for matrix completion under uniform sampling at ran-
dom (see, e.g., Koltchinskii, Lounici and Tsybakov, 2011). We show that analytic forms
of unbiased degrees of freedom estimators can also be derived in these settings. Numerical
experiments are reported in Section 4 to demonstrate the efficacy of the proposed estimators
and their practical merits. All technical derivations are relegated to Section 5.
2 Canonical Low Rank Matrix Estimation
Many low rank matrix estimation problem can be formulated in the canonical form where
the goal is to estimate a m1 × m2 matrix M given a noisy observation Y = M + E, where
the noise matrix E follows a matrix norm distribution N(0, τ 2Im1⊗ Im2
). Without loss of
generality, we shall assume that m1 ≤ m2 hereafter.
2.1 Degrees of Freedom
Let M be an estimate of M based on Y . Its degrees of freedom can be motivated as follows.
Consider assessing the performance of M by ‖M − M‖2F, where ‖ · ‖F stands for the usual
matrix Frobenius or Hilbert-Schmidt norm. Observe that
‖M − M‖2F = ‖M − (Y − E)‖2
F
= ‖M − Y ‖2F + 2〈M − Y, E〉 + ‖E‖2
F
= ‖M − Y ‖2F + 2〈M, E〉 + (terms not depending on M),
where 〈·, ·〉 is the inner product associated with Frobenius norm, i.e., 〈A, B〉 = trace(ATB).
It is clear that the first term measures the goodness of fit of M to the observations Y . The
4

second term can then be interpreted as the cost of the estimating procedure leading to the
following definition of degrees of freedom
df(M) =1
τ 2
m1∑
i=1
m2∑
j=1
cov(Mij , Eij).
See Ye (1998) and Efron (2004) for further discussions. Once the degrees of freedom are
defined, various performance evaluation criteria can be constructed for M . In particular, the
previous derivation suggests the following Cp type statistic:
Cp(M) = ‖M − Y ‖2F + 2τ 2df(M).
Another popular alternative which we shall also focus on is the so-called generalized cross
validation:
GCV(M) = ‖M − Y ‖2F/{m1m2 − df(M)}2.
Compared with other criteria, GCV has the advantage of not requiring τ 2 which is typically
not known apriori and needs to be estimated from the data.
Generally speaking, the degrees of freedom as defined above are not directly computable.
Stein (1981) solves this problem by constructing an unbiased estimator for it. In our context,
his results indicate that
df(M) = E
(m1∑
i=1
m2∑
j=1
∂Mij
∂Eij
),
and suggest the following unbiased estimator of degrees of freedom:
dfS(M) =
m1∑
i=1
m2∑
j=1
∂Mij
∂Eij.
However, with few exceptions, it is typically difficult to derive analytical expressions of
dfS(M). One often has to resort to numerical methods such as data perturbation and
resampling techniques to compute it. These approaches, however, can be computationally
prohibitive in large scale problems. It is therefore of great interests to derive, if possible
at all, rigorous analytical results on the degrees of freedom. We now show that this indeed
is possible for two of the most common low rank matrix estimators – rank regularized and
nuclear norm regularized estimators.
5

2.2 Rank Regularized Estimator and Its Degrees of Freedom
We begin with rank constrained estimator. In the current context, it is given by:
M rank(K) = argminA∈Rm1×m2 :rank(A)≤K
‖A − Y ‖2F;
where K ∈ {1, . . . , m1} is a tuning parameter. The Eckart-Young Theorem shows that
M rank(K) is related to the singular value decomposition of Y and can be computed explicitly.
More specifically, let Y = UΣV T be its singular value decomposition, i.e., Σ is a diagonal
matrix with diagonal entries σ1 ≥ σ2 ≥ . . . ≥ σm1≥ 0 and the column vectors of U and V are
orthonormal. The reduced rank estimator M rank(K) is well defined whenever σK > σK+1,
which holds true with probability one. Moreover,
M rank(K) =K∑
k=1
σkukvT
k ,
where uk and vk are the kth columns of U and V respectively.
Theorem 1 Let σ1 ≥ σ2 ≥ . . . ≥ σK > σK+1 ≥ σm1be the singular values of Y = M + E
where E ∼ N(0, τ 2Im1⊗ Im2
). Then an unbiased estimator of the degrees of freedom for
M rank(K) is
df(M rank(K)) = (m1 + m2 − K)K + 2K∑
k=1
m1∑
l=K+1
σ2l
σ2k − σ2
l
. (1)
Several interesting observations can be made from Theorem 1. First of all, it indicates
that the number of free parameters in specifying a low rank matrix underestimates the
degrees of freedom for M(K). To see this, note that the number of free parameters to
specify an m1 × m2 matrix of rank K is (m1 + m2 − K)K, i.e., the first term on the right
hand side of (1). Because the second term on right hand side of (1) is always nonnegative,
df(M rank(K)) = Edf(M rank(K)) ≥ (m1 + m2 − K)K.
Moreover, since with probability one σm1> 0, the inequality is strict unless K = 0 or m1. To
further demonstrate the necessity of the bias correction, we now conduct a small numerical
experiment.
In this experiment, we fix m1 = m2 = 50, and the underlying truth M = ABT where
A and B are independently sampled from N(0, I50 ⊗ I5) so that M has rank five. We then
6

simulate Y ∼ N(M, I50 ⊗ I50) and compute M(K) for K = 1, 2, . . . , 50. We compare three
different ways of measuring the complexity of M(K):
• True degrees of freedom – E〈M(K), E〉 with the expectation estimated from 1000
simulated datasets;
• Unbiased estimate of degrees of freedom – df(M rank(K)) as given by (1);
• Naive estimate of degrees of freedom – Number of free parameters needed to specify a
rank K matrix.
The left panel of Figure 1 gives the degrees of freedom along with its two estimates
for a typical simulated dataset. It is clear that the unbiased estimate given in Theorem
1 is much more accurate than the naive estimate. To further confirm the unbiasedness of
df(M rank(K)). We repeat the experiment 1000 times and compute the sample expectation
of both estimates. As shown in the right panel of Figure 1, Edf(M rank(K)) agrees with the
true degrees of freedom fairly well.
To appreciate the practical implications of the unbiasedness of df(M rank(K)). We con-
sider using the unbiased risk estimate Cp(Mrank(K)) to select the appropriate rank K. When
using df(M rank(K)) as the estimated degrees of freedom, K = 5 is correctly identified for all
of the 1000 runs. In contrast, when using (m1 + m2 − K)K as the degrees of freedom, the
correct rank is chosen only 85% of the time. For the remaining 15% runs, the selected rank
is greater than K = 5. This may be attributed to the downward bias of the naive degrees of
freedom estimate and agrees with our earlier findings.
2.3 Nuclear Norm Penalization and Its Degrees of Freedom
Alternatively to the rank constraint, nuclear norm regularization is also widely used for low
rank matrix estimation:
Mnuclear(λ) = argminA∈Rm1×m2
(1
2‖A − Y ‖2
F + λ‖A‖∗)
,
where λ ≥ 0 is a tuning parameter, and ‖ · ‖∗ stands for the matrix nuclear norm, i.e.,
‖Y ‖∗ =
m1∑
k=1
σk.
7

0 10 20 30 40 50
500
1000
1500
2000
2500
Typical Example
Rank
Deg
rees
of F
reed
om
True DFUnbiased Estimate of DFNaive Estimate of DF
0 10 20 30 40 50
500
1000
1500
2000
2500
Expectation
Rank
Deg
rees
of F
reed
om
Figure 1: Degrees of freedom for reduced rank estimators: circles stand for the true degrees
of freedom; pluses represent the unbiased estimate of the degrees of freedom; triangles cor-
respond to the naive count of number of free parameters. The left panel is from a typical
simulated dataset and right hand side is based on results averaged over 1000 simulations.
8

Similar to the rank constrained estimate, Mnuclear(λ) can be expressed in closed form:
Mnuclear(λ) =
m1∑
k=1
(σk − λ)+ukvT
k ,
where (x)+ = max{x, 0}. Nuclear norm regularization also allows for closed-form degrees of
freedom estimator.
Theorem 2 Let σ1 ≥ σ2 ≥ . . . ≥ σm1≥ 0 be the singular values of Y = M + E where
E ∼ N(0, τ 2Im1⊗ Im2
) such that σK > λ ≥ σK+1. Then an unbiased estimator of the degrees
of freedom for Mnuclear(λ) is
df(Mnuclear(λ)) = (m1 + m2 − K)K + 2
K∑
k=1
m1∑
l=K+1
σ2l
σ2k − σ2
l
−λ(m2 − m1)K∑
k=1
1
σk
− 2λK∑
k=1
∑
l:l 6=k
σk
σ2k − σ2
l
. (2)
Comparing (1) and (2), one recognizes that the first two terms on the right hand side
of (2) correspond to the degrees of freedom for the rank constrained estimator of the same
rank. The remaining two terms specify how much less complexity a nuclear norm regularized
estimator has when compared with rank constrained estimator of the same rank.
We note that the number of free parameters in specifying a low rank matrix again incor-
rectly measures the complexity of Mnuclear(λ) because
df(Mnuclear(λ)) = (m1 + m2 − K)K + 2
K∑
k=1
m1∑
l=K+1
(σ2
l
σ2k − σ2
l
− λσk
σ2k − σ2
l
)
−λ(m2 − m1)
K∑
k=1
1
σk− 2λ
K∑
k,l=1l 6=k
σk
σ2k − σ2
l
= (m1 + m2 − K)K − 2
K∑
k=1
m1∑
l=K+1
λσk − σ2l
σ2k − σ2
l
−λ(m2 − m1)
K∑
k=1
1
σk− 2λ
∑
1≤k<l≤K
1
σk + σl
≤ (m1 + m2 − K)K,
where the inequality is strict with probability one when K > 1 and K < m1.
9
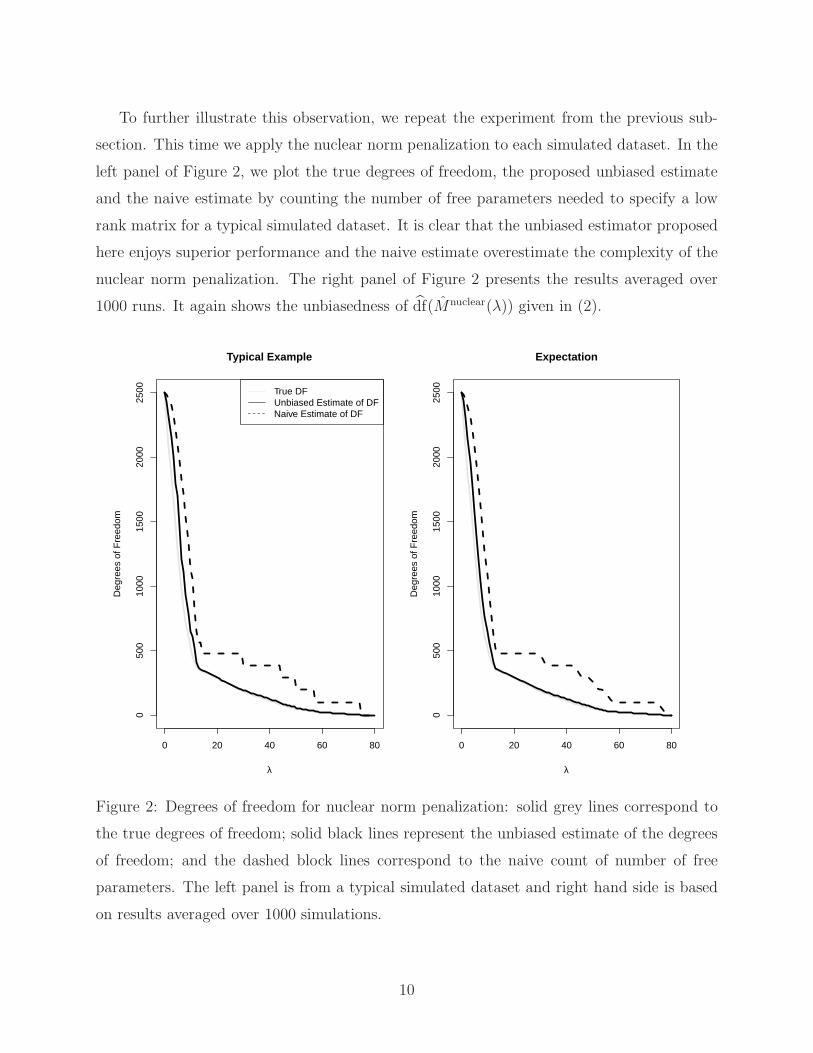
To further illustrate this observation, we repeat the experiment from the previous sub-
section. This time we apply the nuclear norm penalization to each simulated dataset. In the
left panel of Figure 2, we plot the true degrees of freedom, the proposed unbiased estimate
and the naive estimate by counting the number of free parameters needed to specify a low
rank matrix for a typical simulated dataset. It is clear that the unbiased estimator proposed
here enjoys superior performance and the naive estimate overestimate the complexity of the
nuclear norm penalization. The right panel of Figure 2 presents the results averaged over
1000 runs. It again shows the unbiasedness of df(Mnuclear(λ)) given in (2).
0 20 40 60 80
050
010
0015
0020
0025
00
Typical Example
λ
Deg
rees
of F
reed
om
True DFUnbiased Estimate of DFNaive Estimate of DF
0 20 40 60 80
050
010
0015
0020
0025
00
Expectation
λ
Deg
rees
of F
reed
om
Figure 2: Degrees of freedom for nuclear norm penalization: solid grey lines correspond to
the true degrees of freedom; solid black lines represent the unbiased estimate of the degrees
of freedom; and the dashed block lines correspond to the naive count of number of free
parameters. The left panel is from a typical simulated dataset and right hand side is based
on results averaged over 1000 simulations.
10

The characterization of the degrees of freedom for nuclear norm penalization provided in
Theorem 2 also has important practical implications. Clearly the performance of the nuclear
norm penalization depends critically on the choice of the tuning parameter λ. In practice, λ is
often selected by optimizing a performance evaluation or model selection criterion such as Cp
or GCV. Such a criterion typically can be expressed as a bivariate function of the goodness-of-
fit ‖Y −Mnuclear(λ)‖2F and the degrees of freedom, i.e., C(‖Y −Mnuclear(λ)‖2
F, df(Mnuclear(λ)))
in such a way that C is an increasing function of both arguments. One then chooses an λ
that minimizes C. The following corollary of Theorem 2 shows that for such a purpose, it
suffices to consider a finite number of choices for λ. Since Mnuclear(λ) = 0 for all λ ≥ σ1, we
shall assume that 0 ≤ λ ≤ σ1 without loss of generality.
Corollary 3 Let σ1 ≥ σ2 ≥ . . . ≥ σm1be the singular values of Y = M + E where E ∼
N(0, τ 2Im1⊗ Im2
). Denote by
λ = argmin0≤λ≤σ1
C(‖Y − Mnuclear(λ)‖2F, df(Mnuclear(λ))),
where C is an increasing function of both of its arguments and df(Mnuclear(λ)) is given by
(2), then
λ ∈ {σ1, σ2, . . . , σm1}.
3 Other Low Rank Matrix Estimation Problems
Thus far, we have focused on the canonical low rank matrix estimation problem. The
technique we developed, however, can be extended to other related problems as well. We
now consider a couple examples.
3.1 Multivariate Linear Regression and Reduced Rank Regression
One of the most classical examples of low rank matrix estimation is the reduced rank re-
gression for multivariate linear regression (see, e.g., Reinsel and Velu, 1998). Consider the
following multivariate linear regression:
Y = XM + E,
11

where Y = (y1, . . . , yn)T is an n× q response matrix, X = (x1, . . . , xn)T is an n× p covariate
matrix, M is a p× q coefficient matrix, and the regression noise E ∼ N(0, τ 2In ⊗ Iq). Let M
be an estimator of M , then the fitted value can be given as Y = XM . It is clear that when
X = I, the multivariate linear regression becomes the canonical low rank matrix estimation
problem investigated in the previous section. Following the same rationale as before, the
prediction performance of M can be assessed using the following Cp type statistic:
Cp(M) = ‖Y − XM‖2F + 2τ 2df(M),
where the degrees of freedom for M is defined as
df(M) :=1
τ 2
n∑
i=1
q∑
j=1
cov(Yij, Yij).
Low rank estimation has been studied extensively in the context of multivariate linear
regression. Numerous methods have been proposed over the year. See Hotelling (1935; 1936),
Anderson (1951), Massy (1965), Izenman (1975), Wold (1975), Frank and Friedman, (1993),
Brooks and Stone (1994), Breiman and Friedman (1997), Yuan et al. (2007) and Bunea et
al. (2011) among many others. In particular, reduced rank regression is one of the most
commonly used in practice (see, e.g., Reinsel and Velu, 1998). The reduced rank regression
estimate of M is given by
MRR(K) := argminA∈Rm1×m2 :rank(A)≤K
‖Y − XA‖2F.
The estimate MRR(K) can be written explicitly as
MRR(K) = (XTX)−1XTY V V T,
where V = (V1, . . . , VK) and Vk is the kth eigenvector of Y TX(XTX)−1XTY .
The following theorem shows that analytic forms for the unbiased estimator of the degrees
of freedom also exist in reduced rank regression.
Theorem 4 Let λ1 ≥ λ2 ≥ λK > λK+1 ≥ . . . ≥ λm be the eigenvalues of Y TX(XTX)−1XTY
where m = min{p, q}. Then an unbiased estimator of the degrees of freedom for MRR(K) is
df(MRR(K)) = (p + q − K)K + 2
K∑
k=1
m∑
l=K+1
λl
λk − λl. (3)
12

3.2 Matrix Completion and Nuclear Norm Penalization
We now turn to the problem of matrix completion under uniform sampling at random. The
goal is to recover a low random matrix M ∈ Rm1×m2 (m1 ≤ m2) based on n independent
random pairs (Xi, Yi), i = 1, 2, . . . , n, satisfying
Yi = 〈Xi, M〉 + ǫi,
where the observational noise ǫi are i.i.d. N(0, τ 2), and Xis are i.i.d. following a uniform
distribution over
X :={ej(m1)ek(m2)
T : 1 ≤ j ≤ m1, 1 ≤ k ≤ m2
},
and ej(m) is the jth canonical basis for Rm. Problems of this type have received considerable
attention in the past several years. See Candes and Recht (2008), Candes and Tao (2009),
Candes and Plan (2009), Recht (2010), Gross (2011), Rohde and Tsybakov (2011), and
Koltchinskii, Lounici and Tsybakov (2011) among others.
We shall consider here in particular the following version of nuclear norm penalization
introduced by Koltchinskii, Lounici and Tsybakov (2011):
M(λ) = argminA∈Rm1×m2
{1
2‖A‖2
F −⟨
m1m2
n
n∑
i=1
YiXi, A
⟩
+ λ‖A‖∗}
As shown by Koltchinskii et al. (2011), when λ is chosen appropriately, the resulting estimate
can achieve nearly optimal rate of convergence. The practical difficulty here of course is how
to select λ, which as we argued before, oftentimes relies on a good estimate of the degrees
of freedom for M(λ). As in the multivariate linear regression setting, the degrees of freedom
for the matrix completion problem can be defined as
df(M(λ)) :=1
τ 2
n∑
i=1
cov(Yi, Yi),
where Yi = 〈Xi, M〉. The following theorem provides explicit forms of the unbiased estimate
of the degrees of freedom for M(λ).
Theorem 5 Let σ1 ≥ σ2 ≥ . . . ≥ σm1be the singular values of (m1m2/n)
∑ni=1 YiXi such
that σK > λ ≥ σK+1, and uk and vk be the left and right singular vectors corresponding to
13

σk. Then an unbiased estimator of the degrees of freedom for M(λ) is
df(M(λ)) =m1m2
n
n∑
i=1
trace
[ ∑
k:σk>λ
(1 − λ
σk
)(uku
T
k XiXT
i + XT
i XivkvT
k
)
+∑
k:σk>λ
(2λ
σk
− 1
)XT
i ukuT
k XivkvT
k
+∑
k:σk>λ
∑
l:l 6=k
(σk − λ)σl
σ2k − σ2
l
(XT
i ukvT
k XT
i ulvT
l + XT
i ulvT
l XT
i ukvT
k
)
+∑
k:σk>λ
∑
l:l 6=k
(σk − λ)σ2l
σk(σ2k − σ2
l )
(XT
i ukuT
k XivlvT
l + XT
i uluT
l XivkvT
k
)]. (4)
4 Numerical Experiments
We now conduct some numerical experiments to illustrate the practical merits of our theo-
retical development. We begin with a simulation study designed to demonstrate the effect
of degrees of freedom estimates on tuning parameter selection for both the rank constrained
and nuclear norm regularized estimators. To fix ideas, we shall focus on the canonical model.
More specifically, we first simulated the true mean matrix M ∈ Rm1×m2 (m1 = m2 = 100)
such that its left and right singular vectors are uniform over the Steifel manifold. Its singular
values are independently sampled from a mixture distribution 0.9δ(0)+0.1E((√
m1+√
m2)α)
with α = 0.5, 1, 1.5 or 2, where δ(0) is a point mass at 0 and E(x) is the exponential distribu-
tion with mean x. The observation Y was then simulated from N(M, Im1⊗Im2
). It is known
that the largest singular value of a m1 × m2 matrix of standard normals is approximately√
m1 +√
m2. Therefore the value α determines the difficulty in estimating M with α = 2
corresponding to the easiest situation whereas α = 0.5 to the most difficult task.
We consider both the rank regularized and nuclear norm regularized estimators with
tuning parameters, rank K for the rank regularized estimator and λ for the nuclear norm
regularized estimator, selected by either Cp or GCV. For each criterion, we consider using
either the proposed unbiased degrees of freedom estimator and the naive count of free pa-
rameters needed to specify a low rank matrix, giving a total of four selection methods for
each estimator. We compare these selection methods in terms of their relative efficiency,
that is,‖M(K) − M‖2
F
mink ‖M(k) − M‖2F
14

for rank regularized estimator M(K), and
‖M(λ) − M‖2F
infθ ‖M(θ) − M‖2F
for nuclear norm regularized estimator M(λ). By definition, the relative efficiency of an
estimator is no less than 1 and the closer it is to 1, the more accurate the corresponding
estimate is. The results, based upon two hundred runs of simulation, are summarized in
Figure 3.
It is evident from Figure 3 that when using the proposed unbiased degrees of freedom
estimates, both Cp and GCV achieve nearly optimal performance in that their relative ef-
ficiency either equals to or is very close to 1, for both rank regularized and nuclear norm
regularized estimators. Of course, in practice, we do not know the variance of the noise τ 2
and GCV may therefore provide a more attractive option. In comparison, when using the
naive degrees of freedom, both Cp and GCV perform suboptimally, confirming the benefit
of using a good degrees of freedom estimator.
We now consider an application to a previously published breast cancer study. The
dataset, reported by Hu et al. (2006), was based on 146 Agilent 1Av2 microarrays. After
initial filtering, normalization and necessary preprocessing, it contains log transformed gene
expression measurements of 117 samples and 13,666 genes. Interested readers are referred
to Hu et al. (2006) for details. Our interest here is in finding the possible low rank struc-
ture underlying the gene expression data. Such structures are common in gene expression
studies and are the basis of many standard analysis methods (see, e.g., Alter et al., 2000;
Raychaudhuri et al., 2000; Troyanskaya et al., 2001). To this end, we apply both the rank
constrained and nuclear norm regularized estimators to the data. For each estimator, we
consider using the GCV to select the tuning parameter. We chose GCV over Cp because it
does not require the knowledge of the noise variance. As before, we consider using both the
proposed unbiased estimators and the naive estimator for the degrees of freedom in GCV.
The results are given in Figure 4.
For the rank constrained estimators, GCV with the unbiased degrees of freedom estimator
chose a model with rank 21 whereas GCV with the naive degrees of freedom chose a model
of rank 37, as indicated by the vertical grey lines in the left panel of Figure 4. Based on
our theoretical development as well as the earlier simulation study, the former model might
15

GCV (unbiased) GCV (naive) Cp (unbiased) Cp (naive)
1.0
1.4
1.8
Rank Constrained (a=0.5)
GCV (unbiased) GCV (naive) Cp (unbiased) Cp (naive)
26
10
Nuclear Norm Penalization (a=0.5)
GCV (unbiased) GCV (naive) Cp (unbiased) Cp (naive)
1.0
1.4
1.8
Rank Constrained (a=1)
GCV (unbiased) GCV (naive) Cp (unbiased) Cp (naive)
13
57
Nuclear Norm Penalization (a=1)
GCV (unbiased) GCV (naive) Cp (unbiased) Cp (naive)
1.0
1.2
1.4
Rank Constrained (a=1.5)
GCV (unbiased) GCV (naive) Cp (unbiased) Cp (naive)
13
57
Nuclear Norm Penalization (a=1.5)
GCV (unbiased) GCV (naive) Cp (unbiased) Cp (naive)
1.0
1.4
1.8
Rank Constrained (a=2)
GCV (unbiased) GCV (naive) Cp (unbiased) Cp (naive)
13
57
Nuclear Norm Penalization (a=2)
Figure 3: Effect of degrees of freedom estimators on tuning parameter selection for low
rank matrix estimation: results from each panel are based on 200 simulations. For each
simulated dataset, we apply rank constrained and nuclear norm regularized estimators with
the tuning parameter selected by either GCV or Cp. For each tuning criterion, the degrees
of freedom are estimated either by the proposed unbiased estimators or the naive count of
free parameters. Reported here are the relative efficiency of each method when compared
with the optimal choice of tuning parameter.16

0 10 20 30 40 50 60
1.2e
−05
1.4e
−05
1.6e
−05
1.8e
−05
Rank Constrained
Rank
GC
V S
core
s
GCV with Unbiased DFGCV with Naive DF
20 40 60 80 100
2.0e
−05
2.5e
−05
3.0e
−05
3.5e
−05
Nuclear Norm Penalization
λ
GC
V S
core
s
GCV with Unbiased DFGCV with Naive DF
Figure 4: Breast cancer data analysis: GCV criterion was evaluated for the rank constrained
and nuclear norm regularized estimators using both the proposed unbiased estimator and
the naive estimator of the degrees of freedom.
17

be more appropriate. Similarly for the nuclear norm penalization, the tuning parameter
selected with the unbiased degrees of freedom is 39.99. When using the naive degrees of
freedom, the tuning parameter chosen is 42.75. Moreover, when using GCV as the model
assessment criterion, rank constrained estimate is preferable for this dataset as it yields a
smaller GCV score when both are appropriately tuned.
5 Proofs
5.1 Proof of Theorem 1
For brevity, we shall assume that τ 2 = 1 in the proof. Write
J =
0 Y
Y T 0
,
the Jordan-Wielandt matrix corresponding to Y . Then ±σ1,±σ2, . . . ,±σm1together with
m2 − m1 zeros are the eigenvalues of J . Furthermore, the eigenvectors corresponding to σk
and −σk are (uT
k ,vT
k )T/√
2 =: ηk and (uT
k ,−vT
k )T/√
2 =: ζk respectively. For brevity, we
shall assume that there are no ties among σ1, . . . , σm1, and σm1
> 0 in the rest of the proof.
The same argument applies to the more general situation but is more tedious in notation.
By Cauchy residue formula, for a simple closed curve C in the complex plane that does
not go through any of the eigenvalues of J ,
1
2iπ
∮
C
dσ
σI − J=
m1∑
k=1
(ηkη
T
k × 1
2iπ
∮
C
dσ
σ − σk+ ζkζ
T
k × 1
2iπ
∮
C
dσ
σ + σk
)
=∑
k:σk∈int(C)
ηkηT
k +∑
k:−σk∈int(C)
ζkζT
k +
(
I −m1∑
k=1
(ηkηT
k + ζkζT
k )
)
I {0 ∈ int(C)} .
Therefore, for any C such that its interior contains only a single eigenvalue σk of J ,
σkηkηT
k =1
2iπ
∮
C
σdσ
σI − J,
again by Cauchy residue formula.
Now denote by J the Jordan-Wielandt matrix corresponding to Y with a small pertur-
bation – Y + δA where δ > 0 and A ∈ Rm1+m2 , i.e.,
J =
0 Y + δA
(Y + δA)T 0
,
18

Similar to before, let Y + δA = U ΣV T be its singular value decomposition. When δ is small
enough, we can choose C appropriately such that σk is also the only eigenvalue of J that
falls into the its interior. Write
B =
0 A
AT 0
.
Following a similar argument as before, we have
σkηkηT
k =1
2iπ
∮
C
σdσ
σI − (J + δB).
Therefore,
σk ηkηT
k − σkηkηT
k = δ
∮
C
σ(σI − J)−1B(σI − J)−1dσ + O(δ2)
= δηkηT
k BηkηT
k + δσkηkηT
k B(σkI − J)† + δσk(σkI − J)†BηkηT
k + O(δ2).
Similarly
σkζkζT
k − σkζkζT
k = δζkζT
k BζkζT
k + δσkζkζT
k B(σkI + J)† + δσk(σkI + J)†BζkζT
k + O(δ2).
With slight abuse of notation, let M(K; A) be the reduced rank estimate of M with
observation M + A. Then
1
δ
0 M(K; E + δA)
M(K; E + δA)T 0
−
0 M(K; E)
M(K; E)T 0
=1
δ
K∑
k=1
(σkηkη
T
k − σkηkηT
k
)
=K∑
k=1
(ηkη
T
k BηkηT
k + ζkζT
k BζkζT
k
)
+
K∑
k=1
σk
(ηkη
T
k B(σkI − J)† + ζkζT
k B(σkI + J)†)
+
K∑
k=1
σk
((σkI − J)†Bηkη
T
k + (σkI + J)†BζkζT
k
)+ O(δ).
Recall that ηk = (uT
k ,vT
k )T/√
2. We get
ηkηT
k =1
2
ukuT
k ukvT
k
vkuT
k vkvT
k
.
19

Therefore,
ηkηT
k BηlηT
l =1
4
∗ uk
(vT
k ATul + uT
k Avl
)vT
l
∗ ∗
.
Similarly,
ζkζT
k BζlζT
l =1
4
∗ uk
(vT
k ATul + uT
k Avl
)vT
l
∗ ∗
,
and
ηkηT
k BζlζT
l =1
4
∗ uk
(uT
k Avl − vT
k ATul
)vT
l
vk
(vT
k ATuk − uT
k Avk
)uT
k ∗
.
Note also that
(σkI − J)† =∑
l:l 6=k
ηlηT
l
σk − σl+
m1∑
l=1
ζlζT
l
σk + σl+
1
σk
(
I −m1∑
l=1
(ηlηT
l + ζlζT
l )
)
=1
σk(I− ηkη
T
k ) +∑
l:l 6=k
σlηlηT
l
σk(σk − σl)−
m1∑
l=1
σlζlζT
l
σk(σk + σl).
Similarly,
(σkI + J)† =1
σk(I − ζkζ
T
k ) −m1∑
l=1
σlηlηT
l
σk(σk + σl)+∑
l:l 6=k
σlζlζT
l
σk(σk − σl).
20

Thus,
ηkηT
k B(σkI − J)† + ζkζT
k B(σkI + J)†
=1
σk
(ηkη
T
k + ζkζT
k
)B − 1
σk
(ηkη
T
k BηkηT
k + ζkζT
k BζkζT
k
)
+∑
l:l 6=k
σl
σk(σk − σl)
(ηkη
T
k BηlηT
l + ζkζT
k BζlζT
l
)
−m1∑
l=1
σl
σk(σk + σl)
(ηkη
T
k BζlζT
l + ζkζT
k BηlηT
l
)
=
∗ 1σk
ukuT
k A
∗ ∗
−
∗ 1σk
ukuT
k AvkvT
k
∗ ∗
+∑
l:l 6=k
σl
2σk(σk − σl)
∗ uk
(vT
k ATul + uT
k Avl
)vT
l
∗ ∗
−m1∑
l=1
σl
2σk(σk + σl)
∗ uk
(uT
k Avl − vT
k ATul
)vT
l
∗ ∗
=
∗ 1σk
ukuT
k A − 1σk
ukuT
k AvkvT
k
∗ ∗
+∑
l:l 6=k
σl
σ2k − σ2
l
∗ ukvT
k ATulvT
l
∗ ∗
+∑
l:l 6=k
σ2l
σk(σ2k − σ2
l )
∗ ukuT
k AvlvT
l
∗ ∗
Following the same argument,
(σkI − J)†BηkηT
k + (σkI + J)†BζkζT
k
=
∗ 1σk
AvkvT
k − 1σk
ukuT
k AvkvT
k
∗ ∗
+∑
l:l 6=k
σl
σ2k − σ2
l
∗ ulvT
l ATukvT
k
∗ ∗
+∑
l:l 6=k
σ2l
σk(σ2k − σ2
l )
∗ uluT
l AvkvT
k
∗ ∗
21

It can then be derived that
1
δ
{M(K; E + δA) − M(K; E)
}
=1
2
K∑
k=1
uk
(vT
k ATuk + uT
k Avk
)vT
k
+
K∑
k=1
(uku
T
k A + AvkvT
k − 2ukuT
k AvkvT
k
)
+K∑
k=1
∑
l:l 6=k
σkσl
σ2k − σ2
l
(ukv
T
k ATulvT
l + ulvT
l ATukvT
k
)
+
K∑
k=1
∑
l:l 6=k
σ2l
σ2k − σ2
l
(uku
T
k AvlvT
l + uluT
l AvkvT
k
)+ O(δ)
=K∑
k=1
((uku
T
k A + AvkvT
k
)− uku
T
k AvkvT
k
)
+
K∑
k=1
∑
l:l 6=k
σkσl
σ2k − σ2
l
(ukv
T
k ATulvT
l + ulvT
l ATukvT
k
)
+K∑
k=1
∑
l:l 6=k
σ2l
σ2k − σ2
l
(uku
T
k AvlvT
l + uluT
l AvkvT
k
)+ O(δ).
Thus,
∂Mij
∂Eij
=K∑
k=1
(u2
ik + v2jk − u2
ikv2jk
)
+K∑
k=1
∑
l:l 6=k
σkσluikuilvjkvjl
σ2k − σ2
l
+
K∑
k=1
∑
l:l 6=k
σ2l (u
2ikv
2jl + u2
ilv2jk)
σ2k − σ2
l
.
Finally,
df(M) =∑
i,j
∂Mij
∂Eij
=
K∑
k=1
(m1 + m2) − K + 2
K∑
k=1
∑
l:l 6=k
σ2l
σ2k − σ2
l
= (m1 + m2 − K)K + 2
K∑
k=1
m1∑
l=K+1
σ2l
σ2k − σ2
l
.
22

5.2 Proof of Theorem 2
Similar to before, it can be deducted from Cauchy residue formula that
(σk − λ)+ηkηT
k − (σk − λ)+ηkηT
k
= δI(σk > λ)ηkηT
k BηkηT
k + δ(σk − λ)+ηkηT
k B(σkI − J)†
+δ(σk − λ)+(σkI − J)†BηkηT
k + O(δ2);
and
(σk − λ)+ζkζT
k − (σk − λ)+ζkζT
k
= δI(σk > λ)ζkζT
k BζkζT
k + δ(σk − λ)+ζkζT
k B(σkI + J)†
+δ(σk − λ)+(σkI + J)†BζkζT
k + O(δ2).
Let M(λ; A) be the nuclear norm regularized estimate of M with observation M + A.
Then
1
δ
0 M(λ; E + δA)
M(λ; E + δA)T 0
−
0 M(λ; E)
M(λ; E)T 0
=1
δ
m1∑
k=1
[(σk − λ)+ηkη
T
k − (σk − λ)+ηkηT
k
]
=∑
k:σk>λ
(ηkη
T
k BηkηT
k + ζkζT
k BζkζT
k
)
+∑
k:σk>λ
(σk − λ)(ηkη
T
k B(σkI − J)† + ζkζT
k B(σkI + J)†)
+∑
k:σk>λ
(σk − λ)((σkI − J)†Bηkη
T
k + (σkI + J)†BζkζT
k
)+ O(δ).
Following similar calculation as in the proof of Theorem 1, we get
∂Mij(E; λ)
∂Eij
=∑
k:σk>λ
(σk − λ
σk
(u2ik + v2
jk) +
(2λ
σk
− 1
)u2
ikv2jk
)
+∑
k:σk>λ
∑
l:l 6=k
(σk − λ)σluikuilvjkvjl
σ2k − σ2
l
+∑
k:σk>λ
∑
l:l 6=k
(σk − λ)σ2l (u
2ikv
2jl + u2
ilv2jk)
σk(σ2k − σ2
l ),
23

which yields
df(λ) = (m1 + m2 − K)K + 2∑
k:σk>λ
∑
l:σl≤λ
σ2l
σ2k − σ2
l
−λ(m2 − m1)∑
k:σk>λ
1
σk
− 2λ∑
k:σk>λ
∑
l:l 6=k
σk
σ2k − σ2
l
.
5.3 Proof of Corollary 3
Note that for any λ such that σk > λ ≥ σk+1,
‖Y − Mnuclear(λ)‖2F ≥ ‖Y − Mnuclear(σk+1)‖2
F
and
df(Mnuclear(λ)) ≥ df(Mnuclear(σk+1)).
Because C is increasing in both of its argument, we get
C(‖Y − Mnuclear(λ)‖2F, df(Mnuclear(λ))) ≥ C(‖Y − Mnuclear(σk+1)‖2
F, df(Mnuclear(σk+1))),
which implies the claim.
5.4 Proof of Theorem 4
Write
Z = (XTX)−1/2XTY.
and let Z = UDV T be its singular value decomposition. Then it is easy to verify that
MRR(K) = (XTX)−1/2Z(K)
where
Z(K) =K∑
k=1
σkukvT
k .
Now recall that an unbiased estimator of the degrees of freedom is given by
df(MRR(K)) =1
τ 2
∑
i,j
∂Yij
∂Yij,
where
Y (K) = XMRR(K) = X(XTX)−1/2Z(K) =: WZ(K).
24

By the chain rule of differentiation,
∂Yij
∂Yij=∑
t
Wit∂Ztj(K)
∂Yij.
Note that
Z = (XTX)−1/2XTY = WTY.
Therefore,∂Ztj(K)
∂Yij=∑
s,l
∂Ztj(K)
∂Zsl
∂Zsl
∂Yij=∑
s
Wis∂Ztj(K)
∂Zsj,
again by the chain rule. Thus,
∂Yij
∂Yij=∑
s,t
WisWit∂Ztj(K)
∂Zsj.
Together with the fact that WTW = I, we get
df(MRR(K)) =1
τ 2
∑
i,j,s,t
WisWit∂Ztj(K)
∂Zsj=
1
τ 2
∑
j,s,t
(WTW )st∂Ztj(K)
∂Zsj=
1
τ 2
∑
j,t
∂Ztj(K)
∂Ztj.
Following the same calculation as that of Theorem 1, we can derive that
df(MKK(K)) = (p + q − K)K + 2K∑
k=1
m∑
l=K+1
σ2l
σ2k − σ2
l
,
which implies the desired statement by noting that λk = σ2k.
5.5 Proof of Theorem 5
Write
Z =m1m2
n
n∑
i=1
YiXi,
and let Z = UDV T be its singular value decomposition. Then
M(λ) =
m1∑
j=1
(σj − λ)+ujvT
j .
Note that
Yi = 〈Xi, M(λ)〉
25

Therefore,
∂Yi
∂Yi=
⟨
Xi,∂M(λ)
∂Yi
⟩
.
By the chain rule,∂M (λ)
∂Yi=∑
s,t
∂M (λ)
∂Zst
∂Zst
∂Yi.
Observe that
∂Zst
∂Yi=
m1m2/n if Xi = ese
T
t
0 otherwise
Thus,
∂Mjk(λ)
∂Yi=
m1m2
n
⟨
Xi,∂Mjk(λ)
∂Z
⟩
.
Then∂Yi
∂Yi
=
⟨Xi,
∂M(λ)
∂Yi
⟩=
m1m2
n
∂〈Xi, M(λ)〉∂〈Xi, Z〉
In particular, if Xi = eseT
t , then from the proof of Theorem 1,
∂Yi
∂Yi
=m1m2
n
∂Mst(E; λ)
∂Zst
=m1m2
n
(∑
k:σk>λ
(σk − λ
σk(u2
sk + v2tk) +
(2λ
σk− 1
)u2
skv2tk
)
+∑
k:σk>λ
∑
l:l 6=k
(σk − λ)σluskuslvtkvtl
σ2k − σ2
l
+∑
k:σk>λ
∑
l:l 6=k
(σk − λ)σ2l (u
2skv
2tl + u2
slv2tk)
σk(σ2k − σ2
l )
)
=m1m2
ntrace
(∑
k:σk>λ
(1 − λ
σk
)(uku
T
k XiXT
i + XT
i XivkvT
k
)
+∑
k:σk>λ
(2λ
σk
− 1
)XT
i ukuT
k XivkvT
k
+∑
k:σk>λ
∑
l:l 6=k
(σk − λ)σl
σ2k − σ2
l
(XT
i ukvT
k XT
i ulvT
l + XT
i ulvT
l XT
i ukvT
k
)
+∑
k:σk>λ
∑
l:l 6=k
(σk − λ)σ2l
σk(σ2k − σ2
l )
(XT
i ukuT
k XivlvT
l + XT
i uluT
l XivkvT
k
))
,
which implies the desired claim.
26

References
[1] Akaike, H. (1973), Information theory and and an extension of the maximum likelihood
principle, Second International Symposium on Information Theory, 267-281.
[2] Alter, O., Brown, P.O. and Botstein, D. (2000), Singular value decomposition
for genome-wide expression data processing and modeling, Proceedings of National
Academy of Sciences of USA, 97, 10101-10106.
[3] Anderson, T. (1951), Estimating linear restrictions on regression coefficients for multi-
variate normal distributions, Annals of Mathematical Statististics, 22, 327-351.
[4] Breiman, L. and Friedman, J. (1997), Predicting multivariate responses in multiple
linear regression, Journal of the Royal Statistical Society, Ser. B, 59, 3-54.
[5] Brooks, R. and Stone, M. (1994), Joint continuum regression for multiple predictands,
Journal of the American Statistical Association, 89, 1374-1377.
[6] Bunea, F., She, Y. and Wegkamp, M. (2011), Optimal selection of reduced rank esti-
mators of high-dimensional matrices, to appear in Annals of Statistics.
[7] Candes, E.J. and Plan, Y. (2009), Matrix completion with noise, Proceedings of the
IEEE, 98(6), 925-936.
[8] Candes, E.J. and Recht, B. (2008), Exact matrix completion via convex optimization,
Foundations of Computational Mathematics, 9, 717-772.
[9] Candes, E.J. and Tao, T. (2009), The power of convex relaxation: Near-optimal matrix
completion, IEEE Transactions on Information Theory, 56(5), 2053-2080.
[10] Craven, P. and Wahba, G. (1979), Smoothing noisy data with spline functions: esti-
mating the correct degree of smoothing by the method of generalized cross-validation,
Numerische Mathematik, 31, 317-403.
[11] Donoho, D. and Johnstone, I. (1995), Adapting to unknown smoothness via wavelet
shrinkage, Journal of the American Statistical Association, 90 1200-1224.
27

[12] Efron, B. (1983), Estimation of the error rate: improvement on cross-validation, Journal
of the American Statistical Association, 78, 316-331.
[13] Efron, B. (1986), How biased is the apparent error rate of a prediction rule, Journal of
the American Statistical Association, 81, 461-470.
[14] Efron, B. (2004), The estimation of prediction error: Covariance penalty and cross-
validation, Journal of the American Statistical Association, 99, 619-632.
[15] Foster, D. P. and George, E. I. (1994), The risk inflation criterion for multiple regression,
Annals of Statistics, 22, 1947-1975.
[16] Frank, I. and Friedman, J. (1993), A statistical view of some chemometrics regression
tools (with discussion), Technometrics, 35, 109-148.
[17] Gabriel, K.R. (1971), The biplot graphic display of matrices with application to principal
component analysis, Biometrika, 58, 453-467.
[18] Gabriel, K.R. (1978) Least squares approximation of matrices by additive and multi-
plicative models, Journal of the Royal Statistical Society, Ser. B, 40, 186-196.
[19] Gabriel, K.R. (1998), Generalised bilinear regression, Biometrika, 85, 689-700.
[20] Gower, J.C. and Hand, D.J. (1996), Biplots, volume 54 of Monographs on Statistics and
Applied Probability, London: Chapman and Hall.
[21] Gross, D. (2011), Recovering low-rank matrices from few coefficients in any basis, IEEE
Transaction on Information Theory, 57, 1548-1566.
[22] Harshmanm, R.A., Green, P.E., Wind, Y. and Lundy, M.E. (1982), A model for the
analysis of asymmetric data in marketing research, Marketing Science, 1, 205-242.
[23] Hastie, T. and Tibshirani, R. (1990), Generalized Additive Models, Chapman & Hall,
London.
[24] Hoff, P.D. (2007), Model averaging and dimension selection for the singular value de-
composition, Journal of the American Statistical Association, 102, 674-685.
28

[25] Horn, R. and Johnson, C. (1991), Topics in Matrix Analysis, Cambridge University
Press, Cambridge.
[26] Hotelling, H. (1935), The most predictable criterion, Journal of Educational Psychology,
26, 139-142.
[27] Hotelling, H. (1936), Relations between two sets of variables, Biometrika, 28, 321-377.
[28] Hu, Z., Fan, C., Oh, D., Marron, J., He, X., Qaqish, B., Livasy, C., Carey, L., Reynolds,
E., Dressler, L., Nobel, A., Parker, J., Ewend, M., Sawyer, L., Wu, J., Liu, Y., Nanda,
R., Tretiakova, M., Orrico, A., Dreher, D., Palazzo, J., Perreard, L., Nelson, E., Mone,
M., Hansen, H., Mullins, M., Quackenbush, J., Ellis, M., Olopade, O., Bernard, P.
and Perou, C. (2006), The molecular portraits of breast tumors are conserved across
microarray platforms, BMC Genomics, 7, 96.
[29] Izenman, A. (1975), Reduced-rank regression for the multivariate linear model, Journal
of Multivariate Analysis, 5, 248-264.
[30] Koltchinskii, V., Lounici, K. and Tsybakov, A. (2011), Nuclear norm penalization and
optimal rates for noisy low rank matrix completion, to appear in Annals of Statistics.
[31] Mallows, C. (1973), Some comments on Cp, Technometrics, 15, 661-675.
[32] Massey, W. (1965), Principal components regression with exporatory statistical re-
search, Journal of the American Statistical Association, 60, 234-246.
[33] Raychaudhuri, S., Stuart, J.M. and Altman, R.B. (2000), Principal components analysis
to summarize microarray experiments: application to sporulation time series, Pacific
Symposium of Biocomputing, 455-466.
[34] Recht, B. (2010), A simpler approach to matrix completion, to appear in Journal of
Machine Learning Research.
[35] Reinsel, G. and Velu, R. (1998), Multivariate Reduced-Rank Regression, Springer-Verlag,
New York.
[36] Rohde, A. and Tsybakov, A. (2011), Estimation of high-dimensional low-rank matrices,
The Annals of Statistics, 39, 887-930.
29

[37] Shen, X., Huang, H. and Ye, J. (2004), Adaptive model selection and assessment for
exponential family distributions, Technometrics, 46, 306-317.
[38] Shen, X. and Ye, J. (2002), Adaptive model selection, Journal of the American Statistical
Association, 97, 210-221.
[39] Stein, C. (1981), Estimation of the mean of a multivariate normal distribution, Annals
of Statistics, 9, 1135-1151.
[40] Troyanskaya, O., Cantor, M., Sherlock, G., Brown, P., Hastie, T., Tibshirani, R., Bot-
stein, D. and Altman, R. B. (2001), Missing value estimation methods for DNA mi-
croarrays, Bioinformatics 17(6), 520-525.
[41] Wold, H. (1975), Soft modeling by latent variables: the nonlinear iterative partial least
squares approach, in Perspectives in Probability and Statistics: Papers in Honour of M.
S. Bartlett (ed. J. Gani), Academic Press, New York.
[42] Ye, J. (1998), On measuring and correcting the effects of data mining and model selec-
tion, Journal of the American Statistical Association, 93, 120-130.
[43] Yuan, M., Ekici, A., Lu, Z. and Monteiro, R. (2007), Dimension reduction and coefficient
estimation in multivariate linear regression, Journal of the Royal Statistical Society, Ser.
B, 69, 329-346.
[44] Zou, H., Hastie, T. and Tibshirani, R. (2007), On the degrees of freedom of the Lasso,
The Annals of Statistics, 35, 2173-2192.
30