degrees conferred profile of degree recipients 2011 -...
TRANSCRIPT

Degrees ConferredProfile of Degree Recipients
University of California, San DiegoOffice of Student Research & Information
Student Affairsstudentresearch.ucsd.edu
2011 - 2012
Programmer Analyst
http://studentresearch.ucsd.eduLa Jolla, CA 92093-0088
University of California, San DiegoStudent Affairs
DEGREES CONFERREDProfile of Degree Recipients
2011- 2012
University of California, San Diego
Student Research & Information
Jason R. Thornton
William B. Armstrong, Ph.D.Director
Research AnalystHeidi M. Carty, Ph.D.
Principal Research AnalystGreg Martin
UC San Diego 1 Degrees Conferred: 2011 - 2012

UC San Diego awarded a combined total of 8,391 undergraduate, graduate and Medical degreesduring the 2011/2012 academic year. A record high number of Bachelor's degrees (N=6,335),Master's degrees (N=1,106) and Ph.D.'s (N=64) were awarded in 2011/2012.
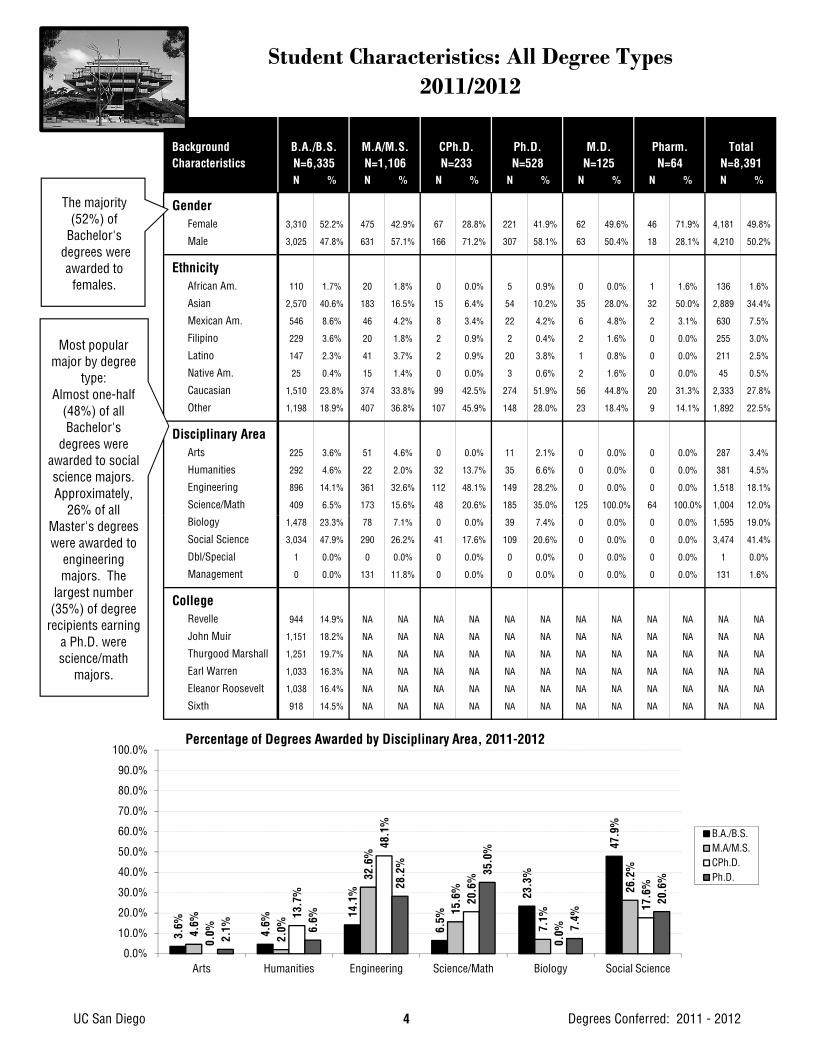
The majority (52%) of undergraduate and graduate Pharmaceutical degrees (72%) wereawarded to females, while the majority of Master's degrees (57%) and Ph.D.s (58%) wereawarded to males.
UCSD awarded 6,335 undergraduate degrees in 2011/2012. Of these, the largest percentage(48%; 3,034) were granted to social science majors, followed by biology majors (23%; 1,478).
Approximately, 57% of the undergraduate degrees awarded in 2011/2012 were earned bystudents of color.
More than one-half (55%) of all first-time freshmen who earned a Bachelor's degree at UCSDdid so in four years; almost three-quarters (74%) graduated within 13 quarters or just overfour yearsfour years.
On average, transfer students took three years to complete their Bachelor degree requirementsat UCSD, over three-quarters (80%) graduated within nine quarters.
Approximately 64% of the 2011/2012 undergraduate degree recipients graduated with a gradepoint average of 3.0 ('B') or higher; approximately one in four (24%) graduated with a gradepoint average of 3.5 ('B+') or higher.
The average GPA for all undergraduate degree recipients in 2011/2012 was 3.15. The averageGPA for the 2011/2012 first-time freshmen graduates was 3.19. The average GPA for the2011/2012 transfer students was 3.08.
UC San Diego 2 Degrees Conferred: 2011 - 2012

Candidate Doctor Doctor DoctorAward in of of ofYear Bachelor Master Phil. Philosophy Medicine Pharmacy Total
2011/2012 6,335 1,106 233 528 125 64 8,391
2010/2011 6,137 1,071 276 491 129 57 8,161
2009/2010 5,685 1,033 262 459 122 54 7,615
2008/2009 5,325 990 234 437 109 55 7,150
2007/2008 5,337 894 258 488 125 31 7,133
UC San Diego Awarded a Total of 8,391Undergraduate, Graduate and Medical Degrees
During the 2011/2012 Academic Year.
8,391 students graduated from UCSD in 2011/2012. A record
high (N 1 106) number of
2011 /2012
2006/2007 5,061 901 185 387 101 47 6,682
2005/2006 5,200 761 253 354 186 22 6,776
2004/2005 5,043 797 170 303 117 -- 6,430
2003/2004 4,136 785 161 327 100 -- 5,509
2002/2003 4,248 573 170 279 128 -- 5,398
2001/2002 3,922 495 117 278 61 -- 4,873
6,3356,1375,685
5,3255,3375,0615,2005,043
4,1364,2483,922
2,0562,0241,9301,8251,7961,6211,5761,3871,3731,150951
0
1,000
2,000
3,000
4,000
5,000
6,000
7,000
Trends in Degrees Awarded
Undergraduate Degrees
Graduate Degrees
high (N=1,106) number of Master's, Ph.D.'s (N=528) and Bachelor's (N=6,335) degrees were awarded in 2011/2012.
UC San Diego 3 Degrees Conferred: 2011 - 2012
BackgroundCharacteristics
N % N % N % N % N % N % N %
GenderFemale 3,310 52.2% 475 42.9% 67 28.8% 221 41.9% 62 49.6% 46 71.9% 4,181 49.8%
Male 3,025 47.8% 631 57.1% 166 71.2% 307 58.1% 63 50.4% 18 28.1% 4,210 50.2%
EthnicityAfrican Am. 110 1.7% 20 1.8% 0 0.0% 5 0.9% 0 0.0% 1 1.6% 136 1.6%
Asian 2,570 40.6% 183 16.5% 15 6.4% 54 10.2% 35 28.0% 32 50.0% 2,889 34.4%
Mexican Am. 546 8.6% 46 4.2% 8 3.4% 22 4.2% 6 4.8% 2 3.1% 630 7.5%
Filipino 229 3.6% 20 1.8% 2 0.9% 2 0.4% 2 1.6% 0 0.0% 255 3.0%
Latino 147 2.3% 41 3.7% 2 0.9% 20 3.8% 1 0.8% 0 0.0% 211 2.5%
Native Am. 25 0.4% 15 1.4% 0 0.0% 3 0.6% 2 1.6% 0 0.0% 45 0.5%
Caucasian 1,510 23.8% 374 33.8% 99 42.5% 274 51.9% 56 44.8% 20 31.3% 2,333 27.8%
Other 1,198 18.9% 407 36.8% 107 45.9% 148 28.0% 23 18.4% 9 14.1% 1,892 22.5%
Disciplinary AreaArts 225 3.6% 51 4.6% 0 0.0% 11 2.1% 0 0.0% 0 0.0% 287 3.4%
Humanities 292 4.6% 22 2.0% 32 13.7% 35 6.6% 0 0.0% 0 0.0% 381 4.5%
Engineering 896 14.1% 361 32.6% 112 48.1% 149 28.2% 0 0.0% 0 0.0% 1,518 18.1%
Science/Math 409 6.5% 173 15.6% 48 20.6% 185 35.0% 125 100.0% 64 100.0% 1,004 12.0%
Student Characteristics: All Degree Types2011/2012
TotalN=8,391
B.A./B.S. M.A/M.S. CPh.D. Ph.D. Pharm.N=64
M.D.N=125N=6,335 N=1,106 N=233 N=528
The majority (52%) of
Bachelor'sdegrees were awarded to
females.
Most popular major by degree
type:Almost one-half
(48%) of all Bachelor's
degrees were awarded to social science majors. Approximately,
26% of all Biology 1,478 23.3% 78 7.1% 0 0.0% 39 7.4% 0 0.0% 0 0.0% 1,595 19.0%
Social Science 3,034 47.9% 290 26.2% 41 17.6% 109 20.6% 0 0.0% 0 0.0% 3,474 41.4%
Dbl/Special 1 0.0% 0 0.0% 0 0.0% 0 0.0% 0 0.0% 0 0.0% 1 0.0%
Management 0 0.0% 131 11.8% 0 0.0% 0 0.0% 0 0.0% 0 0.0% 131 1.6%
CollegeRevelle 944 14.9% NA NA NA NA NA NA NA NA NA NA NA NA
John Muir 1,151 18.2% NA NA NA NA NA NA NA NA NA NA NA NA
Thurgood Marshall 1,251 19.7% NA NA NA NA NA NA NA NA NA NA NA NA
Earl Warren 1,033 16.3% NA NA NA NA NA NA NA NA NA NA NA NA
Eleanor Roosevelt 1,038 16.4% NA NA NA NA NA NA NA NA NA NA NA NA
Sixth 918 14.5% NA NA NA NA NA NA NA NA NA NA NA NA
Master's degrees were awarded to
engineering majors. The
largest number (35%) of degree
recipients earning a Ph.D. were science/math
majors.
3.6%
4.6%
14.1
%
6.5%
23.3
%
47.9
%
4.6%
2.0%
32.6
%
15.6
%
7.1%
26.2
%
0.0%
13.7
%
48.1
%
20.6
%
0.0%
17.6
%
2.1% 6.
6%
28.2
%
35.0
%
7.4%
20.6
%
0.0%
10.0%
20.0%
30.0%
40.0%
50.0%
60.0%
70.0%
80.0%
90.0%
100.0%
Arts Humanities Engineering Science/Math Biology Social Science
Percentage of Degrees Awarded by Disciplinary Area, 2011-2012
B.A./B.S.M.A/M.S.CPh.D.Ph.D.
UC San Diego 4 Degrees Conferred: 2011 - 2012

Trends in Time-to-Degree1: Academic Performance
Academic Performance '01/'02 '02/'03 '03/'04 '04/'05 '05/'06 '06/'07 '07/'08 '08/'09 '09/'10 '10/'11 '11/'12
Bachelor Degree Recipients Who Entered From High School
Average Time-to-Degree 13.3 13.5 13.3 13.0 12.9 13.0 12.9 13.0 12.8 13.0 13.0
Median Time-to-Degree 12.0 12.0 12.0 12.0 12.0 12.0 12.0 12.0 12.0 12.0 12.0
Average Units 205 207 209 210 211 213 213 213 215 217 218
GPA at Graduation 3.14 3.16 3.19 3.19 3.20 3.17 3.18 3.16 3.20 3.19 3.19
% with GPA = 3.0 - 3.5 45% 43% 43% 44% 43% 43% 43% 42% 44% 43% 41%
% with GPA > 3.5 20% 23% 25% 26% 26% 25% 25% 24% 27% 26% 27%
Bachelor Degree Recipients Who Entered From a Two-Year Community College
Average Time-to-Degree 8.4 8.2 8.2 8.0 8.1 7.8 8.0 7.9 8.0 7.8 7.8
Median Time-to-Degree 7.0 6.0 6.0 6.0 6.0 6.0 6.0 6.0 7.0 7.0 7.0
Average Units 205 206 205 206 206 205 206 207 206 206 206
GPA at Graduation 3.03 3.04 3.06 3.04 3.06 3.06 3.04 3.03 3.04 3.07 3.08
% with GPA = 3.0 - 3.5 40% 36% 37% 39% 36% 37% 37% 36% 34% 38% 36%
% with GPA > 3.5 15% 17% 20% 17% 19% 19% 18% 18% 19% 20% 21%
Award Year
Total Bachelor Degree Recipients
Average Units 205 207 208 209 210 210 211 211 212 213 214
GPA at Graduation 3.11 3.12 3.15 3.14 3.16 3.14 3.14 3.12 3.15 3.15 3.15
% with GPA = 3.0 - 3.5 43% 41% 41% 42% 41% 41% 41% 40% 41% 41% 40%
% with GPA > 3.5 19% 21% 23% 23% 24% 23% 23% 22% 24% 23% 24%
1Time-to-Degree is reported in elapsed quarters from first enrollment date to graduation. Only the records of students who enter UCSD in the Fall quarter are included in time-to-degree calculations. An academic year is defined as three quarters; twelve quarters equal four years. Summer degrees are combined with fall degrees and represent one quarter.
13.3
qtrs
13.5
qtrs
13.3
qtrs
13.0
qtrs
12.9
qtrs
13.0
qtrs
12.9
qtrs
13.0
qtrs
12.8
qtrs
13.0
qtrs
13.0
qtrs
8.4
qtrs
8.2
qtrs
8.2
qtrs
8.0
qtrs
8.1
qtrs
7.8
qtrs
8.0
qtrs
7.9
qtrs
8.0
qtrs
7.8
qtrs
7.8
qtrs
0.0 qtrs
2.0 qtrs
4.0 qtrs
6.0 qtrs
8.0 qtrs
10.0 qtrs
12.0 qtrs
14.0 qtrs
16.0 qtrs
Tim
e-to
-Deg
ree
in E
laps
ed Q
uarte
rs
Time-to-Degree Trends
First-time Freshmen
Community College Transfers
UC San Diego 5 Degrees Conferred: 2011 - 2012
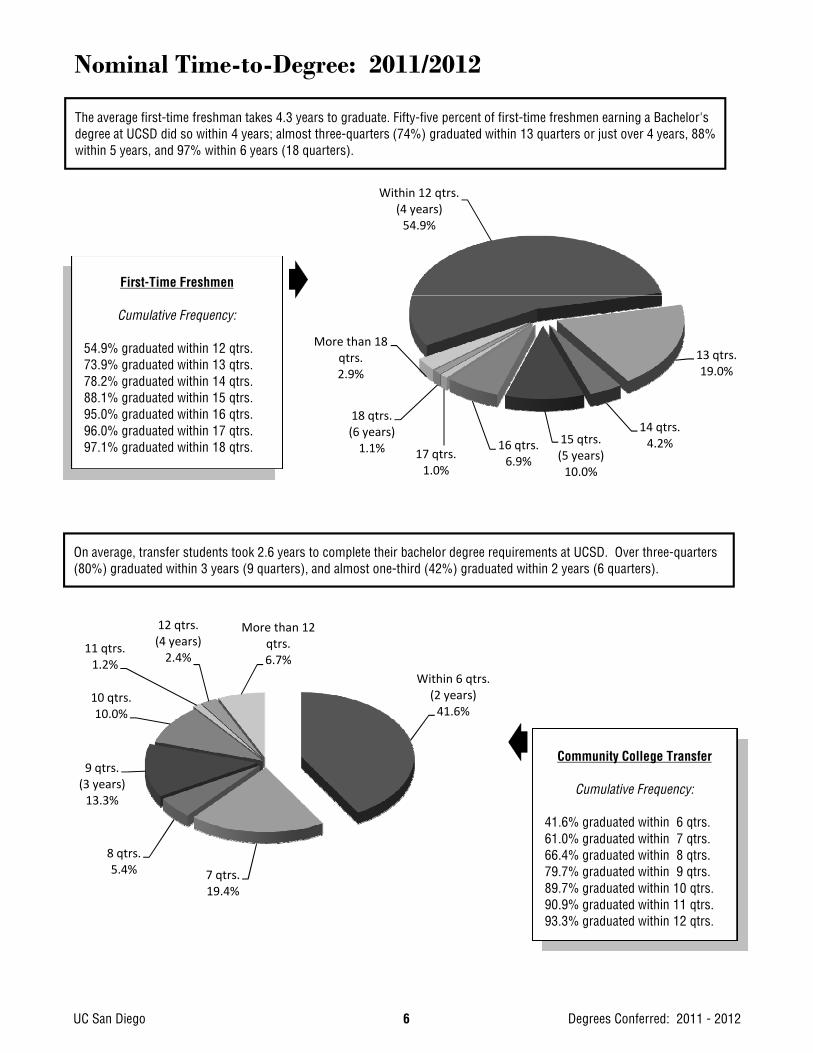
Nominal Time-to-Degree: 2011/2012
Within 12 qtrs. (4 years)54.9%
13 qtrs.19.0%
14 qtrs.4.2%15 qtrs.
(5 years)10.0%
16 qtrs.6.9%
17 qtrs.1.0%
18 qtrs. (6 years)1.1%
More than 18 qtrs.2.9%
First-Time Freshmen
Cumulative Frequency:
54.9% graduated within 12 qtrs.73.9% graduated within 13 qtrs.78.2% graduated within 14 qtrs.88.1% graduated within 15 qtrs.95.0% graduated within 16 qtrs.96.0% graduated within 17 qtrs.97.1% graduated within 18 qtrs.
The average first-time freshman takes 4.3 years to graduate. Fifty-five percent of first-time freshmen earning a Bachelor's degree at UCSD did so within 4 years; almost three-quarters (74%) graduated within 13 quarters or just over 4 years, 88% within 5 years, and 97% within 6 years (18 quarters).
Within 6 qtrs. (2 years)41.6%
7 qtrs.19.4%
8 qtrs.5.4%
9 qtrs. (3 years)13.3%
10 qtrs.10.0%
11 qtrs.1.2%
12 qtrs. (4 years)2.4%
More than 12 qtrs.6.7%
Community College Transfer
Cumulative Frequency:
41.6% graduated within 6 qtrs.61.0% graduated within 7 qtrs.66.4% graduated within 8 qtrs.79.7% graduated within 9 qtrs.89.7% graduated within 10 qtrs.90.9% graduated within 11 qtrs.93.3% graduated within 12 qtrs.
On average, transfer students took 2.6 years to complete their bachelor degree requirements at UCSD. Over three-quarters (80%) graduated within 3 years (9 quarters), and almost one-third (42%) graduated within 2 years (6 quarters).
UC San Diego 6 Degrees Conferred: 2011 - 2012

Characteristics of Bachelor Degree Recipients: 2011/2012
Academic Profile Time-to-Degree% GPA Freshmen C.C.
Student GPA 3.0 - % GPA Units Transfer 2
Characteristics N % Mean 3.5 > 3.5 Mean Mean Mean
GenderFemale 3,310 52.2% 3.17 41.4% 25.4% 211 12.7 7.5Male 3,025 47.8% 3.12 37.8% 23.4% 216 13.4 8.1
EthnicityAfrican Am. 110 1.7% 3.00 40.0% 11.8% 211 13.6 7.9Asian 2,570 40.6% 3.09 40.7% 19.1% 214 13.1 7.6Mexican Am. 546 8.6% 3.00 35.5% 14.1% 209 13.9 8.0Filipino 229 3.6% 3.00 34.1% 14.4% 212 13.2 8.3Latino 147 2.3% 3.08 42.2% 15.0% 210 13.0 8.3Native Am. 25 0.4% 3.26 40.0% 28.0% 195 11.8 7.3Caucasian 1,510 23.8% 3.22 41.8% 29.2% 210 12.7 7.8Other 1,198 18.9% 3.30 37.5% 38.8% 221 12.7 8.0
Disciplinary AreaArts 225 3.6% 3.34 43.1% 36.9% 214 13.1 7.9Humanities 292 4.6% 3.23 39.7% 31.2% 210 13.1 8.5Engineering 896 14.1% 3.14 39.3% 23.2% 236 13.6 9.5Science/Math 409 6.5% 3.14 39.9% 23.0% 225 13.2 8.6Biology 1,478 23.3% 3.15 38.8% 24.6% 218 12.9 8.3Social Science 3,034 47.9% 3.13 40.0% 23.3% 204 12.9 7.1Dbl/Special 1 0.0% 3.52 0.0% 100.0% 203 13.0 --
CollegeRevelle 944 14.9% 3.07 36.7% 19.6% 222 13.2 9.2Muir 1 151 18 2% 3 20 38 7% 29 0% 213 12 8 7 5
Social science majors account for
almost one-half (48%) of the 2011/2012
undergraduate degree recipients.
The majority of Bachelor degree
recipients are women (52%).
Muir 1,151 18.2% 3.20 38.7% 29.0% 213 12.8 7.5Marshall 1,251 19.7% 3.16 40.9% 24.9% 207 12.8 7.3Warren 1,033 16.3% 3.14 41.5% 23.0% 214 12.9 7.9Roosevelt 1,038 16.4% 3.17 38.2% 27.6% 214 13.0 8.0Sixth 918 14.5% 3.13 42.0% 21.0% 214 13.4 7.5
School TypeHigh School 3,905 61.6% 3.19 41.1% 26.8% 218 13.0 --2yr College 2,297 36.3% 3.08 36.2% 20.6% 206 -- 7.84yr College/Univ. 124 2.0% 3.26 60.5% 21.0% 217 -- --Unknown 9 0.1% 2.92 22.2% 11.1% 199 -- --
First Generation College StatusFirst Generation 1,948 30.7% 3.06 38.5% 18.0% 212 13.3 7.9Not First Generation 4,387 69.3% 3.19 40.2% 27.3% 214 12.9 7.7
IncomeHigh: > $98,401 1,551 24.5% 3.23 39.0% 31.5% 213 12.5 7.5Medium High: $65,601 - $98,400 654 10.3% 3.14 39.4% 23.9% 215 12.8 7.9Medium Low: $32,801 - $65,600 1,172 18.5% 3.09 42.0% 18.9% 214 13.2 7.9Low: < $32,800 1,343 21.2% 3.05 38.3% 17.3% 214 13.5 8.1Missing/Undeclared 1,615 25.5% 3.19 39.9% 27.9% 213 12.9 7.7
Total Population 6,335 100.0% 3.15 39.7% 24.4% 214 13.0 7.8
2 For Transfer students, time-to-degree is calculated only for those students who matriculate from a two-year community college (C.C.). The typical community college transfer student enters UCSD with 90 units of transferable academic credit.
On average, first-time freshmen take just over four years (13.0 quarters) to graduate. Community College transfer students tend to graduate in approximately three years or 8 quarters.
Approximately, 64% of the undergraduate
degree recipients graduated with GPA
of 3.0 ('B') or higher. Approximately, 24%
graduated with a GPA of 'B+' or higher.
UC San Diego 7 Degrees Conferred: 2011 - 2012
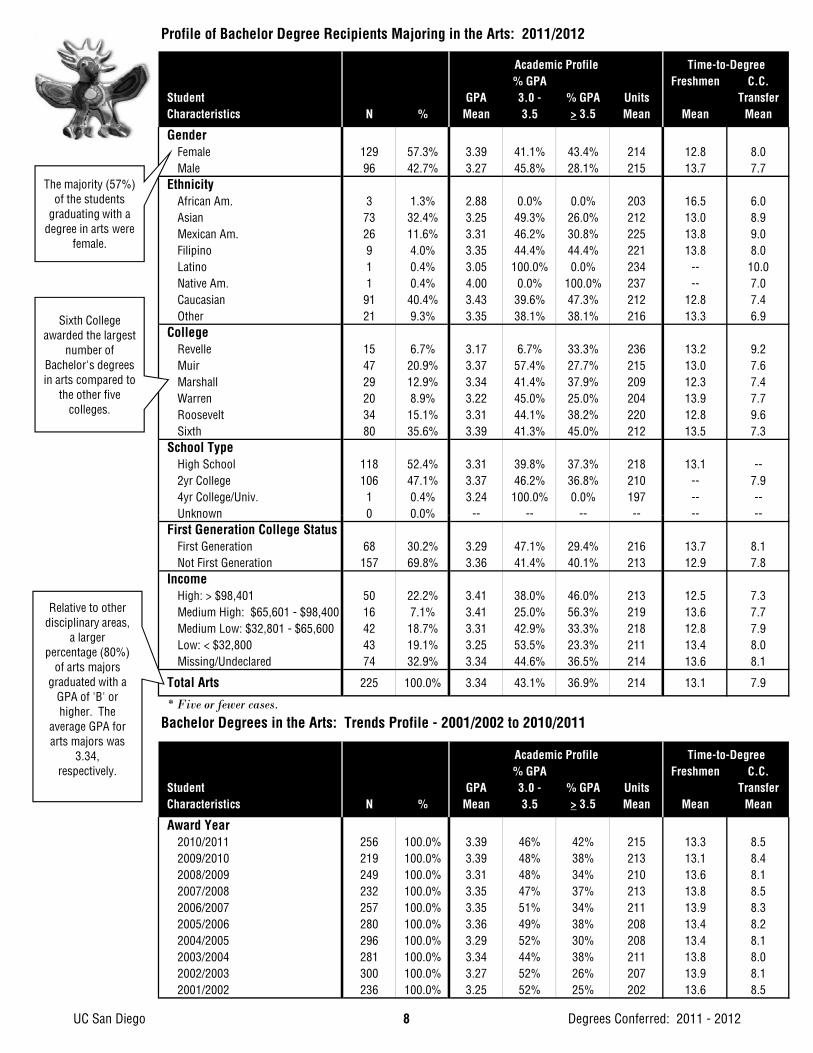
Profile of Bachelor Degree Recipients Majoring in the Arts: 2011/2012
Academic Profile Time-to-Degree% GPA Freshmen C.C.
Student GPA 3.0 - % GPA Units TransferCharacteristics N % Mean 3.5 > 3.5 Mean Mean Mean
GenderFemale 129 57.3% 3.39 41.1% 43.4% 214 12.8 8.0Male 96 42.7% 3.27 45.8% 28.1% 215 13.7 7.7
EthnicityAfrican Am. 3 1.3% 2.88 0.0% 0.0% 203 16.5 6.0Asian 73 32.4% 3.25 49.3% 26.0% 212 13.0 8.9Mexican Am. 26 11.6% 3.31 46.2% 30.8% 225 13.8 9.0Filipino 9 4.0% 3.35 44.4% 44.4% 221 13.8 8.0Latino 1 0.4% 3.05 100.0% 0.0% 234 -- 10.0Native Am. 1 0.4% 4.00 0.0% 100.0% 237 -- 7.0Caucasian 91 40.4% 3.43 39.6% 47.3% 212 12.8 7.4Other 21 9.3% 3.35 38.1% 38.1% 216 13.3 6.9
CollegeRevelle 15 6.7% 3.17 6.7% 33.3% 236 13.2 9.2Muir 47 20.9% 3.37 57.4% 27.7% 215 13.0 7.6Marshall 29 12.9% 3.34 41.4% 37.9% 209 12.3 7.4Warren 20 8.9% 3.22 45.0% 25.0% 204 13.9 7.7Roosevelt 34 15.1% 3.31 44.1% 38.2% 220 12.8 9.6Sixth 80 35.6% 3.39 41.3% 45.0% 212 13.5 7.3
School TypeHigh School 118 52.4% 3.31 39.8% 37.3% 218 13.1 --2yr College 106 47.1% 3.37 46.2% 36.8% 210 -- 7.94yr College/Univ. 1 0.4% 3.24 100.0% 0.0% 197 -- --Unknown 0 0 0% -- -- -- -- -- --
Sixth College awarded the largest
number of Bachelor's degrees in arts compared to
the other five colleges.
The majority (57%) of the students
graduating with a degree in arts were
female.
Unknown 0 0.0%First Generation College Status
First Generation 68 30.2% 3.29 47.1% 29.4% 216 13.7 8.1Not First Generation 157 69.8% 3.36 41.4% 40.1% 213 12.9 7.8
IncomeHigh: > $98,401 50 22.2% 3.41 38.0% 46.0% 213 12.5 7.3Medium High: $65,601 - $98,400 16 7.1% 3.41 25.0% 56.3% 219 13.6 7.7Medium Low: $32,801 - $65,600 42 18.7% 3.31 42.9% 33.3% 218 12.8 7.9Low: < $32,800 43 19.1% 3.25 53.5% 23.3% 211 13.4 8.0Missing/Undeclared 74 32.9% 3.34 44.6% 36.5% 214 13.6 8.1
Total Arts 225 100.0% 3.34 43.1% 36.9% 214 13.1 7.9
* Five or fewer cases.Bachelor Degrees in the Arts: Trends Profile - 2001/2002 to 2010/2011
Academic Profile Time-to-Degree% GPA Freshmen C.C.
Student GPA 3.0 - % GPA Units TransferCharacteristics N % Mean 3.5 > 3.5 Mean Mean Mean
Award Year2010/2011 256 100.0% 3.39 46% 42% 215 13.3 8.52009/2010 219 100.0% 3.39 48% 38% 213 13.1 8.42008/2009 249 100.0% 3.31 48% 34% 210 13.6 8.12007/2008 232 100.0% 3.35 47% 37% 213 13.8 8.52006/2007 257 100.0% 3.35 51% 34% 211 13.9 8.32005/2006 280 100.0% 3.36 49% 38% 208 13.4 8.22004/2005 296 100.0% 3.29 52% 30% 208 13.4 8.12003/2004 281 100.0% 3.34 44% 38% 211 13.8 8.02002/2003 300 100.0% 3.27 52% 26% 207 13.9 8.12001/2002 236 100.0% 3.25 52% 25% 202 13.6 8.5
Relative to other disciplinary areas,
a larger percentage (80%)
of arts majors graduated with a
GPA of 'B' or higher. The
average GPA for arts majors was
3.34, respectively.
UC San Diego 8 Degrees Conferred: 2011 - 2012

Profile of Bachelor Degree Recipients Majoring in the Humanities: 2011/2012
Academic Profile Time-to-Degree% GPA Freshmen C.C.
Student GPA 3.0 - % GPA Units TransferCharacteristics N % Mean 3.5 > 3.5 Mean Mean Mean
GenderFemale 172 58.9% 3.29 41.3% 35.5% 214 13.0 8.6Male 120 41.1% 3.14 37.5% 25.0% 205 13.3 8.4
EthnicityAfrican Am. 5 1.7% 2.83 20.0% 20.0% 192 12.0 8.0Asian 75 25.7% 3.27 53.3% 26.7% 217 12.8 8.4Mexican Am. 39 13.4% 3.10 28.2% 28.2% 202 13.8 9.7Filipino 8 2.7% 3.35 37.5% 50.0% 220 12.9 7.0Latino 12 4.1% 2.91 25.0% 16.7% 198 13.6 14.7Native Am. 1 0.3% 3.47 100.0% 0.0% 180 -- 5.0Caucasian 108 37.0% 3.28 38.9% 32.4% 207 13.1 7.8Other 44 15.1% 3.26 34.1% 40.9% 216 12.6 8.9
CollegeRevelle 23 7.9% 2.92 34.8% 13.0% 218 15.8 10.6Muir 62 21.2% 3.26 33.9% 37.1% 205 12.1 8.0Marshall 52 17.8% 3.26 25.0% 40.4% 203 12.4 7.7Warren 55 18.8% 3.21 52.7% 25.5% 210 12.9 9.4Roosevelt 73 25.0% 3.27 42.5% 32.9% 216 13.3 8.4Sixth 27 9.2% 3.26 51.9% 22.2% 211 12.8 7.1
School TypeHigh School 162 55.5% 3.29 37.0% 38.9% 213 13.1 --2yr College 121 41.4% 3.13 43.8% 19.8% 206 -- 8.54yr College/Univ. 8 2.7% 3.47 37.5% 50.0% 221 -- --Unknown 1 0 3% 2 62 0 0% 0 0% 188 -- --
The majority (59%) of students earning a Bachelor's degree in humanities were
female.
Eleanor Roosevelt College awarded the largest number of
humanities degrees followed by Muir
College.
Unknown 1 0.3% 2.62 0.0% 0.0% 188First Generation College Status
First Generation 91 31.2% 3.18 31.9% 34.1% 208 13.4 8.7Not First Generation 201 68.8% 3.25 43.3% 29.9% 211 12.9 8.4
IncomeHigh: > $98,401 65 22.3% 3.38 43.1% 41.5% 214 12.4 7.2Medium High: $65,601 - $98,400 33 11.3% 3.28 48.5% 27.3% 217 12.3 8.2Medium Low: $32,801 - $65,600 53 18.2% 3.05 30.2% 24.5% 204 14.0 8.6Low: < $32,800 55 18.8% 3.20 38.2% 29.1% 209 13.7 8.6Missing/Undeclared 86 29.5% 3.22 40.7% 30.2% 209 12.3 8.9
Total Humanities 292 100.0% 3.23 39.7% 31.2% 210 13.1 8.5
* Five or fewer cases.Bachelor Degrees in the Humanities: Trends Profile - 2001/2002 to 2010/2011
Academic Profile Time-to-Degree% GPA Freshmen C.C.
Student GPA 3.0 - % GPA Units TransferCharacteristics N % Mean 3.5 > 3.5 Mean Mean Mean
Award Year2010/2011 260 100.0% 3.30 48% 31% 209 12.8 7.22009/2010 255 100.0% 3.25 43% 29% 207 12.7 8.32008/2009 260 100.0% 3.19 43% 25% 206 13.0 7.62007/2008 291 100.0% 3.25 45% 31% 211 12.7 8.12006/2007 262 100.0% 3.19 45% 24% 205 13.0 7.72005/2006 280 100.0% 3.25 46% 29% 204 12.8 8.22004/2005 259 100.0% 3.24 45% 29% 203 12.8 8.42003/2004 253 100.0% 3.22 47% 28% 204 13.1 7.72002/2003 226 100.0% 3.17 43% 24% 205 13.4 8.02001/2002 244 100.0% 3.16 43% 22% 203 13.7 8.3
Approximately, 71% of humanities majors graduated with a GPA of 'B'
or higher; the mean GPA was
3.23, respectively.
UC San Diego 9 Degrees Conferred: 2011 - 2012
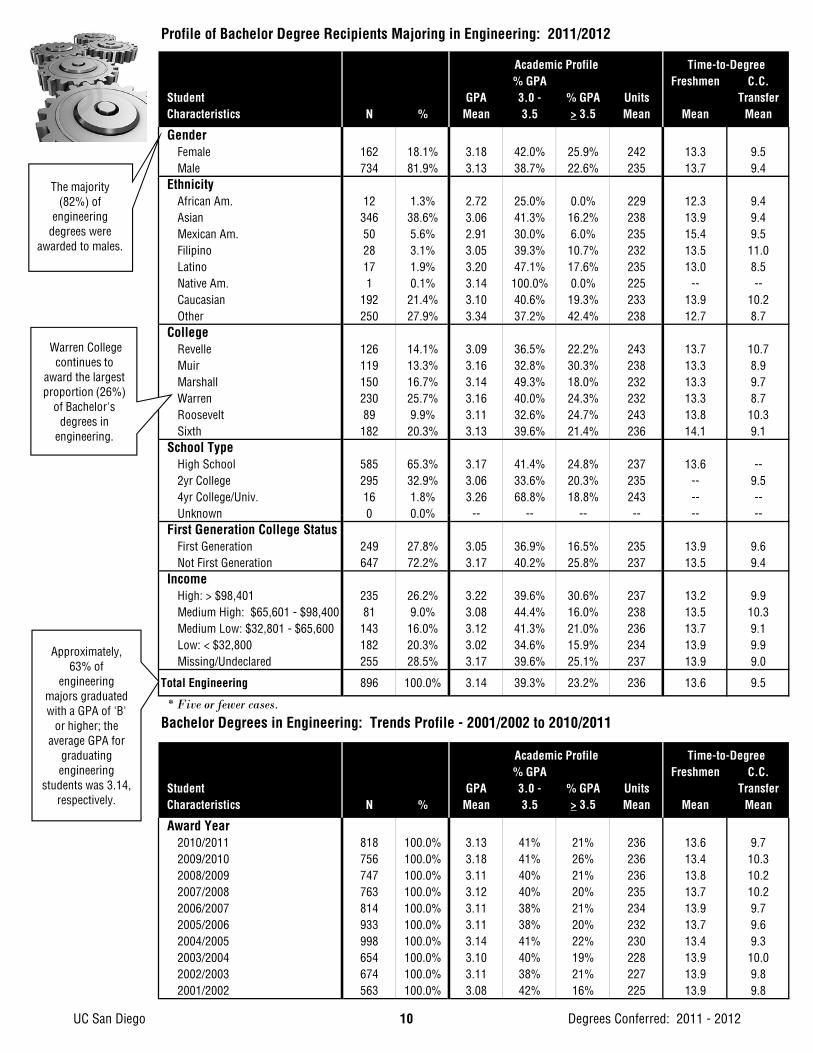
Profile of Bachelor Degree Recipients Majoring in Engineering: 2011/2012
Academic Profile Time-to-Degree% GPA Freshmen C.C.
Student GPA 3.0 - % GPA Units TransferCharacteristics N % Mean 3.5 > 3.5 Mean Mean Mean
GenderFemale 162 18.1% 3.18 42.0% 25.9% 242 13.3 9.5Male 734 81.9% 3.13 38.7% 22.6% 235 13.7 9.4
EthnicityAfrican Am. 12 1.3% 2.72 25.0% 0.0% 229 12.3 9.4Asian 346 38.6% 3.06 41.3% 16.2% 238 13.9 9.4Mexican Am. 50 5.6% 2.91 30.0% 6.0% 235 15.4 9.5Filipino 28 3.1% 3.05 39.3% 10.7% 232 13.5 11.0Latino 17 1.9% 3.20 47.1% 17.6% 235 13.0 8.5Native Am. 1 0.1% 3.14 100.0% 0.0% 225 -- --Caucasian 192 21.4% 3.10 40.6% 19.3% 233 13.9 10.2Other 250 27.9% 3.34 37.2% 42.4% 238 12.7 8.7
CollegeRevelle 126 14.1% 3.09 36.5% 22.2% 243 13.7 10.7Muir 119 13.3% 3.16 32.8% 30.3% 238 13.3 8.9Marshall 150 16.7% 3.14 49.3% 18.0% 232 13.3 9.7Warren 230 25.7% 3.16 40.0% 24.3% 232 13.3 8.7Roosevelt 89 9.9% 3.11 32.6% 24.7% 243 13.8 10.3Sixth 182 20.3% 3.13 39.6% 21.4% 236 14.1 9.1
School TypeHigh School 585 65.3% 3.17 41.4% 24.8% 237 13.6 --2yr College 295 32.9% 3.06 33.6% 20.3% 235 -- 9.54yr College/Univ. 16 1.8% 3.26 68.8% 18.8% 243 -- --Unknown 0 0 0% -- -- -- -- -- --
The majority (82%) of
engineering degrees were
awarded to males.
Warren College continues to
award the largest proportion (26%)
of Bachelor's degrees in
engineering.
Unknown 0 0.0%First Generation College Status
First Generation 249 27.8% 3.05 36.9% 16.5% 235 13.9 9.6Not First Generation 647 72.2% 3.17 40.2% 25.8% 237 13.5 9.4
IncomeHigh: > $98,401 235 26.2% 3.22 39.6% 30.6% 237 13.2 9.9Medium High: $65,601 - $98,400 81 9.0% 3.08 44.4% 16.0% 238 13.5 10.3Medium Low: $32,801 - $65,600 143 16.0% 3.12 41.3% 21.0% 236 13.7 9.1Low: < $32,800 182 20.3% 3.02 34.6% 15.9% 234 13.9 9.9Missing/Undeclared 255 28.5% 3.17 39.6% 25.1% 237 13.9 9.0
Total Engineering 896 100.0% 3.14 39.3% 23.2% 236 13.6 9.5
* Five or fewer cases.Bachelor Degrees in Engineering: Trends Profile - 2001/2002 to 2010/2011
Academic Profile Time-to-Degree% GPA Freshmen C.C.
Student GPA 3.0 - % GPA Units TransferCharacteristics N % Mean 3.5 > 3.5 Mean Mean Mean
Award Year2010/2011 818 100.0% 3.13 41% 21% 236 13.6 9.72009/2010 756 100.0% 3.18 41% 26% 236 13.4 10.32008/2009 747 100.0% 3.11 40% 21% 236 13.8 10.22007/2008 763 100.0% 3.12 40% 20% 235 13.7 10.22006/2007 814 100.0% 3.11 38% 21% 234 13.9 9.72005/2006 933 100.0% 3.11 38% 20% 232 13.7 9.62004/2005 998 100.0% 3.14 41% 22% 230 13.4 9.32003/2004 654 100.0% 3.10 40% 19% 228 13.9 10.02002/2003 674 100.0% 3.11 38% 21% 227 13.9 9.82001/2002 563 100.0% 3.08 42% 16% 225 13.9 9.8
Approximately, 63% of
engineering majors graduated with a GPA of 'B'
or higher; the average GPA for
graduating engineering
students was 3.14, respectively.
UC San Diego 10 Degrees Conferred: 2011 - 2012

Profile of Bachelor Degree Recipients Majoring in Science and Math: 2011/2012
Academic Profile Time-to-Degree% GPA Freshmen C.C.
Student GPA 3.0 - % GPA Units TransferCharacteristics N % Mean 3.5 > 3.5 Mean Mean Mean
GenderFemale 192 46.9% 3.11 40.6% 20.3% 224 13.1 8.5Male 217 53.1% 3.16 39.2% 25.3% 226 13.3 8.6
EthnicityAfrican Am. 0 0.0% -- -- -- -- -- --Asian 164 40.1% 3.07 45.1% 14.6% 225 13.2 8.5Mexican Am. 27 6.6% 2.80 18.5% 7.4% 224 16.2 7.9Filipino 19 4.6% 3.11 52.6% 15.8% 220 12.8 7.5Latino 7 1.7% 3.22 42.9% 28.6% 209 13.0 10.0Native Am. 0 0.0% -- -- -- -- -- --Caucasian 105 25.7% 3.23 39.0% 29.5% 225 12.7 8.4Other 87 21.3% 3.27 34.5% 36.8% 227 12.9 9.1
CollegeRevelle 94 23.0% 3.11 35.1% 21.3% 226 13.2 9.4Muir 89 21.8% 3.24 44.9% 29.2% 226 12.7 7.9Marshall 69 16.9% 3.20 39.1% 29.0% 220 12.7 9.3Warren 59 14.4% 3.07 33.9% 20.3% 223 13.8 7.6Roosevelt 45 11.0% 3.08 46.7% 15.6% 225 13.8 8.0Sixth 53 13.0% 3.06 41.5% 17.0% 229 13.6 8.3
School TypeHigh School 280 68.5% 3.19 42.5% 26.1% 229 13.2 --2yr College 119 29.1% 3.00 32.8% 15.1% 216 -- 8.64yr College/Univ. 9 2.2% 3.25 55.6% 22.2% 228 -- --Unknown 1 0 2% 3 90 0 0% 100 0% 180 -- --
The majority of science/math degrees were
awarded to males (53%).
The largest proportion of
science/math degrees were awarded by Revelle College (23%) followed closely by Muir College (22%).
Unknown 1 0.2% 3.90 0.0% 100.0% 180First Generation College Status
First Generation 126 30.8% 3.08 36.5% 19.0% 224 13.8 7.9Not First Generation 283 69.2% 3.16 41.3% 24.7% 225 12.9 9.0
IncomeHigh: > $98,401 98 24.0% 3.24 50.0% 25.5% 223 12.5 9.0Medium High: $65,601 - $98,400 42 10.3% 3.21 31.0% 33.3% 228 13.6 8.4Medium Low: $32,801 - $65,600 66 16.1% 3.07 37.9% 18.2% 229 13.4 10.0Low: < $32,800 88 21.5% 3.04 37.5% 15.9% 224 13.7 7.9Missing/Undeclared 115 28.1% 3.14 37.4% 25.2% 223 13.1 8.4
Total Science/Math 409 100.0% 3.14 39.9% 23.0% 225 13.2 8.6
* Five or fewer cases.Bachelor Degrees in Science and Math: Trends Profile - 2001/2002 to 2010/2011
Academic Profile Time-to-Degree% GPA Freshmen C.C.
Student GPA 3.0 - % GPA Units TransferCharacteristics N % Mean 3.5 > 3.5 Mean Mean Mean
Award Year2010/2011 413 100.0% 3.10 39% 23% 226 13.4 8.82009/2010 368 100.0% 3.17 39% 26% 220 12.9 8.52008/2009 395 100.0% 3.10 41% 20% 219 13.6 8.22007/2008 360 100.0% 3.10 38% 24% 219 13.4 8.52006/2007 339 100.0% 3.07 40% 20% 217 13.3 8.42005/2006 310 100.0% 3.15 41% 24% 218 13.1 8.42004/2005 327 100.0% 3.10 36% 24% 220 13.5 8.72003/2004 259 100.0% 3.08 37% 22% 216 13.5 8.42002/2003 252 100.0% 3.08 33% 23% 214 13.4 8.42001/2002 242 100.0% 3.08 38% 21% 215 13.2 9.6
Approximately, 63% of science/math
majors graduated with a GPA of 'B' or higher; twenty-three
percent graduated with a GPA of 'B+' or
higher.
UC San Diego 11 Degrees Conferred: 2011 - 2012

Profile of Bachelor Degree Recipients Majoring in Biology: 2011/2012
Academic Profile Time-to-Degree% GPA Freshmen C.C.
Student GPA 3.0 - % GPA Units TransferCharacteristics N % Mean 3.5 > 3.5 Mean Mean Mean
GenderFemale 880 59.5% 3.13 39.7% 21.9% 217 12.8 8.3Male 598 40.5% 3.18 37.5% 28.4% 219 13.0 8.3
EthnicityAfrican Am. 17 1.2% 3.02 41.2% 11.8% 224 13.6 8.8Asian 639 43.2% 3.08 40.1% 17.4% 218 12.9 8.4Mexican Am. 84 5.7% 2.91 23.8% 11.9% 213 13.8 8.5Filipino 70 4.7% 2.85 18.6% 10.0% 214 13.3 9.1Latino 16 1.1% 3.02 43.8% 6.3% 216 13.1 7.3Native Am. 3 0.2% 3.33 33.3% 33.3% 192 12.0 6.0Caucasian 229 15.5% 3.15 45.9% 21.8% 210 12.5 8.0Other 420 28.4% 3.36 39.0% 43.1% 223 12.7 8.1
CollegeRevelle 399 27.0% 3.13 34.8% 24.3% 221 12.8 8.4Muir 264 17.9% 3.22 36.7% 32.2% 218 12.7 8.0Marshall 258 17.5% 3.18 40.7% 27.5% 211 12.8 7.5Warren 229 15.5% 3.15 43.2% 22.3% 217 12.7 8.6Roosevelt 162 11.0% 3.11 41.4% 19.8% 222 13.0 9.3Sixth 166 11.2% 3.06 39.8% 16.3% 218 13.2 7.9
School TypeHigh School 1,089 73.7% 3.18 40.4% 26.5% 220 12.9 --2yr College 369 25.0% 3.03 32.0% 19.2% 210 -- 8.34yr College/Univ. 19 1.3% 3.21 73.7% 15.8% 216 -- --Unknown 1 0 1% 3 38 100 0% 0 0% 232 -- --
The majority of biology degrees were awarded to females (60%).
Revelle College awarded the
largest proportion (27%) of biology
degrees.
Unknown 1 0.1% 3.38 100.0% 0.0% 232First Generation College Status
First Generation 416 28.1% 3.03 35.3% 17.3% 217 13.2 8.3Not First Generation 1,062 71.9% 3.19 40.1% 27.4% 218 12.7 8.3
IncomeHigh: > $98,401 384 26.0% 3.23 41.1% 30.7% 215 12.4 8.1Medium High: $65,601 - $98,400 163 11.0% 3.16 34.4% 26.4% 216 12.5 8.0Medium Low: $32,801 - $65,600 297 20.1% 3.07 39.7% 16.8% 219 13.3 8.5Low: < $32,800 323 21.9% 3.07 37.2% 19.5% 221 13.4 8.4Missing/Undeclared 311 21.0% 3.18 38.9% 28.6% 217 12.5 8.3
Total Biology 1,478 100.0% 3.15 38.8% 24.6% 218 12.9 8.3
* Five or fewer cases.Bachelor Degrees in Biology: Trends Profile - 2001/2002 to 2010/2011
Academic Profile Time-to-Degree% GPA Freshmen C.C.
Student GPA 3.0 - % GPA Units TransferCharacteristics N % Mean 3.5 > 3.5 Mean Mean Mean
Award Year2010/2011 1,483 100.0% 3.15 41% 24% 218 12.9 8.42009/2010 1,268 100.0% 3.17 42% 25% 218 12.8 8.32008/2009 1,173 100.0% 3.13 40% 23% 215 12.9 7.92007/2008 1,113 100.0% 3.15 39% 24% 215 12.8 7.92006/2007 939 100.0% 3.17 38% 27% 215 12.8 8.12005/2006 906 100.0% 3.17 37% 27% 214 12.9 8.02004/2005 752 100.0% 3.14 39% 25% 213 12.9 8.62003/2004 661 100.0% 3.12 35% 25% 213 13.2 8.62002/2003 742 100.0% 3.13 39% 24% 211 13.2 8.62001/2002 715 100.0% 3.11 40% 22% 210 13.3 8.9
Approximately, 64% of biology
majors graduated with a GPA of 'B' or higher; twenty-
five percent graduated with a GPA of 'B+' or
higher.
UC San Diego 12 Degrees Conferred: 2011 - 2012

Profile of Bachelor Degree Recipients Majoring in the Social Sciences: 2011/2012
Academic Profile Time-to-Degree% GPA Freshmen C.C.
Student GPA 3.0 - % GPA Units TransferCharacteristics N % Mean 3.5 > 3.5 Mean Mean Mean
GenderFemale 1,774 58.5% 3.17 42.4% 25.3% 204 12.6 6.9Male 1,260 41.5% 3.07 36.7% 20.6% 203 13.4 7.3
EthnicityAfrican Am. 73 2.4% 3.05 45.2% 13.7% 207 13.6 7.1Asian 1,273 42.0% 3.09 39.1% 20.4% 204 12.9 6.9Mexican Am. 320 10.5% 3.02 40.9% 13.4% 202 13.5 7.2Filipino 95 3.1% 3.00 38.9% 12.6% 201 13.0 7.6Latino 94 3.1% 3.08 42.6% 14.9% 206 13.0 7.8Native Am. 19 0.6% 3.20 36.8% 26.3% 192 11.8 7.8Caucasian 784 25.8% 3.24 42.0% 31.1% 202 12.4 7.2Other 376 12.4% 3.20 37.0% 31.9% 208 12.8 7.3
CollegeRevelle 287 9.5% 2.98 41.5% 11.1% 211 13.3 8.8Muir 569 18.8% 3.17 39.0% 26.4% 205 12.7 7.0Marshall 693 22.8% 3.14 40.5% 23.2% 199 12.8 6.8Warren 440 14.5% 3.12 40.9% 22.7% 202 12.7 7.1Roosevelt 635 20.9% 3.18 36.7% 29.8% 207 12.7 7.3Sixth 410 13.5% 3.11 43.7% 18.5% 201 13.2 6.9
School TypeHigh School 1,670 55.0% 3.17 41.8% 25.9% 209 12.9 --2yr College 1,287 42.4% 3.07 36.8% 20.3% 197 -- 7.14yr College/Univ. 71 2.3% 3.25 57.7% 19.7% 210 -- --Unknown 6 0 2% 2 73 16 7% 0 0% 198 -- --
The majority of social science
degree recipients were female (59%).
Approximately, 63% of social
science majors
The average grade point average for the
2011/2012social science degree recipients was 3.13.
Unknown 6 0.2% 2.73 16.7% 0.0% 198First Generation College Status
First Generation 998 32.9% 3.05 40.5% 16.3% 203 13.1 7.3Not First Generation 2,036 67.1% 3.17 39.8% 26.8% 204 12.7 7.0
IncomeHigh: > $98,401 718 23.7% 3.21 35.9% 30.9% 203 12.4 6.9Medium High: $65,601 - $98,400 319 10.5% 3.11 41.7% 21.3% 205 12.5 7.5Medium Low: $32,801 - $65,600 571 18.8% 3.09 44.8% 17.9% 205 12.9 7.3Low: < $32,800 652 21.5% 3.03 39.1% 15.3% 204 13.4 7.4Missing/Undeclared 774 25.5% 3.19 40.3% 27.9% 203 12.8 7.0
Total Social Sciences 3,034 100.0% 3.13 40.0% 23.3% 204 12.9 7.1
* Five or fewer cases.Bachelor Degrees in Social Sciences: Trends Profile - 2001/2002 to 2010/2011
Academic Profile Time-to-Degree% GPA Freshmen C.C.
Student GPA 3.0 - % GPA Units TransferCharacteristics N % Mean 3.5 > 3.5 Mean Mean Mean
Award Year2010/2011 2,906 100.0% 3.12 41% 21% 203 12.8 7.12009/2010 2,816 100.0% 3.11 40% 22% 203 12.6 7.42008/2009 2,499 100.0% 3.10 40% 21% 202 12.8 7.22007/2008 2,577 100.0% 3.12 43% 20% 201 12.7 7.52006/2007 2,446 100.0% 3.12 42% 21% 201 12.8 7.02005/2006 2,486 100.0% 3.15 42% 22% 200 12.6 7.32004/2005 2,406 100.0% 3.12 43% 20% 199 12.8 7.12003/2004 2,022 100.0% 3.14 42% 22% 199 13.0 7.32002/2003 2,051 100.0% 3.10 42% 19% 198 13.0 7.52001/2002 1,916 100.0% 3.09 45% 17% 197 13.0 7.7
science majors graduated with a
GPA of 3.0 or higher; twenty-three percent
graduated with a GPA of 3.5 or
higher.
UC San Diego 13 Degrees Conferred: 2011 - 2012

Degrees Conferred is an annual publication of theOffice of Student Research & Information,
Student Affairs, 858-534-2382.This document is also available on the
World Wide Web at:studentresearch.ucsd.edu