degradation of selected organic … of selected organic agrochemicals in ... shift to a pseudo-first...
TRANSCRIPT
DEGRADATION OF SELECTED ORGANIC AGROCHEMICALS IN
ARTIFICIAL SOIL SLURRY SYSTEMS BY ANODIC FENTON TREATMENT
A Dissertation
Presented to the Faculty of the Graduate School
of Cornell University
In Partial Fulfillment of the Requirements for the Degree of
Doctor of Philosophy
by
Peng Ye
January 2009

© 2009 Peng Ye
DEGRADATION OF SELECTED ORGANIC AGROCHEMICALS IN
ARTIFICIAL SOIL SLURRY SYSTEMS BY ANODIC FENTON TREATMENT
Peng Ye, Ph. D.
Cornell University 2009
This thesis investigated the application of anodic Fenton treatment to the
degradation of several probe agrochemicals in model soil slurry systems. A kinetic
model, called the slurry AFT model, was developed to describe the degradation
process in the slurry system. Effects of different model soil components, such as
humic acid, kaolin or montmorillonite clay, and goethite, on the degradation of
different groups of agrochemicals, including carbaryl, mecoprop, paraquat, 4.6-o-
dinitrocresol, p-nitrophenol and dinoseb, were studied.
The results indicate that humic acid content is the key factor that slows down
pesticide degradation, most probably due to its pH buffering and adsorption capacity.
A kinetic model, which was shown to fit the experimental data quite well (R2>0.99),
was developed to describe the carbaryl degradation in the soil slurry during the AFT
process. In the presence of humic acid, carbaryl degradation kinetics were found to
shift to a pseudo-first order reaction after an “initiation” stage.
The adsorption and degradation behaviors of neutral (carbaryl), anionic (mecoprop)
and cationic (paraquat) agrochemicals were studied in a slurry of Swy-2 Na+-
montmorillonite clay. Results show that, due to different adsorption mechanisms, the
adsorption effect on chemical degradation by anodic Fenton treatment (AFT) varies
with pesticide: strong and tight adsorption of paraquat at the clay interlayer protects
paraquat from being attacked by hydroxyl radicals; loosely adsorbed carbaryl or
mecoprop is readily degraded. XRD analysis clearly indicates that AFT is capable of
effectively degrading interlayer non-cationic organic chemicals that are not usually
available for biodegradation.
The adsorption and degradation of 4, 6-o-dinitrocresol (DNOC) and p-nitrophenol
(PNP) in Swy-2 montmorillonite clay slurry were investigated. The pH and type of
cation were varied, and results showed that adsorption of DNOC and PNP increased at
lower pH values. The specific cation had a significant effect on adsorption, which was
dramatically enhanced in the presence of K+ and NH4+. It was found that the DNOC
degradation rate substantially decreased in the clay slurry system in the presence of K+
and low pH, with a large amount of DNOC residue remaining after 60 min treatment.
Based on LC-MS data, a DNOC degradation pathway was proposed. Overall, the
results showed the inhibition effect of specific adsorption mechanisms on the
degradation of nitroaromatic compounds in montmorillonite clay slurry by AFT,
providing important implications for water and soil remediation.
The pH effect on the adsorption and AFT degradation of dinoseb in a goethite slurry
was investigated. At neutral or high pH, there was less dinoseb adsorption on goethite,
and the AFT degradation process was not significantly affected. At an acidic or low
pH, there was much more dinoseb adsorption on the goethite, and the AFT
degradation process was inhibited by the adsorption, though more soluble iron
originated from goethite which could enhance the degradation. It was also found that
goethite itself was able to remove 50% of dinoseb in the presence of hydrogen
peroxide in 30 minutes in an acidic environment.

iii
BIOGRAPHICAL SKETCH
Peng Ye was born in a small mountainous village with an identical twin brother in
Shanxi Province, China in 1979. After having a wonderful childhood on the mountain,
in 1986, right before the age required to go to school, his whole family moved to a
village located in nearby Henan Province, China, where there are better education
resources and fewer mountains.
He completed his elementary and middle school in nearby village schools. In 1994,
he went to the county’s best high school, First High School of Linzhou, where he met
a lot good teachers and friends. After spending three years in this wonderful school, in
1997, he got an admission from one of China’s best university, Beijing University.
During the undergraduate study, majored in Applied Chemistry, he was very interested
in environmental sciences. As a result, after completing his undergraduate, he entered
into a graduate program of environmental sciences, working on several projects
concerning on eliminating the usage of persistent organic pesticides in China.
In the spring of 2004, with a master degree in Environmental Sciences, he received
an exciting offer letter from Prof. Lemley at Cornell University. Without any hesitate,
he joined the Lemley lab. This has been proved to be the best decision he had ever
made by far. At Cornell, he received systematic education in Environmental
Toxicology, which is a new and multi-disciplinary program. He worked on the
degradation of widely used agrochemicals by anodic Fenton treatment in soil slurry
systems. He very much enjoyed the working atmosphere here: nicest advisors, friendly
co-workers, and best educational and experimental resources.
In the fall of 2008, after completing his PhD degree, he accepted a chemist position
in a pharmaceutical company in Norwich NY, where he will deliver his expertise and
knowledge in the pharmaceutical industry.

iv
To my beloved parents, Zenglin Ye and Meihua Liu, my wife, Jun and my son, Ryan
v
ACKNOWLEDGMENTS
This PhD thesis would not have been possible without the support of many people.
First of all, I’d like to express my deepest gratitude to my supervisor, Prof. Ann
Lemley, who was abundantly helpful and offered invaluable assistance, support and
guidance for the research and the writing of this thesis, and also provided financial
support for my living expenses in the USA. It is a real honor and joy to work in her lab!
Deepest gratitude is also due to my committee members, Prof. Leonard Lion, Prof.
Murray McBride and Prof. Eugene Madsen without whose knowledge, instructions
and assistance this thesis would not have been completed.
I am indebted to Dr. Tewari for his continuous support on the equipments and
fruitful discussions on my LC-MS results. I also thank Dr. Weathers from Cornell’s
CCMR for her instructions and help on the x-ray diffraction experiments.
I am grateful to the post-docs in our lab, Dr. Huichun (Judy) Zhang, Dr. Lingjun
(Lynn) Kong and Dr. Xia (Sam) Zeng for their invaluable suggestions and discussions
on my research. I also want to thank all the faculties and students in the Environmental
Toxicology program who provided suggestions on my research during my seminar
presentations. I also thank the College of Human Ecology, Department of Fiber
Science and Apparel Design and USDA for the financial support for this research.
I am really grateful to my family, especially to my beloved parents for their
continuous support, encouragement and efforts of trying their best to provide me the
best education resources. At last, I want to express my special thanks to my wife, Jun.
I would not have completed my Ph.D thesis without her endless love, understanding,
encouragement and support.
vi
TABLE OF CONTENTS
Biographical Sketch………………………………………………………………….iii
Acknowledgments…………………………………………………………………….v
Table of Contents…………………………………………………………………….vi
List of Figures………………………………………………………………………..vii
List of Tables…………….…………………………………………………………...ix
List of Schemes..………………………………………………………………………x
List of Abbreviations………………………………………………………………...xi
Chapter 1 Introduction………………………………………………………………1
Chapter 2 Kinetics of Carbaryl Degradation by Anodic Fenton Treatment in a
Humic Acid Amended Artificial Soil Slurry……...……………………22
Chapter 3 Adsorption Effect on the Degradation of Carbaryl, Mecoprop and
Paraquat by Anodic Fenton Treatment in an Swy-2 Montmorillonite
Clay Slurry… …………………………………………………………..49
Chapter 4 Adsorption Effect on the Degradation of 4,6-o-dinitrocresol and p-
nitrophenol in a Montmorillonite Clay Slurry by AFT…...…………….75
Chapter 5 Effect of Goethite on the Degradation of Dinoseb by AFT……...........102
Chapter 6 Conclusions............................................................................................114

vii
LIST OF FIGURES
Figure 1.1 Scheme of membrane Anodic Fenton Treatment System…………...11
Figure 2.1 Control experiments and model fit for AFT slurry treatment data….28
Figure 2.2 Effect of humic acid content on carbaryl degradation kinetics……...32
Figure 2.3 Effect of initial pH on carbaryl degradation kinetics………………...37
Figure 2.4 Effect on initial carbaryl concentration on its degradation…………..39
Figure 2.5 Effect of H2O2:Fe2+ molar ratio on carbaryl degradation rate……….41
Figure 2.6 Effect of soil:solution ratio on carbaryl degradation rate……………43
Figure 3.1 Adsorption isotherms for carbaryl and mecoprop...........……………55
Figure 3.2 Adsorption isotherm for paraquat........................................................56
Figure 3.3 XRD of purified montmorillonite clay with different amounts of
sorbed (a) mecoprop and (b) paraquat………………………………57
Figure 3.4 Illustration of Mecoprop (a) and Paraquat (b) adsorption on
montmorillonite clay………………………………………………...59
Figure 3.5 Degradation of carbaryl with different initial concentrations in
montmorillonite clay slurry………………………………………….61
Figure 3.6 (a) Degradation of mecoprop in montmorillonite clay slurry;
(b) Model fitting parameters….………………...……………………63
Figure 3.7 XRD analysis of montmorillonite clay during (a) AFT degradation;
(b) mecoprop desorption processes………………………………….65
Figure 3.8 (a) Aqueous paraquat concentration, and (b) XRD analysis of
montmorillonite clay, during AFT degradation process……………..67
viii
LIST OF FIGURES (CONTD)
Figure 4.1 Effect of electrolytes on DNOC adsorption on Swy-2 clay………….81
Figure 4.2 XRD spectrum of DNOC adsorption at (a) different electrolytes;
(b) different pHs…………………………...………………………...84
Figure 4.3 Adsorption isotherms of PNP on purified Swy-2 clay………………84
Figure 4.4 DNOC adsorption on purified Swy-2 clay at different pHs………....86
Figure 4.5 Degradation of DNOC by AFT in Swy-2 slurry with different
electrolytes and pHs…………………………………………………86
Figure 4.6 Degradation of PNP by AFT in Swy-2 slurry with different
electrolytes and pHs………………………………………………….90
Figure 4.7 An LC spectrum of DNOC degradation intermediates………..……..91
Figure 4.8 Dynamic concentration profiles of DNOC degradation
intermediates........................................................................................94
Figure 4.9 Inorganic nitrogen concentration profile during the AFT
treatment…………………………………………………………......96
Figure 5.1 (a) Dinoseb adsorption isotherm in goethite slurry;
(b) Effect of slurry pH on the dinoseb adsorption………………….106
Figure 5.2 AFT degradation of dinoseb in aqueous solution…………………..107
Figure 5.3 AFT degradation of dinoseb in 1.0 g/L goethite slurry…………….108
Figure 5.4 (a) Effect of goethite content on the AFT degradation of dinoseb;
(b) slurry AFT model fitting parameters………..………………….109
Figure 5.5 Effect of pH on the AFT degradation of dinoseb…………………..111
ix
LIST OF TABLES
Table 1.1 Properties and structures of selected probe chemicals………………..15
Table 3.1 Freundlich equation fitting parameters for carbaryl and mecoprop
adsorption isotherms…………………………………………………..55
Table 4.1 Freundlich equation fitting parameters for DNOC and PNP adsorption
isotherms………………………………………………………………82
Table 4.2 Mass spectrum profiles of DNOC degradation intermediates..............92
Table 5.1 Soluble iron concentration in 1.0 g/L goethite slurry………………..111

x
LIST OF SCHEMES
Scheme 4.1 Proposed DNOC degradation pathways…………………………....98

xi
LIST OF ABBREVIATIONS
2,4-D: 2,4-Dichlorophenoxyacetic acid
AFT: Anodic Fenton treatment
AOPs: Advanced oxidation processes
CFT: Classic Fenton treatment
DDT: Dichloro-Diphenyl-Trichloroethane
DNOC: 4,6-o-dinitrocresol
FTIR: Fourier Transform Infrared Spectroscopy
GC: Gas chromatography
HA: Humic acid
HPLC: High performance liquid chromatography
LC-MS: Liquid chromatography-mass spectrometry
NACs: Nitroaromatic compounds
PNP: p-nitrophenol
SOM: Soil organic matter
TCE: Trichloroethylene
TNT: Trinitrotoluene
XRD: x-ray diffraction

1
Chapter 1
Introduction
During World War II, two synthetic organic chemicals, the herbicide 2,4-D and the
insecticide DDT, were introduced as defoliant and pest control reagents, respectively.
Since then, more and more biologically active synthetic organic chlorine compounds,
characterized by high persistence and a broad spectrum of activity, have been
produced and introduced for agricultural use. However, the widespread and intensive
use of these organic chlorine pesticides in the first twenty years after their introduction
caused several ecological problems, including the development of resistance in pests,
the elimination of natural pest controls, and the spread of persistent residues
throughout different compartments of the environment and their accumulation in
living systems (1). These problems led to the banning of DDT and other organic
chlorine compounds in the 1970s in the US. A world-wide action phasing out or
limiting the use of persistent organic pollutants, such as DDT, lindane and chlordane
etc., was implemented as an enforcement of the Stockholm Convention in 2004.
At the same time, with the awareness of these ecological problems, more and more
new, non-persistent or much less persistent chemicals effective only against the target
organism were successfully developed. Organic pesticides have greatly improved the
quantity and quality of food as well as the control of disease vectors and pests
adversely affecting the health and welfare of human beings. However, the concerns
about using more and more organic chemicals in agriculture did not diminish or go
away; instead, they are still growing. The main concerns include the hazard of soil
pollution by pesticides, their impact on soil fertility (1), their residues in food (2), and
their potential risk of polluting surface or ground waters (3, 4).
2
1.1 Fate, transport and transformation of organic agrochemicals in soils
Each year, millions of pounds of pesticides are applied in agriculture, forestry or
industry in the US (5) and have the potential to pollute various environmental media
such as surface water, groundwater, and soil. Pesticide sources of soil contamination
include application events, atmospheric wet or dry deposition, foliar washoff, or
accidental spills onto the soil surface or into the soil profile. Environmental sinks for
pesticides include chemical, photochemical and biological transformation,
volatilization losses, erosion and runoff, leaching, and harvest removal and storage (6).
Overall, there are several factors that can affect the half-life and final concentration
of an organic agrochemical in soil, including: retention or sorption, leaching,
volatilization, biological and chemical transformation, and photochemical degradation.
Retention of organic agrochemicals in soil
As one of the key processes strongly affecting the fate and transport of organic
chemicals in the soil- water environment, retention refers to the ability of the soil to
retain an organic molecule and to prevent the molecule from moving either within or
outside of the soil matrix (7). Retention is often referred to the adsorption process.
Adsorption is a process defined as the accumulation of a gas or liquid solute on the
surface of a solid, such as soil, or a liquid, and desorption is the reverse process of
adsorption. There are two important factors affecting the retention of an organic
chemical in a soil matrix, the nature of the soil matrix and the nature of the organic
chemical.
Based on the US Soil Conservation Service (8), “soil is the collection of natural
bodies of the earth’s surface, in places modified or even made by man or earthy
materials, containing living matter and supporting or capable of supporting plants out
3
of doors. Its upper limit is air or shallow water and its lower limit is the depth to which
soil weathering has been effective.” Thus, based on the components of the soil, it can
be defined as a mixture of minerals, organic matter, water and air. The solid phase,
including minerals and organic matter, has primary sites for chemical accumulation
and transformations. The liquid phase (water) and gas phase (air) are mainly modes of
transport for soluble and volatile chemicals.
Adsorption of organic chemicals on the surface of soil particles is dependent on the
number and type of functional groups at accessible soil inorganic and organic surfaces.
Soil inorganic components are composed of crystalline and noncrystalline, amorphous
minerals, including primary and secondary minerals. On soil inorganic surfaces the
main functional groups contributing to adsorption include siloxane ditrigonal cavities
in phyllosilicate clays, such as montmorillonite clay, and inorganic hydroxyl groups
generally associated with metal oxides, such as goethite (9). Soil organic components
include polymeric organic solids, decomposing plant and animal residues, and soil
organisms. However, the most studied soil organic matters are humic substances
(mainly humic and fulvic acids), which have many organic functional groups, such as
carboxyl, carbonyl, phenylhydroxyl, amino, imidazole, sulfhydroxyl, and sulfonic
groups. When an organic molecule reacts with the surface functional groups, either an
inner- or outer- sphere surface complex is formed (7). An inner-sphere complex is
formed directly by the organic molecule and the surface functional groups, while, an
outer-sphere complex has at lease one solvent molecule, such as water, between the
surface functional group and the organic molecule bound to it.
In addition to soil minerals and organic matter, soil water also plays an important
role in the retention of pesticides by soil in that it is both a solvent for the pesticide
and a solute that can compete for adsorption sites. Moreover, as mentioned above, soil
4
water is also directly involved in many adsorption mechanisms such as water bridging
and ligand exchange. Soil water also carries other solutes such as Fe and Al that may
be involved in cation bridging adsorption mechanisms.
The other important factor affecting the retention of an organic chemical in a soil
matrix is the nature of the organic chemical. The physical and chemical properties are
largely responsible for an organic chemical’s behavior in soil. These properties include
water solubility, pKa, pKw, polarity and functional groups, etc. For example,
researchers (10) reported a significant relationship between solubilities or
solvent-water partition coefficients of nonionic organic compounds and soil-water
distribution coefficients. By using phenols as probe chemicals, researchers found that
the type, placement and number of the functional groups determine the strength of
bonding as well as the availability for bonding (11, 12). The functional groups, such as
methyl or nitro groups, not only affect the pKa of the chemicals, but also affect the
water solubility or solvent-water coefficient.
Adsorption-desorption is a dynamic process in which molecules are continually
transferred between the bulk liquid and the solid surface. There are different
adsorption mechanisms for different organic compounds. Generally speaking, organic
compounds can be sorbed by physical/chemical bonding such as van del Waals forces
(2-4 kJ/mol), hydrogen bonding (2-60 kJ/mol), dipole-dipole interactions, ion
exchange, covalent bonding, protonation, ligand exchange, cation bridging and water
bridging with varying strengths of interactions (7).
Transformations of pesticides in soil
Microbial metabolism is the primary force in pesticide transformation or
degradation. Microorganisms are key agents in the degradation of various pesticide
5
molecules in terrestrial or aquatic systems through such processes as aerobic,
anaerobic, chemolithotrophic metabolism, fermentation, and metabolism via
extracellular enzymes. Microbial transformation of organic pesticides has been widely
studied. Generally speaking, there are five processes involved in the microbial
transformation of pesticides, including biodegradation, cometabolism, polarization or
conjugation, accumulation and secondary effects of microbial activity (13). In the
biodegradation process, organic pesticides serve as substrates and the energy source
for microbial growth; in the cometabolism process, the organic molecule is
transformed by metabolic reactions but does not serve as an energy source for the
microorganism; in polymerization or the conjugation process, organic molecules are
linked together with other human synthesized or naturally occurring organic
compounds; in the accumulation process, organic molecules are incorporated into the
microorganism. The secondary effects of microbial activity include changes of pH,
redox conditions, reactive products, etc. brought about by microorganisms in
terrestrial or aquatic environments, leading to the transformation of organic
agrochemicals.
Many types of reactions are involved in microbial transformation, for example,
oxidative reactions, hydroxylation, N-dealkylation, decarboxylation, epoxidation and
aromatic ring cleavage, etc. Usually, the microbial transformation of a pesticide
involves more than one type of mechanism, and various products can be derived from
the same parent compound depending on different environmental conditions.
Though microbial transformation is believed to be the main organic pollutant’s
transformation mechanism in soils, abiotic transformation has attracted more and more
attention recently. Abiotic transformations occur in both homogeneous phases, such as
the liquid phase, and in the solid-liquid interface (14). The most common reaction

6
organic pesticides undergo in soil solution is hydrolysis. For example, hydrolysis of
esters, such as carbamates, is one of the most important hydrolysis reactions of
pesticides. The soil solution contains numerous species that can produce free radicals
through chemical or photochemical processes (15). Non-biological oxidation by free
radicals, such as the hydroxyl radical, is another important reaction pathway for a
pesticide’s disappearance in soils (16). Other than hydrolysis and redox, many other
transformation reactions can occur in soil solution. For example, glyphosate undergoes
nitrosation to form N-nitrosoglyphosate in the presence of nitrite (17), and
chlorotriazine herbicides undergo a displacement of the chlorine atom by various
nucleophiles, such as OH, which is both acid and base catalyzed (18). Besides the
transformation in the liquid phase, heterogeneous catalysis at the solid-solution
interface, for example at the negatively charged clay surface, also plays an important
role in the transformation of some pesticides in soil, such as trifluralin, parathion and
others (19-21).
An increasing number of cases of pollution resulting from the leakage of toxic
organic substances, including pesticides, are being detected (14). The high
concentration of toxicants in these wastes often inhibits microbial degradation.
Physicochemical processes such as abiotic transformations may then be responsible
for the disappearance of the toxic organic substances that could endanger groundwater
or surface water.
1.2 Soil remediation by chemical oxidation
Due to the leaching or runoff of pesticides from fields, pesticide-contaminated soils
pose potentially serious threats to surface and ground water quality, especially when
contaminant concentrations are high due to accidental spills, discharges, or leaking
from storage tanks. This can be a problem at formulating and retail facilities, some of
7
which may qualify as superfund sites (22-24). Contaminated soils at these facilities
often contain multiple pesticide active ingredients and fertilizer components. It is
necessary to find effective ways to treat and remediate pesticide-contaminated soils in
order to reduce or eliminate their potential threats to surface water or groundwater and
to recover the soil functions. Based on EPA reports (25), there are generally four types
of soil remediation methods: biological, physical/chemical, thermal, and off-gas
treatment.
For small-scale pesticide-contaminated soils with a high concentration of organic
pollutants (for example, at a pesticide accidental spill or leaking site or a pesticide
formulating and retail facility), chemical oxidation is often used as a quick and
effective treatment method. It can also be used as a pretreatment method followed by
biological remediation. In situ chemical oxidation is one of several innovative
technologies that shows promise in destroying or degrading an extensive variety of
hazardous wastes in ground water, sediments, and soil. The oxidants used are readily
available, and the treatment time is usually much shorter than that of biological
methods, making the process economically feasible (26). In situ chemical oxidation is
based on the delivery of chemical oxidants to the contaminated media in order to
destroy the contaminants by converting them into innocuous compounds commonly
found in nature. The oxidants applied in this process are typically hydrogen peroxide,
potassium permanganate, ozone, or, to a lesser extent, dissolved oxygen.
Chemical oxidation-Fenton reaction
By far, the most common field applications of the chemical oxidation method have
been based on the Fenton reagent whereby hydrogen peroxide is applied with an iron
catalyst, creating a hydroxyl free radical (Fe2+ + H2O2 → Fe3+ + OH- + OH·). Henry J.
Fenton first reported this reaction in 1894, hence the name Fenton reaction. Since

8
then, Fenton and related reactions have become of great interest for their relevance to
the chemistry of natural waters, the treatment of hazardous wastes, synthesis, and
biological chemistry. A search of the topic ‘Fenton reaction’ in SciFinder yielded
nearly 3000 scientific articles since 1930. Moreover, the number of articles increased
quickly in the past decade from 118 articles/year in 1997 to 313 articles/year in 2007.
In 1934, Haber and Weiss (27) first proposed that the active oxidant generated by
the Fenton reaction is the hydroxyl radical, one of the most powerful known oxidants.
Less than two decades later, in the 1950s, Barb et al. (28-30) proposed the now-called
classical or free radical mechanism for decomposition in acidic solution in the dark.
The proposed mechanism consists of the sequence of following reactions:
Fe(II) + H2O2 Fe(III) + OH- + ·OH (1)
Fe(III) + H2O2 Fe(II) + HO2· + H+ (2)
·OH + H2O2 HO2· + H2O (3)
·OH + Fe(II) Fe(III) + OH- (4)
Fe(III) + HO2· Fe(II) + O2H+ (5)
Fe(II) + HO2· + H+ Fe(III) + H2O2 (6)
HO2· + HO2· H2O2 + O2 (7)
In 1975, more than another two decades later, Walling (31) revisited and renewed
the interest in Fenton chemistry among researchers in multiple fields of chemistry,
such as biochemistry.
Hydroxyl radicals are nonspecific oxidants and are capable of oxidizing complex
organic compounds (R-H + HO· → R· + H2O) at rates close to their theoretical limit,
which is controlled by the rate of diffusion in water [~1010 1/(M·s)]. The reactions of
9
HO· with organic compounds lead to the formation of carbon-centered radicals. The
hydroxyl radical—always present in vanishingly small concentration—reacts in
well-known ways with organic compounds, principally by abstracting H from C-H,
N-H, or O-H bonds, adding to C=C bonds, or adding to aromatic rings (32, 33).
The Fenton and related reactions are viewed as potentially convenient and
economical ways to generate oxidizing species for treating chemical wastes. Iron is
comparatively inexpensive, safe, and environmentally friendly. Hydrogen peroxide is
also relatively inexpensive, safe, and easy to handle, and poses no lasting
environmental threat since it readily decomposes to water and oxygen (26). This
process has a history of application in waste treatment fields and is widely used in
wastewater treatment (34-36). Watts and colleagues first used Fenton reagents and
Fenton-like processes in degrading organic pollutants, such as pentachlorophenol,
trifluralin, hexadecane, dieldrin and TCE etc., in contaminated soils (37-41). They
found that Fenton or Fenton-like processes could successfully decompose those
organic pollutants in surface soils. For example, they successfully decomposed high
concentrations of pentachlorophenol in soil by using 7% H2O2 and 8 mM iron (II) at
pH 3. They also found that the sorption process between organic pollutants and the
soil particles played an important role in the oxidation process, and that the oxidation
process and dynamics were greatly affected by the sorption and desorption processes.
It was also believed that heterogeneous oxidation reactions might have occurred at the
soil particle surface.
There are many kinetic models developed to describe the degradation of organic
pollutants in the aqueous phase by the Fenton or Photo-Fenton process (42, 43).
However, there is still no kinetic model describing the degradation process in soil by
the Fenton process, likely due to the complexity of the soil media, in which soil
10
components and soil characteristics such as the soil organic matter, soil minerals, and
soil pH may affect both the Fenton and the oxidation reactions.
Anodic Fenton Treatment (AFT) technology
In order to make the Fenton treatment method more practical and manageable,
several researchers developed an innovative Fenton treatment method, called
membrane Anodic Fenton Treatment technology (44, 45). The basic idea of this
technology is to deliver the Fenton reagents, i.e., ferrous ion and hydrogen peroxide,
continuously. Specifically, ferrous ion is delivered by electrochemical reaction through
an iron electrode, and hydrogen peroxide is delivered by a peristaltic pump. This
technology made a significant improvement to the classic Fenton treatment (CFT),
which has two drawbacks in its application in wastewater treatment (46): one is the
low pH of the effluent (the optimized pH value for CFT is about 3) that requires
neutralization prior to the discharge, and the other is the handling of ferrous salts and
accurately delivering the ferrous solution into the reaction system, because ferrous salt
is hygroscopic and aqueous ferrous ion is readily oxidizable. Anodic Fenton treatment
method has overcome these two drawbacks. The whole AFT system can be illustrated
in the following scheme (Fig 1.1).
11
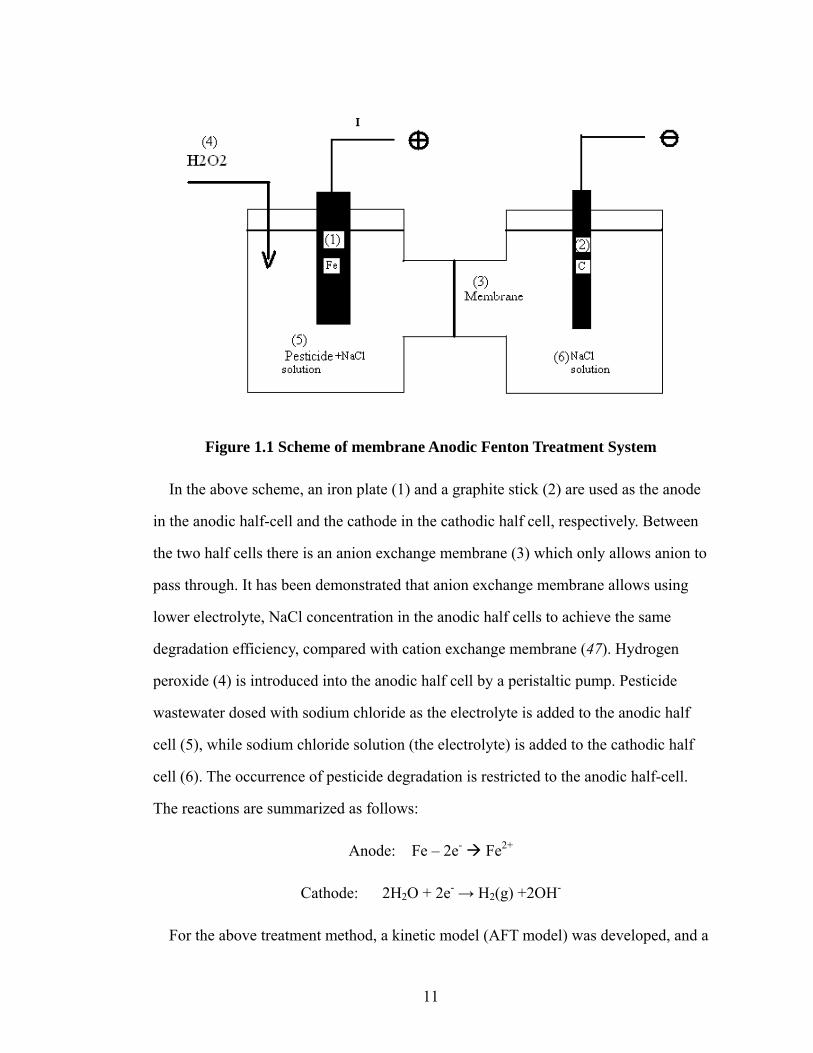
Figure 1.1 Scheme of membrane Anodic Fenton Treatment System
In the above scheme, an iron plate (1) and a graphite stick (2) are used as the anode
in the anodic half-cell and the cathode in the cathodic half cell, respectively. Between
the two half cells there is an anion exchange membrane (3) which only allows anion to
pass through. It has been demonstrated that anion exchange membrane allows using
lower electrolyte, NaCl concentration in the anodic half cells to achieve the same
degradation efficiency, compared with cation exchange membrane (47). Hydrogen
peroxide (4) is introduced into the anodic half cell by a peristaltic pump. Pesticide
wastewater dosed with sodium chloride as the electrolyte is added to the anodic half
cell (5), while sodium chloride solution (the electrolyte) is added to the cathodic half
cell (6). The occurrence of pesticide degradation is restricted to the anodic half-cell.
The reactions are summarized as follows:
Anode: Fe – 2e- Fe2+
Cathode: 2H2O + 2e- → H2(g) +2OH-
For the above treatment method, a kinetic model (AFT model) was developed, and a
12
brief summary of the model is as follows (44, 45). Several assumptions were made as
the basis of the model: (i) the concentration of ferrous iron in the reaction system is
constant; (ii) hydrogen peroxide can be accumulated in the reaction system when the
ratio of hydrogen peroxide to ferrous ion is >1; (iii) the Fenton reaction obeys
second-order kinetics; (iv) the instantaneous concentration of hydroxyl radical is
proportional to its generation rate; and (v) the kinetics of the hydroxyl radical reaction
with organics are second order. The following equation was developed to describe the
model:
202
1
0][
][ln tK
CtC
λπωυ−=
In the above equation, [C]0 (μM) and [C]t (μM) are the pesticide concentrations at
time 0 and t min, respectively; K=k·k1, (μM-2·min-2), in which k (μM-1·min-1), and k1
(μM-1·min-1) are the second order rate constants of the Fenton reaction and the reaction
between hydroxyl radical and target compound, respectively; λ (min) and π (min) are
the average lifetimes of the hydroxyl radical and ferrous ion, respectively; ω is a
constant related to the delivery ratio of hydrogen peroxide to ferrous ion and to the
consumption ratio of hydrogen peroxide; ν0 (μM·min-1) is the delivery rate of ferrous
ion by electrolysis; and t (min) is time.
The AFT overcomes the two drawbacks of the classic Fenton treatment method.
The Fenton reaction occurs in self-developed optimal acidic conditions (pH ~3) and
the pH of the treatment effluent can be partially neutralized from 3 to 5 by combining
the solutions from the two half-cells. Also, by using an iron plate as the ferrous ion
source, the handling of large amounts of ferrous salt in practical applications is no
longer needed.

13
Many pesticides or herbicides, such as ethylene thiourea, 2,4-D, atrazine, carbaryl
and carbofuran, have been tested by this technology, and except for some pesticides
with extremely low water solubility, most of them can be degraded quickly in several
minutes under given experimental conditions, and the degradation processes fitted the
developed AFT kinetic model quite well (44-46, 48-51).
1.3 Objectives
As discussed above, organic pollutants in soil can persist for a long time before
being removed by natural biological or chemical processes. For lower levels of
contamination, many organic pollutants can be cleaned by the soil ecosystem itself,
posing lower potential risk for ecosystem, surface water and groundwater
contamination. However, when the contamination is at a high level because of
accidental spills, leakages or discharges, the contamination is obviously beyond the
self-cleaning capacity of the soil system, and it is necessary to do a remediation
treatment.
AFT is a successful lab application for degrading organic pollutants in aqueous
systems. In order to further apply AFT to the treatment of contaminated soil, two
preliminary studies were done on the degradation of pesticides in a slurry system.
Wang and Lemley (52) showed that humic acid in a slurry that was a mimic of soil
organic matter greatly affected the degradation rate and kinetics of alachlor; the
authors also concluded that the shift in degradation kinetics could be attributed to the
pH buffering capacity of humic acid. In another study, Kong and Lemley (53) used a
real soil sample and demonstrated that 90% of 400 μM of 2,4-D was destroyed in the
slurry within 20 minutes, and a two-stage degradation kinetic model was proposed.
Although the effect of sorption on the degradation kinetics was discussed in both
studies, this effect was not incorporated into the kinetic model, and the humic acid
14
used in the first study did not represent actual soil. Because of the lack of control
with actual soil in the second study and the complexity of soil components, it was
impossible to distinguish the effects of important individual soil properties such as soil
organic matter, clays and oxides.
In this study, a synthetic soil, composed of humic acid, clay and sand, was chosen to
mimic real soil, and the effect of each component was investigated. The components
are all commercially available and can be easily to be controlled. The effects of each
component can also be distinguished by doing control experiments.
The overall objectives of this research are: (1) to develop a kinetic model that can
describe the pesticide degradation in a slurry system; (2) to identify the effects of
different soil components on the AFT degradation of selected probe chemicals; and (3)
to understand these effects through various mechanisms, such as adsorption or pH
buffering capacity.
15
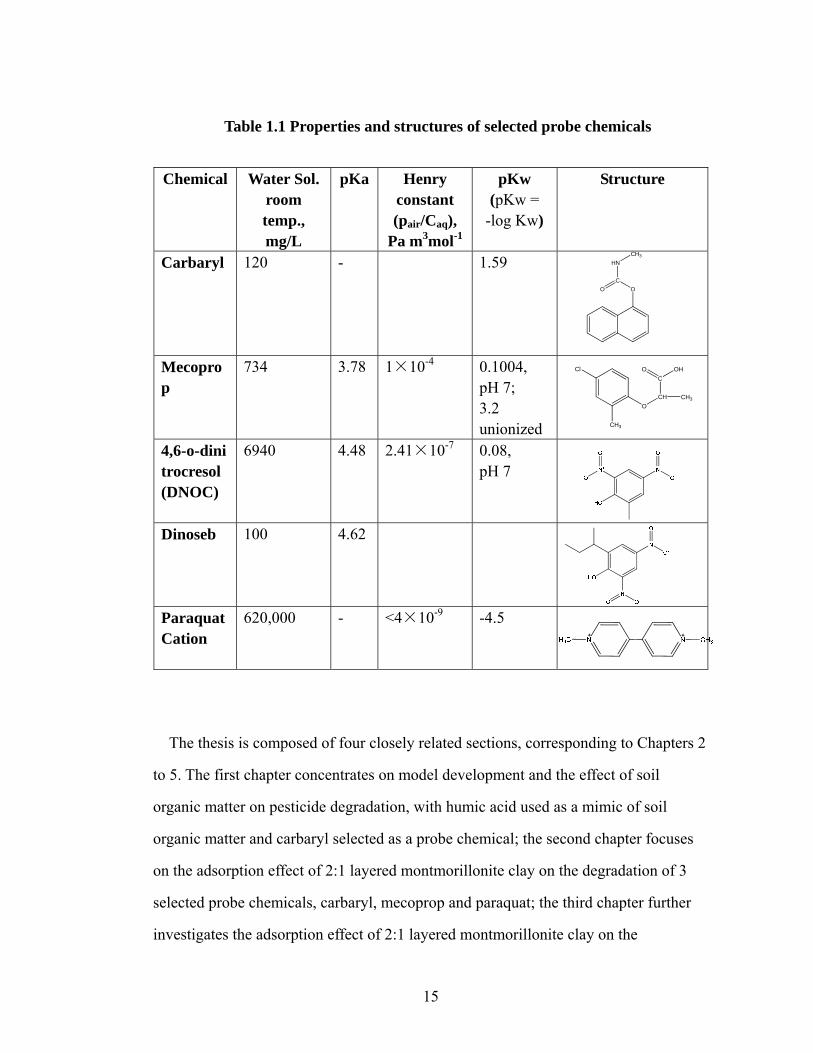
Table 1.1 Properties and structures of selected probe chemicals
Chemical Water Sol.
room temp., mg/L
pKa Henry constant (pair/Caq),
Pa m3mol-1
pKw (pKw =
-log Kw)
Structure
Carbaryl 120 - 1.59
Mecoprop
734 3.78 1×10⁻⁴ 0.1004, pH 7; 3.2 unionized
4,6-o-dinitrocresol (DNOC)
6940 4.48 2.41×10⁻⁷ 0.08, pH 7
Dinoseb 100 4.62
Paraquat Cation
620,000 - <4×10⁻⁹ -4.5
The thesis is composed of four closely related sections, corresponding to Chapters 2
to 5. The first chapter concentrates on model development and the effect of soil
organic matter on pesticide degradation, with humic acid used as a mimic of soil
organic matter and carbaryl selected as a probe chemical; the second chapter focuses
on the adsorption effect of 2:1 layered montmorillonite clay on the degradation of 3
selected probe chemicals, carbaryl, mecoprop and paraquat; the third chapter further
investigates the adsorption effect of 2:1 layered montmorillonite clay on the
OC
HN
O
CH3
Cl
CH3
OCH CH3
CO OH
16
degradation of nitroaromatics, 4,6-dinitro-o-cresol and p-nitrophenol which have a
special adsorption mechanism in clay in the presence of certain cations, such as K+ or
NH4+; the last chapter explores the effect of soil inorganic minerals on the AFT
degradation of dinoseb, using goethite as a model mineral.
The structures and basic physical and chemical properties of selected probe
chemicals are listed in the following table, Table 1.1.

17
REFERENCES
1. Saltzman, S.; Yaron, B., Pesticides in soil. New York: Van Nostrand Reinhold Co.: 1986; p 1-5.
2. Hamilton, D.; Crossley, S., Pesticide Residues in Food and Drinking Water: Human Exposure and Risks. Wiley: 2004.
3. Larson, S. J.; Capel, P. D.; Majewski, M. S., Pesticides in Surface Waters: Distribution, Trends, and Governing Factors. CRC Press: 1997.
4. Barbash, J. E.; Resek, E. A., Pesticides in Ground Water: Distribution, Trends, and Governing Factors. Ann Arbor Press Chelsea, Mich (USA): 1996.
5. Kiely, T.; Donaldson, D.; Grube, A. Pesticides industry sales and usage: 2000 and 2001 market estimates. http://www.epa.gov/oppbead1/pestsales/01pestsales/table_of_contents2001.html
6. Himel, C. M.; Loats, H.; Bailey, G. W., Pesticides sources to the soil and principles of spray physics. In Pesticides in the soil environment: Processes, Impacts, and Modeling, Cheng, H. H., Ed. Soil Science Society of America, Inc.: Madsion,WI USA, 1990; pp 7-50.
7. Koskinen, W. C.; Harper, S. S., The retention process: mechanisms. In Pesticides in the Soil Environment: Processes, Impacts, and Modeling, Cheng, H. H., Ed. Soil Science Society of America, Inc.: Madsion, WI USA, 1990; pp 51-73.
8. Soil Survey Staff, Soil Taxonomy: A Basic system of soil classification for making and interpreting soil surveys. Soil Conservation Service, U.S. Dept. of Agriculture: Washington, DC, 1975; p 754.
9. Sposito, G., The Surface Chemistry of Soils. Oxford University Press: New York, 1984.
10. Chiou, C. T.; Peters, L. J.; Freed, V. H., A Physical Concept of Soil-Water Equilibria for Nonionic Organic Compounds. Science 1979, 206, (4420), 831-832.
11. Isaacson, P. J., Sorption of phenol vapors and influence of ring substitution. Soil science 1985, 140, (3), 189-193.
18
12. Boyd, S. A., Adsorption of substituted phenols by soil. Soil Sci 1982, 134, (5), 337-343.
13. Bollag, J.-M.; Liu, S.-Y., Biological transformaiton processes of pesticides. In Pesticides in the Soil Environment: Processes, Impacts, and Modeling, Cheng, H. H., Ed. Soil Science Society of America, Inc: Madison, Wisconsin, USA, 1990; pp 169-212.
14. Wolfe, N. L.; Mingelgrin, U.; Miller, G. C., Abiotic transformations in water, sediments, and soil. In Pesticides in the Soil Environment: Processes, Impacts, and Modeling, Cheng, H. H., Ed. Soil Science Society of America, Inc.: Madison, Wisconsin, USA, 1990; pp 103-168.
15. Steelink, C.; Tollin, G., Free radicals in soil. In Soil Biochemistry, McLaren, A. D.; Peterson, G. H., Eds. Marcel Dekker: New York, 1967; pp 147-172.
16. Kaufman, D. D.; Plimmer, J. R.; Keamey, P. C.; Blake, J.; Guardia, F. S., Chemical versus microbial decomposition of amitrole in soil. Weed Sci 1968, 16, 266-272.
17. Young, J. C.; Khan, S. U., Kinetics of nitrosation of the herbicide glyphosate. J Environ Sci Health B 1978, 13, (1), 59-72.
18. Burkhard, N.; Guth, J. A., Chemical Hydrolysis of 2-Chloro-4, 6-Bis (alkylamino)-1, 3, 5-Triazine Herbicides and Their Breakdown in Soil Under the Influence of Adsorption. PESTICIDE SCI. 1981, 12, (1), 45-52.
19. Probst, G. W.; Tepe, J. B., Trifluralin and related compounds. Degradation of Herbicides. New York: Marcel Dekker 1969, 255?82.
20. Spencer, W. F.; Adams, J. D.; Shoup, T. D.; Shoup, T. D.; Spear, R. C., Conversion of parathion to paraoxon on soil dusts and clay minerals as affected by ozone and uv light. Journal of Agricultural and Food Chemistry 1980, 28, (2), 366-371.
21. Morrill, L. G.; Mahilum, B. C.; Mohiuddin, S. H., Organic Compounds in Soils: Sorption, Degradation, and Persistence. Ann Arbor Science: 1982.
22. Shea, P. J., Machacek, T.A. and Comfort, S.D., Accelerated remediation of pesticide-contaminated soil with zerovalent iron. Environmental Pollution 2004, 132, 183-188.

19
23. Felsot, A. S., Options for cleanup and disposal of pesticide wastes generated on a small-scale. J. Environ. Sci. Health Part B 1996, B31, 365-381.
24. Felsot, A. S., User sites and the generation of pesticide waste. In: Kearney, P.C., Roberts, T. (Eds.), Pesticide Remediation in Soils and Water. 1998, John Wiley & Sons Ltd, New York, pp1-19.
25. EPA, Innovative remediation technologies: field-scale demonstration projects in North America, http://clu-in.org/download/remed/nairt_2000.pdf. In 2000.
26. EPA, Field Applications of In Situ Remediation Technologies: Chemical Oxidation. 1998, EPA 542-R-98-008.
27. Haber, F.; Weiss, J., The catalytic decomposition of hydrogen peroxide by iron salts. Proceedings of the Royal Society of London. Series A, Mathematical and Physical Sciences 1934, 147, (861), 332-351.
28. Barb, W. G.; Baxendale, J. H.; George, P.; Hargrave, K. R., Reactions of ferrous and ferric ions with hydrogen peroxide. Nature 1949, 163, 692-694.
29. Barb, W. G.; Baxendale, J. H.; George, P.; Hargrave, K. R., Reactions ferrous and ferric ions with hydrogen peroxide. Part II.---The ferric ion reaction. Trans. Faraday Soc. 1951, 47, 591-616.
30. Barb, W. G.; Baxendale, J. H.; George, P.; Hargrave, K. R., Reactions of ferrous and ferric ions with hydrogen peroxide. Part I.---The ferrous ion reaction. Trans. Faraday Soc. 1951, 47, 462-500.
31. Walling, C., Fenton's reagent revisited. Accounts Chem. Res. 1975, 8, (4), 125-131.
32. Buxton, G. V.; Greenstock, C. L.; Helman, W. P.; Ross, A. B., Critical review of rate constants for reactions of hydrated electrons, hydrogen atoms and hydroxyl radicals (OH/.O-) in aqueous solutions. J. Phys. Chem. Ref. Data 1988, 17, 513-886.
33. Von Sonntag, C.; Schuchmann, H. P., Peroxyl radicals in aqueous solutions. In Peroxyl Radicals, Alfassi, Z. B., Ed. John Wiley and Sons: New York, 1997; pp 173-234.
34. Casado, J., Fornaguera, Jordi, Galan, Maria Isabel, Mineralization of Aromatics in
20
Water by Sunlight-Assisted Electro-Fenton Technology in a Pilot Reactor. Environ. Sci. Technol. 2005, 39, 1843-1847.
35. Chen, F., Ma, Wanhong, He, Jianjun, Zhao, Jincai, Fenton degradation of malachite green catalyzed by aromatic additives. J. Phys. Chem. A 2002, 106, (41), 9485-9490.
36. Hapeman, C. J. T., A., Direct radical oxidation processes. In: Kearney, P.C., Roberts, T. (Eds.), Pesticide Remediation in Soils and Water. 1998, 161-180.
37. Tyre, B. W., Watts, R. J., and Miller, G. C., Treatment of four biorefractory contaminants in soils using catalyzed hydrogen peroxide. J. Environ. Qual. 1991, 20, (6), 832-888.
38. Watts, R. J., Udell, M. D., and Rauch, P. A., Treatment of pentachlorophenol-contaminated soils using Fentonメ s reagent. Hazard. Waste Hazard. Mater. 1990, 7, (4), 335-345.
39. Watts, R. J., Kong, S., Dippre, M., and Barnes, W. T., Oxidation of sorbed hexachlorobenzene in soils using catalyzed hydrogen peroxide. J. Hazard. Mater. 1994, 39, (1), 33-47.
40. Watts, R. J., Jones, A. P., Chen, P. H., and Kenny, A., Mineral catalyzed Fenton-like oxidation of sorbed chlorobenzenes. Water Resour. Res. 1997, 69, (2), 269-275.
41. Watts, R. J., Bottenberg, B. C., Jensen, M. E., Hess, T. H., and Teel, A. L., Mechanism of the enhanced treatment of chloroaliphatic compounds by Fenton-like reactions. Environ. Sci. Technol. 1999, 33, (12), 3432-3437.
42. Lin, K., Yuan, Dongxing, Chen, Meng, and Deng, Yongzhi, Kinetics and Products of Photo-Fenton Degradation of Triazophos. J. Agric. Food Chem. 2004, 52, 7614-7620.
43. Moraes, J., Quina, Frankh, Nascimento, Claudioaugustoo, Silva, Douglasn, and O S V A L D O C H I A V O N E - F I L H O, Treatment of saline wastewater contaminated with hydrocarbons by the Photo-Fenton Process. Environ. Sci. Technol. 2004, 38, 1183-1187.
44. Saltmiras, D. A., and A.T. Lemley., Degradation of ethylene thiourea (ETU) with
21
three Fenton treatment processes. J. Agric. Food Chem. 2000, 48, 6149-6157.
45. Wang, Q.-Q., and A.T. Lemley., Kinetic model and optimization of 2,4-D degradation by Anodic Fenton treatment. Environ. Sci. Technol 2001, 35, 4509-4514.
46. Wang, Q. a. A. T. L., Oxidation of Carbaryl in aqueous solution by membrane Anodic Fenton Treatment. J. Agric. Food Chem. 2002, 50, 2331-2337.
47. Wang, Q.; Lemley, A. T., Oxidation of Carbaryl in Aqueous Solution by Membrane Anodic Fenton Treatment. J. Agric. Food Chem. 2002, 50, (8), 2331-2337.
48. Saltmiras, D. A., and A.T. Lemley., Anodic Fenton treatment of treflan MTF®. J. Environ. Sci. Health Part A Toxic/Hazard. Subst. Environ. Eng. 2001, A36, 261-274.
49. Saltmiras, D. A., and A.T. Lemley., Atrazine degradation by anodic Fenton treatment. Water Res. 2002, 36, 5113-5119.
50. Wang, Q.-Q., and A.T. Lemley., Oxidative degradation and detoxification of aqueous carfuran by membrane anodic Fenton treatment. J. Hazard. Mater. 2003, B98, 241-255.
51. Wang, Q.-Q., and A.T. Lemley., Competitive degradation and detoxification of carbamate insecticides by membrane anodic Fenton treatment. J. Agric. Food Chem. 2003, 51, (5382-5390).
52. Wang, Q.-Q.; Lemley, A. T., Kinetic effect of humic acid on alachlor degradation by anodic fenton treatment. J. Environ. Qual. 2004, 33, 2343-2352.
53. Kong, L.; Lemley, A. T., Kinetic modeling of 2,4-dichlorophenoxyacetic acid
(2,4-D) degradation in soil slurry by Anodic Fenton Treatment. J. Agric. Food Chem.
2006, 54, 3941-3950.

22
Chapter 2
Kinetics of Carbaryl Degradation by Anodic Fenton Treatment in a Humic Acid
Amended Artificial Soil Slurry
2.1 Introduction
Each year, millions of pounds of pesticides and herbicides are used in agriculture,
forestry or other industries in the US (1), leading to significant potential pollution of
environmental media such as surface water, groundwater, and soil. Pesticide sources
of soil contamination include application events, atmospheric wet or dry deposition,
foliar washoff, or accidental spills onto the soil surface or into the soil profile (2). Due
to the leaching or runoff of pesticides from fields, pesticide-contaminated soils pose
potentially serious threats to surface and ground water quality, especially when
contaminant concentrations are high due to accidental spills, discharges, or leakage
from storage tanks. This can be a problem at formulating and retail facilities, some of
which may qualify as superfund sites (3-5).
Many soil remediation methods, either physical, chemical, biological or a
combination, are available for use. However, there is no perfect one, and remediation
method selection should be site-, contaminant-, target- and budget-specific. Among
remediation methods, advanced oxidation processes (AOPs) are often used as fast and
effective treatment methods for organic chemical contaminated water or soil, due to
the high efficiency and relatively low cost. One of the well documented and common
field applications of AOPs is based on the Fenton reagent whereby hydrogen peroxide
is applied with ferrous ion, producing hydroxyl radicals (6). Hydroxyl radicals are
nonspecific oxidants and are capable of oxidizing complex organic compounds at rates

23
close to their theoretical limit, which is controlled by the rate of diffusion in water
(~1010 M-1·s-1) (7).
The Fenton process has a history of application in wastewater treatment (8-10).
Watts and colleagues first used Fenton reagents and Fenton-like processes in
degrading organic pollutants, such as pentachlorophenol, trifluralin, hexadecane,
dieldrin and TCE in contaminated soils (11-16). For example, pentachlorophenol in
soil was successfully degraded by using 7% H2O2 and 8 mM iron (II) at pH 3, and the
degradation rate decreased as a function of soil organic carbon content. Degradation of
various other contaminants such as TNT, heterocyclic nitramines, 2,4-D and
metolachlor, and PAHs in soil has also been studied (17-22). These studies
demonstrate Fenton oxidation as a promising contaminated soil remediation method.
In order to avoid highly hygroscopic and readily oxidizable ferrous salt used in
classic Fenton treatment and to make the Fenton treatment method more manageable,
an innovative indirect electrochemical Fenton method called anodic Fenton treatment
(AFT) was developed in our laboratory (23, 24). The basic idea of this method is to
generate ferrous ion electrochemically by the oxidation of an iron anode and to deliver
hydrogen peroxide continuously into the anodic half cell through a pump. The AFT
method has been successfully applied to degrade and detoxify many pesticides, such
as ethylene thiourea, 2,4-D, carbaryl and carbofuran, etc. (23-27, 28, b, 29). Those
chemicals could be removed from the aqueous system within several minutes under
given conditions. A kinetic model, the AFT kinetic model was developed to describe
pesticide degradation during AFT treatment in an aqueous environment (23, 24), and
the model gave good fits to the degradation process.
Encouraged by the successful application of AFT in aqueous solution, two
preliminary studies were done on the degradation of pesticides in a slurry system.

24
Wang and Lemley (30) showed that humic acid in a slurry that was a mimic of soil
organic matter greatly affected the degradation rate and kinetics of alachlor, and the
authors concluded that the shift in degradation kinetics could be attributed to the pH
buffering capacity of humic acid. Another study, conducted by Kong and Lemley (31)
and using a real soil sample, demonstrated that 90% of 400 μM of 2,4-D was
destroyed in the slurry within 20 minutes, and a two-stage degradation kinetic model
was proposed. Although the effect of sorption on the degradation kinetics was
discussed in both studies, this effect was not incorporated into the kinetic model. Also,
the humic acid used in the first study did not represent actual soil, but for the actual
soil used in the second study, it is impossible to distinguish the effects of important
individual soil properties such as soil organic matter and soil minerals.
Thus, an artificial soil that is a mixture of humic acid, kaolinite clay and silica sand
was selected as a mimic of soil, and a widely used insecticide, carbaryl, was selected
as a probe chemical in this study. Objectives of this study are: (a) to develop a kinetic
model that describes carbaryl degradation in the AFT-slurry system; (b) to test the
model and explain the model fitting parameters, and (c) to investigate the effects of
humic acid, kaolinite clay and sand, pH, Fenton reagent delivery ratio and initial
carbaryl concentration on the degradation of carbaryl during the AFT process.
2.2 Methodology
Chemicals
Carbaryl (99.5%, CAS RN 63-25-2) was purchased from ChemService, Inc (West
Chester, PA). Hydrogen peroxide (30%, analytical grade), silica sand (50~70 mesh),
humic acid (HA), kaolinite and catalase (EC 1.11.1.6, from Bovine liver) were from
Sigma-Aldrich (St. Louis, MO). Water and acetonitrile, all HPLC grade, were from
Fisher Scientific (Pittsburgh, PA), respectively. Methanol (HPLC grade), sodium
25
chloride and concentrated sulfuric acid (98%) were from Mallinckrodt Chemicals
(Phillipsburg, NJ). Deoinized water (electricity resistant, R≥18.1 MΩ.cm-1) was
produced by an MP-1 Mega-PureTM system (Corning, NY)
Artificial soil and soil slurry
Silica sand, humic acid and kaolinite clay were mixed together as a model artificial
soil. The weight ratio of silica sand and kaolinite clay was set as 10:9 and given
amount of humic acid was added. For example, 10 g artificial soil containing 1.0%
humic acid was prepared by mixing 0.1 g humic acid with 9.9 g silica sand and
kaolinite clay. The artificial soil slurry was prepared by mixing given amount of
artificial soil and carbaryl solution, and the ionic strength of the slurry was maintained
by 0.01M CaCl2. Based on a preliminary adsorption kinetics study (data not shown),
the adsorption equilibrium could be attained within 24 hours. The mixture was shaken
for 24 hours (180 osc/min) on an Eberbach Labtools 6010 shaker (Eberbach
Corporation, Ann Arbor, MI) prior to use.
Degradation of carbaryl in artificial soil slurry
All experiments were carried out in two 150-mL glass cells; a scheme of the
experimental apparatus is shown in Fig. 1.1.. Typically, 100 mL of 100 μM carbaryl
artificial soil slurry with 0.02M NaCl was added to the anodic half-cell, and the same
volume of 0.08M NaCl solution was added to the cathodic half-cell. These two
half-cells were separated by an anion exchange membrane (Electrosynthesis Company,
Inc., Lancaster, NY). Each of the half-cells was well stirred by a magnetic stir bar.
Ferrous ion was generated by electrolysis in the anodic half-cell from a pure iron
anode (2 cm × 10 cm × 0.2 cm). A graphite stick (1 cm (i.d.) × 10 cm (length)) was
used as the cathode. The electrolysis current was controlled at 0.050 A by a BK
Precision DC power supply 1610 (TestPath, Inc., Danvers, MA). 0.311 M hydrogen
26
peroxide solution was delivered to the anodic half-cell using a STEPDOS® Diaphragm
Metering Pump (KNF NEUBERGER, Inc., Trenton, NJ) at a rate of 0.50 mL min-1.
When the first drop of hydrogen peroxide dropped into the anodic half-cell, the
electrolysis current was turned on. Soil/solution ratio, molar ratio of H2O2 and Fe2+,
initial carbaryl concentration, pH and humic acid content were kept at 1:10 (w/v), 10:1,
100 μM, pH 3 and 5.0%, respectively, unless specified, and all experiments were
conducted at room temperature, 22±1 C. At given time intervals, a 0.5 mL sample
was collected and added to a 1.5 mL Microfuge tube (Laboratory Products Sales,
Rochester, NY) containing 0.5 mL methanol which quenched the hydroxyl radical and
extracted carbaryl from the slurry in order to measure total carbaryl concentration. The
sample tubes were shaken for 5 minutes on an Eberbach 6010 shaker before being
centrifuged for 10 minutes at a rate of 10,000 rpm in an Eppendorf ® MiniSpin
Personal Microcentrifuge (Westbury, NY). Through preliminary experiment, by
comparing the carbaryl mass before and after methanol extraction, it was found that
the carbaryl extraction efficiency was >98%. The supernatant was collected for
carbaryl concentration analysis. The experiments were repeated three times.
In order to measure aqueous phase concentration and total concentration over time,
two anodic slurry samples, 1.0 mL and 0.5 mL, were collected simultaneously and
added separately to two 1.5 mL Microfuge tubes with one containing 0.10 mL catalase
solution (about 8,000 units activity) to destroy the residual hydrogen peroxide without
extracting carbaryl from the solid phase and the other containing 0.5 mL methanol to
quench hydroxyl radicals and extract carbaryl from the slurry. The first set of samples
was centrifuged (10 minutes at 10,000 rpm) immediately after being collected, and
thus reflected carbaryl concentration in the aqueous phase of the slurry; the second set
reflected total carbaryl concentration in the slurry.
27
Carbaryl concentration measurement
The concentration of carbaryl was measured by an HP 1100 HPLC (Agilent
Technologies, Inc, Santa Clara, CA) equipped with a DAD detector. The mobile phase
was composed of 50% acetonitrile and 50% water (HPLC grade, pH 3, adjusted by
H3PO4). A C18 5 μm 250 mm × 4.6 mm (i.d.) Restek reverse phase column was used.
The chosen wavelength was 220 nm. Under these conditions, a clear carbaryl peak
was obtained with good purity, symmetry and a retention time of 7.83 min.
Data analysis
All data analysis and model fitting work were conducted by using SigmaPlot 9.0
(Systat Software, Inc, Point Richmond, CA).
2.3 Results and Discussion
Kinetic model development.
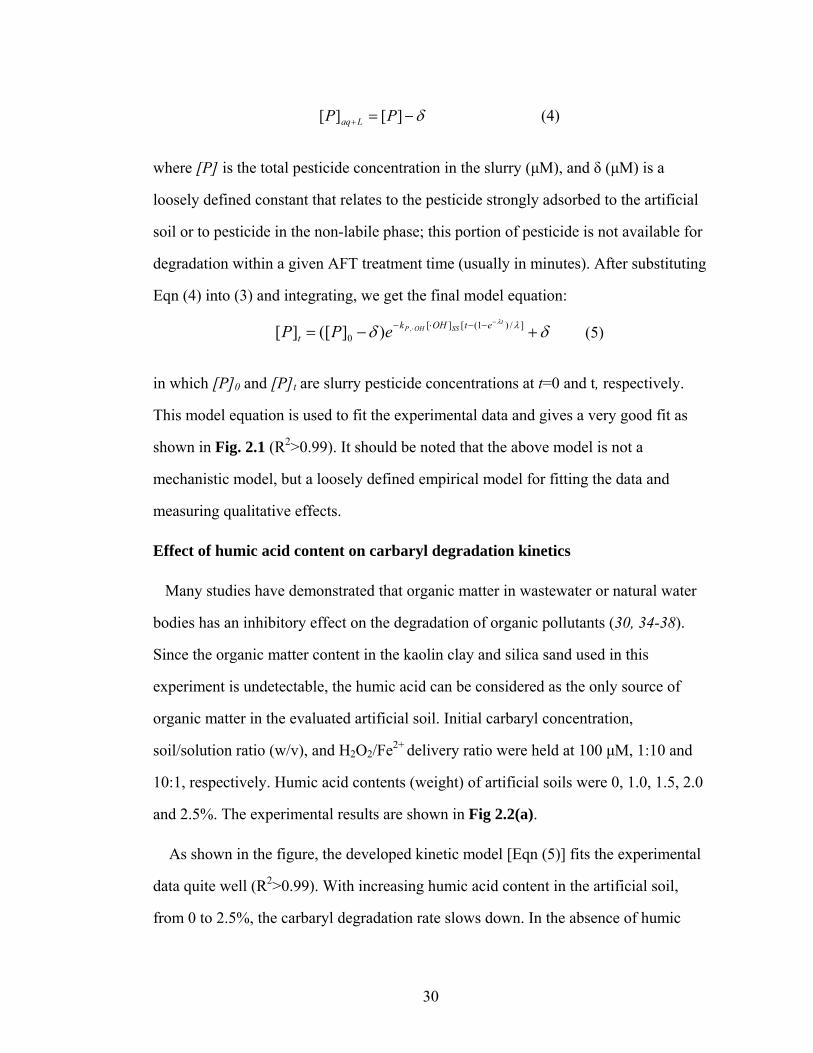
A set of control experiments without Fenton reagents or with only ferrous ion or
hydrogen peroxide and AFT batch treatment of carbaryl in the artificial soil slurry
were conducted; data are shown in Fig 2.1. It is clear that in the absence of Fenton
reagents, the carbaryl loss due to natural decomposition or adsorption on the wall of
the glass reactor is negligible.
The previously developed AFT kinetic model for aqueous solution was found not to
fit the experimental data, as shown in Fig 2.1. An empirical kinetic model was
developed to simulate the pesticide degradation in the soil slurry system.

28
Time: min
0 2 4 6 8 10 12 14
Car
bary
l con
cent
ratio
n: μ
Μ
0
20
40
60
80
100
120
No Fe2+ inputNo H2O2 input No Fe2+ & H2O2 input
With Fe2+ & H2O2 input
Figure 2.1 Control experiments and model fit for AFT slurry treatment data.
Points are experimental data; dotted line represents model fit by AFT kinetic
model for aqueous solution; solid line represents model fit by newly developed
model.
In the AFT system hydroxyl radical is produced in the anodic half cell through the
Fenton reaction. In the development of the AFT kinetic model for an aqueous solution
system, a well justified assumption was made that, within limited treatment time,
hydroxyl radical concentration is proportional to its generation rate, which is
proportional to the treatment time, resulting in a linear relationship between hydroxyl
29
radical concentration and time (23, 24). Since the lifetime of the hydroxyl radical is
extremely short and there are numerous hydroxyl radical scavengers in a soil slurry
system, given enough reaction time it is reasonable to assume that the hydroxyl radical
concentration will increase and approach a steady state (32) with a steady state
concentration [·OH]SS (μM). It is assumed that the hydroxyl radical concentration is
increasing exponentially to a steady state, and the following mathematical equation is
used to simulate this process in an AFT soil slurry system:
)1(][][ tSS eOHOH λ−−⋅=⋅ (1)
in which λ is a coefficient related to the production and consumption of hydroxyl
radical (min-1), governing the increase of hydroxyl radical concentration with time.
It is documented that the hydroxyl radical is not capable of oxidizing adsorbed
organic compounds (11, 33) and the degradation reaction usually takes place in the
aqueous phase, thus the degradation rate of the target compound can be written as:
LaqOHPLaq POHk
dtPd
+⋅+ ⋅=− ]][[
][, (2)
where kP,OH is the second order reaction rate constant between pesticide molecule and
hydroxyl radical (μM-1.min-1); [P]aq+L is the pesticide concentration in aqueous phase
and labile phase (adsorbed pesticide in the labile phase can be readily desorbed from
the solid phase to the aqueous phase for the degradation reaction); [·OH] is the
concentration of the hydroxyl radical (μM). Substituting Eqn (1) into (2):
dteOHkPPd t
SSOHPLaq
Laq )1(][][][
,λ−
⋅+
+ −⋅=− (3)
In a soil slurry system, we assume that,
30
δ−=+ ][][ PP Laq (4)
where [P] is the total pesticide concentration in the slurry (μM), and δ (μM) is a
loosely defined constant that relates to the pesticide strongly adsorbed to the artificial
soil or to pesticide in the non-labile phase; this portion of pesticide is not available for
degradation within a given AFT treatment time (usually in minutes). After substituting
Eqn (4) into (3) and integrating, we get the final model equation:
δδ λλ
+−=−
⋅ −−⋅− ]/)1([][0
,)]([][t
SSOHP etOHkt ePP (5)
in which [P]0 and [P]t are slurry pesticide concentrations at t=0 and t, respectively.
This model equation is used to fit the experimental data and gives a very good fit as
shown in Fig. 2.1 (R2>0.99). It should be noted that the above model is not a
mechanistic model, but a loosely defined empirical model for fitting the data and
measuring qualitative effects.
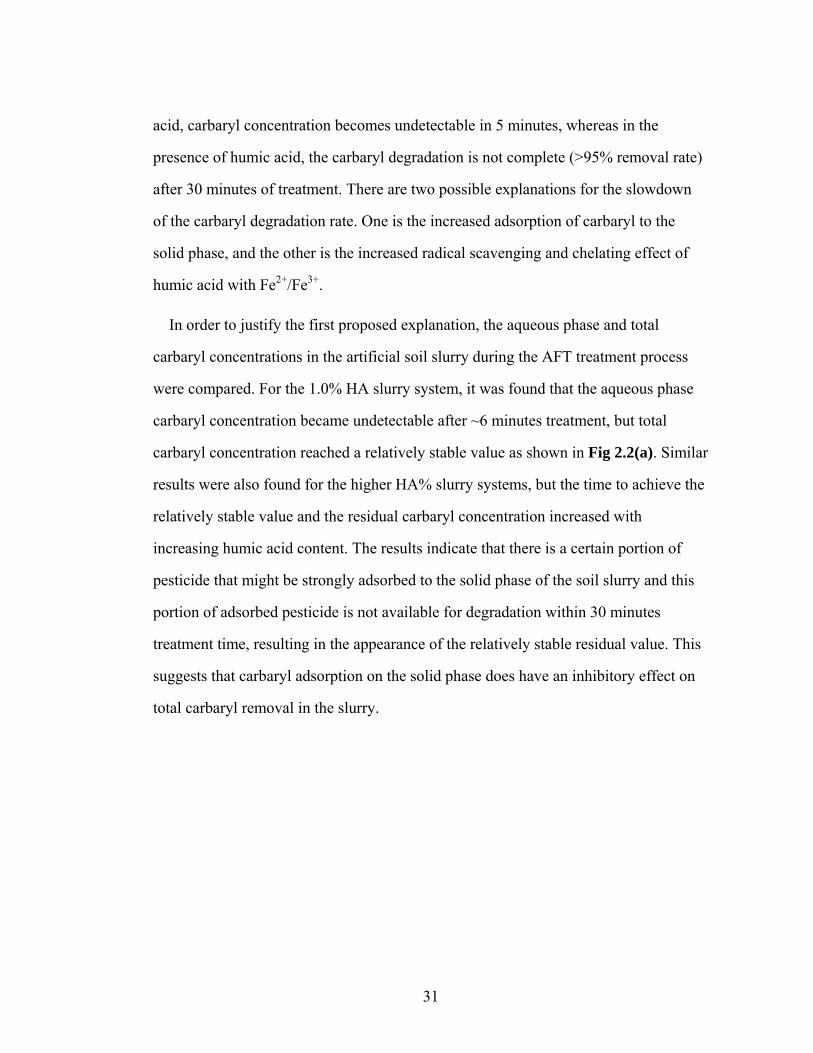
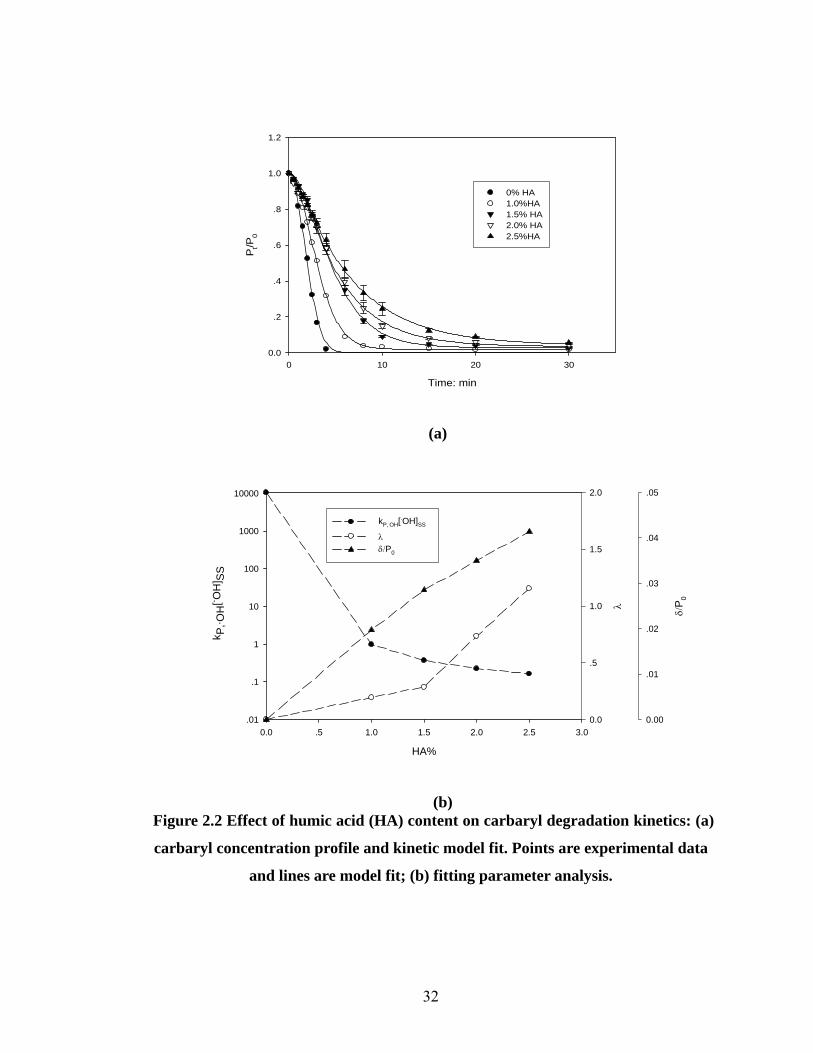
Effect of humic acid content on carbaryl degradation kinetics
Many studies have demonstrated that organic matter in wastewater or natural water
bodies has an inhibitory effect on the degradation of organic pollutants (30, 34-38).
Since the organic matter content in the kaolin clay and silica sand used in this
experiment is undetectable, the humic acid can be considered as the only source of
organic matter in the evaluated artificial soil. Initial carbaryl concentration,
soil/solution ratio (w/v), and H2O2/Fe2+ delivery ratio were held at 100 μM, 1:10 and
10:1, respectively. Humic acid contents (weight) of artificial soils were 0, 1.0, 1.5, 2.0
and 2.5%. The experimental results are shown in Fig 2.2(a).
As shown in the figure, the developed kinetic model [Eqn (5)] fits the experimental
data quite well (R2>0.99). With increasing humic acid content in the artificial soil,
from 0 to 2.5%, the carbaryl degradation rate slows down. In the absence of humic
31
acid, carbaryl concentration becomes undetectable in 5 minutes, whereas in the
presence of humic acid, the carbaryl degradation is not complete (>95% removal rate)
after 30 minutes of treatment. There are two possible explanations for the slowdown
of the carbaryl degradation rate. One is the increased adsorption of carbaryl to the
solid phase, and the other is the increased radical scavenging and chelating effect of
humic acid with Fe2+/Fe3+.
In order to justify the first proposed explanation, the aqueous phase and total
carbaryl concentrations in the artificial soil slurry during the AFT treatment process
were compared. For the 1.0% HA slurry system, it was found that the aqueous phase
carbaryl concentration became undetectable after ~6 minutes treatment, but total
carbaryl concentration reached a relatively stable value as shown in Fig 2.2(a). Similar
results were also found for the higher HA% slurry systems, but the time to achieve the
relatively stable value and the residual carbaryl concentration increased with
increasing humic acid content. The results indicate that there is a certain portion of
pesticide that might be strongly adsorbed to the solid phase of the soil slurry and this
portion of adsorbed pesticide is not available for degradation within 30 minutes
treatment time, resulting in the appearance of the relatively stable residual value. This
suggests that carbaryl adsorption on the solid phase does have an inhibitory effect on
total carbaryl removal in the slurry.
32
Time: min
0 10 20 30
P t/P0
0.0
.2
.4
.6
.8
1.0
1.2
0% HA1.0%HA1.5% HA2.0% HA2.5%HA
(a)
HA%
0.0 .5 1.0 1.5 2.0 2.5 3.0
kP,
. OH
[. OH
] SS
.01
.1
1
10
100
1000
10000
λ
0.0
.5
1.0
1.5
2.0
δ/P 0
0.00
.01
.02
.03
.04
.05
kP,.OH[.OH]SS
λδ/P0
(b) Figure 2.2 Effect of humic acid (HA) content on carbaryl degradation kinetics: (a)
carbaryl concentration profile and kinetic model fit. Points are experimental data
and lines are model fit; (b) fitting parameter analysis.
33
To examine if hydroxyl radical scavengers and HA's chelating effect also contribute
to the decrease of carbaryl degradation rate, it is useful to note that the color of the
aqueous phase of the collected samples, which reflects the color of humic acid, ferrous
and ferric ions, became less intense during the treatment, from brown to nearly
colorless after ~8 minutes treatment, indicating the destruction of dissolved humic acid
and removal of iron species. With increasing humic acid content in the slurry, the
hydroxyl radical scavenger concentration increases and iron may decrease due to the
chelating effect of HA with Fe3+ and Fe2+ (39) and the blocking of Fe2+ regeneration
from Fe3+, resulting in an increased consumption rate and decreased generation rate of
hydroxyl radicals. With other conditions the same, the hydroxyl radical steady-state
concentration, SSOH ][⋅ , decreases, which can explain the slowdown of the
degradation. However, in order to confirm this explanation, the time scale for
approaching the steady-state should be considered. Valuable information can be
obtained from a model fitting parameter analysis.
The changes in the three fitting parameters, SSOHP OHk ][, ⋅⋅ , λ , and δ (or 0/ Pδ
for the normalized model equation) with HA% are shown in Fig 2.2(b). For the first
fitting parameter, OHPk ⋅, should be the same in all experiments since it is affected
only by temperature and all experiments were conducted at the same temperature.
With increasing humic acid content, SSOHP OHk ][, ⋅⋅ decreases, (i.e., SSOH ][⋅
decreases), and λ and δ/P0 increase. In the absence of humic acid in the slurry,
SSOH ][⋅ is more than 4 orders of magnitude higher than that in the presence of humic
acid. The fact that SSOH ][⋅ decreases with increasing humic acid content is in
accordance with other researchers’ results (40) and confirms that the hydroxyl radical
steady-state concentration decreases with additional dissolved organic matter.

34
However, in the AFT system it would be more meaningful for our understanding of
the treatment process if we can incorporate the time scale into the SSOH ][⋅ discussion,
i.e., how long it will take to approach the steady state. In the model, 1/λ (min) is a
parameter indicating the time scale. In the absence of humic acid, λ is very small
(<10-4 min-1), which means it will take a very long time (>104 minutes theoretically)
for the hydroxyl radical concentration to approach the steady state and the steady state
could not be approached within the treatment time (in this study, 30 minutes). Actually,
in this scenario the hydroxyl radical concentration increases linearly with time within
a given treatment period (30 minutes) ( tOHeOHOH SSt
SS λλ ][)1(][][ ⋅≈−⋅=⋅ − ).
However, once humic acid is added to the slurry, λ increases. For example, λ values
for 1.0, 1.5, 2.0 and 2.5% HA are 0.19, 0.29, 0.74 and 1.16 min-1, respectively. If 90%
of SSOH ][⋅ is used as the steady state approximation, the time to approach this
approximate steady state can be calculated by using Eqn. (1), and the times are 12.1,
7.9, 3.1, and 2.0 minutes for 1.0, 1.5, 2.0 and 2.5% HA slurry, respectively. In other
words, for the AFT treatment of soil slurry, after an “initiation” stage (at this stage, the
hydroxyl radical concentration is increasing and approaching the steady state
concentration) the degradation kinetics becomes pseudo-first order with respect to the
steady state hydroxyl radical concentration. If the organic matter content in the system
is high enough, the "initiation" step will become very short, and the entire degradation
kinetics can be approximated as a pseudo-first order reaction. This is consistent with
results obtained by Wang and Lemley (30), that the degradation kinetics change from
classic AFT to first order with a gradual increase in humic acid content in the pesticide
solution. Overall, with the increase of HA content in the slurry the hydroxyl radical
steady state concentration decreases, and the decrease is most likely due to the
hydroxyl radical scavenging and iron chelating effects of humic acid.
35
The value of δ (i.e. the residual carbaryl concentration in the slurry) increases with
an increase of humic acid content in the soil slurry. In the absence of humic acid,
carbaryl concentration becomes undetectable after 5 minutes and δ is close to zero,
which is in accordance with the fact that there is negligible carbaryl adsorption on
silica sand and kaolinite clay (data not shown). The changing trend of δ is in
accordance with the findings (data not shown) that carbaryl adsorption increases with
an increase of humic acid content in the artificial soil.
Effect of initial pH on carbaryl degradation kinetics
The optimum pH for the Fenton reactions is 2-3 (41, 42). In the aqueous AFT
treatment this optimum pH is automatically reached after ~2 minutes treatment (24).
However, a soil slurry system could be different because of the pH buffering capacity
due to the protonation and deprotonation of soil minerals and organic materials (43).
For example, in a soil slurry 2,4-D AFT degradation study (31), it was found that the
slurry pH drops from 6.6-6.7 to ~5.6 after 2 hours of treatment, indicating a strong pH
buffering capacity of the soil slurry.
The weakly carboxylic and phenolic functional groups in the soil organic matter and
the hydroxy-aluminum polymers associated with the surfaces of phyllosilicates,
aluminosilicates, and the edges of silicates and oxides are the main causes of the
buffering. Kaolinite is a 1:1 layer clay, with very low concentrations of iron and
aluminum sesquioxides and very low capacity to adsorb or provide protons, resulting
in its low pH buffering capacity; thus the main pH buffering capacity of the used
artificial soil in this study comes from humic acid.
Initial carbaryl concentration, HA%, soil/solution ratio (w/v), and H2O2/Fe2+
delivery ratio were held at 100 μM, 5.0%, 1:10 and 10:1, respectively. The initial pH
of the slurry was adjusted to investigate its effect on the degradation of carbaryl, and
36
the results are shown in Fig 2.3(a). The developed kinetic model fits all experimental
data well. Based on the results, when the initial slurry pH was adjusted to a lower
value, the carbaryl degradation rate increased compared to slurries with an unadjusted
initial pH of 5.5. For example, for the unadjusted soil slurry, the initial pH was 5.5 and
after 30 minutes treatment, the final pH was ~5.0, indicating the existence of the pH
buffering capacity in the artificial soil and explaining why the degradation was
accelerated with sulfuric acid addition.
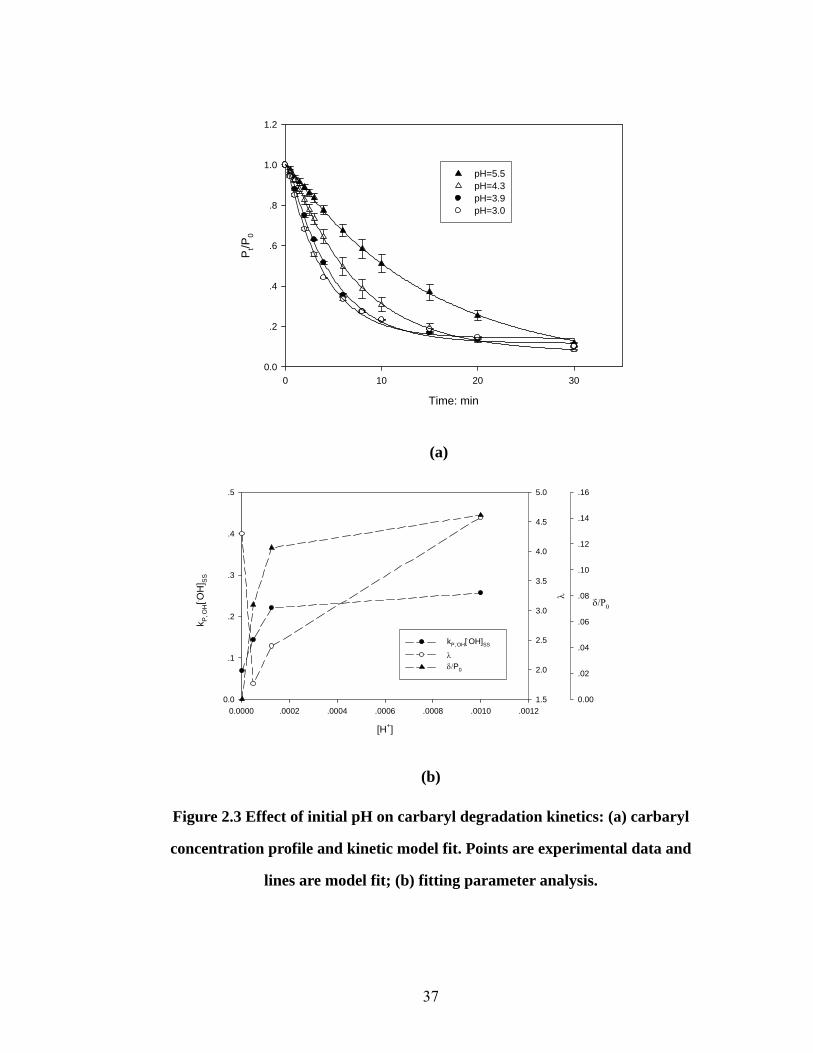
The model fitting parameters are summarized in Fig 2.3(b). It can be seen that all
λ values are >1.8, which means that the hydroxyl radical concentration can approach
the steady state within 1.3 minutes after the beginning of treatment. Since the steady
state can be approached quickly, the change of SSOH ][⋅ will greatly affect the
degradation kinetics. From the figure it can be seen that SSOH ][⋅ increases with
increasing acidity, which is in accordance with the increasing degradation rate. After
the slurry pH drops below 4, SSOH ][⋅ does not increase much, indicating that the pH
buffering capacity of the soil slurry has been overcome and that the Fenton reaction
takes place in an optimum pH environment.
37
Time: min
0 10 20 30
Pt/P
0
0.0
.2
.4
.6
.8
1.0
1.2
pH=5.5pH=4.3pH=3.9pH=3.0
(a)
[H+]
0.0000 .0002 .0004 .0006 .0008 .0010 .0012
k P,. O
H[. O
H] S
S
0.0
.1
.2
.3
.4
.5
λ
1.5
2.0
2.5
3.0
3.5
4.0
4.5
5.0
δ/P0
0.00
.02
.04
.06
.08
.10
.12
.14
.16
kP,.OH[.OH]SS
λδ/P0
(b)
Figure 2.3 Effect of initial pH on carbaryl degradation kinetics: (a) carbaryl
concentration profile and kinetic model fit. Points are experimental data and
lines are model fit; (b) fitting parameter analysis.
38
The value of δ increases with increasing initial slurry acidity (decreasing pH).
Based on the adsorption experiments (data not shown), pH does not have a significant
effect on the adsorption or desorption of carbaryl in a given artificial soil, indicating
that the amount of carbaryl strongly adsorbed on the solid phase (not available for
degradation) should be similar for slurries with the same humic acid content but
different initial pH. For low initial slurry pH values, 3.0 and 3.9, the time needed to
reach the relatively stable residual carbaryl concentration should be short, as is shown
in the degradation curves in Fig. 2.3(a), whereas, for higher pH values, 4.3 and 5.5,
the time needed is greater than the treatment time, 30 minutes. Thus, the model fitting
parameter, δ does not reflect the residual carbaryl concentration at the end of
treatment in the case of high pH (pH>4), indicating further model optimization needed
in future work.
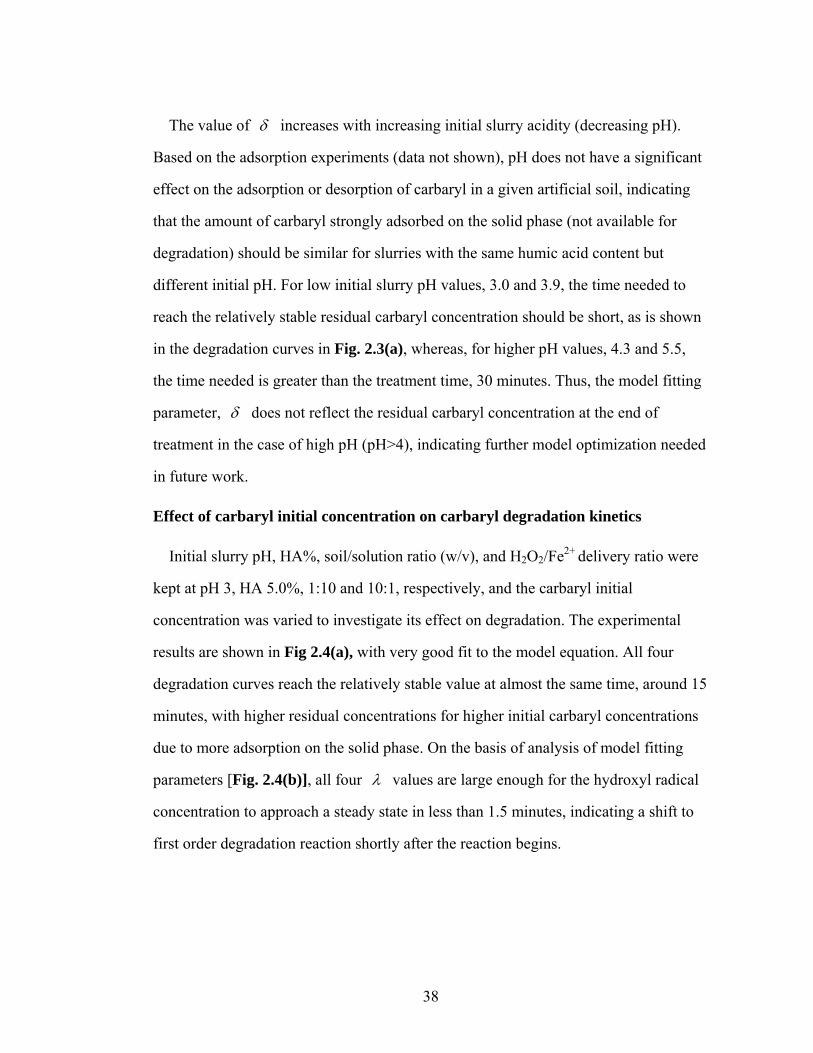
Effect of carbaryl initial concentration on carbaryl degradation kinetics
Initial slurry pH, HA%, soil/solution ratio (w/v), and H2O2/Fe2+ delivery ratio were
kept at pH 3, HA 5.0%, 1:10 and 10:1, respectively, and the carbaryl initial
concentration was varied to investigate its effect on degradation. The experimental
results are shown in Fig 2.4(a), with very good fit to the model equation. All four
degradation curves reach the relatively stable value at almost the same time, around 15
minutes, with higher residual concentrations for higher initial carbaryl concentrations
due to more adsorption on the solid phase. On the basis of analysis of model fitting
parameters [Fig. 2.4(b)], all four λ values are large enough for the hydroxyl radical
concentration to approach a steady state in less than 1.5 minutes, indicating a shift to
first order degradation reaction shortly after the reaction begins.
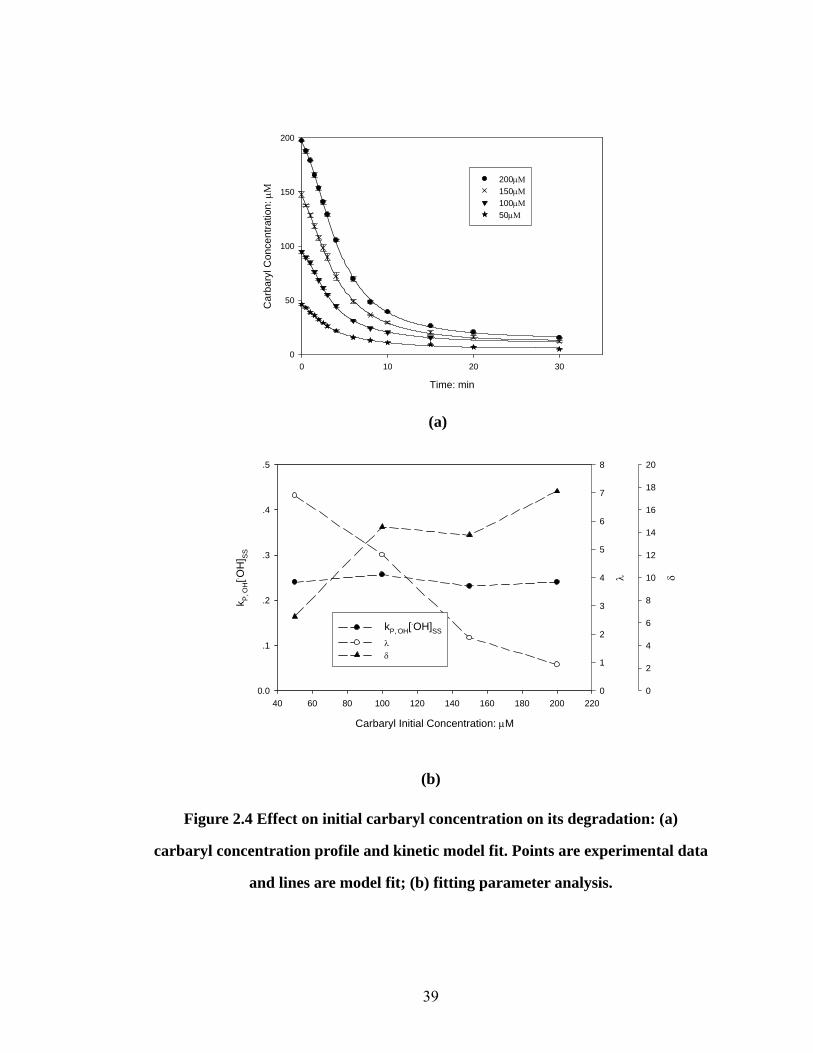
39
Time: min
0 10 20 30
Car
bary
l Con
cent
ratio
n: μ
Μ
0
50
100
150
200
200μΜ150μΜ100μΜ50μΜ
(a)
Carbaryl Initial Concentration: μM
40 60 80 100 120 140 160 180 200 220
k P,. O
H[. O
H] SS
0.0
.1
.2
.3
.4
.5
λ
0
1
2
3
4
5
6
7
8
δ
0
2
4
6
8
10
12
14
16
18
20
kP,.OH[.OH]SS
λδ
(b)
Figure 2.4 Effect on initial carbaryl concentration on its degradation: (a)
carbaryl concentration profile and kinetic model fit. Points are experimental data
and lines are model fit; (b) fitting parameter analysis.

40
SSOHP OHk ][, ⋅⋅ does not change with an increase of initial carbaryl concentration,
indicating that SSOH ][⋅ is not a variable with respect to the initial pesticide
concentration. Therefore, SSOH ][⋅ is determined by other factors such as pH, Fenton
reagent delivery ratio and humic acid content. Also, since SSOHP OHk ][, ⋅⋅ is a constant,
under these conditions the AFT behaves more like a first order reaction system with a
reaction rate constant SSOHP OHk ][, ⋅⋅ . Since the half life, 21t , of a first order reaction
does not depend on the initial reactant concentration, the degradation of carbaryl in the
aqueous and labile phases finished at almost the same time. δ increases with the
increase of initial concentration, which is in accordance with the fact that there is more
carbaryl adsorption with higher initial concentration.
Effect of H2O2:Fe2+ delivery ratio on carbaryl degradation rate
The stoichiometric ratio for the Fenton reaction is H2O2:Fe2+=1:1. The H2O2:Fe2+
delivery ratio was increased from 1:1 to 10:1 to investigate its effect on the
degradation, while initial slurry pH, HA%, soil/solution ratio (w/v), and initial
carbaryl concentration were kept at pH 3, HA 5.0%, 1:10 and 100 μM, respectively.
As shown in Fig 2.5(a), once the ratio is greater than 1:1, the degradation curves
almost overlap each other. This is an important finding from the perspective of cost
since the 2:1 ratio is almost as efficient as the 10:1 ratio.
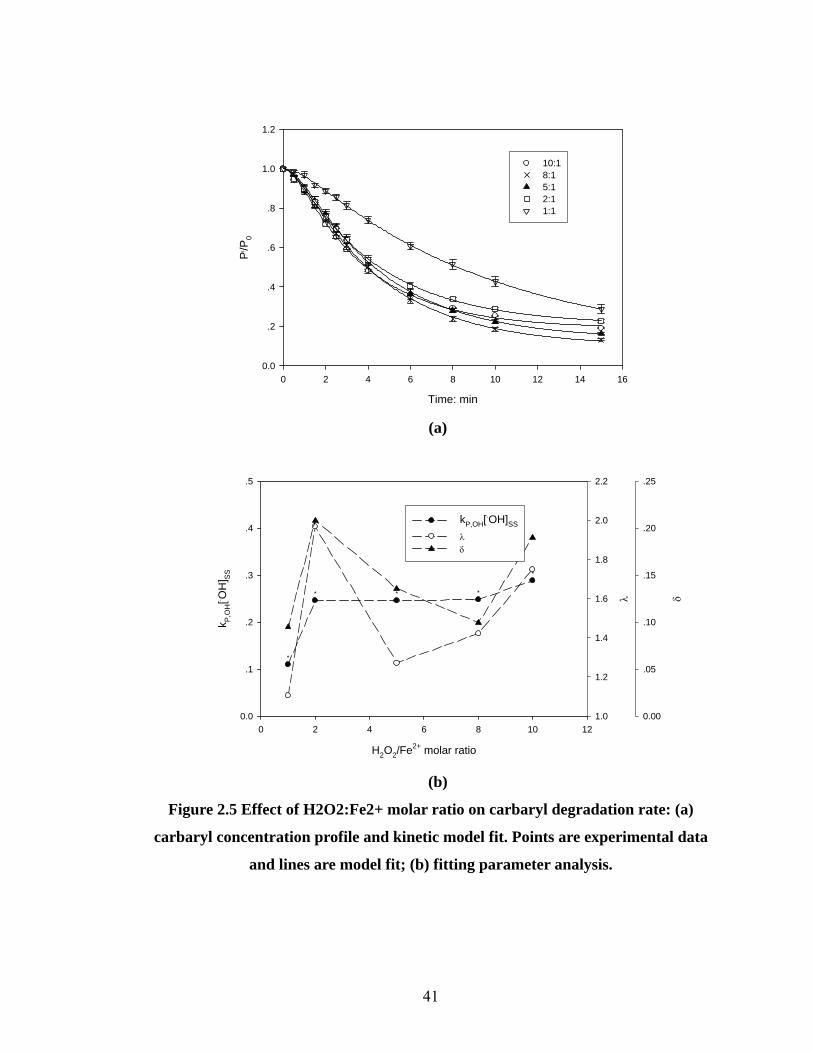
41
Time: min
0 2 4 6 8 10 12 14 16
Pt /P0
0.0
.2
.4
.6
.8
1.0
1.2
10:18:15:12:11:1
(a)
H2O2/Fe2+ molar ratio
0 2 4 6 8 10 12
k P,O
H[. O
H] SS
0.0
.1
.2
.3
.4
.5
λ
1.0
1.2
1.4
1.6
1.8
2.0
2.2
δ
0.00
.05
.10
.15
.20
.25
*
* * *
*
kP,OH[.OH]SS
λδ
(b)
Figure 2.5 Effect of H2O2:Fe2+ molar ratio on carbaryl degradation rate: (a)
carbaryl concentration profile and kinetic model fit. Points are experimental data
and lines are model fit; (b) fitting parameter analysis.

42
The model fitting parameter analysis [Fig 2.5(b)] further confirms the effectiveness
of the 2:1 ratio. λ values are in the range of 1.1 to 1.9, which means that the
hydroxyl radical concentration in all five reaction systems approaches a steady state
within 1~2 minutes. The SSOHP OHk ][, ⋅⋅ for the 2:1 ratio is almost double the value
for 1:1, but when the ratio is increased to 3:1, 8:1, and 10:1, it does not change much,
explaining the overlap of the degradation curves. Based on the above analysis, the 2:1
ratio might be most cost-effective under given experimental conditions; however, the
optimum ratio may be different for different conditions, such as pH, organic matter
content and clay type/content, etc., in practical application. The relationship between
δ and the H2O2:Fe2+ ratio is not clear.
Effect of soil/solution ratio (w/v)
The effect of soil:solution ratio on degradation was investigated. The initial slurry
pH, HA%, H2O2/Fe2+ ratio, and initial carbaryl concentration were kept at pH 3, HA
5.0%, 10:1 and 100 μM, respectively. The soil:solution ratios used were 1:10 and 1:5.
An attempt to use a 1:2 solution failed because sampling for pesticide analysis was not
practical. The results are illustrated in Fig. 2.6(a). With an increase in soil in the slurry
(from ratio 1:10 to 1:5), the degradation rate decreased significantly as expected, most
likely due to an increase in hydroxyl radical scavengers. The increased hydroxyl
radical scavenger concentration causes the decrease in hydroxyl radical steady state
concentration, which is also confirmed by the fitting parameter analysis as shown in
Fig. 2.6(b). Although the lower soil/solution ratio might be more efficient with
respective to pesticide removal, a comprehensive cost analysis is required prior to
practical application.

43
Time: min
0 10 20 30
Car
bary
l Con
cent
ratio
n: μ
Μ
0
20
40
60
80
100
120
1:51:10
(a)
Soil/Solution ratio
1:5 1:10
k P,O
H[. O
H] S
S
0.00
.05
.10
.15
.20
.25
.30
λ or
δ
0
2
4
6
8
10
12
14
16
kP,OH[.OH]SS
λδ
(b)
Figure 2.6 Effect of soil:solution ratio on carbaryl degradation rate: (a) carbaryl
concentration profile and kinetic model fit. Points are experimental data and
lines are model fit; (b) fitting parameter analysis.
44
2.4 Conclusions
An empirical kinetic model for soil slurry AFT treatment has been developed and
tested through batch experiments. The model equation fits the data very well, and the
analysis of the fitting parameters provides greater understanding of the pesticide
degradation process in a soil slurry AFT system. Soil minerals and organic matter may
affect the pesticide degradation process through their hydroxyl radical scavenging
effect, iron chelating effect, pH buffering capacity and sorption capability. Generally
speaking, the more soil organic matter content a soil has, the greater the inhibitory
effect it will have on the degradation of pesticide in the soil slurry AFT system.
Although kaolinite clay used in this study does not affect the degradation very much,
with other types of clay, such as 2:1 layer clays, this might not be the case due to their
high capacity to adsorb pesticide, or provide a pH buffering effect. It will be
interesting and necessary to investigate the effects of different clay types or other
minerals, such as oxides, on the degradation process in the future. It was also found
that pesticide initial concentration did not affect the hydroxyl radical steady state
concentration, with other conditions remaining the same, and from the perspective of
cost-effectiveness, a 2:1 H2O2/Fe2+ delivery ratio is preferred.
45
REFERENCES
1. Kiely, T.; Donaldson, D.; Grube, A., Pesticides industry sales and usage: 2000 and 2001 market estimates, http://www.epa.gov/oppbead1/pestsales/01pestsales/table_of_contents2001.html. In 2004.
2. Cheng, H. H., Pesticides in the soil environment: Processes, Impacts, and Modeling. Soil Science Society of America, Inc.: Madison, Wis., USA, 1990; p 8.
3. Shea, P. J.; Machacek, T. A.; Comfort, S. D., Accelerated remediation of pesticide-contaminated soil with zero valent iron. Environ. Pollut. (Amsterdam, Neth.) 2004, 132, 183-188.
4. Felsot, A. S., Options for cleanup and disposal of pesticide wastes generated on a small-scale. J. Environ. Sci. Health, Part B 1996, B31, 365-381.
5. Felsot, A. S., User sites and the generation of pesticide waste. In Pesticide remediation in soils and water, Kearney, P. C.; Roberts, T., Eds. John Wiley & Sons Ltd.: New York, 1998; pp 1-19.
6. Walling, C., Fenton's reagent revisited. Accounts Chem. Res. 1975, 8, (4), 125-131.
7. Khan, A. J. M.; Watts, R. J., Mineral-catalyzed peroxidation of tetrachloroethylene. Water, Air, Soil Pollut. 1996, 88, 247-260.
8. Casado, J.; Fornaguera, J.; Galan, M. I., Mineralization of aromatics in water by sunlight-assisted electro-Fenton technology in a pilot Reactor. Environ. Sci. Technol. 2005, 39, 1843-1847.
9. Chen, F.; Ma, W.; He, J.; Zhao, J., Fenton degradation of malachite green catalyzed by aromatic additives. J. Phys. Chem. A 2002, 106, (41), 9485-9490.
10. Hapeman, C. J.; Torrents, A., Direct radical oxidation processes. In Pesticide Remediation in Soils and Water, Kearney, P. C., Roberts, T., Ed. John Wiley & Sons Inc.: 1998; pp 161-180.
11. Watts, R. J.; Bottenberg, B. C.; Hess, T. F.; Jensen, M. D.; Teel, A. L., Role of reductants in the enhanced desorption and transformation of chloroaliphatic compounds by modified Fenton's reactions. Environ. Sci. Technol. 1999, 33, (19), 3432-3437.
12. Watts, R. J.; Bottenberg, B. C.; Jensen, M. D.; Hess, T. H.; Teel, A. L., Mechanism of the enhanced treatment of chloroaliphatic compounds by Fenton-like reactions. Environ. Sci. Technol. 1999, 33, (12), 3432-3437.
46
13. Tyre, B. W.; Watts, R. J.; Miller, G. C., Treatment of four biorefractory contaminants in soils using catalyzed hydrogen peroxide. J. Environ. Qual. 1991, 20, 832-838.
14. Watts, R. J.; Udell, M. D.; Rauch, P. A., Treatment of pentachlorophenol-contaminated soils using Fenton's reagent. Hazard. Waste Hazard. Mater. 1990, 7, (4), 335-345.
15. Watts, R. J. K., S.; Dippre, M.; and Barnes, W. T., Oxidation of sorbed hexachlorobenzene in soils using catalyzed hydrogen peroxide. J. Hazard. Mater. 1994, 39, (1), 33-47.
16. Watts, R. J.; Jones, A. P.; Chen, P. H.; Kenny, A., Mineral catalyzed Fenton-like oxidation of sorbed chlorobenzenes. Water Environ. Res. 1997, 69, (2), 269-275.
17. Yang, G. C. C.; Liu, C.-Y., Remediation of TCE contaminated soils by in situ EK-Fenton process. J. Hazard. Mater. 2001, B85, 317-331.
18. Pignatello, J. J.; Baehr, K., Ferric complexes as catalysts for "Fenton" degradation of 2,4-D and metolachlor in soil. J. Environ. Qual. 1994, 23, 365-370.
19. Li, Z. M.; Peterson, M. M.; Comforta, S. D.; Horstb, G. L.; Shea, P. J.; Oh, B. T., Remediating TNT-contaminated soil by soil washing and Fenton oxidation. Sci. Total Environ. 1997, 204, 107-115.
20. Flotron, V.; Delteil, C.; Padellec, Y.; Camel, V., Removal of sorbed polycyclic aromatic hydrocarbons from soil, sludge and sediment samples using the Fenton's reagent process. Chemosphere 2005, 59, 1427-1437.
21. Bogan, B. W.; Trbovic, V.; Paterek, J. R., Inclusion of vegetable oils in Fenton's chemistry for remediation of PAH-contaminated soils. Chemosphere 2003, 50, 15-21.
22. Bier, E. L.; Singh, J.; Li, Z.; Comfort, S. D.; Shea, P. J., Remediating hexahydro-1,3,5-trinitro-1,2,5-trazine-contaminated water and soil by Fenton oxidation. Environ. Toxicol. Chem. 1999, 18, 1078-1084.
23. Saltmiras, D. A.; Lemley, A. T., Degradation of ethylene thiourea (ETU) with three Fenton treatment processes. J. Agric. Food Chem. 2000, 48, 6149-6157.
24. Wang, Q.-Q.; Lemley, A. T., Kinetic model and optimization of 2,4-D degradation by Anodic Fenton treatment. Environ. Sci. Technol 2001, 35, 4509-4514.
25. Saltmiras, D. A.; Lemley, A. T., Anodic Fenton treatment of treflan MTF®. J. Environ. Sci. Health, Part A: Toxic/Hazard. Subst. Environ. Eng. 2001, A36, 261-274.
26. Saltmiras, D. A.; Lemley, A. T., Atrazine degradation by anodic Fenton treatment. Water Res. 2002, 36, 5113-5119.
47
27. Wang, Q.-Q.; Lemley, A. T., Oxidation of carbaryl in aqueous solution by membrane Anodic Fenton Treatment. J. Agric. Food Chem. 2002, 50, 2331-2337.
28. Wang, Q.-Q.; Lemley, A. T., Oxidative degradation and detoxification of aqueous carfuran by membrane anodic Fenton treatment. J. Hazard. Mater. 2003, B98, 241-255.
29. Wang, Q.-Q.; Lemley, A. T., Competitive degradation and detoxification of carbamate insecticides by membrane anodic Fenton treatment. J. Agric. Food Chem. 2003, 51, (5382-5390).
30. Wang, Q.-Q.; Lemley, A. T., Kinetic effect of humic acid on alachlor degradation by anodic fenton treatment. J. Environ. Qual. 2004, 33, 2343-2352.
31. Kong, L.; Lemley, A. T., Kinetic modeling of 2,4-dichlorophenoxyacetic acid (2,4-D) degradation in soil slurry by Anodic Fenton Treatment. J. Agric. Food Chem. 2006, 54, 3941-3950.
32. Espenson, J. H., Chemical kinetics and reaction mechanisms. In McGraw-Hill: New York, 1981; pp 140-143.
33. Sedlak, D. L.; Andren, A. W., Aqueous-phase oxidation of polychlorinated biphenyls by hydroxyl radicals. Environ. Sci. Technol 1991, 25, 1419-1427.
34. Voelker, B. M.; Sulzberger, B., Effects of fulvic acid on Fe(II) oxidation by hydrogen peroxide. Environ. Sci. Technol 1996, 30, 1106-1114.
35. Vione, D.; Merlo, F.; Maurino, V.; Minero, C., Effects of humic acids on the Fenton degradation of phenol. Environ. Chem. Lett 2004, 2, 129-133.
36. Lindsey, M. E.; Tarr, M. A., Inhibition of hydroxyl radical reaction with aromatics by dissolved natural organic matter. Environ. Sci. Technol 2000, 34, 444-449.
37. Huang, Q.; Weber Jr., W. J., Interactions of soil-derived dissolved organic matter with phenol in peroxidase-catalyzed oxidative coupling reactions. Environ. Sci. Technol 2004, 38, (1), 338-344.
38. Fukushima, M.; Sawada, A.; Kawasaki, M.; Ichikawa, H.; Morimoto, K.; Tatsumi, K., Influence of humic substances on the removal of pentachlorophenol by a biomimetic catalytic system with a water-soluble iron(III)-porphyrin complex. Environ. Sci. Technol 2003, 37, (5), 1031-1036.
39. Stevenson, F. J., Humus chemistry: genesis, composition, reactions. In 2 ed.; John Wiley & Sons, Inc.: New York, 1994; pp 378-404.
48
40. Zepp, R. G.; Faust, B. C.; Holgne, J., Hydorxyl radical formation in aqueous reactions (pH 3-8) of iron (II) with hydrogen peroxide: the photo-Fenton reaction. Environ. Sci. Technol. 1992, 26, 313-319.
41. Plgnatello, J. J., Dark and photoassisted Fe3+-catalyzed degradation of chlorophenoxy herbicides by hydrogen peroxide. Environ. Sci. Technol. 1992, 26, 944-951.
42. Kang, Y. W.; Hwang, K.-Y., Effects of reaction conditions on the oxidation efficiency in the Fenton process. Water Res. 2000, 34, 2786-2790.
43. Weaver, A. R.; Kissel, D. E.; Chen, F.; West, L. T.; Adkins, W.; Rickman, D.; Luvall, a. J. C., Mapping soil pH buffering capacity of selected fields in the Coastal Plain. Soil Sci. Soc. Am. J. 2004, 68, 662-668.
49
Chapter 3
Adsorption Effect on the Degradation of Carbaryl, Mecoprop and Paraquat by
Anodic Fenton Treatment in an Swy-2 Montmorillonite Clay Slurry
3.1 Introduction
The retention time of organic pollutants in soil varies, depending on the nature of
the pollutants, the soil types and properties, and the outside environmental parameters,
such as rainfall and temperature. Soil organic matter (SOM) and clay are considered
two of the most important soil components affecting organic chemical movement in
soil. It is well established that nonionic organic chemicals have a strong affinity to
SOM (1-3), while negatively charged clays, especially 2:1 layered clays, are mainly
responsible for the adsorption of cationic organic chemicals, such as paraquat and
diquat, in soil through strong electrostatic attraction (4-6). Adsorption to SOM or clay
particles decreases the rates of biodegradation. Studies have found that, compared to
controls, biodegradation rates of quinoline (7), citrate (8), parathion (9), naphthalene
(10) and benzylamine (11) were slowed down dramatically in the presence of clay
minerals, either due to the clay protection of chemicals from being directly attacked by
microorganisms or due to the inactivation of extracellular enzymes by clay adsorption.
Due to the limited accessibility to microorganisms in soils or clay systems, organic
compounds that are not strongly adsorbed by soil and should be readily biodegradable,
such as fumigant ethylene dibromide (12, 13), can persist in soils for decades, even
though the conditions are favorable for microbial growth and biodegradation.
Chemical oxidants are highly aggressive and small in size, making them a good
option for degrading specific pollutants in heavily contaminated soils. Fenton reaction-
50
based chemical oxidation is one of the most studied degradation methods in waste
water systems (14-17). Watts and colleagues first used Fenton reagents and Fenton-
like processes in degrading organic pollutants, such as pentachlorophenol, trifluralin,
hexadecane, dieldrin, and trichloroethylene in contaminated soils (18-23). Degradation
of various other contaminants, such as trinitrotoluene, heterocyclic nitramines, 2,4-
dichlorophenoxyacetic acid, and metolachlor, and PAHs in soil by Fenton reaction has
also been studied recently (24-29). To avoid highly hygroscopic and readily oxidizable
ferrous salt used in classic Fenton treatment and to make the Fenton treatment method
more manageable, a more practical Fenton oxidation method, anodic Fenton treatment
(AFT) was developed and tested in water systems (30-33). The AFT method has been
successfully applied to degrade and detoxify many pesticides, such as ethylene
thiourea, 2,4-dichlorophenoxyacetic acid, carbaryl, and carbofuran (30, 31, 33-37), in
water systems.
Encouraged by the successful application of AFT in aqueous solution, two
preliminary studies, were done on the degradation of pesticides in a humic acid (38) or
real soil (39) slurry system. Although the effect of sorption on the degradation kinetics
was discussed in both studies, this effect was not incorporated in the kinetic model.
Also, it is impossible to distinguish the effects of important individual soil properties,
such as soil organic matter and soil minerals, in a real soil slurry system. In order to
identify the effects of soil components on the degradation of organic agrochemicals in
soil slurry by AFT, a synthetic soil composed of kaolin clay, sand, and humic acid was
tested in a previous study (40). It was found that kaolin clay, a 1:1 layer clay, has little
effect on the degradation kinetics of carbaryl in the slurry due to its limited adsorption
capacity and relatively small surface area. However, in real soils there usually is a
substantial amount of 2:1 layer clay, such as smectite clays. It is important to study
51
degradation in slurries with this clay type that has a much higher cation exchange
capacity and surface area.
In the present study Na+-montmorillonite source clay from the Clay Minerals
Society was selected as a testing medium. Widely used agrochemicals, carbaryl,
mecoprop (pKa 3.78) and paraquat, were selected as probes, representing neutral,
anionic, and cationic organics, respectively. X ray diffraction (XRD) analysis was
used to measure the d spacing of montmorillonite clay. The objectives of this study
were: (1) to investigate the adsorption effect of layered clay on the degradation of
probe chemicals in the AFT system; (2) to explain the effect through adsorption
mechanisms and XRD analysis; and (3) to identify whether AFT is able to remove
organic chemicals at the clay interlayer.
3.2 Materials and Experiments
Chemicals
Source clay Na+-montmorillonite (code: Srce_Clay_SWy-2) was obtained from the
Clay Minerals Society (West Lafayette, Indiana). Carbaryl (99.5%, CAS RN 63-25-2),
mecoprop (99.5%, CAS RN 7085-19-0) and paraquat CL tetrahydrate (99%, CAS RN
1910-42-5) were purchased from ChemService, Inc (West Chester, PA). Hydrogen
peroxide (30%, analytical grade) is from Sigma-Aldrich (St. Louis, MO). Water and
acetonitrile, both HPLC grade, were purchased from Fisher Scientific (Pittsburgh, PA).
Methanol (HPLC grade), potassium chloride, sodium chloride and hydrochloric acid
(37%) were purchased from Mallinckrodt Chemicals (Phillipsburg, NJ). Deoinized
water (electrical resistance, R≥18.1 MΩ.cm-1) was produced by an MP-1 Mega-PureTM
system (Corning, NY)
52
Purified clay
The purification process is based on the literature (41). To obtain purified clay (<2
μm), 25 g of SWy-2 was placed in a 2 L beaker with 1.8 L of d.i. water and stirred for
8 h using a magnetic stir bar to hydrate the clay. After overnight (~18 h) settling, the
supernatant suspension containing the <2 μm clay-sized particles was poured into 50
ml polyethylene centrifuge tubes and then centrifuged for 30 min at 6000 rpm. After
discarding the supernatant, the purified clay sample was then quick-frozen by liquid
nitrogen, freeze-dried, and stored. Cation exchange capacity of the purified clay was
determined by BaCl2 Compulsive Exchange Method (42), and the value was 78.7
meq/100g. Though there are no data available on the fraction of organic carbon on the
SWy-2 clay, the organic carbon content should be minimal based on the
Physical/Chemical Data for the source clay from the Clay Mineral Society.
Adsorption experiments
Adsorption batch experiments were conducted to obtain adsorption isotherms for
carbaryl, mecoprop and paraquat in the clay slurry. Based on a preliminary adsorption
kinetics study (data not shown), the adsorption equilibrium can be attained within 24
hours. 100.0 mg original whole clay or purified clay and 10.0 mL probe chemical
solution with or without 0.02 M KCl were placed into 15 mL tubes; pH was adjusted
by 0.01 M HCl if needed. After 24 h shaking, a 1.0 mL sample was placed in a 1.5 mL
centrifuge vial. After 15 min-centrifuging at 10,000 rpm in an Eppendorf ® MiniSpin
Personal Microcentrifuge (Westbury, NY), the supernatant was collected for
concentration analysis. The amount of adsorbed chemical was calculated based on the
difference in aqueous concentration between the initial time and 24 h. A batch
experiment for desorption of mecoprop was conducted to obtain clay samples for
XRD analysis. After 24 h mixing to reach adsorption equilibrium, the clay slurry was
53
centrifuged, and the supernatant was decanted as much as possible. Then fresh water
was added to the tube and the clay sample was remixed vigorously for the desorption
experiment. An one time fresh water refill was used. 0.5 mL of sample was collected
periodically for XRD analysis.
AFT batch experiments
All experiments were carried out in two 150-mL glass cells; a scheme of the
experimental apparatus is shown in Fig. 1.1. Typically, 100.0 mL of probe chemical
and clay slurry with 0.02M KCl was added to the anodic half-cell, and the same
volume of 0.08M NaCl solution was added to the cathodic half-cell. These two half-
cells were separated by an anion exchange membrane (Electrosynthesis Company, Inc.,
Lancaster, NY). Each of the half-cells was well stirred by a magnetic stir bar. Ferrous
ion was generated by electrolysis in the anodic half-cell from a pure iron anode (0.5
cm × 10 cm × 0.2 cm). A graphite stick (1 cm (i.d.) × 10 cm (length)) was used as the
cathode. The electric current was controlled at 0.050 A by a BK Precision DC power
supply 1610 (TestPath, Inc., Danvers, MA). Hydrogen peroxide solution (0.311 M)
was delivered to the anodic half-cell using a STEPDOS® Diaphragm Metering Pump
(KNF NEUBERGER, Inc., Trenton, NJ) at a rate of 0.50 mL min-1. When the first
drop of hydrogen peroxide dropped into the anodic half-cell, the electrolysis current
was turned on. Clay/solution ratio, molar ratio of H2O2 and Fe2+, and pH were kept at
1:100 (w/v), 10:1, and pH 3, respectively, unless specified, and all experiments were
conducted at room temperature, 22±1 C. At given time intervals, a 0.7 mL sample
was collected and added to a 1.5 mL Microfuge tube containing 0.7 mL methanol
which was used to quench the hydroxyl radical and to extract probe chemicals (for
carbaryl and mecoprop only) from the slurry in order to get the total concentration.
The sample tubes were shaken for 15 minutes before being centrifuged for 15 minutes
54
at a rate of 10,000 rpm. The supernatant was collected for concentration analysis. The
mass recoveries of carbaryl and mecoprop extraction were greater than 98%. For
paraquat clay slurry, only the aqueous phase concentrations were measured, and a 1.0
mL sample with the addition of 0.10 mL methanol was centrifuged right after being
collected. The experiments were repeated twice, unless specified.
XRD analysis
Clay thin film samples for XRD analysis were prepared by air drying several drops
of clay slurry on glass slides. XRD spectra of clay films were obtained using a Scintag
X-ray diffractometer equipped with Cu-K radiation. The scanning angle (2θ) ranged
from 2 to 35 degrees at steps of 3 degrees per minute.
Concentration measurement
The concentrations of carbaryl, mecoprop and paraquat were measured by an
Agilent 1200 HPLC equipped with a DAD detector and an Agilent 6130 Quadrupole
Mass spectrometer (Agilent Technologies, Inc, Santa Clara, CA). For carbaryl and
mecoprop, the mobile phase was composed of 50% acetonitrile and 50% HPLC grade
water (pH 3, adjusted by H3PO4); for paraquat, the mobile phase was composed of
40% acetonitrile and 60% 0.14 M NaCl water (pH 3, adjusted by HCl). A C18 5 μm
150 mm × 4.6 mm (i.d.) Agilent reverse phase column was used. Flow rates were all
set to 1.0 mL/min. The chosen UV wavelengths for carbaryl, mecoprop and paraquat
were 220, 200 and 257 nm, respectively.
3.3 Results and Discussion
Adsorption of carbaryl, mecoprop and paraquat
Adsorption isotherms of carbaryl at pH 6.3, mecoprop at pH 7.8 and 3.0 in whole
clay slurry, and mecoprop at pH 7.8 in purified clay slurry are shown in Fig. 3.1. All
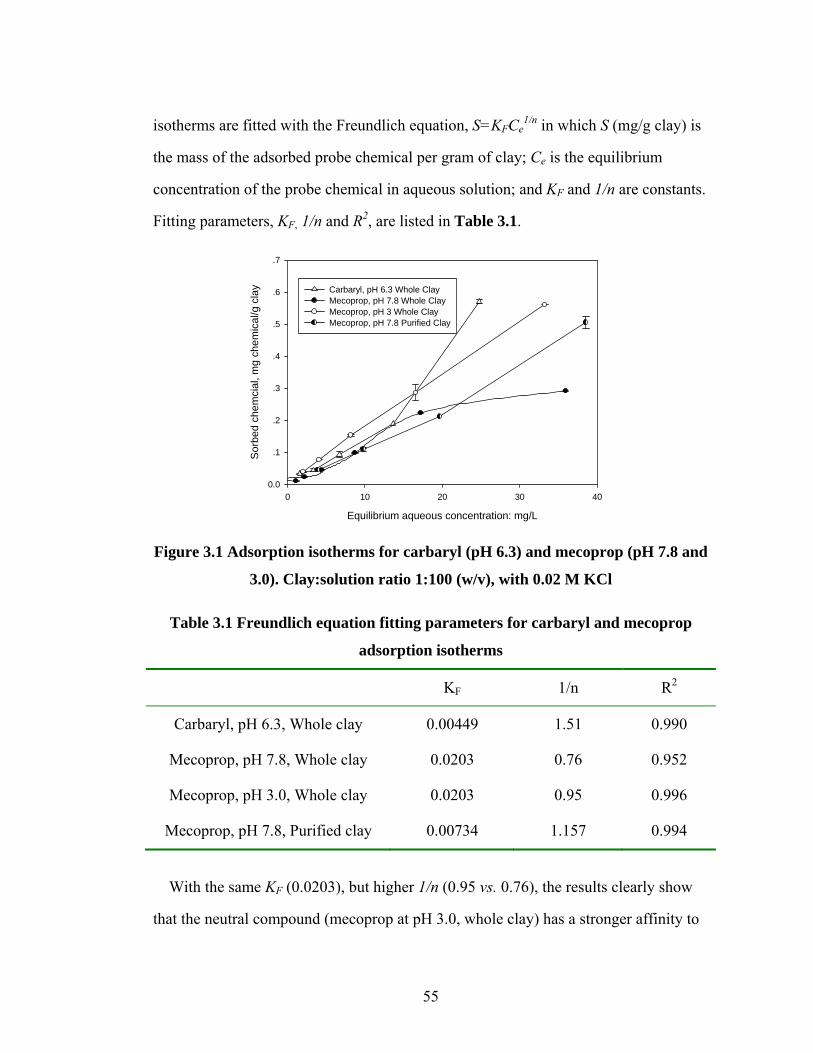
55
isotherms are fitted with the Freundlich equation, S=KFCe1/n in which S (mg/g clay) is
the mass of the adsorbed probe chemical per gram of clay; Ce is the equilibrium
concentration of the probe chemical in aqueous solution; and KF and 1/n are constants.
Fitting parameters, KF, 1/n and R2, are listed in Table 3.1.
Equilibrium aqueous concentration: mg/L
0 10 20 30 40
Sor
bed
chem
cial
, mg
chem
ical
/g c
lay
0.0
.1
.2
.3
.4
.5
.6
.7
Carbaryl, pH 6.3 Whole ClayMecoprop, pH 7.8 Whole ClayMecoprop, pH 3 Whole ClayMecoprop, pH 7.8 Purified Clay
Figure 3.1 Adsorption isotherms for carbaryl (pH 6.3) and mecoprop (pH 7.8 and
3.0). Clay:solution ratio 1:100 (w/v), with 0.02 M KCl
Table 3.1 Freundlich equation fitting parameters for carbaryl and mecoprop
adsorption isotherms
KF 1/n R2
Carbaryl, pH 6.3, Whole clay 0.00449 1.51 0.990
Mecoprop, pH 7.8, Whole clay 0.0203 0.76 0.952
Mecoprop, pH 3.0, Whole clay 0.0203 0.95 0.996
Mecoprop, pH 7.8, Purified clay 0.00734 1.157 0.994
With the same KF (0.0203), but higher 1/n (0.95 vs. 0.76), the results clearly show
that the neutral compound (mecoprop at pH 3.0, whole clay) has a stronger affinity to
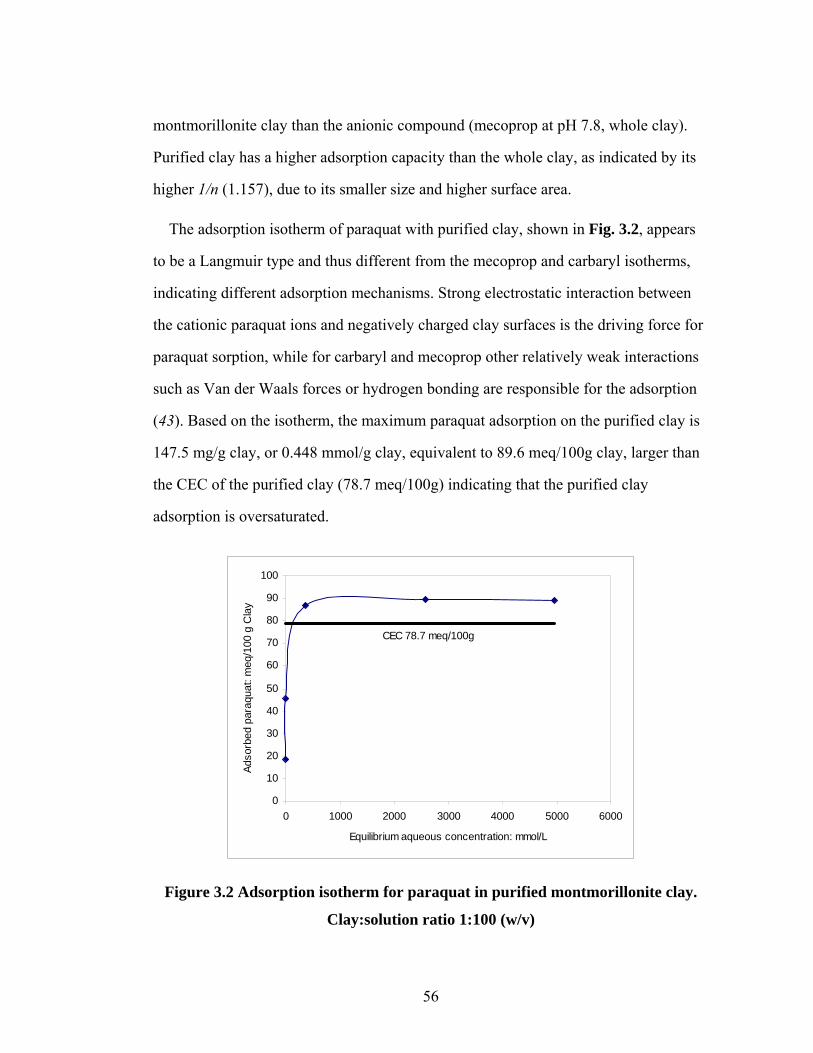
56
montmorillonite clay than the anionic compound (mecoprop at pH 7.8, whole clay).
Purified clay has a higher adsorption capacity than the whole clay, as indicated by its
higher 1/n (1.157), due to its smaller size and higher surface area.
The adsorption isotherm of paraquat with purified clay, shown in Fig. 3.2, appears
to be a Langmuir type and thus different from the mecoprop and carbaryl isotherms,
indicating different adsorption mechanisms. Strong electrostatic interaction between
the cationic paraquat ions and negatively charged clay surfaces is the driving force for
paraquat sorption, while for carbaryl and mecoprop other relatively weak interactions
such as Van der Waals forces or hydrogen bonding are responsible for the adsorption
(43). Based on the isotherm, the maximum paraquat adsorption on the purified clay is
147.5 mg/g clay, or 0.448 mmol/g clay, equivalent to 89.6 meq/100g clay, larger than
the CEC of the purified clay (78.7 meq/100g) indicating that the purified clay
adsorption is oversaturated.
0
10
20
30
40
50
60
70
80
90
100
0 1000 2000 3000 4000 5000 6000
Equilibrium aqueous concentration: mmol/L
Adso
rbed
par
aqua
t: m
eq/1
00 g
Cla
y
CEC 78.7 meq/100g
Figure 3.2 Adsorption isotherm for paraquat in purified montmorillonite clay.
Clay:solution ratio 1:100 (w/v)
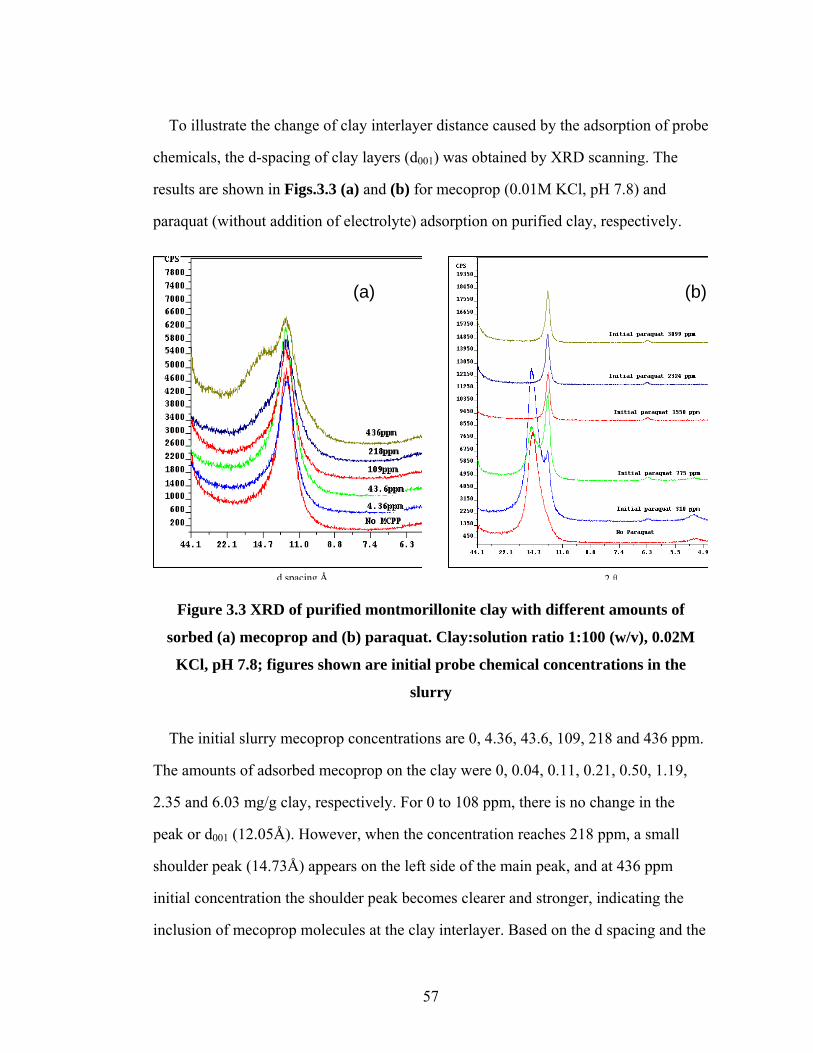
57
To illustrate the change of clay interlayer distance caused by the adsorption of probe
chemicals, the d-spacing of clay layers (d001) was obtained by XRD scanning. The
results are shown in Figs.3.3 (a) and (b) for mecoprop (0.01M KCl, pH 7.8) and
paraquat (without addition of electrolyte) adsorption on purified clay, respectively.
Figure 3.3 XRD of purified montmorillonite clay with different amounts of
sorbed (a) mecoprop and (b) paraquat. Clay:solution ratio 1:100 (w/v), 0.02M
KCl, pH 7.8; figures shown are initial probe chemical concentrations in the
slurry
The initial slurry mecoprop concentrations are 0, 4.36, 43.6, 109, 218 and 436 ppm.
The amounts of adsorbed mecoprop on the clay were 0, 0.04, 0.11, 0.21, 0.50, 1.19,
2.35 and 6.03 mg/g clay, respectively. For 0 to 108 ppm, there is no change in the
peak or d001 (12.05Å). However, when the concentration reaches 218 ppm, a small
shoulder peak (14.73Å) appears on the left side of the main peak, and at 436 ppm
initial concentration the shoulder peak becomes clearer and stronger, indicating the
inclusion of mecoprop molecules at the clay interlayer. Based on the d spacing and the
2θ
(a) (b)
d spacing Å
58
dimensions of the interlayer species, the disposition of the interlayer species can be
inferred, as illustrated in Fig. 3.4(a) (44). For the montmorillonite clay used, the
thickness of its silicate layer is about 9.6Å (44). Without mecoprop addition, a d001
value of 12.05Å is the sum of the thickness of the silicate layer and 2~3 layers of
water molecules (~2.5Å) and K+ (the existence of a small amount of Na+ is also
possible, since the clay is not K+ saturated). When a small amount of mecoprop is
added to the clay slurry, some of the mecoprop molecules may enter the clay interlayer
and be adsorbed. However, the adsorbed amount (<2 mg/g clay) is not high enough to
expand the clay interlayer universally in the slurry, and the expansion is not detectable
by XRD. But with an increased amount of mecoprop (>2 mg/g clay), the expanded
layers become more and more universally distributed and are detected as such. The
d001 is increased to 14.73 Ǻ (new peak) which is about 5.1Ǻ greater than the silicate
layer (9.6Å); this increase is almost the same as the thickness of a mecoprop molecule,
~5Ǻ, as estimated by ChemBioOffice (45). This clearly indicates that a monolayer of
planar mecoprop molecules (~5.1Ǻ) is formed at the interlayer, sitting parallel to the
clay siloxane surface, which accounts for the appearance of the shoulder peak in Fig.
3.3 (a).

59
Figure 3.4 Illustration of Mecoprop (a) and Paraquat (b) adsorption on
montmorillonite clay
For the paraquat case, initial concentrations are 0, 310, 775, 1550, 2324 and 3099
ppm without the addition of KCl. Based on the XRD result, without paraquat addition,
the value of d001 is 15.21Ǻ. The larger d001 here can be compared with the d001 of
12.05Ǻ for mecoprop and is due to the larger hydration radius of Na+ (1.85Ǻ) vs. K+
(1.26Ǻ) (46). A shoulder peak (12.58Ǻ) appears on the right side of the main peak
with the addition of 310 ppm paraquat. Based on the LC-MS measurement, there is no
paraquat remaining in the aqueous solution, indicating complete adsorption. With the
increase of initial paraquat concentration, the shoulder peak becomes stronger, while
the left peak becomes weaker until it totally disappears at an initial paraquat
concentration of 1550 ppm. Such a reduction in d spacing may indicate water
exclusion from the clay interlayer, as reported by other researchers (47). Compared
with the left peak, the width of the right peak is much smaller, indicating a very good
60
homogeneity of the clay sample after paraquat adsorption. The disposition of paraquat
at the clay interlayer can also be inferred, as illustrated in Fig. 3.4(b). After adsorption
the d001 is decreased to 12.58Ǻ which is equivalent to the silicate layer plus ~3Ǻ, the
same as the estimated thickness of a paraquat cation (~3Ǻ), indicating a flat and tight
disposition of planar paraquat cations at the clay interlayer. Due to the presence of
paraquat and strong electrostatic forces, the clay layers come closer together, changing
the clay’s swelling property, as inferred by the occurrence of coagulation and
flocculation of the clay particles with paraquat addition.
AFT treatment of carbaryl
Montmorillonite clay slurries with different initial carbaryl concentrations were
treated by AFT, and the results are shown in Fig. 3.5. Carbaryl can be effectively
removed from the slurry in 10 minutes at tested concentration ranges. The degradation
curves were fitted with the aqueous AFT model (31) with very good correlations. This
result is similar to our previous study on kaolinite clay, which found that the
degradation kinetics of carbaryl in kaolinite clay slurry were not affected by the
presence of the clay due to the extremely low adsorption of carbaryl.
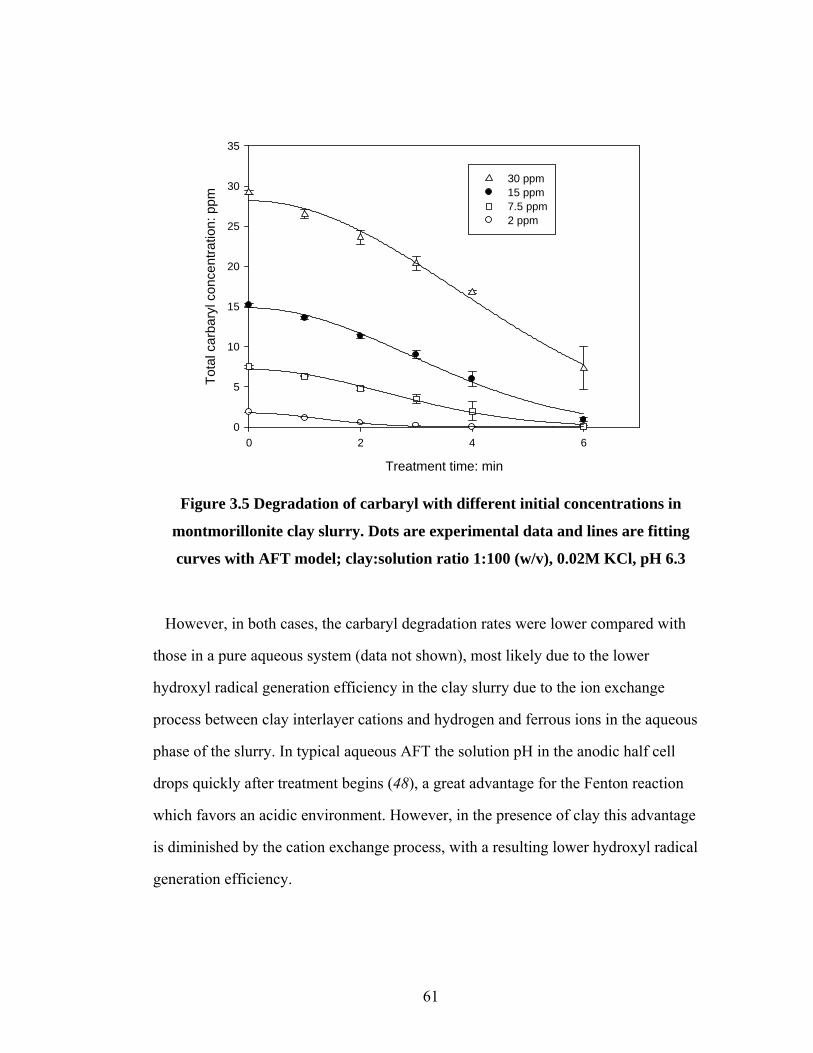
61
Treatment time: min
0 2 4 6
Tota
l car
bary
l con
cent
ratio
n: p
pm
0
5
10
15
20
25
30
35
30 ppm15 ppm7.5 ppm2 ppm
Figure 3.5 Degradation of carbaryl with different initial concentrations in
montmorillonite clay slurry. Dots are experimental data and lines are fitting
curves with AFT model; clay:solution ratio 1:100 (w/v), 0.02M KCl, pH 6.3
However, in both cases, the carbaryl degradation rates were lower compared with
those in a pure aqueous system (data not shown), most likely due to the lower
hydroxyl radical generation efficiency in the clay slurry due to the ion exchange
process between clay interlayer cations and hydrogen and ferrous ions in the aqueous
phase of the slurry. In typical aqueous AFT the solution pH in the anodic half cell
drops quickly after treatment begins (48), a great advantage for the Fenton reaction
which favors an acidic environment. However, in the presence of clay this advantage
is diminished by the cation exchange process, with a resulting lower hydroxyl radical
generation efficiency.
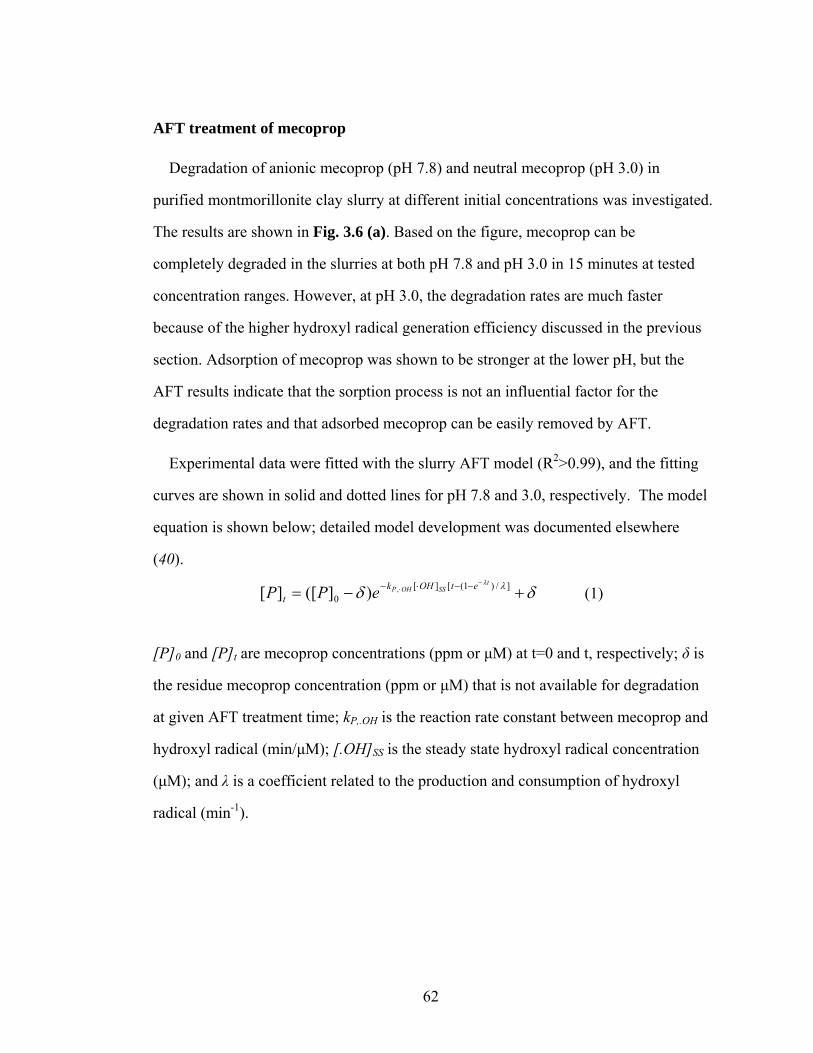
62
AFT treatment of mecoprop
Degradation of anionic mecoprop (pH 7.8) and neutral mecoprop (pH 3.0) in
purified montmorillonite clay slurry at different initial concentrations was investigated.
The results are shown in Fig. 3.6 (a). Based on the figure, mecoprop can be
completely degraded in the slurries at both pH 7.8 and pH 3.0 in 15 minutes at tested
concentration ranges. However, at pH 3.0, the degradation rates are much faster
because of the higher hydroxyl radical generation efficiency discussed in the previous
section. Adsorption of mecoprop was shown to be stronger at the lower pH, but the
AFT results indicate that the sorption process is not an influential factor for the
degradation rates and that adsorbed mecoprop can be easily removed by AFT.
Experimental data were fitted with the slurry AFT model (R2>0.99), and the fitting
curves are shown in solid and dotted lines for pH 7.8 and 3.0, respectively. The model
equation is shown below; detailed model development was documented elsewhere
(40).
δδ λλ
+−=−
⋅ −−⋅− ]/)1([][0
,)]([][t
SSOHP etOHkt ePP (1)
[P]0 and [P]t are mecoprop concentrations (ppm or μM) at t=0 and t, respectively; δ is
the residue mecoprop concentration (ppm or μM) that is not available for degradation
at given AFT treatment time; kP,.OH is the reaction rate constant between mecoprop and
hydroxyl radical (min/μM); [.OH]SS is the steady state hydroxyl radical concentration
(μM); and λ is a coefficient related to the production and consumption of hydroxyl
radical (min-1).
63
Treatment time: min
0 2 4 6 8 10 12 14 16
Slur
ry m
ecop
rop
conc
entra
tion:
ppm
0
10
20
30
40
38 ppm, pH 7.818 ppm, pH 7.89 ppm, pH 7.836 ppm, pH 3.018 ppm, pH 3.09 ppm, pH 3.0
(a)
Initial MCPP concentration: mg/L
5 10 15 20 25 30 35 40
Fitti
ng p
aram
eter
s: a
& b
0
1
2
3
4
5kP,.OH[OH]SS, pH 7.8λ, pH 7.8kP,.OH[OH]SS, pH 3λ, pH 3
(b)
Figure 3.6 (a) Degradation of mecoprop in montmorillonite clay slurry at pH 7.8
& 3.0. Dots are experimental data and lines are fitting curves with slurry AFT
model. (b) Model fitting parameters; clay:solution ratio 1:100 (w/v), 0.02M KCl
64
There are 3 fitting parameters for the model, kP,.OH[.OH]SS, δ and λ. Based on the
fitting results, δ values are all very small (<10-8), in accordance with complete
mecoprop removal by the treatment. Values of kP,.OH[.OH]SS, and λ are plotted in Fig.
3.6 (b). At lower pH, values of kP,.OH[.OH]SS, and λ are much higher, indicating higher
hydroxyl radical concentration and faster approach to the steady state, resulting in
faster degradation.
To further confirm that this treatment process is able to remove chemicals sitting at
the clay interlayer, two clay slurry samples (clay: solution=1:100 w/v) with high
mecoprop concentration (436 ppm) were prepared. The pH values of the clay slurry
samples were not adjusted. The adsorbed mecoprop was about 6 mg/g clay,
accounting for about 14% of total mecoprop. One clay slurry sample was treated by
AFT, and samples were collected on glass slides for XRD analysis, as shown in Fig.
3.7(a). Based on Fig. 3.7(a), it is clear that, after the treatment begins, the left shoulder
peak becomes weaker and weaker, until it totally disappears at 10 minutes; moreover,
the main peak becomes sharper as treatment time increases. It should be noted that the
aqueous mecoprop concentration was still high after 10 minutes AFT treatment
because of its high initial concentration. This evidence clearly demonstrates that the
interlayer mecoprop has been removed during the treatment process. To investigate
whether the desorption process is mainly responsible for this removal or not, the other
high mecoprop concentration sample underwent a desorption experiment, and samples
at different desorbing time intervals were collected for XRD analysis, as shown in Fig.
3.7(b). In the desorption experiment, after decanting the aqueous solution, the total
mecoprop concentration in the fresh water-refilled slurry was about 60 ppm (the
amount of adsorbed chemical). Based on the adsorption isotherm, at equilibrium, the
majority of previously adsorbed mecoprop should return to the aqueous phase, and due
to the very small amount of adsorbed mecoprop, it is not expected that the peak with a

65
d spacing of 14.73 Å will be detected by XRD. If the equilibrium shifts quickly, the
shoulder peak with a d spacing of 14.73 Å should disappear with the shifting of
equilibrium. Based on the XRD results, even after 6 h of desorption, the left shoulder
peak is still strong, though it weakens with desorption time, indicating that equilibrium
was not attained after 6 hours. The result suggests that the desorption rate is slower
than the AFT degradation rate. This fact rules out the desorption effect as the sole
removal mechanism of interlayer mecoprop. It can be reasonably inferred that
interlayer mecoprop is removed by either direct attack from hydroxyl radicals or
accelerated desorption in the AFT system, or by a combination of both mechanisms.
Collectively, XRD results strongly confirm that AFT is capable of effectively
removing interlayer mecoprop.
Figure 3.7 XRD analysis of montmorillonite clay during (a) AFT degradation and
(b) mecoprop desorption processes; clay:solution ratio 1:100 (w/v), 0.02M KCl,
pH 7.8
(a) AFT Degradation (b)
Desorption
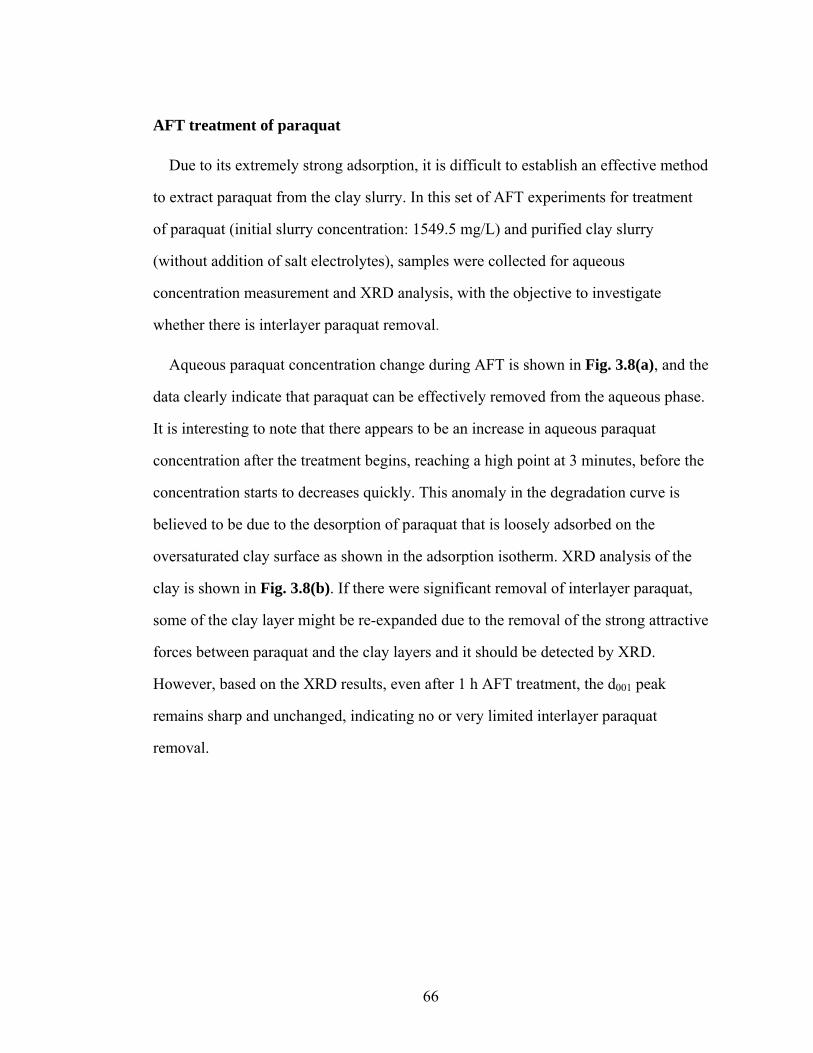
66
AFT treatment of paraquat
Due to its extremely strong adsorption, it is difficult to establish an effective method
to extract paraquat from the clay slurry. In this set of AFT experiments for treatment
of paraquat (initial slurry concentration: 1549.5 mg/L) and purified clay slurry
(without addition of salt electrolytes), samples were collected for aqueous
concentration measurement and XRD analysis, with the objective to investigate
whether there is interlayer paraquat removal.
Aqueous paraquat concentration change during AFT is shown in Fig. 3.8(a), and the
data clearly indicate that paraquat can be effectively removed from the aqueous phase.
It is interesting to note that there appears to be an increase in aqueous paraquat
concentration after the treatment begins, reaching a high point at 3 minutes, before the
concentration starts to decreases quickly. This anomaly in the degradation curve is
believed to be due to the desorption of paraquat that is loosely adsorbed on the
oversaturated clay surface as shown in the adsorption isotherm. XRD analysis of the
clay is shown in Fig. 3.8(b). If there were significant removal of interlayer paraquat,
some of the clay layer might be re-expanded due to the removal of the strong attractive
forces between paraquat and the clay layers and it should be detected by XRD.
However, based on the XRD results, even after 1 h AFT treatment, the d001 peak
remains sharp and unchanged, indicating no or very limited interlayer paraquat
removal.
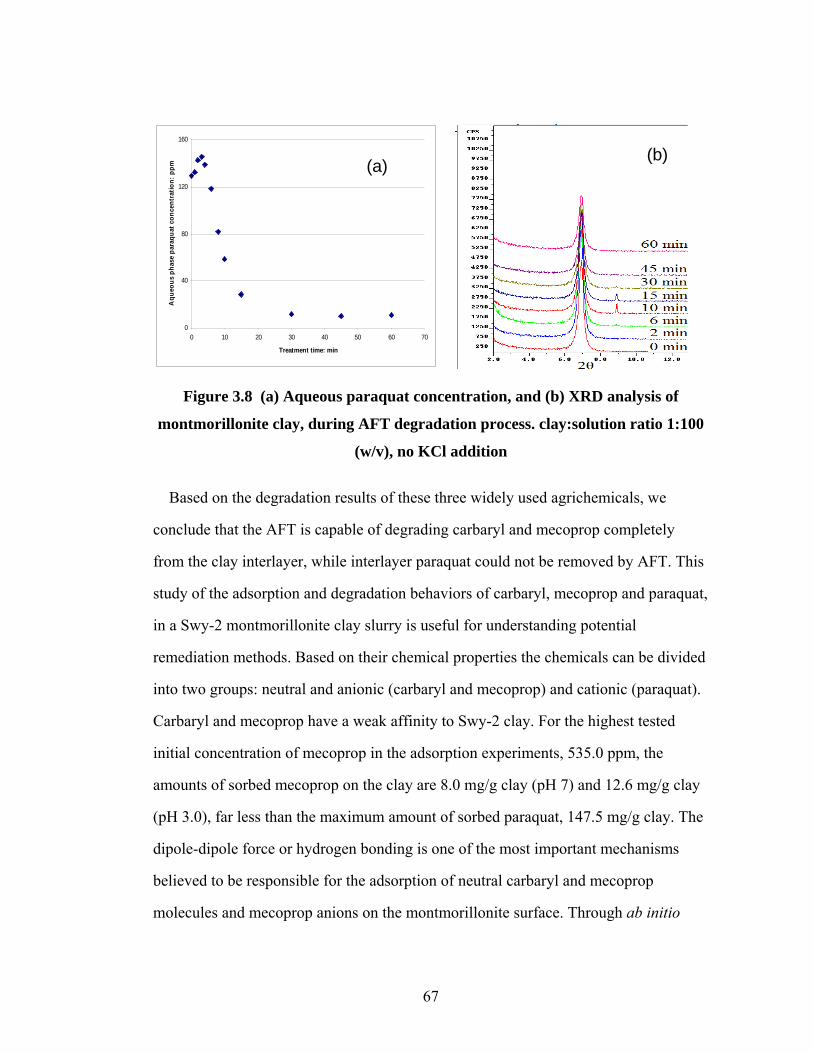
67
Figure 3.8 (a) Aqueous paraquat concentration, and (b) XRD analysis of
montmorillonite clay, during AFT degradation process. clay:solution ratio 1:100
(w/v), no KCl addition
Based on the degradation results of these three widely used agrichemicals, we
conclude that the AFT is capable of degrading carbaryl and mecoprop completely
from the clay interlayer, while interlayer paraquat could not be removed by AFT. This
study of the adsorption and degradation behaviors of carbaryl, mecoprop and paraquat,
in a Swy-2 montmorillonite clay slurry is useful for understanding potential
remediation methods. Based on their chemical properties the chemicals can be divided
into two groups: neutral and anionic (carbaryl and mecoprop) and cationic (paraquat).
Carbaryl and mecoprop have a weak affinity to Swy-2 clay. For the highest tested
initial concentration of mecoprop in the adsorption experiments, 535.0 ppm, the
amounts of sorbed mecoprop on the clay are 8.0 mg/g clay (pH 7) and 12.6 mg/g clay
(pH 3.0), far less than the maximum amount of sorbed paraquat, 147.5 mg/g clay. The
dipole-dipole force or hydrogen bonding is one of the most important mechanisms
believed to be responsible for the adsorption of neutral carbaryl and mecoprop
molecules and mecoprop anions on the montmorillonite surface. Through ab initio
0
40
80
120
160
0 10 20 30 40 50 60 70
Treatment time: min
Aqu
eous
pha
se p
araq
uat c
once
ntra
tion:
ppm (a) (b)
68
simulation (49), researchers have found that, in the presence of water molecules and
due to hydration, formation of complexes (cations as bridges connecting organics and
clay surfaces) between counter ions and organic anions (2,4-D) is not preferred;
however, there are three types of hydrogen bonding formed among species (water and
2,4-D anions) at montmorillonite surfaces. They are hydrogen bonds among water
molecules themselves, between water molecules and the 2,4-D anions, and between
water molecules and the clay basal siloxane oxygen atoms. Apparently water
molecules act as a bridge between 2,4-D anions and the clay surface. Mecoprop has a
structure and functional groups similar to 2,4-D, and the carbaryl molecule also has
the nitrogen and oxygen atoms necessary for forming hydrogen bonds. Therefore,
hydrogen bonding should be an important adsorption mechanism for these two
chemicals.
Through XRD analysis, though it was found that sorbed mecoprop forms a
monolayer between montmorillonite clay layers, it should be noted that the XRD
sample was air-dried, which was different from the original clay slurry sample. In an
air-dried sample, there are limited water molecules between clay layers, while in the
slurry sample, the clay is soaked with water and the clay is swelling. Through
computer simulations (50, 51) it was found that non-cationic organic molecules show
a tendency to remain completely in the expanded interlayer aqueous phase, if the clay
was soaked with water. In the slurry, due to the swelling of layered montmorillonite
clay, Fenton reagents are able to actually enter into this interlayer aqueous phase. As a
result, hydroxyl radicals can be generated locally at the clay interlayer aqueous phase,
and interlayer organic molecules can be attacked by the interlayer-produced hydroxyl
radicals. This is believed to be the main reason for the quick and complete removal of
mecoprop from the clay interlayer, as shown in the experimental data.

69
Paraquat has a completely different scenario. As stated previously, with the addition
of paraquat to the montmorillonite clay slurry the expanded clay began to shrink,
squeezing out water molecules from the interlayer, and coagulation, flocculation and
precipitation occurred. Due to the lack of enough water molecules, Fenton reagents are
not able to enter into the clay interlayer and there are no interlayer-produced hydroxyl
radicals. As a result, the removal of interlayer paraquat is none or quite limited, as
shown by XRD analysis.
These findings may benefit our understanding of the fate, transport and
transformation of organic pollutants in soil and have important implications for
selecting soil remediation strategies. Except for nitroaromatic compounds, which have
distinct adsorption mechanisms on smectite clay (52), for most other neutral or anionic
organic pollutants, their adsorption on soil organic matter (SOM) generally outweighs
their adsorption on clays, and SOM is a more important factor to study the fate and
transport of organic pollutants in soil. For cationic organic chemicals, their adsorption
on clay will be more important, especially in soils with a large content of layered clays
with high CEC since they cannot be removed effectively by AFT at the clay interlayer.
The Fenton reaction-based AFT process is capable of removing neutral or anionic
organic chemicals adsorbed at the clay interlayer effectively, which is an advantage
over bioremediation methods as discussed in the Introduction. The AFT method is an
effective and reliable option for treatment, on a small scale, of soils that are highly
contaminated by organic pollutants.
70
REFERENCES
1. Sparks, D. L., Environmental soil chemistry. 2nd ed.; Academic Press: San Diego, CA, 2003; p 111.
2. Chiou, C. T.; Peters, L. J.; Freed, V. H., A Physical Concept of Soil-Water Equilibria for Nonionic Organic Compounds. Science 1979, 206, (4420), 831-832.
3. Chiou, C. T.; Porter, P. E.; Schmedding, D. W., Partition equilibriums of nonionic organic compounds between soil organic matter and water. Environ. Sci. Technol. 1983, 17, (4), 227-231.
4. Theng, B. K. G.; Greenland, D. J.; Quirk, J. P., Adsorption of alkylammouim cations by montmorillonite. Clay Minerals 1967, 7, 1-17.
5. Tucker, B. V.; Pack, D. E.; Ospenson, J. N., Adsorption of bipyridylium herbicides in soil. J. Agric. Food Chem. 1967, 15, (6), 1005-1008.
6. de Keizer, A., Adsorption of paraquat ions on clay minerals. Electrophoresis of clay particles. In Interfaces in Condensed Systems, 1990; pp 118-126.
7. Smith, S. C.; Ainsworth, C. C.; Traina, S. J.; Hicks, R. J., Effect of Sorption on the Biodegradation of Quinoline. Soil Sci Soc Am J 1992, 56, (3), 737-746.
8. Jones, D. L.; Edwards, A. C., Influence of sorption on the biological utilization of two simple carbon substrates. Soil Biology and Biochemistry 1998, 30, (14), 1895-1902.
9. Masaphy, S.; Fahima, T.; Levanon, D.; Henis, Y.; Mingelgrin, U., Parathion Degradation by Xanthomonas sp. and Its Crude Enzyme Extract in Clay Suspensions. J Environ Qual 1996, 25, (6), 1248-1255.
10. Crocker, F. H.; Guerin, W. F.; Boyd, S. A., Bioavailability of Naphthalene Sorbed to Cationic Surfactant-Modified Smectite Clay. Environ. Sci. Technol. 1995, 29, (12), 2953-2958.
11. Miller, M. E.; Alexander, M., Kinetics of bacterial degradation of benzylamine in a montmorillonite suspension. Environ. Sci. Technol. 1991, 25, (2), 240-245.
12. Steinberg, S. M.; Pignatello, J. J.; Sawhney, B. L., Persistence of 1,2-dibromoethane in soils: entrapment in intraparticle micropores. Environ. Sci. Technol. 1987, 21, (12), 1201-1208.
13. Pignatello, J. J.; Sawhney, B. L.; Frink, C. R., EDB: Persistence in Soil Science 1987, 236, 898.
71
14. Kwan, W. P.; Voelker, B. M., Rates of Hydroxyl Radical Generation and Organic Compound Oxidation in Mineral-Catalyzed Fenton-like Systems. Environ. Sci. Technol. 2003, 37, (6), 1150-1158.
15. Chen, F.; Ma, W.; He, J.; Zhao, J., Fenton degradation of malachite green catalyzed by aromatic additives. J. Phys. Chem. A 2002, 106, (41), 9485-9490.
16. Fongsatitkul, P.; Elefsiniotis, P.; Yamasmit, A.; Yamasmit, N., Use of sequencing batch reactors and Fenton's reagent to treat a wastewater from a textile industry. Biochemical Engineering Journal 2004, 21, 213-220.
17. Moraes, J. E. F.; Quina, F. H.; Nascimento, C. A. O.; Silva, D. N.; Chiavone-Filho, O., Treatment of saline wastewater contaminated with hydrocarbons by the Photo-Fenton Process. Environ. Sci. Technol. 2004, 38, 1183-1187.
18. Watts, R. J.; Bottenberg, B. C.; Hess, T. F.; Jensen, M. D.; Teel, A. L., Role of reductants in the enhanced desorption and transformation of chloroaliphatic compounds by modified Fenton's reactions. Environ. Sci. Technol. 1999, 33, (19), 3432-3437.
19. Watts, R. J.; Bottenberg, B. C.; Jensen, M. D.; Hess, T. H.; Teel, A. L., Mechanism of the enhanced treatment of chloroaliphatic compounds by Fenton-like reactions Environ. Sci. Technol. 1999, 33, (12), 3432-3437.
20. Tyre, B. W.; Watts, R. J.; Miller, G. C., Treatment of four biorefractory contaminants in soils using catalyzed hydrogen peroxide. J. Environ. Qual. 1991, 20, 832-838.
21. Watts, R. J.; Udell, M. D.; Rauch, P. A., Treatment of pentachlorophenol-contaminated soils using Fenton's reagent. Hazard. Waste Hazard. Mater. 1990, 7, (4), 335-345.
22. Watts, R. J.; Kong, S.; Dippre, M.; Barnes, W. T., Oxidation of sorbed hexachlorobenzene in soils using catalyzed hydrogen peroxide. J. Hazard. Mater. 1994, 39, (1), 33-47.
23. Watts, R. J.; Jones, A. P.; Chen, P. H.; Kenny, A., Mineral catalyzed Fenton-like oxidation of sorbed chlorobenzenes. Water Environ. Res. 1997, 69, (2), 269-275.
24. Yang, G. C. C.; Liu, C.-Y., Remediation of TCE contaminated soils by in situ EK-Fenton process. Journal of Hazardous Materials 2001, B85, 317-331.
25. Pignatello, J. J.; Baehr, K., Ferric complexes as catalysts for "Fenton" degradation of 2,4-D and metolachlor in soil. Journal of Environmental Quality 1994, 23, 365-370.
72
26. Li, Z. M.; Peterson, M. M.; Comforta, S. D.; Horstb, G. L.; Shea, P. J.; Oh, B. T., Remediating TNT-contaminated soil by soil washing and Fenton oxidation. Sci. Total Environ. 1997, 204, 107-115.
27. Flotron, V.; Delteil, C.; Padellec, Y.; Camel, V., Removal of sorbed polycyclic aromatic hydrocarbons from soil, sludge and sediment samples using the Fenton's reagent process. Chemosphere 2005, 59, 1427-1437.
28. Bogan, B. W.; Trbovic, V.; Paterek, J. R., Inclusion of vegetable oils in Fenton's chemistry for remediation of PAH-contaminated soils. Chemosphere 2003, 50, 15-21.
29. Bier, E. L.; Singh, J.; Li, Z.; Comfort, S. D.; Shea, P. J., Remediating hexahydro-1,3,5-trinitro-1,2,5-trazine-contaminated water and soil by Fenton oxidation. Environmental Toxicology and Chemistry 1999, 18, 1078-1084.
30. Wang, Q.-Q.; Lemley, A. T., Oxidation of carbaryl in aqueous solution by membrane Anodic Fenton Treatment. J. Agric. Food Chem. 2002, 50, 2331-2337.
31. Wang, Q.-Q.; Lemley, A. T., Kinetic model and optimization of 2,4-D degradation by Anodic Fenton treatment. Environ. Sci. Technol 2001, 35, 4509-4514.
32. Wang, Q.-Q.; Lemley, A. T., Competitive degradation and detoxification of carbamate insecticides by membrane anodic Fenton treatment. . J. Agric. Food Chem. 2003, 51, (5382-5390).
33. Saltmiras, D. A.; Lemley., A. T., Atrazine degradation by anodic Fenton treatment. Water Res. 2002, 36, 5113-5119.
34. Saltmiras, D. A.; Lemley., A. T., Degradation of ethylene thiourea (ETU) with three Fenton treatment processes. . J. Agric. Food Chem. 2000, 48, 6149-6157.
35. Saltmiras, D. A.; Lemley., A. T., Anodic Fenton treatment of treflan MTF® J. Environ. Sci. Health Part A Toxic/Hazard. Subst. Environ. Eng. 2001, A36, 261-274.
36. Wang, Q.-Q.; Lemley, A. T., Oxidative degradation and detoxification of aqueous carfuran by membrane anodic Fenton treatment. J. Hazard. Mater. 2003, B98, 241-255.
37. Wang, Q.-Q.; Lemley, A. T., Competitive degradation and detoxification of carbamate insecticides by membrane anodic Fenton treatment. J. Agric. Food Chem. 2003, 51, (5382-5390).
38. Wang, Q.-Q.; Lemley, A. T., Kinetic effect of humic acid on alachlor degradation by anodic fenton treatment. J. Environ. Qual. 2004, 33, 2343-2352.

73
39. Kong, L.; Lemley, A. T., Kinetic modeling of 2,4-dichlorophenoxyacetic acid (2,4-D) degradation in soil slurry by Anodic Fenton Treatment. J. Agric. Food Chem. 2006, 54, 3941-3950.
40. Ye, P.; Kong, L.; Lemley, A. T., Kinetics of Carbaryl Degradation by Anodic Fenton Treatment in a Humic Acid Amended Artificial Soil Slurry. Water Environ. Res. 2008, In Press.
41. Arroyo, L. J.; Li, H.; Teppen, B. J.; Johnston, C. T.; Boyd, S. A., Hydrolysis of Carbaryl by Carbonate Impurities in Reference Clay SWy-2. J. Agric. Food Chem. 2004, 52, (26), 8066-8073.
42. Sumner, M. E.; Miller, W. P., Cation exchange capacity and exchange coefficients. In Methods of Soil Analysis: Chemical Methods. Part 3., Sparks, D. L., Ed. Soil Science Society of America, Inc.: Madison, Wisconsin, 1996; pp 1201-1229.
43. Ruiz-Hitzky, E.; Aranda, P.; Serratosa, J. M., Clay-organic interactions: organoclay complexes and polymer-clay nanocomposites. In Handbook of Layered Materials, Auerbach, S. M.; Carrado, K. A.; Dutta, P. K., Eds. Marcel Dekker, Inc.: New York, 2004; pp 91-154.
44. Hermosin, M. C.; Martin, P.; Cornejo, J., Adsorption mechanisms of monobutyltin in clay minerals. Environ. Sci. Technol. 1993, 27, (12), 2606-2611.
45. CambridgeSoft ChemBioOffice Ultra 2008, 2008.
46. Glaser, R., Biophysics. 5th ed.; Springer: Berlin; New York, 2001; p 60.
47. Rytwo, G.; Nir, S.; Margulies, L., A Model for Adsorption of Divalent Organic Cations to Montmorillonite. Journal of Colloid and Interface Science 1996, 181, (2), 551-560.
48. Wang, Q.; Lemley, A. T., Oxidation of diazinon by anodic Fenton treatment. Water Research 2002, 36, (13), 3237-3244.
49. Tunega, D.; Gerzabek, M. H.; Haberhauer, G.; Lischka, H., Formation of 2,4-D complexes on montmorillonites - an ab initio molecular dynamics study. European Journal of Soil Science 2007, 58, (3), 680-691.
50. Brian J. Teppen; Yu, C.-H.; Miller, D. M.; Schaer, L., Molecular dynamics simulations of sorption of organic compounds at the clay mineral/aqueous solution interface. Journal of Computational Chemistry 1998, 19, (2), 144-153.
51. Yu, C.-H.; Newton, S.; Norman, M.; Schäfer, L.; Miller, D., Molecular Dynamics Simulations of Adsorption of Organic Compounds at the Clay Mineral/Aqueous Solution Interface. Structural Chemistry 2003, 14, (2), 175-185.

74
52. Boyd, S. A.; Sheng, G.; Teppen, B. J.; Johnston, C. T., Mechanisms for the Adsorption of Substituted Nitrobenzenes by Smectite Clays. Environ. Sci. Technol. 2001, 35, (21), 4227-4234.
75
Chapter 4
Adsorption Effect on the Degradation of 4,6-o-dinitrocresol and p-nitrophenol in
a Montmorillonite Clay Slurry by AFT
4.1 Introduction
Nitroaromatic compounds (NAC) are primarily released into environmental media
from anthropogenic sources. They are usually used as pesticides, explosives or azo
dyes, and some are also products of the incomplete combustion of gasoline and diesel
fuel (1). As widely used pesticides, dinitrocresol, dinoseb, parathion and methyl
parathion are intentionally released into soil and water through direct application, and
may also be spilled accidentally during transportation or agricultural use.
It is well established that, compared with soil clay and minerals, nonionic organic
chemicals have a much stronger affinity for soil organic matter (2-4). However, recent
studies (5-8) have found that negatively charged smectite clays are capable of
adsorbing nitroaromatic compounds in unexpectedly large amounts. It was believed
that two categories of surface sites, nonpolar and polar, are involved in NAC
adsorption on clay minerals (8). Nonpolar sites are on the neutral siloxane surface,
which are believed to be hydrophobic and important for the sorption of neutral organic
compounds; polar sites originate from isomorphic substitution sites and from broken
edges.
In the presence of K+ or Cs+ at the clay interlayer, the strong adsorption of NACs on
smectites is governed by at least two important factors. One factor is the accessibility
of those neutral hydrophobic sites at clay surfaces for NACs molecules. At the
smectite interlayer, due to the hydration of interlayer cations, those sites are often

76
blocked by water molecules. For those cations with lower hydration energy and
smaller hydration radius, such as K+ and Cs+, it is relatively easy for organic
molecules to replace interlayer molecules, accessing those hydrophobic siloxane sites.
However, it is believed that there is another more important factor affecting adsorption,
the interaction between cations and NACs molecules. Boyd, et al (5) and Johnston, et
al (6) found that there is strong interaction between interlayer K+ and –NO2 groups on
NACs, which was verified by FTIR spectra data and computational simulation. They
also found that other cations, such as Na+, Mg2+ and Ca2+, did not interact with –NO2
groups based on the FTIR spectra data, because of the stronger hydration and larger
hydration radii of these cations. They concluded that the strong adsorption of NAC on
K+-smectite was mainly due to the formation of a complex between K+ and NACs.
These findings offer researchers a better understanding of the adsorption of NACs on
layered clays and their retention in soil as well.
The strong adsorption of NACs on layered clays will greatly affect their fate and
transport in soils. Based on previous studies (5-8), adsorbed NAC molecules stay
firmly at the clay interlayer, which greatly decreases their bioavailability to
microorganisms and increases their retention time in soils. For remediation of heavily
NAC contaminated soils, the chemical oxidation method is a good option due to the
high aggressiveness and small size of the chemical oxidants, e.g., hydroxyl radicals.
In a companion study (9) from our laboratory, the adsorption and degradation of
carbaryl, mecoprop and paraquat in an Swy-2 montmorillonite clay slurry was
investigated. Results demonstrated that anodic Fenton treatment (AFT) is a reliable
method to degrade non-cationic carbaryl and mecoprop at the clay interlayer, though
interlayer paraquat cations could not be removed due to their inaccessibility to Fenton
reagents. Results also showed that different adsorption mechanisms affected the
77
degradation; specifically, the adsorption of carbaryl and mecoprop through hydrogen
bonding and weak van del Waals forces has much less effect on the degradation than
the adsorption of paraquat through strong electrostatic forces.
NACs have a unique adsorption mechanism on smectite clays, as mentioned above,
which drives a large amount of adsorption on clay surfaces in the presence of specific
cations, e.g., K+ and Cs+. To the best of our knowledge, there is no research to
investigate the effect of this adsorption mechanism on the degradation of NACs by
chemical oxidation, which is important for selecting remediation strategies for NAC
contaminated soils.
In the present study, Na+-montmorillonite source clay from the Clay Minerals
Society was selected as a testing medium, and 4, 6-o-dinitrocresol (DNOC) and p-
nitrophenol (PNP) were selected as two probes representing NACs. The objectives of
this study were: (a) to investigate the adsorption effects of montmorillonite clay on the
degradation of probe chemicals in the AFT system; (b) to identify DNOC degradation
intermediates and illustrate DNOC degradation pathways in the AFT system, and (c)
to identify whether AFT is able to remove NACs at the clay interlayer.
4.2 Materials and Experiments
Chemicals
Source clay, Na+-montmorillonite (code: Srce_Clay_SWy-2), was obtained from
the Clay Minerals Society (West Lafayette, Indiana). 4, 6-o-dinitrophenol (99.5%) was
purchased from ChemService, Inc (West Chester, PA). p-nitrophenol (99%) and
hydrogen peroxide (30%, analytical grade) were purchased from Sigma-Aldrich (St.
Louis, MO). Water and acetonitrile, both HPLC grade, were purchased from Fisher
Scientific (Pittsburgh, PA). Deionized water (electrical resistance, R≥18.1 MΩ.cm-1)
was produced by an MP-1 Mega-PureTM system (Corning, NY).
78
Purified clay
The purification process is based on the literature (10). To obtain purified clay (<2
μm), 25 g of SWy-2 was placed in a 2 L beaker with 1.8 L of d.i. water and stirred for
8 h using a magnetic stir bar to hydrate the clay. After overnight (~18 h) settling, the
supernatant suspension containing the <2 μm clay-sized particles was poured into 50
mL polyethylene centrifuge tubes and then centrifuged for 30 min at 6000 rpm. After
discarding the supernatant, the purified clay sample was then quick-frozen by liquid
nitrogen, freeze-dried, and stored.
Adsorption experiments
Adsorption batch experiments were conducted to obtain adsorption isotherms for
DNOC and PNP in the clay slurry. Based on a preliminary adsorption kinetics study
(data not shown), the adsorption equilibrium can be attained within 24 hours. 50.0 mg
purified clay and 10.0 mL probe chemical solutions with different electrolytes were
placed into 15 mL tubes; pH was adjusted by 0.01 M HCl if needed. After 24 h
shaking, a 1.0 mL sample was collected, and after 15 min-centrifuging at 10,000 rpm,
the supernatant was collected for concentration analysis. The amount of adsorbed
chemical was calculated based on the difference in aqueous concentration between the
initial time and 24 h.
AFT batch experiments
All experiments were carried out in two 150-mL glass cells; a scheme of the
experimental apparatus is shown in Fig. 1.1. Typically, 100.0 mL of probe chemical
and clay slurry with 0.02M KCl was added to the anodic half-cell, and the same
volume of 0.08M NaCl solution was added to the cathodic half-cell. These two half-
cells were separated by an anion exchange membrane (Electrosynthesis Company, Inc.,
Lancaster, NY). Each of the half-cells was well stirred by a magnetic stir bar. Ferrous
79
ion was generated by electrolysis in the anodic half-cell from a pure iron anode (0.5
cm × 10 cm × 0.2 cm). A graphite stick (1 cm (i.d.) × 10 cm (length)) was used as the
cathode. The electric current was controlled at 0.050 A by a BK Precision DC power
supply 1610 (TestPath, Inc., Danvers, MA). Hydrogen peroxide solution (0.311 M)
was delivered to the anodic half-cell using a STEPDOS® diaphragm metering pump
(KNF Neuberger, Inc., Trenton, NJ) at a rate of 0.50 mL min-1. When the first drop of
hydrogen peroxide dropped into the anodic half-cell, the electrolysis current was
turned on. Clay/solution ratio, molar ratio of H2O2 and Fe2+, and pH were kept at
1:100 (w/v), 10:1, and pH 3, respectively, unless specified, and all experiments were
conducted at room temperature, 22±1 . At given time intervals, a 0.7 mL sample
was collected and added to a 1.5 mL tube containing 0.7 mL acetone which is used to
quench the hydroxyl radical and to extract probe chemicals from the slurry in order to
get the total concentration. The acetone extraction efficiency of DNOC and PNP
extraction were greater than 99%. The experiments were repeated twice.
XRD analysis
Clay thin film samples for XRD analysis were prepared by air drying several drops
of clay slurry on glass slides. XRD spectra of clay films were obtained using a Scintag
X-ray diffractometer equipped with Cu-K radiation. The scanning angle (2θ) ranged
from 2 to 35 degrees at steps of 3 degrees per minute.
Concentration measurement
The concentrations of DNOC and PNP were measured by an Agilent 1200 HPLC
equipped with a diode array detector (Agilent Technologies, Inc, Santa Clara, CA).
For DNOC, the mobile phase was composed of 80% acetonitrile and 20% HPLC
grade water (pH 3, adjusted by phosphoric acid). For PNP, the mobile phase was
composed of 50% acetonitrile and 50% HPLC grade water (pH 3, adjusted by
80
phosphoric acid). A carbon eighteen 5 μm 150 mm × 4.6 mm (i.d.) Agilent reverse
phase column was used. Flow rates were all set to 1.0 mL/min. The chosen UV
wavelengths for DNOC and PNP were 269 and 317 nm, respectively.
Identification of DNOC degradation intermediates
In order to get a higher concentration of degradation intermediates, 100 mg/L
DNOC with 0.02 M KCl solution was treated by AFT. Electric current and H2O2
concentration were controlled at 0.01 Amp and 0.0662 M. 1.0 ml samples were
collected periodically during the treatment, and 0.1 mL methanol was added to quench
hydroxyl radicals. The sample was analyzed by an Agilent 1200 HPLC with an
Agilent 6130 Quadrupole Mass spectrometer. The analysis conditions are as follows:
Gradient mobile phase: 0-10 min 50% H2O (pH 3 adjusted by acetic acid), 10-15
minutes, acetonitrile increased from 50% to 100 % at a rate of 10% per minute, 50%
acetonitrile, 15-26 min 100% acetonitrile; Mobile phase flow rate, 0.5 ml/min;
Column: C18 5 μm 150 mm × 4.6 mm (i.d.) Agilent reverse phase; Mass spectrometer
mode: ES+APCI Multi Mode; drying gas (N2) flow rate, 12.0 L/min; nebulizer
pressure, 40 psig; drying gas temperature, 350 ; vaporizer temperature: 250 .
Nitrogen measurement
In order to check whether there were nitro groups being broken down from DNOC
molecules, nitrogen concentration in the forms of NO3-/NO2
- and NH4+ were measured
during the AFT treatment of DNOC solution (AFT operating conditions were the same
as those described above). The analysis was conducted by a Bran+Luebbe Automated
Injection Ion Analyzer (Bran + Luebbe Inc., Delavan, WI) at the Cornell Nutrient
Analysis Laboratory.

81
4.3 Results
Effect of electrolytes on the adsorption of DNOC and PNP
Since the clay is negatively charged, the metal cations in the solution will enter the
clay interlayer through the cation exchange process. DNOC adsorption isotherms in
Swy-2 clay slurry (pH 3.25) with different electrolytes, 0.02 M NH4Cl, 0.01 M CaCl2,
0.02 M KCl or 0.02 M NaCl, are shown in Fig. 4.1. It is important to note that two
different scales were used for the x-axis, the top one for KCl and NH4Cl and the
bottom one for CaCl2 and NaCl. All isotherms were fitted with the Freundlich
equation, S=KFCe1/n, in which S (mg/g clay) is the mass of adsorbed probe chemical
per gram clay; Ce is the equilibrium concentration of the probe chemical in aqueous
solution; and KF and 1/n are constants. The fitted parameters, KF, 1/n, and R2, are
summarized in Table 4.1. It can be seen that DNOC adsorption in the different
Sor
bed
DN
OC
: mg/
g cl
ay
0
5
10
15
20
25
Aqueous DNOC: mg/L (NaCl, CaCl2)
0 10 20 30 40 50
0.0 .2 .4 .6
0.02 M NH4Cl0.01 M CaCl20.02 M KCl0.02 M NaCl
Aqueous DNOC: mg/L (KCl, NH4Cl)
Figure 4.1 Effect of electrolytes on DNOC adsorption on Swy-2 clay

82
Table 4.1 Freundlich equation fitting parameters for DNOC and PNP adsorption
isotherms
KF 1/n Adjusted R2
DNOC, 0.02 M NH4Cl 33.9 0.94 0.98
DNOC, 0.01 M CaCl2 0.34 1.12 0.98
DNOC, 0.02 M KCl 108.1 1.10 0.99
DNOC, 0.02 M NaCl 0.031 1.59 0.99
PNP, 0.02 M KCl 0.0143 1.19 0.97
PNP, 0.02 M NaCl 0.0005 1.55 0.98
electrolytes follows the order: KCl>NH4Cl>>CaCl2>NaCl. At pH 3.25, DNOC
adsorption in KCl and NH4Cl electrolytes is more than two orders of magnitude larger
than that in CaCl2 or NaCl. This result can be partially explained by looking at the
estimated hydration radii for K+, NH4+, Na+ and Ca2+, which are 1.75, 1.88, 2.17 and
2.72 Å, respectively (11). The extremely strong adsorption of DNOC on the clay in the
presence of KCl is believed to be mainly due to the interaction between K+ and the
nitro groups on DNOC molecules, but the small hydration radius, and consequent low
hydration energy, of K+ also enables DNOC molecules to easily access the
hydrophobic sites at clay surfaces. There is a similar strong adsorption of DNOC in
the presence of NH4Cl for the same reasons, both a possible interaction between NH4+
and the nitro groups in the DNOC molecules and access to the clay surfaces. Due to
the stronger hydration energies of Ca2+ and Na+, DNOC adsorption on smectite in both
solutions is significantly lower than the other two electrolytes. However, since the
hydration energy of Ca2+ is higher than Na+, the adsorption in the NaCl solution

83
should be the higher of the two, which is what is found in the literature (7). The
opposite result in the current work might be due to the lower concentration of Ca2+.
An XRD spectrum of DNOC adsorption on Swy-2 clay in the presence of NaCl and
KCl is shown in Fig. 4.2 (a). It should be noted that the XRD spectrum here reflects
the clay d spacing (d001) in the air dried state. In the slurry, due to the swelling of the
clay layers, the d spacing would be larger. The peaks on the left side are clay d001
peaks in the presence of NaCl with different initial DNOC slurry concentrations,
ranging from 0 to 176.3 mg/L from bottom to top. On the right side the peaks are d001
peaks in the presence of KCl with different initial DNOC slurry concentrations, from 0
to 172.4 mg/L. In the presence of NaCl, the d001 spacing, 15.0 Å, is larger than that in
the presence of KCl, 12.0 Å, which is mainly due to the larger hydration radius of Na+
as mentioned previously. For montmorillonite clay used, the thickness of its silicate
layer is about 9.6Å (12). The thickness of the planar DNOC molecule is estimated to
be around 2 Å (13). In the presence of NaCl, the interlayer distance is estimated to be
~5.4 Å, which is large enough to hold the DNOC molecules. In the presence of KCl,
this distance is reduced to ~2.4 Å, which is just able to accomodate one layer of
DNOC molecules sitting flat and parallel to the clay siloxane surface. Thus, in the
presence of KCl, the adsorbed DNOC molecules are much more closely packed at the
interlayer. It can also be seen that with the increase of the initial DNOC concentration,
there is no significant peak change for either electrolyte, indicating no obvious change
in the d001 spacing.

84
Figure 4.2 (a) XRD spectrum of DNOC adsorption on Swy-2 clay in the presence
of NaCl and KCl with different DNOC initial concentrations (for 6 XRD spectra
for KCl or NaCl, corresponding from bottom to top to DNOC 0, 8.3, 16.6, 49.8,
83.0 and 166.0 ppm, respectively); (b) XRD spectrum of DNOC adsorption on
Swy-2 clay at different pHs in the presence of KCl
Aquesous equilibrium PNP cocnetration: mg/L
0 100 200 300 400 500
Sor
bed
PNP
, mg
PN
P/g
Cla
y
0
5
10
15
20
25
0.02M KCl @ pH 3.20.02M NaCl @ pH 3.2
Figure 4.3 Adsorption isotherms of PNP on purified Swy-2 clay
(a) (b)
NaCl
KCl
pH 2.7 pH 3.4 pH 4.1 pH 5.4 pH 6.2 pH 6.7
8 mg DNOC/g clay
20 mg DNOC/g clay

85
The adsorption of PNP on the purified Swy-2 clay is shown in Fig. 4.3. The
adsorption isotherms were also fitted with the Freundlich equation, as summarized in
Table 1. PNP adsorption on Swy-2 clay is much less than DNOC adsorption. One
important reason for this result is the much higher water solubility of PNP (12.4 g/L)
than DNOC (198 mg/L). The adsorption of PNP is much greater in the presence of K+,
in agreement with the DNOC adsorption results. The KF of the PNP-KCl system
(0.0143) is nearly 30 times higher than that of the PNP-NaCl system (0.0005), due to
the interaction of K+ with the nitro group in PNP.
Effect of pH on the adsorption of DNOC
The effect of pH on the adsorption of DNOC in Swy-2 clay slurry is illustrated in
Fig. 4.4. DNOC is a weak acid with a pKa of 4.4. In a neutral or basic environment,
DNOC exists mainly in its anionic form, while in an acidic environment (pH<3.4), the
neutral DNOC molecule is the dominant species. Based on the data shown, the
percentage of DNOC being adsorbed on the clay increases sharply with a decrease of
pH, indicating that neutral DNOC molecules have a stronger affinity, or less repulsion,
to the negatively charged Swy-2 clay surface. In the presence of 0.02M NaCl, sorbed
DNOC increased from 1.7% at pH 5.9, to 35% at pH 4.3 and 57% at pH 2.8.
Following the same trend but with a larger magnitude, sorbed DNOC in the presence
of 0.02M KCl increased from 35% at pH 6.7, to 99.5% at pH 4.1 and 99.7% at pH 2.7,
indicating almost complete adsorption when the pH was below the pKa of DNOC
under given experimental conditions. This result for DNOC adsorption on K+
exchanged Swy-2 clay is in agreement with the literature (14). The XRD spectrum of
Swy-2 clay with DNOC adsorption at various pH values is shown in Fig. 4.2 (b). With
the decrease of slurry pH, the peak did not shift, though DNOC adsorption on clay

86
increased from 8.0 to 20.0 mg/g clay, indicating a stable d001 spacing of 12.0 Å. It can
be inferred that DNOC molecules formed a monolayer at the clay interlayer.
Slurry pH
pH2 pH3 pH4 pH5 pH6 pH7
Mas
s Pe
rcen
tage
of A
dsor
bed
DN
OC
0%
20%
40%
60%
80%
100%
0.02M KCl0.02M NaCl
Figure 4.4 DNOC adsorption on purified Swy-2 clay in the presence of KCl or
NaCl at different pHs.
Time: minutes
0 10 20 30 40 50 60
Ct/C
0
0.0
.2
.4
.6
.8
1.0
K+-Clay, pH 7.2 K+-Clay, pH 3.7Na+-Clay pH 6.5 Na+-Clay pH 3.5NH4
+-Clay pH 6.8
NH4+-Clay pH 3.2
Figure 4.5 Degradation of DNOC by AFT in Swy-2 slurry with different
electrolytes and pHs

87
Degradation of DNOC in Swy-2 slurry by AFT
Degradation of DNOC in purified Swy-2 slurry by AFT was investigated. A 0.50 g
sample of purified Swy-2 clay was used to prepare the 100 mL DNOC slurry.
Different types of electrolytes, 0.02M KCl, NaCl and NH4Cl were added. Two slurry
pHs, neutral (unadjusted) pH and adjusted low pH, were studied for each type of
electrolyte. Degradation results are illustrated in Fig. 4.5. The degradation data were
fitted with the slurry AFT model (15) with very good fitting (R2>0.98). Based on the
results, the effect of electrolytes and pH on the degradation rates and kinetics can be
discussed.
With the same AFT conditions and electrolyte concentrations, 0.02 M, DNOC
degradation rates in the Swy-2 clay slurry follow the order: NaCl>>NH4Cl>KCl, the
opposite order of DNOC affinity on the Swy-2 clay in the presence of the electrolytes,
as reported above in the adsorption experiments. Under given experimental conditions,
DNOC can be removed completely within 20 minutes in the presence of NaCl,
whereas, in the presence of NH4Cl, there was 50% or more DNOC remaining in the
slurry after 30 minutes treatment, depending on the slurry pH. Similarly, in the case of
KCl, over 50% DNOC remained in the slurry even after 60 minutes treatment. Based
on the adsorption experiments, it was found that DNOC has a weaker affinity for the
Swy-2 clay in the presence of NaCl compared with KCl and NH4Cl. Thus, there is a
higher DNOC removal efficiency in the NaCl Swy-2 slurry. On the other hand, the
strong affinity of DNOC for Swy-2 clay greatly slows down degradation in the
presence of KCl or NH4Cl.
The pH also affects DNOC degradation rates. In the presence of KCl or NH4Cl, it
was found that DNOC degradation was faster in neutral pH than in low pH. For
example, under given experimental conditions, in the presence of 0.02 M KCl, DNOC

88
removal was ~50% at pH 7.2 after 60 minutes treatment but was 32% at pH 3.7,
clearly indicating a low degradation rate at low pH. This finding is opposite to
findings in our previous studies (9, 15), where it was found that a low pH enhanced
the degradation of probe chemicals either in aqueous solution or soil or clay slurries
because of the higher Fenton reaction efficiency at lower pH. The explanation for this
contradictory finding relates to adsorption. As reported above, it was found that
DNOC adsorption on Swy-2 clay is stronger at lower slurry pH. Under given
experimental conditions, DNOC adsorption reached almost 100% at pH 3.7, with
minimal DNOC in the aqueous solution. In preliminary studies we used methanol to
extract DNOC from the slurry in the presence of KCl. At neutral pH, the extraction
efficiency was ~98%; however, the extraction efficiency dropped quickly to <20% at
pH 3. Since DNOC has a higher solubility in acetone, we changed the extractant and
achieved very good extraction efficiency through all tested pH ranges. This finding
clearly demonstrates that DNOC affinity to Swy-2 clay is stronger in the lower pH
environment. As a result, DNOC degradation in the presence of KCl was much lower
at a lower slurry pH than at a higher pH. The same explanation applies to the NH4Cl
results. But in the case of NaCl, pH has little effect on the DNOC degradation rate.
This is the result of two opposite effects. Since the DNOC adsorption is lower overall,
the effect of lowered pH, which increases adsorption, and thus decreases degradation,
is offset by the Fenton reaction efficiency increase with a decrease of pH, which has a
positive effect on degradation.
Through XRD analysis it was found that sorbed DNOC forms a monolayer at the
clay interlayer. It should be noted, however, that the XRD sample was air-dried, which
was different from the original clay slurry sample. In an air-dried sample, there are
limited water molecules at the clay interlayer. In the slurry sample, the clay is soaked
with water, which causes the clay to swell, and causes a so-called ‘subaqueous’ phase

89
to be formed at the clay interlayer. Through computer simulations by other workers
(16, 17), it was found that interlayer ‘trapped’ non-cationic organic molecules show a
tendency to remain completely in the interlayer aqueous phase. In a companion study
(9), it was found through XRD analysis that a probe chemical, mecoprop, was
completely removed at the clay interlayer by AFT. It was proposed that Fenton
reagents are able to enter the interlayer, where hydroxyl radicals are generated locally.
It was verified in that study that the mecoprop desorption process is much slower than
the Fenton degradation process. In the current study, the probe chemical DNOC has a
much stronger affinity for Swy-2 clay than mecoprop. It is reasonable to infer that the
desorption of DNOC from Swy-2 clay is slower than that of mecoprop. Thus the
removal of DNOC from the clay interlayer would mainly be due to the degradation
reaction with hydroxyl radicals which are generated by the Fenton reagents after
entering the clay interlayer subaqueous phase.
Degradation of PNP in clay slurry by AFT
Degradation of PNP in purified Swy-2 slurry by AFT was investigated. A 0.50 g
sample of purified Swy-2 clay was used to prepare the 100 mL PNP slurry, and two
types of electrolytes, 0.02 M KCl and NaCl, were added. Two slurry pHs, neutral
(unadjusted) pH and adjusted low pH, were studied for both electrolytes. The AFT
degradation results are illustrated in Fig. 4.6. The degradation data were fitted with the
slurry AFT model with good fitting (R2>0.98). Based on the results, PNP was
completed removed from the slurry within 15 minutes under all conditions. When pH
was adjusted to 3.2, PNP degradation rates increased in both KCl and NaCl Swy-2
slurry. It is interesting to note that the degradation rate in KCl clay slurry is faster than
that in NaCl slurry, though the PNP adsorption in KCl clay slurry is higher, as shown
in Fig. 4.3.
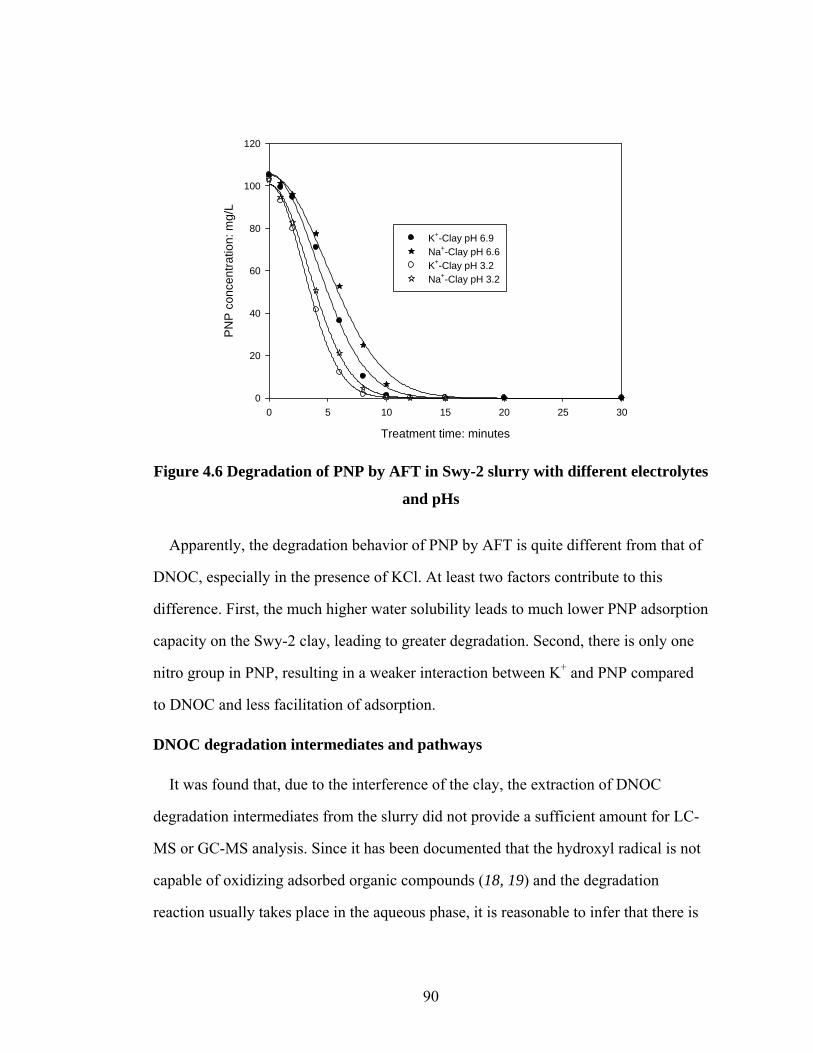
90
Treatment time: minutes
0 5 10 15 20 25 30
PN
P c
once
ntra
tion:
mg/
L
0
20
40
60
80
100
120
K+-Clay pH 6.9Na+-Clay pH 6.6K+-Clay pH 3.2Na+-Clay pH 3.2
Figure 4.6 Degradation of PNP by AFT in Swy-2 slurry with different electrolytes
and pHs
Apparently, the degradation behavior of PNP by AFT is quite different from that of
DNOC, especially in the presence of KCl. At least two factors contribute to this
difference. First, the much higher water solubility leads to much lower PNP adsorption
capacity on the Swy-2 clay, leading to greater degradation. Second, there is only one
nitro group in PNP, resulting in a weaker interaction between K+ and PNP compared
to DNOC and less facilitation of adsorption.
DNOC degradation intermediates and pathways
It was found that, due to the interference of the clay, the extraction of DNOC
degradation intermediates from the slurry did not provide a sufficient amount for LC-
MS or GC-MS analysis. Since it has been documented that the hydroxyl radical is not
capable of oxidizing adsorbed organic compounds (18, 19) and the degradation
reaction usually takes place in the aqueous phase, it is reasonable to infer that there is
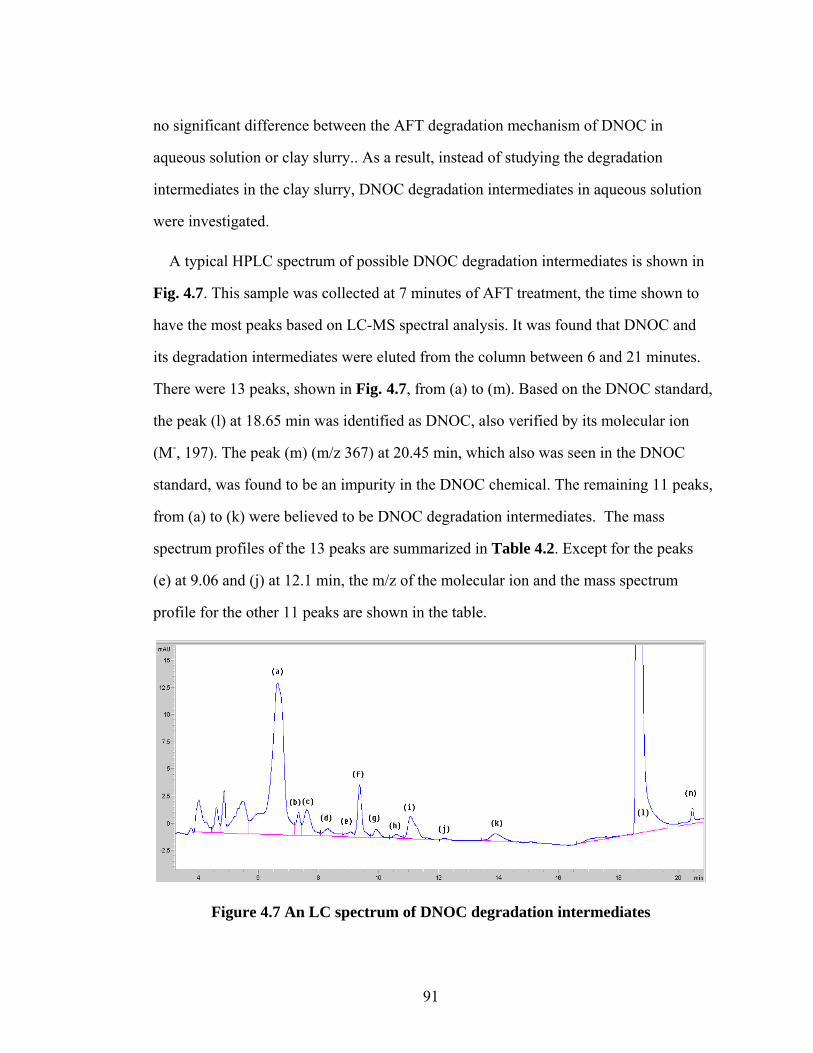
91
no significant difference between the AFT degradation mechanism of DNOC in
aqueous solution or clay slurry.. As a result, instead of studying the degradation
intermediates in the clay slurry, DNOC degradation intermediates in aqueous solution
were investigated.
A typical HPLC spectrum of possible DNOC degradation intermediates is shown in
Fig. 4.7. This sample was collected at 7 minutes of AFT treatment, the time shown to
have the most peaks based on LC-MS spectral analysis. It was found that DNOC and
its degradation intermediates were eluted from the column between 6 and 21 minutes.
There were 13 peaks, shown in Fig. 4.7, from (a) to (m). Based on the DNOC standard,
the peak (l) at 18.65 min was identified as DNOC, also verified by its molecular ion
(M-, 197). The peak (m) (m/z 367) at 20.45 min, which also was seen in the DNOC
standard, was found to be an impurity in the DNOC chemical. The remaining 11 peaks,
from (a) to (k) were believed to be DNOC degradation intermediates. The mass
spectrum profiles of the 13 peaks are summarized in Table 4.2. Except for the peaks
(e) at 9.06 and (j) at 12.1 min, the m/z of the molecular ion and the mass spectrum
profile for the other 11 peaks are shown in the table.
Figure 4.7 An LC spectrum of DNOC degradation intermediates

92
Table 4.2 Mass spectrum profiles of peaks for DNOC degradation intermediates
Peak Retention time,
min
Molecular ion
(M-) m/z
Mass spectrum profile
a 6.62 231 231, 212.9, 182.9, 167.1,
153.1
b 7.32 229 229
c 7.59 245 245.1, 212.9
d 8.28 243 243.1
e 9.06 ND ND
f 9.35 213 213.0
g 9.91 260 260.0, 197.0
h 10.57 260 260.0, 197.0
i 11.05 211 210.9, 183
j 12.1 ND ND
k 13.88 227 226.9, 183
l 18.65 197 197, 183 (DNOC)
m 20.45 367 367 (impurity in DNOC)
It is well known that hydroxyl radical reacts with organic compounds, principally
by abstracting H from C-H, N-H, or O-H bonds, adding to C=C bonds, or adding to
aromatic rings (20). It is believed that Fenton-type oxidation of aromatics mainly
occurs with initial formation of a hydroxycyclohexadienyl radical through hydroxyl
radical addition, which may be oxidized to a phenol by Fe(III) or undergo a
dehydration to a radical cation (21-23). It was found that direct side-chain hydrogen
abstraction by the hydroxyl radical is only a minor reaction path with a much slower
reaction rate for toluene (21). For the DNOC molecule, there are two available sites
for hydroxyl radical attack on the ring and one on the side-chain methyl group.
However, due to the strong electron withdrawing effect of the two nitro groups, the

93
electron density at the two possible attack sites on the ring is decreased, which could
depress their reaction rates with strong electrophilic hydroxyl radicals. On the other
hand, the side chain reaction rate could be increased. In the AFT system, hydroxyl
radicals are generated by freshly delivered ferrous ion (through the electrode reaction:
Fe Fe2+ + 2e) and hydrogen peroxide. Although the delivery of Fenton reagents is
different from other Fenton treatment methods, the basic reaction mechanism between
hydroxyl radicals and organic molecules is the same for all Fenton methods. Thus, in
AFT system, the general reaction mechanisms between hydroxyl radicals and
aromatics should apply.
The m/z of the DNOC molecule is 197. One hydroxyl radical addition to the
molecule would produce molecules with an m/z of 213. It was found that the m/z of
the molecular ion for peak (f) at a retention time of 9.35 min is 213. There are 3
possible products corresponding to an m/z of 213, side-chain reaction product 2-
hydroxy-3,5-dinitro-benzyl alcohol, and benzene ring hydroxyl radical addition
products 6-methyl-2,4-dinitro-1,5-dihydroxybenzene and 6-methyl-2,4-dinitro-1,3-
dihydroxybenzene. We believe that peak f corresponds to benzene ring hydroxyl
radical addition products, in accordance with the main reaction scheme mentioned
above. A small amount of side-chain reaction product 2-hydroxy-3,5-dinitro-benzyl
alcohol is believed to be further oxidized quickly to 2-hydroxy-3,5-dinitro-
benzaldehyde, which corresponds to the peak (i) at 11.05 minutes with an m/z of 211.
Product (i) can be further oxidized to 2-hydroxy-3,5-dinitro-benzoic acid with an m/z
of 227, corresponding to peak (k) at 13.88 minutes. The mass spectrum of peak (k)
confirms this assignment: in the spectrum profile, the m/z difference between the
molecular ion and the next ion species (m/z 183) is 44, which is the molecular weight
of CO2. Moreover, this reaction route is also confirmed by the increase of peak (k) and
decrease of peak (i) with an increase in AFT treatment time as shown in Fig. 4.8.
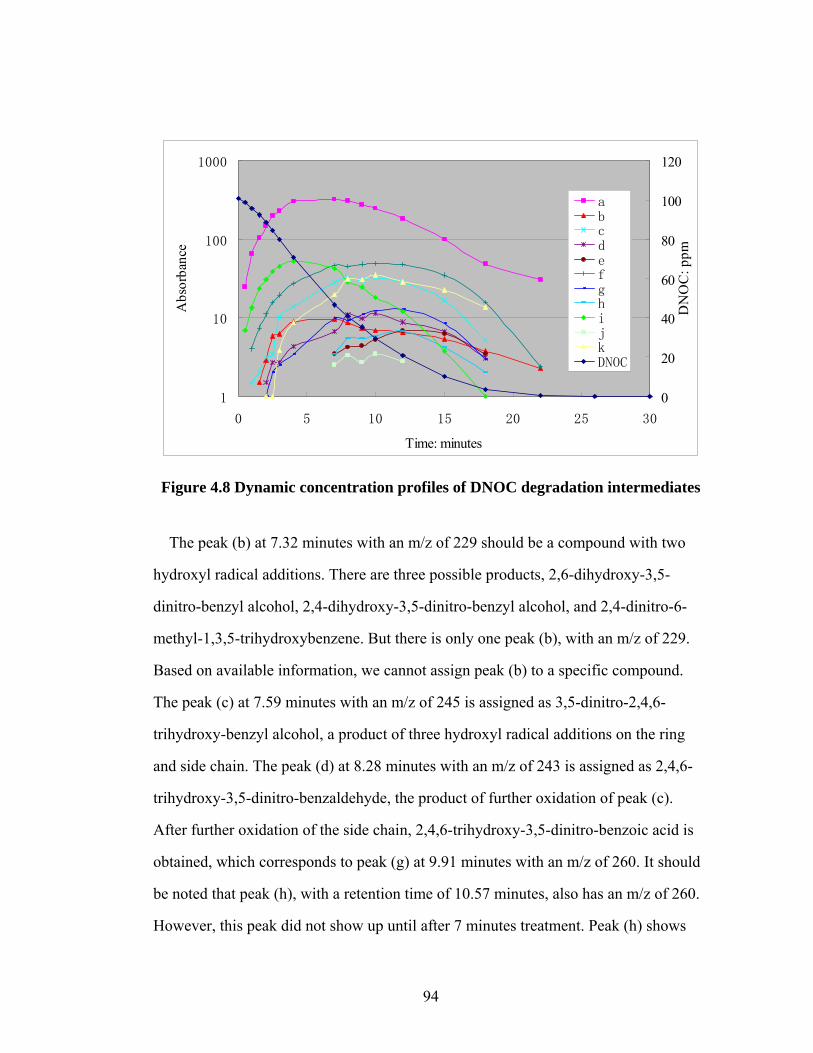
94
1
10
100
1000
0 5 10 15 20 25 30
Time: minutes
Abs
orba
nce
0
20
40
60
80
100
120
DN
OC
: ppm
abcdefghijkDNOC
Figure 4.8 Dynamic concentration profiles of DNOC degradation intermediates
The peak (b) at 7.32 minutes with an m/z of 229 should be a compound with two
hydroxyl radical additions. There are three possible products, 2,6-dihydroxy-3,5-
dinitro-benzyl alcohol, 2,4-dihydroxy-3,5-dinitro-benzyl alcohol, and 2,4-dinitro-6-
methyl-1,3,5-trihydroxybenzene. But there is only one peak (b), with an m/z of 229.
Based on available information, we cannot assign peak (b) to a specific compound.
The peak (c) at 7.59 minutes with an m/z of 245 is assigned as 3,5-dinitro-2,4,6-
trihydroxy-benzyl alcohol, a product of three hydroxyl radical additions on the ring
and side chain. The peak (d) at 8.28 minutes with an m/z of 243 is assigned as 2,4,6-
trihydroxy-3,5-dinitro-benzaldehyde, the product of further oxidation of peak (c).
After further oxidation of the side chain, 2,4,6-trihydroxy-3,5-dinitro-benzoic acid is
obtained, which corresponds to peak (g) at 9.91 minutes with an m/z of 260. It should
be noted that peak (h), with a retention time of 10.57 minutes, also has an m/z of 260.
However, this peak did not show up until after 7 minutes treatment. Peak (h) shows
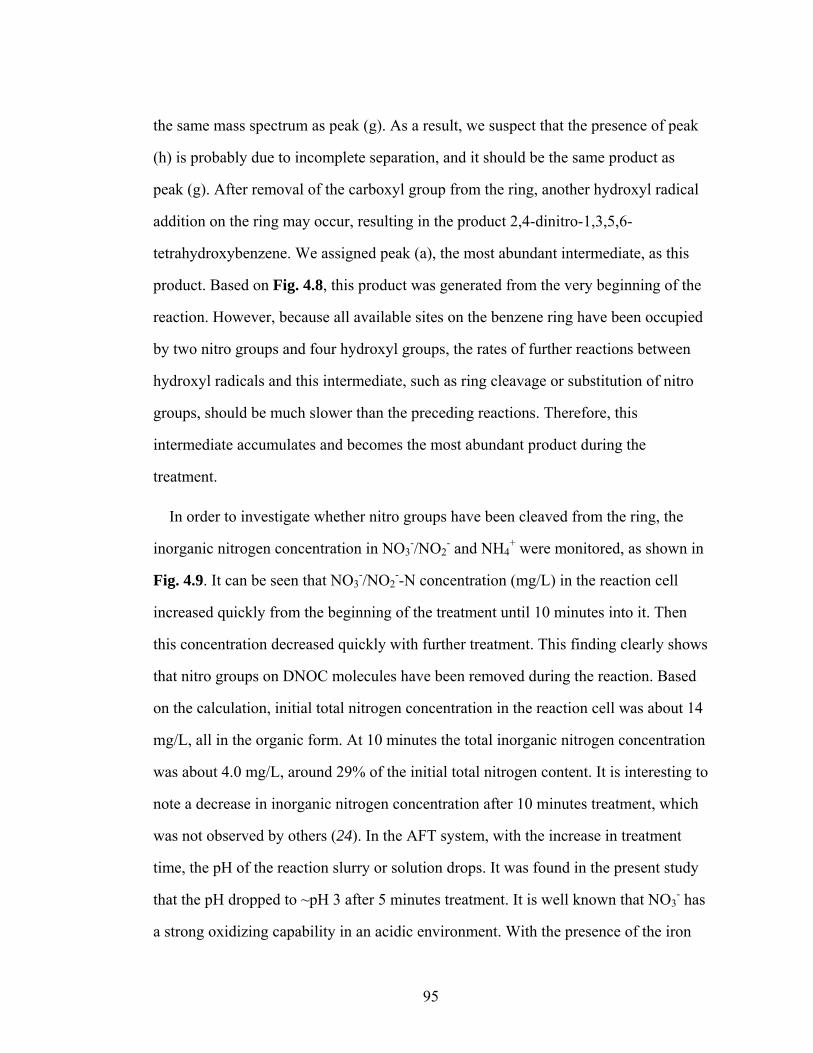
95
the same mass spectrum as peak (g). As a result, we suspect that the presence of peak
(h) is probably due to incomplete separation, and it should be the same product as
peak (g). After removal of the carboxyl group from the ring, another hydroxyl radical
addition on the ring may occur, resulting in the product 2,4-dinitro-1,3,5,6-
tetrahydroxybenzene. We assigned peak (a), the most abundant intermediate, as this
product. Based on Fig. 4.8, this product was generated from the very beginning of the
reaction. However, because all available sites on the benzene ring have been occupied
by two nitro groups and four hydroxyl groups, the rates of further reactions between
hydroxyl radicals and this intermediate, such as ring cleavage or substitution of nitro
groups, should be much slower than the preceding reactions. Therefore, this
intermediate accumulates and becomes the most abundant product during the
treatment.
In order to investigate whether nitro groups have been cleaved from the ring, the
inorganic nitrogen concentration in NO3-/NO2
- and NH4+ were monitored, as shown in
Fig. 4.9. It can be seen that NO3-/NO2
--N concentration (mg/L) in the reaction cell
increased quickly from the beginning of the treatment until 10 minutes into it. Then
this concentration decreased quickly with further treatment. This finding clearly shows
that nitro groups on DNOC molecules have been removed during the reaction. Based
on the calculation, initial total nitrogen concentration in the reaction cell was about 14
mg/L, all in the organic form. At 10 minutes the total inorganic nitrogen concentration
was about 4.0 mg/L, around 29% of the initial total nitrogen content. It is interesting to
note a decrease in inorganic nitrogen concentration after 10 minutes treatment, which
was not observed by others (24). In the AFT system, with the increase in treatment
time, the pH of the reaction slurry or solution drops. It was found in the present study
that the pH dropped to ~pH 3 after 5 minutes treatment. It is well known that NO3- has
a strong oxidizing capability in an acidic environment. With the presence of the iron
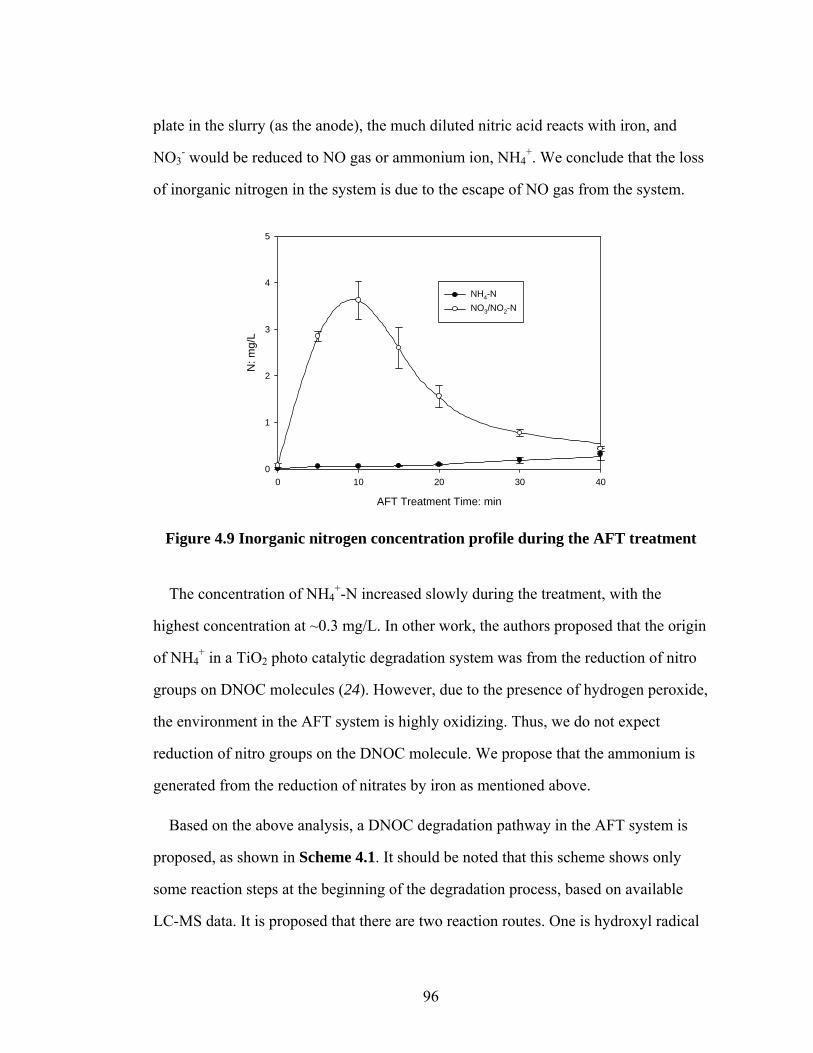
96
plate in the slurry (as the anode), the much diluted nitric acid reacts with iron, and
NO3- would be reduced to NO gas or ammonium ion, NH4
+. We conclude that the loss
of inorganic nitrogen in the system is due to the escape of NO gas from the system.
AFT Treatment Time: min
0 10 20 30 40
N: m
g/L
0
1
2
3
4
5
NH4-NNO3/NO2-N
Figure 4.9 Inorganic nitrogen concentration profile during the AFT treatment
The concentration of NH4+-N increased slowly during the treatment, with the
highest concentration at ~0.3 mg/L. In other work, the authors proposed that the origin
of NH4+ in a TiO2 photo catalytic degradation system was from the reduction of nitro
groups on DNOC molecules (24). However, due to the presence of hydrogen peroxide,
the environment in the AFT system is highly oxidizing. Thus, we do not expect
reduction of nitro groups on the DNOC molecule. We propose that the ammonium is
generated from the reduction of nitrates by iron as mentioned above.
Based on the above analysis, a DNOC degradation pathway in the AFT system is
proposed, as shown in Scheme 4.1. It should be noted that this scheme shows only
some reaction steps at the beginning of the degradation process, based on available
LC-MS data. It is proposed that there are two reaction routes. One is hydroxyl radical
97
reaction with the side-chain methyl group. First, one hydrogen is abstracted from the
methyl group by the hydroxyl radical, producing an organic radical. In the presence of
oxygen in the aqueous solution, this radical will react with oxygen, producing peroxyl
radicals or oxyl radicals as shown in the Scheme 1. These radicals may then react with
ferrous ions in the solution, with the production of alcohol. In this oxidizing
environment, the alcohol can be further oxidized to aldehyde and carboxylic acid. The
other reaction route is hydroxyl radical addition on the benzene ring, producing an
important intermediate product, 2,4-dinitro-1,3,5,6-tetrahydroxybenzene (m/z 231). As
shown in Scheme 1, a hydroxycyclohexadienyl radical is formed after the addition of
one hydroxyl radical. In the presence of oxygen and ferric ion, phenolic products are
generated quickly from the radical; meanwhile the radical could also react with ferrous
ion at a much lower rate and reform the parent compound. With the releasing of
carbon dioxide, after the carboxylic group is cleaved from the ring, 2,4-dinitro-1,3,5,6-
tetrahydroxybenzene is generated. Since there is no site on the benzene ring available
for hydroxyl radical addition or oxidation, this product is relatively stable and its
accumulative concentration is high. Based on the nitrogen measurement, nitro groups
on the benzene ring have been removed, either due to hydroxyl radical substitution or
benzene ring cleavage. Unfortunately, no ring cleavage product has been detected
under our analysis conditions.

.
Sche
me
4.1
Prop
osed
DN
OC
deg
rada
tion
path
way
s
98
99
4.4 Conclusions
The adsorption and degradation of two nitro aromatic compounds, DNOC and PNP
in Swy-2 clay slurry were investigated. It was found that the adsorption behavior of
DNOC directly relates to the types of electrolytes and slurry acidity. In the presence of
KCl or NH4Cl, DNOC has a strong affinity to the clay due to complex formation
between these cations and DNOC molecules; however, in the presence of NaCl or
CaCl2, the adsorption capacity was much less. It was also found that DNOC
adsorption is favored in an acidic environment, and at given experimental conditions,
DNOC molecules can be completely adsorbed on the clay surface at pH values below
the pKa (pH 4.4). It was inferred that adsorbed DNOC forms a monolayer at the clay
interlayer based on XRD analysis. PNP adsorption was also favored in the presence of
KCl compared with NaCl.
Through AFT experiments, we conclude that DNOC and PNP can be removed from
the clay interlayer, though the degradation rate decreased with an increase of slurry
acidity. This result offers an important implication for remediating NAC contaminated
soils: choosing appropriate pH is critical to achieve the remediation goal. Based on the
LC-MS data, 9 possible degradation intermediates have been detected and assigned,
and a possible degradation pathway has been proposed. Based on the nitrogen
measurement, we conclude that nitro groups have been removed from the benzene
rings and DNOC molecules have been mineralized during the AFT process.
100
REFERENCES
1. Spain, J. C., Biodegradation of Nitroaromatic Compounds. Annual Review of Microbiology 1995, 49, (1), 523-555.
2. Sparks, D. L., Environmental soil chemistry. 2nd ed.; Academic Press: San Diego, CA, 2003; p 111.
3. Chiou, C. T.; Peters, L. J.; Freed, V. H., A Physical Concept of Soil-Water Equilibria for Nonionic Organic Compounds. Science 1979, 206, (4420), 831-832.
4. Chiou, C. T.; Porter, P. E.; Schmedding, D. W., Partition equilibriums of nonionic organic compounds between soil organic matter and water. Environ. Sci. Technol. 1983, 17, (4), 227-231.
5. Boyd, S. A.; Sheng, G.; Teppen, B. J.; Johnston, C. T., Mechanisms for the Adsorption of Substituted Nitrobenzenes by Smectite Clays. Environ. Sci. Technol. 2001, 35, (21), 4227-4234.
6. Johnston, C. T.; de Oliveira, M. F.; Teppen, B. J.; Sheng, G.; Boyd, S. A., Spectroscopic Study of Nitroaromatic-Smectite Sorption Mechanisms. Environ. Sci. Technol. 2001, 35, (24), 4767-4772.
7. Sheng, G.; Johnston, C. T.; Teppen, B. J.; Boyd, S. A., Adsorption of dinitrophenol herbcides from water by montmorillonites. Clays and Clay Minerals 2002, 50, 25-34.
8. Johnston, C. T.; Boyd, S. A.; Teppen, B. J.; Sheng, G., Sorption of nitroaromatic compounds on clay surfaces. In Handbook of Layered Materials, Auerbach, S. M.; Carrado, K. A.; Dutta, P. K., Eds. Marcel Dekker, Inc.: New York, 2004; pp 155-190.
9. Ye, P.; Lemley, A. T., Adsorption effect on the degradation of carbaryl, mecoprop and paraquat by AFT in an Swy-2 montmorillonite clay slurry. J. Agri. Food Chem. 2008, 56, (21), 10200-10207.
10. Arroyo, L. J.; Li, H.; Teppen, B. J.; Johnston, C. T.; Boyd, S. A., Hydrolysis of Carbaryl by Carbonate Impurities in Reference Clay SWy-2. J. Agric. Food Chem. 2004, 52, (26), 8066-8073.
11. Weaver, M. J.; Liu, H. Y.; Kim, Y., The role of the supporting electrolyte cation in the kinetics of outer-sphere electrochemical redox processes involving metal complexes. Can. J. Chem. 1981, 59, 1944-1953.
12. Hermosin, M. C.; Martin, P.; Cornejo, J., Adsorption mechanisms of monobutyltin in clay minerals. Environ. Sci. Technol. 1993, 27, (12), 2606-2611.
101
13. CambridgeSoft ChemBioOffice Ultra 2008, 2008.
14. Pereira, T. R.; Laird, D. A.; Johnston, C. T.; Teppen, B. J.; Li, H.; Boyd, S. A., Mechanism of Dinitrophenol Herbicide Sorption by Smectites in Aqueous Suspensions at Varying pH. Soil Sci Soc Am J 2007, 71, (5), 1476-1481.
15. Ye, P.; Kong, L.; Lemley, A. T., Kinetics of Carbaryl Degradation by Anodic Fenton Treatment in a Humic Acid Amended Artificial Soil Slurry. Water Environ. Res. 2008, In Press.
16. Teppen, B. J.; Yu, C.-H.; Miller, D. M.; Schaer, L., Molecular dynamics simulations of sorption of organic compounds at the clay mineral/aqueous solution interface. Journal of Computational Chemistry 1998, 19, (2), 144-153.
17. Yu, C.-H.; Newton, S.; Norman, M.; Schäfer, L.; Miller, D., Molecular Dynamics Simulations of Adsorption of Organic Compounds at the Clay Mineral/Aqueous Solution Interface. Structural Chemistry 2003, 14, (2), 175-185.
18. Watts, R. J.; Bottenberg, B. C.; Hess, T. F.; Jensen, M. D.; Teel, A. L., Role of reductants in the enhanced desorption and transformation of chloroaliphatic compounds by modified Fenton's reactions. Environ. Sci. Technol. 1999, 33, (19), 3432-3437.
19. Sedlak, D. L.; Andren, A. W., Aqueous-phase oxidation of polychlorinated biphenyls by hydroxyl radicals. Environ. Sci. Technol 1991, 25, 1419-1427.
20. Pignatello, J. J.; Oliveros, E.; MacKay, A., Advanced Oxidation Processes for Organic Contaminant Destruction Based on the Fenton Reaction and Related Chemistry. Critical Reviews in Environmental Science and Technology 2006, 36, (1), 1-84.
21. Walling, C.; Johnson, R. A., Fenton's reagent. V. Hydroxylation and side-chain cleavage of aromatics. J. Am. Chem. Soc. 1975, 97, (2), 363-367.
22. Walling, C., Intermediates in the Reactions of Fenton Type Reagents. Accounts of Chemical Research 1998, 31, (4), 155-157.
23. Walling, C., Fenton's reagent revisited. Accounts Chem. Res. 1975, 8, (4), 125-131.
24. Fabbri, D.; Villata, L. S.; Prevot, A. B.; Capparelli, A. L.; Pramauro, E., Photocatalytic degradation of DNOC in aqueous TiO2 dispersions: Investigation of the initial reaction steps. Journal of Photochemistry and Photobiology A: Chemistry 2006, 180, (1-2), 157.
102
Chapter 5
Effect of Goethite on the Degradation of Dinoseb by AFT
5.1 Introduction
The Fenton reaction based oxidation treatment method, one of the most often used
advanced oxidation processes, has been widely studied as a method to remove organic
pollutants in both water and soil slurry systems. Fenton-based membrane anodic
Fenton treatment (AFT), developed in our laboratory (1), employs ferrous ion freshly
generated by the electrochemical reaction (Fe Fe2++2e) and hydrogen peroxide
pumped continuously into the reactor.
In previous studies (2, 3) the effect of humic acid and clays, including kaolinite and
montmorillonite clay, on the AFT degradation of selected organic agrochemicals in
slurry systems was measured. It was found that both the degradation rate and
efficiency were negatively affected by the adsorption or pH buffering of humic acid or
clay, and a kinetic model was developed to describe the degradation in a slurry system.
In addition to clays, it is believed that other soil minerals, such as iron oxides, also
affect the AFT degradation of organic pollutants because of their reaction with
hydrogen peroxide and their potential adsorption capacity. Watts et al. (4, 5) found
that iron minerals could be used to remove organic contaminants from soil in the
presence of hydrogen peroxide. Lin et al. (6) explored the reaction mechanism
between goethite and hydrogen peroxide. They proposed that goethite acts as a
catalyst in the decomposition of hydrogen peroxide; a simplified reaction mechanism
was summarized as following:
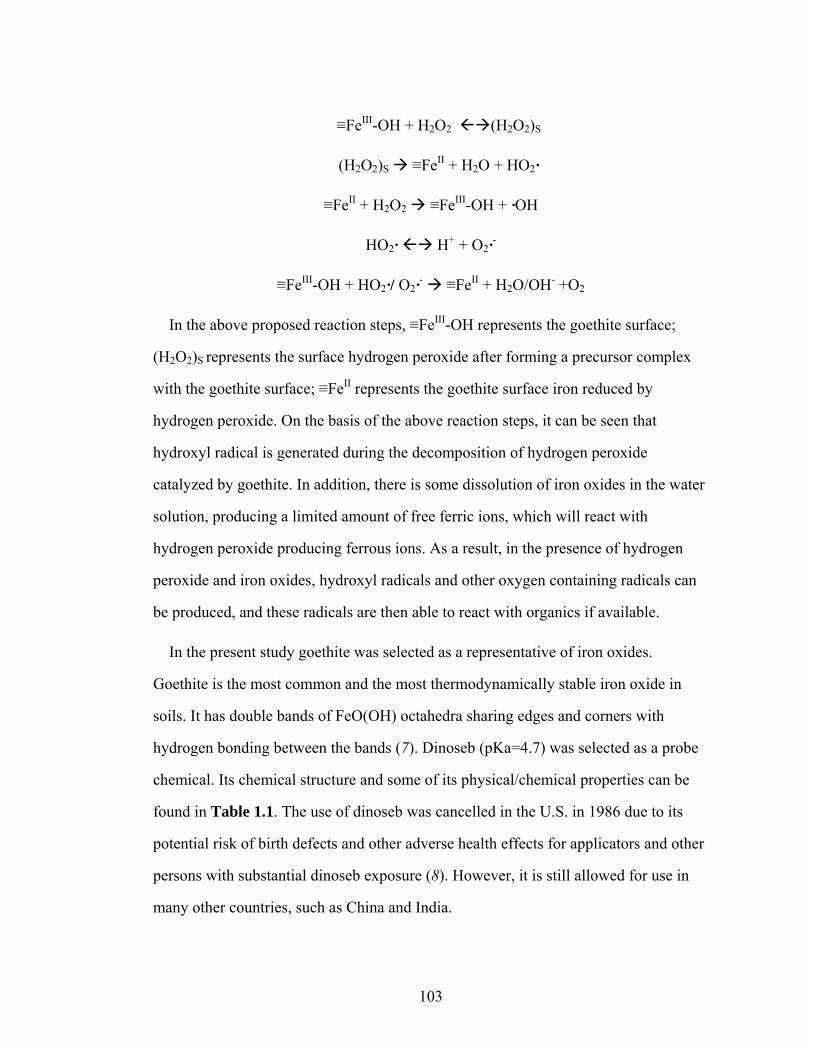
103
≡FeIII-OH + H2O2 (H2O2)S
(H2O2)S ≡FeII + H2O + HO2·
≡FeII + H2O2 ≡FeIII-OH + ·OH
HO2· H+ + O2·-
≡FeIII-OH + HO2·/ O2·- ≡FeII + H2O/OH- +O2
In the above proposed reaction steps, ≡FeIII-OH represents the goethite surface;
(H2O2)S represents the surface hydrogen peroxide after forming a precursor complex
with the goethite surface; ≡FeII represents the goethite surface iron reduced by
hydrogen peroxide. On the basis of the above reaction steps, it can be seen that
hydroxyl radical is generated during the decomposition of hydrogen peroxide
catalyzed by goethite. In addition, there is some dissolution of iron oxides in the water
solution, producing a limited amount of free ferric ions, which will react with
hydrogen peroxide producing ferrous ions. As a result, in the presence of hydrogen
peroxide and iron oxides, hydroxyl radicals and other oxygen containing radicals can
be produced, and these radicals are then able to react with organics if available.
In the present study goethite was selected as a representative of iron oxides.
Goethite is the most common and the most thermodynamically stable iron oxide in
soils. It has double bands of FeO(OH) octahedra sharing edges and corners with
hydrogen bonding between the bands (7). Dinoseb (pKa=4.7) was selected as a probe
chemical. Its chemical structure and some of its physical/chemical properties can be
found in Table 1.1. The use of dinoseb was cancelled in the U.S. in 1986 due to its
potential risk of birth defects and other adverse health effects for applicators and other
persons with substantial dinoseb exposure (8). However, it is still allowed for use in
many other countries, such as China and India.
104
The objectives of this study are: (1) to investigate the effect of goethite on the AFT
degradation of dinoseb and (2) to investigate the effect of pH and goethite content on
the degradation of dinoseb.
5.2 Materials and Experiments
Chemicals
Granular goethite, dinoseb (99%) and hydrogen peroxide (30%, analytical grade)
were purchased from Sigma-Aldrich (St. Louis, MO). Water and acetonitrile, both
HPLC grade, were purchased from Fisher Scientific (Pittsburgh, PA). Deionized water
(electricity resistant, R≥18.1 MΩ.cm-1) was produced by an MP-1 Mega-PureTM
system (Corning, NY)
Adsorption experiments
Adsorption batch experiments were conducted to obtain adsorption isotherms for
dinoseb in the goethite slurry. Based on a preliminary adsorption kinetics study (data
not shown), the adsorption equilibrium can be attained within 24 hours. 20.0 mg
goethite and 20.0 mL dinoseb solutions were placed in 25 mL glass vials; pH was
adjusted by 0.01 M HCl if needed. After 24 h shaking, a 1.0 mL sample was collected,
and after 20 min-centrifuging at 10,000 rpm, the supernatant was collected for
concentration analysis. The amount of adsorbed dinoseb was calculated based on the
difference in aqueous concentration between the initial time and 24 h.
AFT batch experiments
All experiments were carried out in two 150-mL glass cells; a scheme of the
experimental apparatus is shown in Fig. 1.1. Detailed descriptions of the AFT process
can be found in the literature (2, 3). 100.0 mL of dinoseb and goethite (1.0 g/L) slurry
with 0.02M NaCl was added to the anodic half-cell, and the same volume of 0.08M
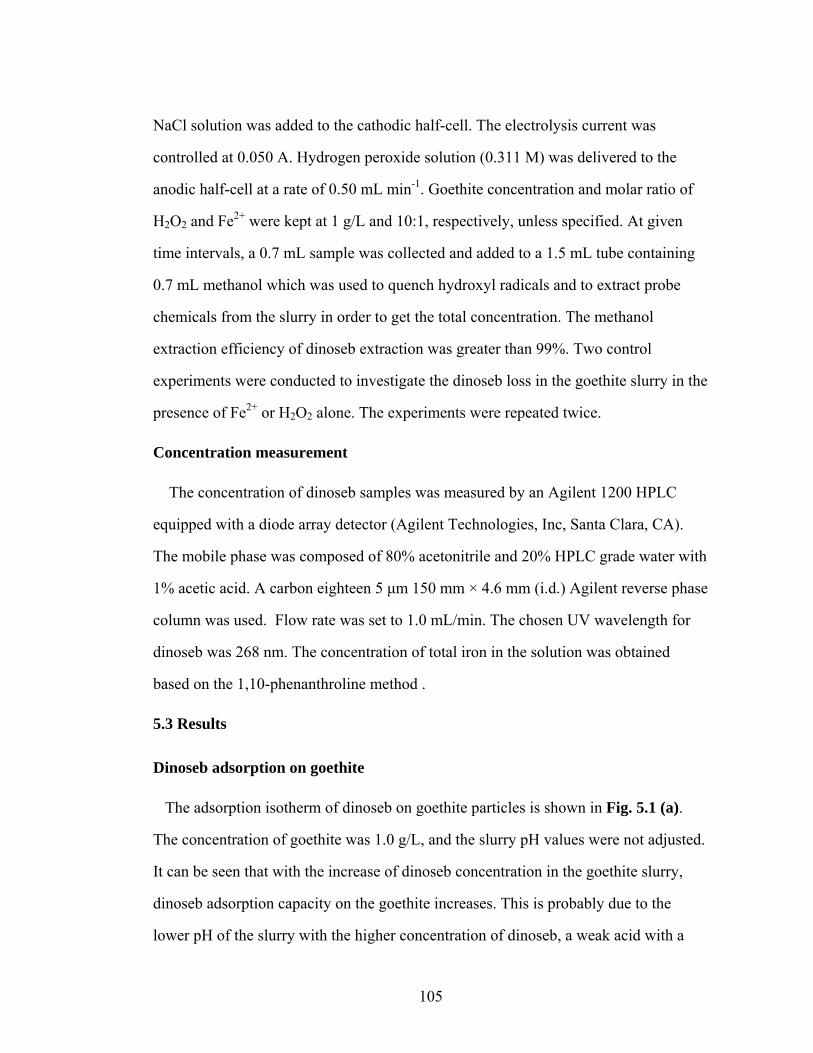
105
NaCl solution was added to the cathodic half-cell. The electrolysis current was
controlled at 0.050 A. Hydrogen peroxide solution (0.311 M) was delivered to the
anodic half-cell at a rate of 0.50 mL min-1. Goethite concentration and molar ratio of
H2O2 and Fe2+ were kept at 1 g/L and 10:1, respectively, unless specified. At given
time intervals, a 0.7 mL sample was collected and added to a 1.5 mL tube containing
0.7 mL methanol which was used to quench hydroxyl radicals and to extract probe
chemicals from the slurry in order to get the total concentration. The methanol
extraction efficiency of dinoseb extraction was greater than 99%. Two control
experiments were conducted to investigate the dinoseb loss in the goethite slurry in the
presence of Fe2+ or H2O2 alone. The experiments were repeated twice.
Concentration measurement
The concentration of dinoseb samples was measured by an Agilent 1200 HPLC
equipped with a diode array detector (Agilent Technologies, Inc, Santa Clara, CA).
The mobile phase was composed of 80% acetonitrile and 20% HPLC grade water with
1% acetic acid. A carbon eighteen 5 μm 150 mm × 4.6 mm (i.d.) Agilent reverse phase
column was used. Flow rate was set to 1.0 mL/min. The chosen UV wavelength for
dinoseb was 268 nm. The concentration of total iron in the solution was obtained
based on the 1,10-phenanthroline method .
5.3 Results
Dinoseb adsorption on goethite
The adsorption isotherm of dinoseb on goethite particles is shown in Fig. 5.1 (a).
The concentration of goethite was 1.0 g/L, and the slurry pH values were not adjusted.
It can be seen that with the increase of dinoseb concentration in the goethite slurry,
dinoseb adsorption capacity on the goethite increases. This is probably due to the
lower pH of the slurry with the higher concentration of dinoseb, a weak acid with a
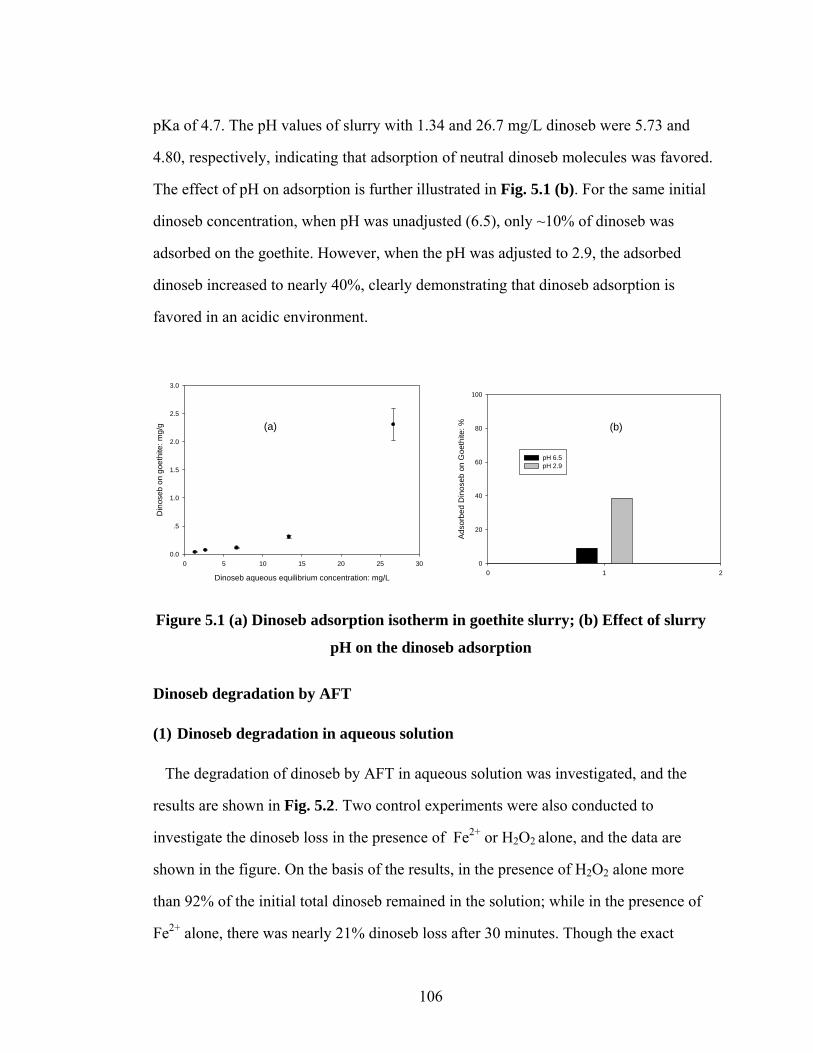
106
pKa of 4.7. The pH values of slurry with 1.34 and 26.7 mg/L dinoseb were 5.73 and
4.80, respectively, indicating that adsorption of neutral dinoseb molecules was favored.
The effect of pH on adsorption is further illustrated in Fig. 5.1 (b). For the same initial
dinoseb concentration, when pH was unadjusted (6.5), only ~10% of dinoseb was
adsorbed on the goethite. However, when the pH was adjusted to 2.9, the adsorbed
dinoseb increased to nearly 40%, clearly demonstrating that dinoseb adsorption is
favored in an acidic environment.
Dinoseb aqueous equilibrium concentration: mg/L
0 5 10 15 20 25 30
Din
oseb
on
goet
hite
: mg/
g
0.0
.5
1.0
1.5
2.0
2.5
3.0
(a)
0 1 2
Adso
rbed
Din
oseb
on
Goe
thite
: %
0
20
40
60
80
100
pH 6.5pH 2.9
(b)
Figure 5.1 (a) Dinoseb adsorption isotherm in goethite slurry; (b) Effect of slurry
pH on the dinoseb adsorption
Dinoseb degradation by AFT
(1) Dinoseb degradation in aqueous solution
The degradation of dinoseb by AFT in aqueous solution was investigated, and the
results are shown in Fig. 5.2. Two control experiments were also conducted to
investigate the dinoseb loss in the presence of Fe2+ or H2O2 alone, and the data are
shown in the figure. On the basis of the results, in the presence of H2O2 alone more
than 92% of the initial total dinoseb remained in the solution; while in the presence of
Fe2+ alone, there was nearly 21% dinoseb loss after 30 minutes. Though the exact

107
cause of dinoseb loss in the presence of Fe2+ was not clear, it could be related to the
generation of ferrous ions which were produced through the electrode reaction. It can
be seen that dinoseb was completely removed by AFT in 5 minutes, clearly
demonstrating the effectiveness of AFT. The degradation curve was well fitted with
the classic AFT model as mentioned in the Chapter 1.
Time: minutes
0 5 10 15 20 25 30
Din
oseb
: ppm
0
5
10
15
20
25
30
Fe2+ onlyH2O2 onlyAFT treatment
Figure 5.2 AFT degradation of dinoseb in aqueous solution
(2) Dinoseb degradation in goethite slurry
Degradation of dinoseb in 1.0 g/L goethite slurry is shown in Fig. 5.3. All initial
slurry pH values were neutral or unadjusted. Two control experiments were also
conducted in the presence of Fe2+ or H2O2 alone. Based on the results, in the presence
of H2O2, more than 93% of initial total dinoseb remained in the slurry; while in the
presence of Fe2+ alone, there was more than 19% dinoseb loss after 30 minutes. This
result is very similar to the result obtained in aqueous solution, clearly indicating that,
under the given experimental conditions, dinoseb loss due to the presence of goethite
is negligible. Similarly, dinoseb in the slurry could be completely degraded in 5
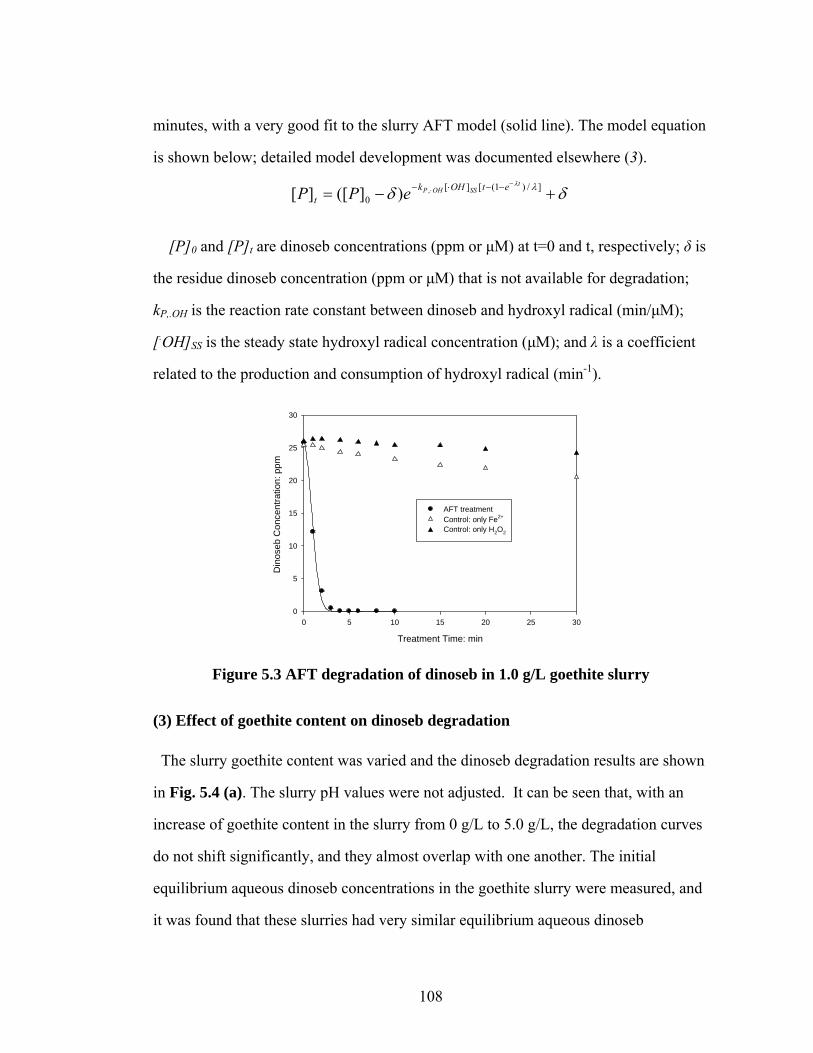
108
minutes, with a very good fit to the slurry AFT model (solid line). The model equation
is shown below; detailed model development was documented elsewhere (3).
δδ λλ
+−=−
⋅ −−⋅− ]/)1([][0
,)]([][t
SSOHP etOHkt ePP
[P]0 and [P]t are dinoseb concentrations (ppm or μM) at t=0 and t, respectively; δ is
the residue dinoseb concentration (ppm or μM) that is not available for degradation;
kP,.OH is the reaction rate constant between dinoseb and hydroxyl radical (min/μM);
[.OH]SS is the steady state hydroxyl radical concentration (μM); and λ is a coefficient
related to the production and consumption of hydroxyl radical (min-1).
Treatment Time: min
0 5 10 15 20 25 30
Din
oseb
Con
cent
ratio
n: p
pm
0
5
10
15
20
25
30
AFT treatmentControl: only Fe2+
Control: only H2O2
Figure 5.3 AFT degradation of dinoseb in 1.0 g/L goethite slurry
(3) Effect of goethite content on dinoseb degradation
The slurry goethite content was varied and the dinoseb degradation results are shown
in Fig. 5.4 (a). The slurry pH values were not adjusted. It can be seen that, with an
increase of goethite content in the slurry from 0 g/L to 5.0 g/L, the degradation curves
do not shift significantly, and they almost overlap with one another. The initial
equilibrium aqueous dinoseb concentrations in the goethite slurry were measured, and
it was found that these slurries had very similar equilibrium aqueous dinoseb
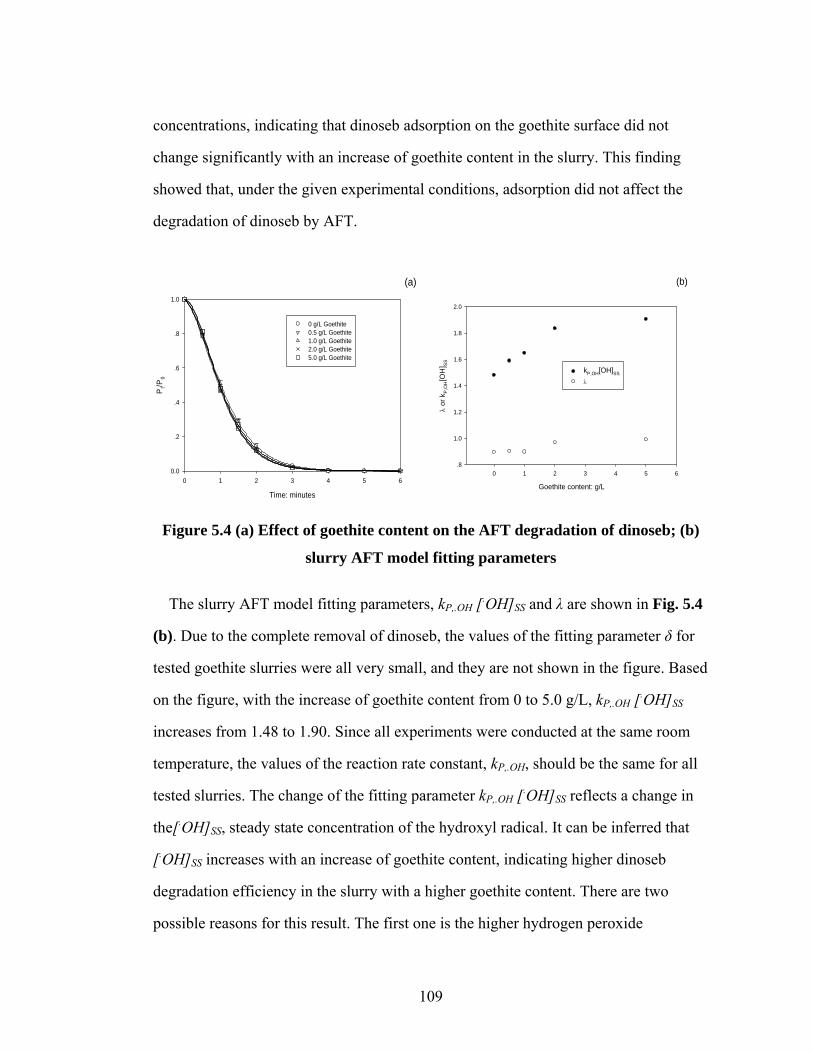
109
concentrations, indicating that dinoseb adsorption on the goethite surface did not
change significantly with an increase of goethite content in the slurry. This finding
showed that, under the given experimental conditions, adsorption did not affect the
degradation of dinoseb by AFT.
Time: minutes
0 1 2 3 4 5 6
P t/P0
0.0
.2
.4
.6
.8
1.0
0 g/L Goethite0.5 g/L Goethite1.0 g/L Goethite2.0 g/L Goethite5.0 g/L Goethite
(a)
Goethite content: g/L
0 1 2 3 4 5 6
λ or
kP,
OH[O
H] SS
.8
1.0
1.2
1.4
1.6
1.8
2.0
kP,OH[OH]SS
λ
(b)
Figure 5.4 (a) Effect of goethite content on the AFT degradation of dinoseb; (b)
slurry AFT model fitting parameters
The slurry AFT model fitting parameters, kP,.OH [.OH]SS and λ are shown in Fig. 5.4
(b). Due to the complete removal of dinoseb, the values of the fitting parameter δ for
tested goethite slurries were all very small, and they are not shown in the figure. Based
on the figure, with the increase of goethite content from 0 to 5.0 g/L, kP,.OH [.OH]SS
increases from 1.48 to 1.90. Since all experiments were conducted at the same room
temperature, the values of the reaction rate constant, kP,.OH, should be the same for all
tested slurries. The change of the fitting parameter kP,.OH [.OH]SS reflects a change in
the[.OH]SS, steady state concentration of the hydroxyl radical. It can be inferred that
[.OH]SS increases with an increase of goethite content, indicating higher dinoseb
degradation efficiency in the slurry with a higher goethite content. There are two
possible reasons for this result. The first one is the higher hydrogen peroxide
110
decomposition rate due to higher content of goethite. Lin et al. (6) found that the
hydrogen peroxide decomposition rate was proportional to the goethite content in a
slurry. As a result, there was more hydroxyl radical produced through the mechanisms
mentioned in the Introduction. Another important reason is related to the soluble iron
concentration in the goethite slurry. Based on the total iron measurements, it was
found that under neutral conditions, there was 0.5-0.6 mg/L soluble iron in the
aqueous phase of 1.0 g/L goethite slurry. This additional soluble iron would be able to
enhance the Fenton reaction in the AFT system, resulting in more generated hydroxyl
radicals. For a higher content of goethite, there should be a higher concentration of
soluble iron species in the slurry. This also explains the increase of [.OH]SS with an
increase of goethite content.
In the slurry AFT model, λ governs the time needed for the hydroxyl radical to
reach the steady state. Based on Fig. 5.4(b), λ increased slightly with an increase of
goethite content in the slurry, indicating less time needed to reach a steady state for the
hydroxyl radical.
(4) Effect of pH on the AFT degradation of dinoseb
The initial goethite slurry was adjusted to pH 2.9, and the effect of pH on the
dinoseb degradation was studied. The results are shown in Fig. 5.5. Two control
experiments on the loss of dinoseb in the presence of H2O2 alone were also conducted
at both high and low pH values. At high pH, dinoseb loss during 30 minutes was ~ 7%.
However, at pH 2.9, the dinoseb loss was ~50%. This 50% loss is believed to be due
mainly to the attack of hydroxyl radicals produced by a Fenton reacton between the
soluble iron species and hydrogen peroxide. The soluble iron concentrations at both
high and low pH were measured and the results are shown in Table 5.1. The soluble
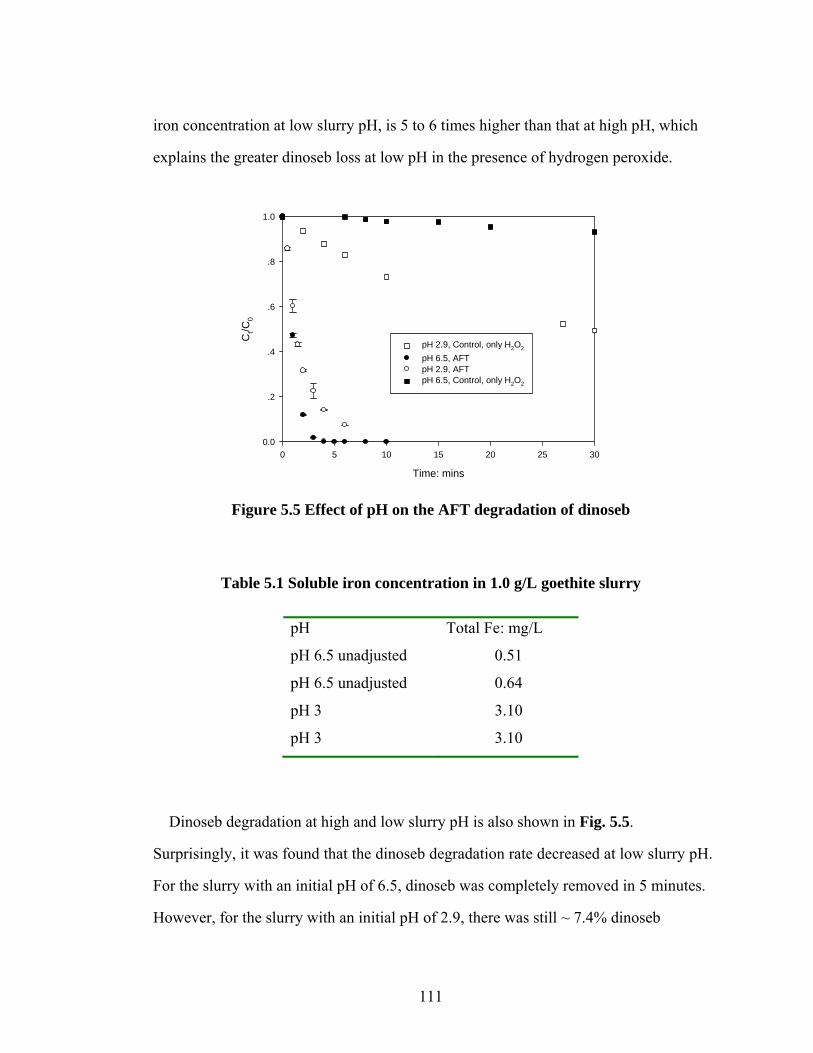
111
iron concentration at low slurry pH, is 5 to 6 times higher than that at high pH, which
explains the greater dinoseb loss at low pH in the presence of hydrogen peroxide.
Time: mins
0 5 10 15 20 25 30
Ct/C
0
0.0
.2
.4
.6
.8
1.0
pH 2.9, Control, only H2O2 pH 6.5, AFTpH 2.9, AFTpH 6.5, Control, only H2O2
Figure 5.5 Effect of pH on the AFT degradation of dinoseb
Table 5.1 Soluble iron concentration in 1.0 g/L goethite slurry
Dinoseb degradation at high and low slurry pH is also shown in Fig. 5.5.
Surprisingly, it was found that the dinoseb degradation rate decreased at low slurry pH.
For the slurry with an initial pH of 6.5, dinoseb was completely removed in 5 minutes.
However, for the slurry with an initial pH of 2.9, there was still ~ 7.4% dinoseb
pH Total Fe: mg/L
pH 6.5 unadjusted 0.51
pH 6.5 unadjusted 0.64
pH 3 3.10
pH 3 3.10
112
remaining in the slurry after 6 minutes of AFT treatment. This result was opposite
from our previous research results for synthetic soil or montmorillonite clay slurries,
where it was found that the degradation of carbaryl and mecoprop was enhanced by
decreasing the slurry pH values (2, 3). However, this result was in accordance with our
previous research results for the degradation of 4,6-o-dinitrocresol in montmorillonite
clay slurry. Similarly, it was believed that the cause for the lower degradation rate was
due to the greater adsorption at the lower pH. As discussed in the adsorption
experimental results, with the adjustment of pH from 6.5 to 2.9, sorbed dinoseb on
goethite particles increased significantly from 10% to 40%, which slowed the
degradation that took place mainly in the aqueous phase of the slurry.
In this study the effect of goethite on the AFT degradation of dinoseb was
investigated. It was found that pH plays an important role in the adsorption and
degradation processes. At neutral or high pH, there was less dinoseb adsorption on
goethite, and the AFT degradation process was not significantly affected under the
given experimental conditions. In an acidic or low pH environment, there was much
greater dinoseb adsorption on goethite than at higher pH, and the AFT degradation
process was inhibited by the adsorption, though there was more soluble iron
originating from the goethite that could enhance the degradation. Through model
fitting parameter analysis, it was found that a higher goethite content could increase
the degradation efficiency due to more soluble iron species in the slurry. It was also
found that goethite itself could remove 50% of dinoseb in the presence of hydrogen
peroxide in 30 minutes in an acidic environment, providing important implications for
the application of hydrogen peroxide in iron rich soil remediation.
113
REFERENCES
1. Wang, Q.-Q.; Lemley, A. T., Kinetic model and optimization of 2,4-D degradation by Anodic Fenton treatment. Environ. Sci. Technol 2001, 35, 4509-4514.
2. Ye, P.; Lemley, A. T., Adsorption effect on the degradation of carbaryl, mecoprop and paraquat by AFT in an Swy-2 montmorillonite clay slurry. J. Agri. Food Chem. 2008, In Press.
3. Ye, P.; Kong, L.; Lemley, A. T., Kinetics of Carbaryl Degradation by Anodic Fenton Treatment in a Humic Acid Amended Artificial Soil Slurry. Water Environ. Res. 2008, In Press.
4. Watts, R. J.; Udell, M. D.; Monsen, R. M., Use of iron minerals in optimizing the peroxide treatment of contaminated soils. Water Environ. Res. 1993, 65, (7), 839-844.
5. Watts, R. J.; Kong, S.; Dippre, M.; Barnes, W. T., Oxidation of sorbed hexachlorobenzene in soils using catalyzed hydrogen peroxide. J. Hazard. Mater. 1994, 39, (1), 33-47.
6. Lin, S. S.; Gurol, M. D., Catalytic Decomposition of Hydrogen Peroxide on Iron Oxide: Kinetics, Mechanism, and Implications. Environ. Sci. Technol. 1998, 32, (10), 1417-1423.
7. Sparks, D. L., Environmental soil chemistry. 2nd ed.; Academic Press: San Diego, CA, 2003.
8. Extension Toxicology Network-Pesticide Information Profiles. http://extoxnet.orst.edu/pips/dinoseb.htm

114
Chapter 6
Conclusions
This thesis investigated the application of anodic Fenton treatment to the
degradation of several probe agrochemicals in model soil slurry systems. A kinetic
model, called the slurry AFT model, was developed to describe the degradation
process in the slurry system. Effects of different model soil components, such as
humic acid, kaolin or montmorillonite clay, and goethite, on the degradation of
different groups of agrochemicals, including carbaryl, mecoprop, paraquat,
4.6-o-dinitrocresol, p-nitrophenol and dinoseb were studied. The main results and
conclusions are summarized in the following sections. The environmental implications
of this study and directions for future research aere also discussed at the end of this
chapter.
6.1 Summary of the main results
In Chapter 2, a synthetic soil, which is a mixture of humic acid, sand and kaolinite
clay, was used in the slurry system. AFT degradation of a widely used pesticide,
carbaryl, in the synthetic soil slurry was investigated, and the following primary
results were obtained.
(1) An empirical slurry AFT model was developed to describe the organic
chemical degradation process in the slurry system. Three important
assumptions were made during the kinetic model development process. One
was the steady state approximation for hydroxyl radical, and the second one
was the assumption that the degradation reaction between hydroxyl radical
and target organic chemical took place in the aqueous phase of the slurry. The
115
third assumption is the definition of a loosely defined constant that relates to
the strongly adsorbed or non-labile pesticide that is not available for
degradation within the time frame of AFT treatment. The model equation had
a very good fit with the experimental data.
(2) The effect of humic acid content, initial slurry pH, initial carbaryl
concentration, Fenton reagent delivery ratio, and soil/water ratio (w/v) on the
degradation rate was also investigated. It was found that: with an increase of
0 to 2.5% humic acid content in the artificial soil, the carbaryl degradation
rate slowed down greatly; when the initial slurry pH was adjusted to a lower
value, the carbaryl degradation rate increased compared to that in slurries
with an unadjusted initial pH of 5.5; the initial carbaryl concentration did not
affect the degradation rate, but the slurry with higher initial carbaryl
concentration had a higher carbaryl residual concentration; under the given
experimental conditions, a 2:1 H2O2/Fe2+ ratio was preferred from the
perspective of cost effectiveness; and the degradation rate decreases
significantly in a slurry with a lower soil/water (w/v) ratio.
(3) The experimental data were fitted with the model equation, and all three
fitting parameters, SSOHP OHk ][, ⋅⋅ , λ , and δ (or 0/ Pδ for the normalized
model equation) were summarized and interpreted.
In Chapter 3, a 2:1 layered clay, Swy-2 montmorillonite, was used in the slurry
system, and three widely used organic agrochemicals, carbaryl, mecoprop and
paraquat were selected as probe chemicals. The AFT degradation of these chemicals
in the clay slurry system was studied, and the effects of different adsorption
mechanisms on the degradation were investigated and discussed. The main results
are summarized below.

116
(1) Adsorption isotherms were obtained for all three chemicals: mecoprop and
carbaryl have curves fitted with the Freundlich equation, and paraquat has a
curve fitted with the Langmuir equation. Through measuring the d spacing of
the clay layer before and after adsorption, molecular disposition at the clay
interlayer was inferred: both mecoprop and paraquat appear to form a
monolayer sitting flat and parallel to the clay siloxane surfaces.
(2) Through AFT degradation experiments, it was found that carbaryl and
mecoprop could be completely and quickly removed from the slurry, while
for paraquat, only the chemical in the aqueous phase of the slurry could be
degraded.
(3) Through XRD analysis, it was found that the AFT degradation rate of
interlayer adsorbed mecoprop was much higher than the desorption rate,
indicating that AFT is capable of effectively degrading interlayer adsorbed
mecoprop. However, due to lack of interlayer water and reduced interlayer
distance, strong and tight adsorption of paraquat at the clay interlayer protects
paraquat from being attacked by hydroxyl radicals.
In Chapter 4, Swy-2 montmorillonite clay was used in the slurry system, and the
adsorption and degradation of 4, 6-o-dinitrocresol (DNOC) and p-nitrophenol (PNP)
in the clay slurry were investigated. The main results are summarized below.
(1) The pH and type of cations were varied, and results showed that adsorption
of DNOC and PNP increased at lower pH values. The specific cation had a
significant effect on adsorption, which was dramatically enhanced in the
presence of K+ and NH4+. Nitroaromatic compounds adsorb on the
montmorillonite clay through the formation of complexes between the clay
interlayer certain cations, such as K+ or NH4+, and the nitro groups on the

117
molecule. Moreover, DNOC adsorption is favored in an acidic environment,
and DNOC molecules can be completely adsorbed on the clay surface at pH
values below the pKa (pH 4.4).
(2) DNOC degradation rates were affected by the initial pH and the type of
electrolytes. The degradation rate substantially decreased in the clay slurry
system in the presence of K+ and low pH, with a large amount of DNOC
residue remaining after 60 min treatment.
(3) Based on the LC-MS data, 9 possible degradation intermediates were
detected and assigned, and a possible degradation pathway was proposed.
Based on the nitrogen measurement, it was found that nitro groups were
removed from the benzene rings and DNOC molecules were mineralized
during the AFT process.
In Chapter 5, a widely distributed iron oxide, goethite, was used in the slurry
system, and dinoseb was selected as the probe chemical. The effect of goethite on
the AFT degradation of dinoseb was investigated. Major results are summarized
below.
(1) pH effect on the adsorption and AFT degradation of dinoseb in the goethite
slurry was investigated. At neutral or high pH, there was less dinoseb
adsorption on goethite than at low pH, and the AFT degradation process was
not significantly affected under the given experimental conditions. In an
acidic or low pH environment, there was much more dinoseb adsorption on
goethite, which inhibited AFT degradation, though more soluble iron
originated from goethite in acidic conditions, a potential enhancement for
degradation. We also found that goethite itself could remove 50% dinoseb in
the presence of hydrogen peroxide in 30 minutes in an acidic environment.

118
(2) Through model fitting parameter analysis, it was found that higher goethite
content could increase the degradation efficiency due to more soluble iron
species in the slurry.
6.2 General conclusions and environmental implications
Based on the results of studies of AFT degradation of several organic agrochemicals
in slurry systems, we conclude that:
(1) The developed slurry AFT model is well able to describe the degradation of
non-cationic organic chemicals in a slurry system.
(2) AFT is an effective method to remove non-cationic organic chemicals in soil
or clay slurry systems. AFT is capable of effectively degrading interlayer
non-cationic organic chemicals that are usually not available for
biodegradation.
(3) Adsorption of organic chemicals by soil organic matter, clay or oxides may
affect the degradation process differently depending on the nature of the
organic chemicals and the adsorption mechanisms. Except for nitroaromatic
compounds, which have distinct adsorption mechanisms on smectite clay, for
most other neutral or anionic organic pollutants, their adsorption on SOM
generally outweighs their adsorption on clays or other oxides, and SOM is a
more important factor to study the fate and transport of organic pollutants in
soil. For cationic organic chemicals, their adsorption on clay will be more
important, especially in soils with a large content of layered clays with high
CEC since they cannot be removed effectively by AFT at the clay interlayer.
(4) Through AFT experiments, we conclude that nitroaromatics, DNOC and PNP
can be removed from the montmorillonite clay interlayer, though the

119
degradation rate decreased with an increase of slurry acidity or the presence
of certain cations. This result offers an important implication for remediating
NAC contaminated soils: choosing appropriate pH is critical to achieve the
remediation goal.
(5) Generally speaking, though the adsorption effect in an acidic environment is
notable, iron oxides do not affect the AFT degradation of organic chemicals
in the slurry system significantly due to the high aggressiveness and
efficiency of AFT.
In summary, The Fenton reaction-based AFT process is capable of removing neutral
or anionic organic chemicals adsorbed at the clay interlayer effectively, which is an
advantage over bioremediation methods in these systems. The AFT method is an
effective and reliable option for treatment, on a small scale, of soils that are highly
contaminated by organic pollutants. The findings from adsorption experiments and
XRD results for different types of organic agrochemicals may benefit our
understanding of their fate and transformation in soils. The findings also have
important implications for selecting soil remediation strategies.