degradation of high performance polymeric fibers: effects
TRANSCRIPT

Purdue UniversityPurdue e-Pubs
Open Access Theses Theses and Dissertations
12-2016
Degradation of high performance polymeric fibers:Effects of sonication, humidity and temperature onpoly (p-phenylene terephthalamide) fibersNelyan Lopez-PerezPurdue University
Follow this and additional works at: https://docs.lib.purdue.edu/open_access_theses
Part of the Chemical Engineering Commons, and the Materials Science and EngineeringCommons
This document has been made available through Purdue e-Pubs, a service of the Purdue University Libraries. Please contact [email protected] foradditional information.
Recommended CitationLopez-Perez, Nelyan, "Degradation of high performance polymeric fibers: Effects of sonication, humidity and temperature on poly (p-phenylene terephthalamide) fibers" (2016). Open Access Theses. 873.https://docs.lib.purdue.edu/open_access_theses/873

Graduate School Form30 Updated
PURDUE UNIVERSITYGRADUATE SCHOOL
Thesis/Dissertation Acceptance
This is to certify that the thesis/dissertation prepared
By
Entitled
For the degree of
Is approved by the final examining committee:
To the best of my knowledge and as understood by the student in the Thesis/Dissertation Agreement, Publication Delay, and Certification Disclaimer (Graduate School Form 32), this thesis/dissertation adheres to the provisions of Purdue University’s “Policy of Integrity in Research” and the use of copyright material.
Approved by Major Professor(s):
Approved by:Head of the Departmental Graduate Program Date
Nelyan Lopez-Perez
DEGRADATION OF HIGH PERFORMANCE POLYMERIC FIBERS: EFFECTS OF SONICATION, HUMIDITY ANDTEMPERATURE ON POLY(P-PHENYLENE TEREPHTHALAMIDE) FIBERS
Master of Science in Materials Science Engineering
Dr. John HowarterChair
Dr. Kendra Erk
Dr. Carlos Martinez
John Howarter
David Bahr 12/7/2016


DEGRADATION OF HIGH PERFORMANCE POLYMERIC FIBERS: EFFECTS
OF SONICATION, HUMIDITY AND TEMPERATURE ON POLY (P-
PHENYLENE TEREPHTHALAMIDE) FIBERS
by
Nelyan López Pérez
A Thesis
Submitted to the Faculty of Purdue University
In Partial Fulfillment of the Requirements for the degree of
Master of Science in Materials Engineering
Department of Materials Engineering
West Lafayette, Indiana
December 2016

ii
THE PURDUE UNIVERSITY GRADUATE SCHOOL
STATEMENT OF THESIS APPROVAL
Dr. John Howarter, Chair
Department of Materials Engineering
Dr. Kendra Erk,
Department of Materials Engineering
Dr. Carlos Martínez
Department of Materials Engineering
Approved by:
Dr. David Bahr
Head of Materials Science Engineering Graduate Program

iii
To Adrián David González López, my nephew. I dedicate this work to you, although you
might not it understand at this moment, since you are only two. I hope that one day you
read this and know that you are the product of a family full of love, who have given me the
tools, encouragement, inspiration and strength to walk through this rough path called
graduate school. I know that they will do the same for you, whatever you choose to do. I
have come to understand that huge joy can come in the small and simple things that life
brings, like the smile of a child. Your smile has done that for me. Thanks for being a spark
of light in some of my toughest times.
And in memory of Gloria Ana Rivera Machado, my grandmother. She was a perfect
example of resilience and empowerment. She taught me invaluable life lessons that I will
keep forever. I am blessed to have had such a strong and lovely woman as my grandmother.
With all my love,
Nelyan

iv
ACKNOWLEDGEMENTS
I will like to thank Dr. John A. Howarter for his support and advice through this project
and choosing me to be a member of his team. I would like to give thanks to all the graduated
students and fellow coworkers in Dr. Howarter’s team for contributing ideas and feedback
on my project. Special thanks to Gamini P. Mendis, for all the training, SEM images, and
guidance, and Logan T. Kearney for his help in the sample preparation for tensile testing.
Also, thanks to the now Dr. Shane Peng and Dr. Jairo Díaz for their training and help in
the DMA. Thank you all for sharing of your time and knowledge with me.
Thanks to the members of my committee, Dr. Kendra Erk, and Dr. Carlos Martinez for
their evaluation and remarks on this thesis.

v
TABLE OF CONTENTS
LIST OF TABLES……………………………………………………………… vii
LIST OF FIGURES…………………………………………………………….. viii
ABSTRACT…………………………………………………………………….. x
CHAPTER 1: INTRODUCTION………………………………………………. 1
CHAPTER 2: PROPERTIES OF HIGH PERRFOMANCE FIBERS…………. 3
2.1 High Performance Fibers Used for Body Armor………………….. 5
CHAPTER 3: PPTA……………………………………………………………. 8
3.1 Fiber Structure…………………………………………………….. 10
CHAPTER 4: DEGRADATION OF BALLISTIC FIBERS…………………… 13
4.1 Characterization Techniques………………………………………. 13
4.1.1 Dynamic Mechanical Analysis…………………………… 14
4.1.2 Tensile Testing…………………………………………… 14
4.1.3 Thermogravimetrical Analysis…………………………… 16
CHAPTER 5: SONICATION………………………………………………….. 17
CHAPTER 6: BACKGROUND………………………………………………... 19
6.1 Humidity and Temperature………………………………………... 19
6.2 Effects of Water on PPTA………………………………………… 19
6.3 Creep………………………………………………………………. 20
6.7 Fracture……………………………………………………………. 23
CHAPTER 7: EXPERIMENTAL……………………………………………… 25
7.1 Sonication and Sample Preparation……………………………….. 25
7.2 Dynamic Mechanical Analysis……………………………………. 26
7.2.1 Humidity Ramp Test……………………………………… 26
7.2.2 Cycle-Humidity Test……………………………………… 27
7.2.3 Long Creep Test…………………………………………... 28
7.3 Humidity Chamber………………………………………………... 29
7.4 Scanning Electron Microscopy……………………………………. 29
7.5 Thermogravimetrical Analysis……………………………………. 29
7.6 Tensile Testing…………………………………………………….. 30

vi
CHAPTER 8: DATA AND DISCUSSION…………………………………….. 31
8.1 Humidity Ramp Test………………………………………………. 31
8.2 Cycle-Humidity Test………………………………………………. 36
8.3 Long Creep Test…………………………………………………… 39
8.4 SEM Images……………………………………………………….. 41
8.5 Thermogravimetrical Analysis……………………………………. 43
8.6 Tensile Testing…………………………………………………….. 44
CHAPTER 9: CONCLUSIONS AND FUTURE WORK……………………… 47
REFERENCES………………………………………………………………...... 50

vii
LIST OF TABLES
Table Page
1 List of different chemical and mechanical degradation factors……….. 13
2 Mechanical properties of Twaron (PPTA) fibers……………………… 25
3 Values obtained from the fitting of the long creep test………………... 28
4 Properties of the non-polar solvent, hexane…………………………… 39

viii
LIST OF FIGURES
Figure
Page
1 Structure and dimensions of fibers made out of different common
materials used for ballistic fibers…………………………………….
4
2 Molecular structure of UHMWPE…………………………………... 5
3 Molecular structure of PBO…………………………………………. 6
4 Comparison of specific strength vs. the specific stiffness of
commercially available high performance fibers ……………………
7
5 Chemical structure of PPTA………………………………………… 8
6 Schematic of the dry-jet wet spinning process to form PPTA fibers... 9
7 Intermolecular arrangement of PPTA chains………………………... 7
8 PPTA sample after TGA test under a temperature ramp to 1000C….. 10
9 Model proposed by Li et al. of the structure of PPTA fibers………... 11
10 Pleated structure proposed by Dobb et al……………………………. 11
11 Pleated structure proposed by Morgan et al…………………………. 12
12 Stress-strain curve of a brittle vs. a plastic semicrystalline material... 15
13 Sketch of PPTA fibers in sonication bath…………………………… 17
14 Stages of creep in a polymer………………………………………… 21
15 Example of the data extracted from the DMA and how the amount
of creep is calculated ………………………………………………...
21
16 Sketch of the formation of water layers between PPTA crystallites… 22
17 Different types of fractures in fibers………………………………… 23
18 Crack propagation model proposed by Morgan et al………………... 24
19 Segment of the humidity ramp test………………………………….. 26
20 Relative humidity steps on the humidity ramp test………………….. 27
21 Relative humidity steps on the cycle-humidity test…………………. 27
22 Sketch of the costume made humidity chamber……………………... 29
23 Fixture used for tensile testing………………………………………. 30
24 Complete humidity ramp test for neat PPTA fiber sample at 30oC…. 31
25 Humidity ramp test for neat PPTA fiber sample at 30oC……………. 32

ix
26 Humidity ramp test for neat PPTA fiber sample at 60oC……………. 32
27 Humidity ramp test of PPTA fibers sonicated for 2 hours at 30oC….. 33
28 Humidity ramp test of PPTA fibers sonicated for 2 hours at 60oC….. 33
29 Humidity ramp test of PPTA fibers sonicated for 6 hours at 30oC….. 34
30 Humidity ramp test of PPTA fibers sonicated for 6 hours at 60oC….. 34
31 Strain percent difference under each condition related to the initial
strain percent at 0% RH……………………………………………...
35
32 Cycle-humidity test for neat PPTA fibers at 30oC…………………... 36
33 Cycle-humidity test for PPTA fibers sonicated for 2 hours at 30oC… 37
34 Cycle-humidity test for PPTA fibers sonicated for 6 hours at 30oC… 37
35 Comparison of the strain difference of neat and sonicated fibers at
30oC…………………………………………………………………..
38
36 Prediction of the creep behavior of Neat and sonicated PPTA fibers
on polar and non-polar solvents for 2 hours………………………….
40
37 Prediction of the creep behavior of Neat and sonicated PPTA fibers
on polar and non-polar solvents for 2 hours. Normalized strain and
logarithmic time scale………………………………………………..
40
38 Cross sectional image of PPTA fiber yarn…………………………... 42
39 SEM images PPTA fibers sonicated at 2, 4, and 6 hours……………. 42
40 Evidence of the presence of kink bands in sonicated PPTA fibers….. 42
41 Example of how TGA data is analyzed……………………………… 43
42 Moisture uptake of sonicated PPTA fibers after sonication and after
24 hours exposed to 30oC and 50%RH………………………………
44
43 Elastic modulus of neat and sonicated fibers after sonication and 24
hours in the humidity chamber at 30oC and 50%RH………………...
45
44 Peak load of neat and sonicated fibers after sonication and 24 hours
in the humidity chamber at 30oC and 50%RH……………………….
44

x
ABSTRACT
López Pérez Nelyan. M.S. Materials Science and Engineering, Purdue University,
December 2016. Degradation of High Performance Polymeric Fibers: Effects of
Sonication, Humidity and Temperature on PPTA Fibers. Major Professor: John A.
Howarter.
High performance fibers are characterized by properties such as high strength and
resistance to chemicals and heat. Due to their outstanding properties, they are used on
applications under harsh environments that can degrade and decrease their performance.
Fiber degradation due to different chemical and mechanical factors, is a process that begins
at a microstructural level. Changes in the polymer’s chemical or physical structure can alter
their mechanical properties. Knowledge of the structure-properties relationship and the
effects of environmental chemical and physical factors over time, is crucial for the
improvement and development of high performance fibers.
In this study ballistic fibers of poly(p-phenylene terephthalamide) (PPTA) were studied.
Methods of accelerated degradation were used to mimic the wearness of the fibers over
long periods of time at a smaller time range. Fibers were subjected to ultrasonication in
aqueous solution at pH 7 for up to six hours in order to produce surface damage. Once
degraded, properties like the creep behavior of these fibers were studied under a humidity
range of 0-80% and temperatures of 30oC and 60oC. Characterization of the chemical and
mechanical properties of degraded PPTA fibers were characterized by thermogravimetrical
analysis (TGA), dynamic mechanical analysis (DMA), scanning electron microscopy
(SEM), and tensile testing to failure.
Sonication produces small but significant changes in the crystalline structure of the fibers
that allows the formation of layers of water and consequently affecting mechanical
properties like the elastic modulus and peak load. These small changes can be related to
the early stages of degradation. Moreover, this study shows the efficiency of techniques
such as the DMA for the detection of early signs of degradation by measuring the amount
of creep the material undergoes as humidity changes.

1
CHAPTER 1: INTRODUCTION
Degradation is the process at which a material loses its performance over time. Usually it
is known that a material is degraded when it fails during service. However, this process
starts with small changes in the material’s physical and chemical structure. For example,
changes in the crystallinity or bond breaking are some of the slight degradation steps that
take place at an early stage in the process and their effects are magnified with time and
continuous exposure to the environment.
The aim of this project is to study the nanostructural degradation process in high
performance polymer fibers that are used for body armors. These fibers are characterized
for having outstanding properties such as high elastic modulus, chemical and thermal
resistance, and possess high crystallinity. All of these properties are attributed to their
chemical composition and physical structure. Any alteration in the order of the composition
and structure of the fibers may affect their chemical and mechanical properties. This
implies that said changes affect the performance of the material, which sometimes results
loss of the mechanical properties and consequently, failure during service. This is of great
concern for users of soft body armors, since it represents a risk of death or serious injury.
Chemical and physical factors in the environment such as high temperatures, humidity, low
and high pH found in sweat, and wear can alter the material at the molecular level and
display their effects as a reduction of the material’s performance at larger scales. Hence,
studying the early stages of the degradation process of these high performance fibers is
important to predict and prevent their failure while in service.
To study the degradation process of high performance fibers under normal use conditions
can take years. Therefore, various methods to accelerate the degradation can be employed
in order to enable the study of this process at a laboratory setting and reduced timescale
while mimicking the real use conditions. One of the methods used for the degradation of
fibers is sonication, which can alter the order and crystallinity of materials due to
vibrations, heat and pressure differences between the material and the media it is
submerged in. In this project, sonication is used as counterpart method of degradation that
accelerates said process due to the localized differences in pressure and temperature as
sonication takes place. The former can be seen as an analogue to the effects of folding and
2
wear, whereas the latter can be related to thermal degradation due to body heat, temperature
during service and storage settings. More details about sonication and its effects on fibers
are discussed in section 5.
High performance fibers like those made out of poly(p-phenylene terephthalamide)
(PPTA) are one of the most commonly used fibers for body armors and the main subject
of our study. This project focuses on the detection of early degradation signs on PPTA
fibers through sonication. In addition, the goal is to determine the effectiveness of
mechanical testing as an approach to determine early and small signs of degradation.
Changes in the modulus and the tensile strength of the fibers are the properties measured
with these mechanical testing methods. Although changes can be small they can be used to
predict further changes in the performance of the fibers for a wider range of time.

3
CHAPTER 2: PROPERTIES OF HIGH PERFORMANCE FIBERS
Fibers are materials that can be used for a wide variety of applications from clothing to
tension cords and bullet proof vests. These materials can be engineered to be useful for
specific needs. There are two groups of fibers: natural and synthetic. Natural fibers such as
cotton, wool, silk, and hemp are obtained from vegetable sources or from the hair and
proteins of animals. On the other hand, synthetic fibers are produced from molecular
organic or inorganic sources.
Some synthetic fibers are composed of polymers, which are drawn to align the polymer
chains in the same direction. The purpose of the drawing process is to increase the aspect
ratio of the material. We refer to the aspect ratio as the length of the material divided by its
diameter1. Fibers possess high aspect ratios (100-500), which means that their diameter is
very small when compared to their length1. Some polymeric fibers that take this property
to their advantage are high performance fibers. This group of fibers possess at least one
superior physical, mechanical and chemical property2. They are usually distinguished for
possessing high yield stress, elastic modulus, ductility, thermal, impact and chemical
resistance. However, it is difficult to obtain a material that offers all these properties
simultaneously3. Therefore, a great amount of research is involved in developing and
improving high performance fibers to develop the next generation of body armor.
The superior properties that high performance fibers possess are attributed to the chemical
and physical structure of the polymer. The chemical composition and the tacticity (how the
side are arranged along the polymer chain4) govern the material’s ability to form secondary
bonds and crystalline regions respectively. Consequently, this dependence on the structure
and chemical composition of the polymers affect the performance of the final product at
macroscale. Chemically, polymers used for the production of ballistic fibers often have
strong covalent bonding on the backbone, should be linear - to enable chain folding and
obtain higher crystallinity- and must be able to acquire an “extended chain” structure5.
Figure 1, shows a schematic of different fibers, including some used for high performance
applications. The figure details the different structures of the fibers made from extended
polymer chains and their size scales6,7. Fibers like Kevlar and Spectra [trade names for
poly(p- phenylene terephthalamide) and ultra high molecular weight polyethylene

4
respectively] are composed of macrofibrils and each microfibril is formed by the extended
polymer molecules that possess diameter of 0.5-1 nm.
Other factors that contribute to the performance of these fibers is the spinning and drawing
process, at which the polymer molecules are aligned to produce the fibers. Two of the most
common spinning processes are: melt and solution spinning. Melt spinning consists in
heating and extruding the polymer without the use of a solvent. This process is
recommended for polymers that have a broad range of temperatures at which the viscosity
is the adequate for extrusion and degradation does not take place. On the other hand,
solution spinning does require the use of a solvent because the polymer cannot be melt
extruded. Under this category, there are two other subcategories that are based on the
removal of the solvent: dry and wet spinning. In the case of dry spinning, the solvent is
removed by evaporation, while in wet spinning the solvent is removed with another solvent
in what is known as a coagulation bath2. Degradation can be induced during the production
the fibers due to the high temperatures and residues of the solvent used at this stage. At
high temperatures the material is more prone to oxidation, which can lead to the release of
free radicals and later on, chain scission. Another example of the effects of spinning
processes is the formation of microvoids due to the evaporation of the solvent once the
product is finished, which can affect the performance of the fiber while in use8. Section 3
will discuss the spinning process for PPTA fibers in more detail.
Figure 1. Structure and dimensions of fibers made out of different common materials
used for ballistic fibers6,7.

5
2.1 High performance fibers used for body armor
The use of high performance fibers for soft body armors is relatively new (being developed
in the mid-20th century). Before the synthesis of advanced materials like PPTA fibers,
Nylon and silk fibers were used for the development of body armors9. Yet, there was a
necessity of lightweight and flexible body armors that offered more protection than the
offered by previously used fibers. The first commercially developed ballistic fiber was
Kevlar developed by DuPont in the 1960’s but available in the market in 19719,10. Kevlar
is made out of poly(p-phenylene terephthalamide) and it is discussed more broadly in
section 3. After the successful development and commercialization of Kevlar, other
polymeric fibers have been produced for body armors.
An example of other polymers used for the production of ballistic fibers is ultra-high
molecular weight polyethelyne (UHMWPE), commercially known as Dyneema or Spectra
(figure 2). This type of polyethylene has a weight average molecular weight of around two
million which means that each chain has an approximate length of around 10 microns11.
Polyethylene is chosen for this application due to its flexibility, low density, and high
crystallinity, strength and fatigue resistance12. Drawing UHMWPE increases its
crystallinity and takes advantage of the strong covalent forces that govern the chain
structure by aligning the polymer backbone in the direction of the applied force, and
increases interchain connectivity11. Although UHMWPE is commonly used for ballistic
applications, some of its disadvantages originate from its low melting temperature.
UHMWPE can exhibit creep behavior at room temperature and, it is accelerated at
Figure 2. Molecular structure of ultra high molecular weight polyethylene (UHMWPE).

6
temperatures above 150oC11. Therefore, the use of UHMWPE is limited to a small range
of service temperatures.
Another polymer used for ballistic purposes is poly(p-phenylene-2, 6-benzobisoxazole)
(PBO), commercially known as Zylon in its fiber form. The chemical structure of this
polymer consisting in aromatic rings (see figure 3) gave the material higher rigidity. Fibers
made out of PBO can reach an elastic modulus of 360 GPa , making it the highest among
the fibers used for ballistic materials (Twaron PPTA fibers have an eleastic modulus
ranging from 60-120GPa13, and UHMWPE has an elastic modulus of approximately
115GPa11) 14. However, it has been found that factors such as exposure to ultraviolet
radiation (UV), and high and low pH this material affect the stability of the benzoxazole
ring in its molecular structure15. The instability of the benzoxazole ring was one of the
factors studied after a body armor vest failed during service. This incident prompted a
series of investigations to understand the failure of PBO fibers. The failure of these fibers
was due to presence of phosphoric acid that was residue of the manufacturing process15.
When PBO fibers are in contact with humidity and high temperatures a reduction in the
average molar mass of the polymer and the tensile strength of fibers has been measured.
These results are evidence that a hydrolysis reaction among the chains takes place16.
Hydrolysis leads to chain scission and premature failure.
Figure 3. Molecular structure of PBO. The highlighted region indicates the
benzoxazole ring.

7
The ultimate goal of high performance fibers used for soft body armors, like the previously
mentioned, is to offer ballistic protection without compromising weight and comfort17.
Figure 4 shows a graph of different fibers that are commercially available for ballistic
applications9. The graph compares the material’s specific strength versus its specific
stiffness (modulus). These “specific” properties refer to the value of the fiber’s modulus or
strength respectively, divided by its density18. According to figure 4 the strongest fibers
available are those made out of carbon nanotubes (CNT) but they are also the stiffest,
making them more brittle. On the other hand, ballistic fibers like Kevlar, Dyneema and
PBO are in the range of 50-225 GPa/SG specific stiffness and 2-4.50 GPa/SG specific
strength. They are less strong and stiff than CNTs, because although they possess high
crystallinity they are not as crystalline as CNTs, therefore, they show some elasticity and
exhibit more flexibility.
Despite the values of properties such as stiffness and strength of these materials, one single
fiber does not offer enough coverage for ballistic protection. These fibers are bundled into
yarns that are formed into woven textiles. These woven textiles sheets or panels are
arranged on top of each other in different directions to create the fully packed amor.
Figure 4. Comparison of the specific strength versus the specific stiffness of
commercially available high performance fibers9.

8
CHAPTER 3: POLY (P-PHENYLENE TEREPHTHALAMIDE)
Poly(p-phenylene terephthalamide) (PPTA) is an aramid polymer, which means it is
composed of aromatic rings and amide functional groups. Its repeat unit is a byproduct of
the condensation reaction of para-phenylene diamine with terephthaloyl chloride to obtain
the chemical structure showed in figure 5. The resulting molecule is stable due to the
presence of aromatic rings in the backbone. The stiffness of the chains is attributed by the
para position of the aromatic rings, while its crystallinity is enabled by the presence of
amide groups in the lateral direction. The latter permits hydrogen bonding and chain
packing19.
The rigidity of the PPTA chains make the material difficult to process. However, PPTA
can be dissolved in solvents such as H2SO4 , HF and methasulfonic acid17. When the
polymer is combined with one of these solvents, a liquid crystal system is produced. A
liquid crystalline polymer (LCP) shows properties of liquids and crystals. LCPs have
mesogenic regions, which can form crystalline phases20. Polymers that acquire a liquid
crystal behavior when a solvent is added, like PPTA, are considered a lyotropic systems21.
PPTA degrades at temperatures below its melting point, therefore processing PPTA under
a lyotropic condition prevents degradation due to high temperatures20. Another benefit that
this processing technique provides is that dry-jet wet spinning process is possible and
results in radial crystalline orientation19.
Figure 5. Chemical structure of poly(p-phenylene terephthalamide) (PPTA). PPTA is
the polymer used to produce commercially known high performance fibers such as
Kevlar and Twaron.

9
In the dry-jet wet spinning process (figure 6), the lyotropic PPTA solution (20% solvent,
80% polymer) is passed through the spinneret holes to form the filaments (fibers). After
this stage the filaments are drawn a certain distance (0.5-1cm) until it reaches the next stage
which is the coagulation bath2. This stage consists in submerging the PPTA filaments in a
water bath at 0oC-5oC to remove the solvent. The following step is a heat treatment at high
temperature (550oC) but only a few second to further align the polymer chains2. This
process enables the ability of PPTA molecules to form hydrogen bonds (see figure 7), and
the characteristic high crystallinity of these fibers.
Once the PPTA polymer is transformed into fibers, consequences in the melting
temperature occur. In the fiber form, PPTA degrades at around 500oC but does not melt as
Figure 7. Intermolecular arrangement of PPTA chains. Chains are held together by
hydrogen bonding, as marked by the highlighted area on the sketch.
Figure 6. Schematic of the dry-jet wet spinning process to form PPTA fibers2.

10
the temperature continues to raise. Figure 8 shows a fiber sample after it has been heated
up to 1000oC. The sample is practically char, nonetheless it never transitions to a liquid
state. Hence, the fiber structure enhances the physical and chemical properties such as
increasing the elastic modulus due to more crystallinity and increasing the thermal
resistance due to the strong bonds between and stability among the molecules.
3.1 Fiber structure
There are several models that describe the structure of PPTA fibers. However, the
consensus model is that the structure of these fibers is formed by a skin barrier (on the
surface) and a core. This skin-core arrangement is created at the coagulation stage of the
dry-jet wet spinning process6. As the PPTA LCP system is drawn through this process, the
chains located closer to the surface are immediately aligned while those at the center are
“relaxed”6. Consequently, the core is formed by imperfectly packed but ordered chains and
differs from the skin structure in density, amount of void and orientation of the fribrils6,22,23.
Figure 9 demonstrates a model proposed by Li et al, which explains the differences
between the core and skin structures24,25 and the overall radial structure of the fiber.
Figure 8. PPTA fiber sample after thermogravimetrical analysis test under a
temperature ramp to 1000oC. The sample does not melt but degrades and all that is left
is char.

11
Another physical characteristic of PPTA fibers is their pleated structure as seen in Figure
10 proposed by Dobb et al. In this model the oriented crystals are located parallel to each
other and in a way that the intermolecular hydrogen bonding is perpendicular to the fiber’s
surface6,26. X-ray diffraction results show that the pleated structure is formed by (200)
planes that create two alternating sets of sheets that have a periodicity of 250 and 500nm6.
A 170o angle between the two sheet surfaces that form the pleated structure6,26.
Figure 9. Model proposed by Li et al. of the structure of PPTA fibers. In it, there is a
skin barrier at the surface and a core formed of crystallites that grow radially. The
crystallites are packed in cylinders that are aligned to the drawing axis6,24,25.
Figure 10. Pleated structure proposed by Dobb et al26.

12
As the dry-jet wet-spinning process continues and enters the solidification phase, chain-
end defects are induced in PPTA fibers. Figure 11 shows a schematic of this structure
proposed by Morgan et al. In said model the core consists of fibrils27.
Figure 11. Pleated structure proposed by Morgan et al27.This structure is similar to the
one found in figure 9 but it is more specific in the dimensions of the skin-core
morphology. It also concludes that the diameter of the fibrils is around 60nm.

13
CHAPTER 4: DEGRADATION OF BALLISTIC FIBERS
Table 1 presents a variety of chemical and mechanical degradation factors relevant to
ballistic fibers. Degradation will first take place in the most susceptible (weaker) bonds on
the polymer chain. Hence, to degrade a polymer chain, the degradation factor must provide
the sufficient energy to break those bonds. This can result in one of two pathways: chain
scission or crosslinking. Either of them has consequences on the performance of the
material. For example, cross-linking increases the molecular weight and the viscosity of
the polymer, while chain scission has the opposite effect28.
Chemical Mechanical
Exposure to Radiation (UV, sunlight)
Humidity
Temperature
pH / redox reactions
Chemical attacks (such as solvents and
sweat)
Fatigue
Compression
Tension
Shear
4.1 Characterization Techniques
Signs of degradation on materials, like changes in color, are visible at first sight. However,
degradation small changes in the chemical and physical structure of the materials
sometimes are not visible but do have an effect on the performance of the fibers. Hence,
chemical and mechanical characterization techniques are employed to study these small
changes and relate the environmental conditions that the materials are exposed to, to the
resulting mechanical properties. There are many characterization techniques that detect
these changes. For example, chemical degradation can be studied by using methods such
as Fourier transform infrared spectroscopy (FTIR) which detects any changes in the
vibration of the functional groups conforming the polymer chains. However, physical
degradation can have more visible signs that can be seen through microscopy methods.
Fibers that have been exposed to different mechanical degradations may exhibit evidence
Table 1. List of different chemical and mechanical degradation factors.

14
of kink bands and/or fibrillation. Kink bands are deformation structures that usually appear
when fibers like PPTA experience compression or bending, causing a change in the
orientation of the polymer chains29. Axial compression weakens the fibers and can lead to
their failure30. On the other hand, fibrillation is the separation of the fibrils of a fiber.
These signs of degradation can be detected by microscopy methods such as the scanning
electron microscopy (SEM), which is one of the methods employed in this project.
Nevertheless, some modes of degradation cannot be visible through these methods but can
be detected using mechanical testing methods such as the dynamical mechanical analysis
(DMA) and tensile testing to failure. Both of the latter are core measurement methods for
this project and will be described in the following sections.
4.1.1 Dynamic Mechanical Analysis
In general, dynamic mechanical analysis (DMA) is a technique that measures the response
of a material to an applied force (stress)31. Data obtained from this kind of analysis offer
information of visco-elastic transitions, damping modulus, and other properties of a
material31. One of the properties that can be studied using this technique is the material’s
creep behavior. Creep is the deformation of a material over time when a constant stress is
applied, which is essential information to know the range of temperatures at which the
material can be used32.
4.1.2 Tensile testing
Tensile testing is a very straight forward characterization technique through mechanical
properties of a material can be acquired. Through this method, a stress versus strain curve
(figure 12) of the material is plotted as the sample under study is stretched in one
direction33 . The results of the plotted stress-strain curve show how much elastic and plastic
deformation the material undergoes until it fails and breaks. Ductile materials like the
semicrystalline material represented in red in figure 12, have and initial elastic response.
This means that if the applied load is removed, little to no deformation is done. If the
material is stretched even further, it will reach a point where plastic deformation takes place
known as the yield point. In the case that the material is stretched even more, it will reach
its ultimate tensile strength. This point indicates the maximum load that the material can

15
support without breaking34. After reaching this point, a semicrystalline material will
experience a wider amount of strain at a lower stress than the ultimate tensile strength.
Later on the stress will increase at a higher rate until it the material breaks and fails.
Ballistic fibers possess high crystallinity and will exhibit a brittle behavior such as the
green plot in figure 12. In this case, the ultimate tensile strength and the fracture point are
the same. This is one of the properties that are measured in this project along with the
elastic modulus. The latter is determined with the slope of the stress-strain curve.
Tensile testing has been previously used by Obaid et al., to study the effects of
environmental conditioning such as alterations on temperature and amount of time exposed
to water on high performance fibers35. This study concentrated in aramid fibers and focused
in measuring the retention of the values of the mechanical properties through tensile
Figure 12. Stress-strain curve of a brittle material versus a plastic semicrystalline
material. Effects on the microstructure of the semicrystalline material is shown step by
step as it is deformed. This figure is adapted from34: Callister, W. D. Materials Science
and Engineering : An Introduction; John Wiley & Sons, Inc., 2007.

16
testing. The data showed that aramid fibers like Kevlar an Twaron retained 100% of their
modulus, but had a decrease on their strength (only 42% and 66% retained respectively)
and strain at failure (45% and 77% retained) when tested in water at 100OC. Said results
substantiate the capability of tensile testing to detect degradation by measuring changes in
the mechanical properties of high performance fibers.
4.1.3 Thermogravimetrical Analysis
Thermogravimetrical analysis (TGA) measures a material’s weight loss as it is heated up.
This technique offers information of crucial transitions such as the degradation temperature
of PPTA fibers and the amount of water retained by the material. Data obtained through
this method, is related to the structure of the material, therefore, changes in the crystallinity
of the material will be reflected in the data. TGA experiments can be conducted under
nitrogen or air environments. The latter can offer information of the oxidation of the
material.
The effectiveness of TGA as a characterization method for high performance fibers has
been proven before. A study conducted by Liu and Yu, used TGA to compare and evaluate
the thermal stability of different high performance fibers such as PBO, PPTA and
UHMWPE among other fibers composed made out of copolymers36. Results revealed that
PBO has a higher thermal stability than PPTA fibers (like Kevlar and Twaron), and
UHMWPE has the lowest thermal stability. These conclusions are the same for both air
and nitrogen atmospheres. Other studies by Perepelkin et al. used TGA for the
determination of the thermal resistance of different para-aramid fibers37. Results show that
thermooxidation is crucial at temperatures above 450 to 500oC and that 4% of the fiber’s
weight is lost at temperatures ranging above 490-500oC. Information obtained through
these studies can be used to set a range of service temperatures and are an example of the
relevance of TGA data.

17
CHAPTER 5: SONICATION
Due to the degradation effects of sonication in polymeric materials like fibers, it can be
used as a method for accelerated degradation. This method may induce similar fatigue
conditions, such as other methods that involve the folding of PPTA fibers. A research team
at the National Institute of Standards and Technology have developed a costume made
machine that folds body armor panels (woven material used as a protective layer in soft
body armors) cyclically38,39 to replicate the effects of wear. However, due to the harsh
environment that ultrasonic waves create when they travel through a liquid media, it can
be used to simulate the same effects as the folding machine developed at NIST.
Ultrasonic waves are produced at a range of 20kHz and above40.Sonication at this
frequency is commonly used for cleaning, welding, emulsifying, and to accelerate chemical
reactions like polymerization and polymer degradation40,41. In an ultrasonic bath (as seen
in figure 13), ultrasonic waves travel through a liquid media. Due to the motion of the
liquid molecules at high frequencies, an increase on temperature and the formation of
bubbles is produced. Moreover, pressure differences are generated through the medium
where high and low pressure areas perform compression and rarefaction/extension
respectively on the material that is immersed in the medium42. These phenomena affect the
material that is exposed to sonication both in the surface and the internal structure of the
fibers. Consequences like the generation of shock waves and microstreaming jets that are
produced when bubbles expand and collapse, can lead to intermolecular tearing and the
Figure 13. Sketch of PPTA fibers in a sonication bath.

18
liberation of free radicals on materials like fibers41,42,43. Polymer degradation caused by
sonication usually do not produce any chemical changes, but may cause the breaking of
chemical bonds, which can lead to a reduction in molecular weight44.
One of the parameters that determine the rate of degradation of a material as it is sonicated
is the solvent that is used as the media. Therefore, the solubility parameter of the solvent
and the polymeric material is essential for the degradation process45. Polymer degradation
due to sonication is usually measured by detecting changes in the molecular weight
distribution of the polymers44. However, ballistic fibers like PPTA, are highly resistant to
solvents, therefore the weight distributions is difficult to obtain. Also, the use of highly
abrasive solvents, such as sulfuric and hydrofluoric acid, are not commonly present when
the material is used for ballistic protection purposes. Therefore, the use of said solvents
would not mimic the degradation of PPTA fibers under normal use conditions, and hence
will add additional and unnecessary degradation. Nevertheless, testing of the mechanical
properties of the fibers can also give a quantitative measurement of the material’s
degradation.
Aging studies on polymeric membranes have been carried using sonication as a method for
accelerated degradation. The results conclude that sonication increases the pore radius,
density and porosity of membranes41. Some of the consequences these changes produce are
the formation of cracks in the material which increase the permeability. This is an example
of how sonication can affect both the structure and the performance of the polymeric
material.
Sonication has been said to reduce the effects of ultraviolet (UV) degradation on PPTA
fibers and also increase their strength46. Andrassy et al. address the improvement on the
mechanical properties to ordering of the fiber structure and the formation of crosslinks46.
These results do not show any chemical evidence of crosslinking nor take in consideration
the effects of moisture in the fibers. Other studies revealed the effects of sonication on
PPTA fibers by obtaining visual evidence of degradation such as kink bands and
fibrillation47. However, no information of the changes on the mechanical properties was
provided.

19
CHAPTER 6: BACKGROUND
Previous studies have revealed the physical effects of sonication on PPTA fibers which
include the formation of kink bands, and fibrillation47. Others have gone further in these
studies and concluded that submitting PPTA fibers to sonication treatment can help
improve their strength and prevent degradation due to UV exposure46. The latter is
attributed to the possible “crosslinking” of the chains, but no chemical information is
offered. The question that raises out of these previous research is if sonication can really
improve the strength of PPTA fiber, by reducing the magnitude of the degradation over
time. It seems contradictory that effects such as fibrillation can make the material stronger.
Moreover, this project focuses on the effects of ultra-sonication of PPTA fibers and its
effects on its mechanical properties at different temperatures and relative humidity. The
changes in the mechanical properties were mainly measured by carrying experiments with
the dynamic mechanical analysis (DMA) and tensile testing techniques. With this we can
obtain information of the material’s mechanical properties such as its elastic modulus and
creep behavior under different fibers and the contributions (benefits/disadvantages) of
sonication to them.
6.1 Humidity and Temperature
In this project PPTA were exposed to different amounts of relative humidity. Relative
humidity (RH) is defined as the amount of water vapor in a volume, with 100% being the
saturation point of water in air. It is expressed as a percentage. There is also a difference
between the temperature and the apparent temperature. The apparent temperature is
perceived temperature as a product of the actual temperature and the relative humidity.
Increasing the amount of water vapor, in other words, increasing the relative humidity
raises the apparent temperature. Only RH and actual temperature are reported in this
project.
6.2 Effects of water on PPTA
It is crucial to understand the reactions of water on PPTA fibers at short and long periods
of time for it will determine the life of use of soft body armors48. Moreover, water is
present in common scenarios like humidity in the environment and sweat from the user. It

20
is known that moisture is retained in the amorphous regions of the polymer, however,
PPTA fibers are characterized by their high crystallinity. This raised the question on how
is it possible for these fibers to retain water. Some studies attribute the moisture uptake in
PPTA fibers to the polarity of amide groups present in the polymer chains, the presence of
microvoids in the surface and hydrophilic salts that are residue of the manufacturing
process49.
There are models that explain this moisture uptake by a diffusion process between the skin
and core structures in the fibers. However, another model called the intercalation model
has been proposed. The latter stablishes that water penetrates the surface layers of the
crystallites50. The effects of water on the creep behavior of PPTA fibers is discussed in the
following section (6.2).
6.3 Creep
One of the mechanical characteristics that were studied in this project was the creep
behavior of PPTA fibers that were subjected to different amounts of sonication time and
humidity. Creep is experienced by a polymeric material when it is subjected to constant
stress. Under this condition, the stain of the material changes over time as showed in figure
14. The creep behavior curve described by the figure is divided in three stages: primary,
secondary and tertiary. The primary stage of creep is characterized by a high strain rate
until it reaches a constant strain20. Later on, the material enters the secondary creep stage
where the strain rate is constant. At the tertiary creep stage the strain rate increases again
and leads to fracture. As it is represented in the figure, fracture does not occur instantly,
it can occur in minutes or years. Furthermore, the creep behavior of the material is
dependent on factors like the temperature and the applied stress. It is expected that the
fracture of the polymeric material occurs at shorter amounts of time if these factors
(temperature and stress) are increased32. This project is focused on studying the primary
creep stage through the DMA technique.

21
Figure 15 shows an excerpt of the data obtained from the DMA experiments explained in
greater detail in sections 7.2.1 and 7.2.2. This portion of the data, corresponds to the stage
at which the sample is under a constant tensile stress (18 N), therefore, it experiences creep.
On the x axis, the time is plotted while the y-axis determines the amount of strain (in
percentage) the sample undergoes. This experiments consist in submitting the sample to
creep at different relative humidity values. Therefore, the final amount of creep will depend
not only of the temperature and humidity conditions, but also the creep history. To know
the amount of creep the sample has experienced, the difference in strain is calculated based
on the initial strain on the creep stage at 0%RH. The initial and final strain are marked on
figure 15 with a green and a red dot respectively. To calculate the strain percent at each of
the humidity values, the final value (red dot in figure 15) is subtracted to the value of the
strain at 0%RH.
Figure 14. Stages of creep in a polymer.
Figure 15. Example of the data extracted from the DMA and how the amount of creep
is calculated.

22
Moreover, polymeric materials like PPPTA fiber, experience nonlinear creep. This
behavior has been previously described and modeled with the following power law
equation51:
𝜀(𝑡) = 𝜀0 +𝑚𝑡𝑛
In said equation 𝜀0 is the initial overall strain (when t=0) of the material and n is a parameter
intrinsic of the material. With this equation the results from a short creep experiment can
be fitted and the values obtained from said fitting allows the prediction of the creep
behavior at longer times.
One of the main pillars of this investigation is to understand how sonication of PPTA fibers
changes their structure and water adsorption capacity. The amount of water retained in the
fibers has affects their creep behavior. It has been previously established by Wang et al.,
that water molecules form layers between the crystallites52. The presence of the water
molecules enables the formation of hydrogen bonding. Furthermore, the strength of these
bonding forces decreases as the amount of water layers increases. Wang et al. also
concluded that at low relative humidity the creep activation energy is higher than at high
relative humidity percentages52. This means that creep is more likely to occur more rapidly
when there is more water, due to the weakening of the hydrogen bonds between the water
layers. Figure 16 demonstrates the formation of the water layers (comparing a monolayer
versus a multilayer scenario).
Figure 16. Sketch of the formation of water layers between the PPTA crystallites52.

23
6.4 Fracture
Ballistic fibers such as those made of PPTA have a brittle response when subjected to a
tensile load. This is due to the high orientation of the polymer chains and crystallinity.
Fracture of these fibers mainly consist of chain-scission53 caused by the chain-end defects
mentioned in section 3.1. Said defects do not only affect the failure, but also contribute to
the deformation and strength of the fibers6,27. Fracture in highly oriented fibers like PPTA
occur by crack propagation that produce an axial split break54. These fibers, as mentioned
in previous sections, have a higher molecular strength in the axis in which the fiber was
drawn than between the molecules. Figure 17 shows the most common types of fracture
found in fibers (axial split can be found in figure 17.6)
Figure 17. Different types of fractures in fibers. Group A- Tensile breaks: (1) brittle,
(2) ductile, (2a) light-degraded, (3) high-speed mushroom, (4) axial splits, (5) granular,
(6) fibrillar, (7) stake-and-socket. Group B-Fatigue: (8) strip and tail, (9) kink bands,
(10-11) splits, (12) wear, (13) peeling, (14) rounding. Group C-Others: (15) mangled,
(16) cut, (17) melted, (18) natural end of cotton fiber. This figure was taken from54.

24
Failure in PPTA fibers mainly consists in crack propagation. Cracks are formed as a
consequence of the breakage of hydrogen bonds between the chains as the fiber experiences
tension. In the core, the propagation follows a transverse path along the sites where there
are chain ends27. As it reaches the skin, the path follows a transversal and lateral
propagation marked by the difference in the structure between the two areas as seen in
figure 18.
Figure 18. Crack propagation model proposed my Morgan et al27,6.

25
CHAPTER 7: EXPERIMENTAL
7.1 Sonication and sample preparation
PPTA woven fibers (Twaron, provided by Teijin) where submerged in a beaker full of
deionized water. Said beaker was submerged in a Bransin Ultrasonics (Branssonic model
CPX 3800) ultrasonic bath with frequency of 40kHz. The fibers where sonicated for 2, 4
and 6 hours. Fiber yarns were air dried and prepared for DMA testing. In order to maintain
the fibers of the yarn together, a thin layer of epoxy glue was deposited at the ends of the
yarns. Epoxy was let to set for 24 hours. Table 2 offers information about the PPTA fibers
used provided by the manufacturer in order to be compared with the results of the
conducted experiments13.
Twaron Properties
Density (g/cm3) 1.44-
1.45
Tensile Strength
(GPa)
2.4-3.6
Tenacity (N/tex) 1.65-2.5
Modulus (GPa) 60-120
Elongation at break
(%)
2.2-4.4
Moisture (wt%) 3.2-5
Decomposition (oC) 500
Another set of samples of woven PPTA were sonicated for the long creep test that will be
described in section 7.2.3. These samples were sonicated for 2 hours in DI water and
hexane.
Table 2. Mechanical properties of Twaron (PPTA) fibers.

26
7.2 Dynamic Mechanical Analysis
Experiments that measured the amount of creep with humidity were carried on a DMA
Q800 from TA Instruments with a humidity chamber attached to it. Experiments were
carried using a film-tension fixture.
7.2.1 Humidity ramp test
Dynamic mechanical analysis was performed on neat and sonicated yarns. The DMA
creep-humidity test consisted in a controlled force stress versus strain test (figure 19).
Initial force was set at 0.01N and it was ramped up to 18N at a rate of 3N/min. The test
consisted in measuring the response of the fibers to an applied force at a constant
temperature and variating percentage of relative humidity. Once the applied force reached
18N it remained constant for 10 minutes to measure creep. After this creep period, the force
was decreases to the original 0.01N. The applied stress was tested under 0, 50 and 80%
relative humidity and then the humidity was decreased in the same steps but in reverse to
0% relative humidity. Temperature was kept constant at 30 and 60oC. Figure 20 shows the
humidity steps over the running time of the test.
Figure 19. Segment of the humidity ramp test. For each percentage of relative
humidity, the same steps are repeated.

27
7.2.2 Cycle-humidity test
A similar tests to the one described in section 6.2.1 was made for neat and sonicated fiber
yarns. The aim of this test was to induce fatigue on the fibers and measure their creep. The
test consisted in two parts: (1) fatigue at 0% and (2) fatigue at 80%. Stress was applied
with an initial force set at 0.01N and it was ramped up to 18N at a rate of 3N/min. Once
the stress reached 18N it was held constant for 10 minutes and then decreased to 0.01N.
This was repeated three times for both parts of the test, with a 10-minute interval (at 0.01N)
between repetition. Figure 21 illustrates the changes in humidity during this test. The tests
were run isothermally (30oC and 60oC).
Figure 20. Relative humidity steps on the humidity ramp test. Temperature is kept
constant through the test.
Figure 21. Relative humidity steps on the cycle-humidity test. Temperature is kept
constant through the test.

28
7.2.3 Long Creep Test
To determine the formation of hydrogen bonding between PPTA crystallites and water,
another test is carried, where the fibers are immersed in a non-polar solvent for same
amount of time and conditions previously discussed. As said before, the ability of PPTA
molecules to form hydrogen bonds, make possible the formation of water layers between
the crystallites. Increasing the amount of water, increases the formation of layers which
acts as a plasticizer and enables creep.
Hexane, a common non-polar solvent will be used to compare if the presence of water is
in fact a factor that contributes to the increase of creep between the crystallites. Table 3
includes information about this solvent. Obtaining data of the creep behavior of PPTA
fibers that have been exposed to a non-polar solvent like hexane will validate or invalidate
the hypothesis of the formation of water layers between PPTA crystallites.
Hexane Chemical Properties
Molecular
Formula
Molecular
Weight
(g/mol)
Melting
Point
(oC)
Boiling
Point
(oC)
Molecular Structure
C6H14 86.175 -95.35 68.73
Sample preparation for this test was described on section 7.1, where woven PPTA samples
were sonicated in hexane and DI water for 2 hours respectively. After sonication, the
woven material was dried for 30 minutes at 60oC to remove any excess solvent.
The DMA test consisted in applying the same constant force of 18N for two hours at 0%
RH and isothermally at 30oC. The constant RH and temperature enables to have control
over the amount of water in the fibers and only study the effects of water and sonication.
Table 3. Properties of the non-polar solvent, hexane.55

29
7.3 Humidity Chamber
A humidity chamber was built to humidify neat and sonicated fibers for 24 hours at a
constant temperature (30oC) and humidity (~50% RH). Figure 22 shows a schematic of
the humidity chamber setup. This humidity chamber was used principally to prepare fiber
samples which required to be longer for tensile testing to failure (see section 7.6) and to
measure the amount of water uptake of the fibers through thermogravimetrical analysis
(see section 7.5).
7.4 Scanning Electron Microscopy (SEM)
Electron microscope images were taken using the XL40 FESEM from Philips. Images of
the neat and sonicated fiber yarns were taken to detect any visual signs of degradation like
fibrillation and kink bands. Also, fibers tested to failure were also examined.
7.5 Thermogravimetrical analysis (TGA)
Humidified fiber samples (see section 7.3), were submitted to themogravimetrical analysis
to detect the amount of water retained and any significant shifts on properties like the
degradation temperature of neat and sonicated fibers. The test consisted of a temperature
ramp from room temperature to 1000oC at a rate of 15oC/min.
Figure 22. Sketch of the costume made humidity chamber.

30
7.6 Tensile Testing
Neat, sonicated and humidified fibers were tested to failure in a MTS Insight tensile tester
(electromechanical-100kN standard length) with a load cell of 1000 N. A fiber fixture was
used to test the fibers following the ASTM D 2256 standard. Figure 23 shows the fixture
used for this test. PPTA fibers with a gauge length of 432mm, 0.20mm of thickness and
0.50mm of width were tested. Tape was adhered to the ends of the fiber yarns to prevent
slipping.
Figure 23. Fixture used for tensile testing.
31
CHAPTER 8: DATA
8.1 Humidity ramp test
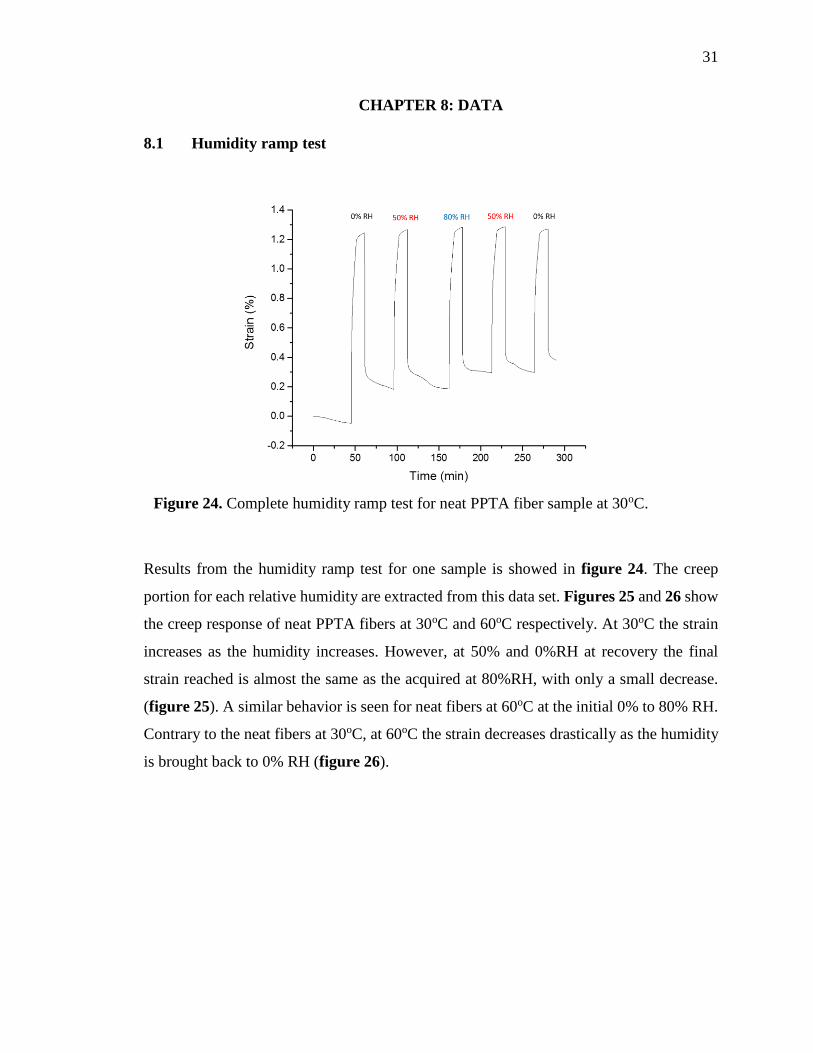
Results from the humidity ramp test for one sample is showed in figure 24. The creep
portion for each relative humidity are extracted from this data set. Figures 25 and 26 show
the creep response of neat PPTA fibers at 30oC and 60oC respectively. At 30oC the strain
increases as the humidity increases. However, at 50% and 0%RH at recovery the final
strain reached is almost the same as the acquired at 80%RH, with only a small decrease.
(figure 25). A similar behavior is seen for neat fibers at 60oC at the initial 0% to 80% RH.
Contrary to the neat fibers at 30oC, at 60oC the strain decreases drastically as the humidity
is brought back to 0% RH (figure 26).
Figure 24. Complete humidity ramp test for neat PPTA fiber sample at 30oC.

32
0 2 4 6 8 10
1.00
1.02
1.04
1.06
1.08
1.10
1.12
Str
ain
(%
)
Time (min)
0% RH
50% RH
80% RH
50% RH recovery
0% RH recovery
0 2 4 6 8 10
1.18
1.20
1.22
1.24
1.26
1.28
Str
ain
(%
)
Time (min)
0% RH
50% RH
80% RH
50% RH recovery
0% RH recovery
All sonicated fibers tested exhibit the same general creep response as the neat fibers. At
30oC, the strain continues to increase as the humidity is brought back to 0% RH but at a
smaller degree than the initial humidity steps. On the other hand, at 60oC, there is a
“recovery” on the strain when the humidity is reaches the final 0%RH. This is true for both
kinds of sonicated fiber- for 2 hours (figures 27 and 28) and 6 hours (figures 29 and 30).
The reduction in the strain percent implies that there is more resistance to deformation.
Figure 25. Humidity ramp test of neat PPTA fibers at 30oC.
Figure 26. Humidity ramp test of neat PPTA fibers at 60oC.

33
0 2 4 6 8 10
0.96
0.98
1.00
1.02
1.04
1.06
1.08
1.10
Str
ain
(%
)
Time (min)
0% RH
50% RH
80% RH
50% RH recovery
0% RH recovery
.
0 2 4 6 8 10
1.50
1.55
1.60
1.65
1.70
1.75
1.80
Str
ain
(%
)
Time (min)
0% RH
50% RH
80% RH
50% RH recovery
0% RH recovery
Figure 27. Humidity ramp test of PPTA fibers sonicated for 2 hours at 30oC.
Figure 28. Humidity ramp test of PPTA fibers sonicated for 2 hours at 60oC.

34
0 2 4 6 8 10
1.6
1.7
1.8
Str
ain
(%
)
Time (min)
0% RH
50% RH
80% RH
50% RH recovery
0% RH recovery
0 2 4 6 8 10
1.38
1.40
1.42
1.44
1.46
1.48
1.50
Str
ain
(%
)
Time (min)
0% RH
50% RH
80% RH
50% RH recovery
0% RH recovery
One important factor to consider in these tests is time and the systematic restrictions from
the DMA machine. In order to reach a certain percentage of relative humidity, the system
has to undergo an isothermal step until it reaches the desired humidity. The rate at which
the machine reaches the humidity is 2 %RH per minute. Therefore, in order to reach 80 %
Figure 29. Humidity ramp test of PPTA fibers sonicated for 6 hours at 30oC.
Figure 30. Humidity ramp test of PPTA fibers sonicated for 6 hours at 60oC.

35
RH, the system has to stay on an isothermal step for 40 minutes. Once at the desired %RH,
the following step is a 10-minute creep stage, where the constant force is 18N. This means
that the fibers have more time to respond to the humidity until it reaches the 80 % RH.
To understand the degree of strain at the end of the experiment, the strain history of the
samples must be considered. As an approach to understand the overall effect of water
adsorption, temperature and amount of sonication, a comparison of the values of the strain
difference of all the fibers was made. The method used to calculate each data point is
explained in section 6.3. This method correlates the final strain percent at each humidity
with the initial strain at 0%RH. Figure 31 is a plot of these percent differences.
0 50 80 50 rec 0 rec
0.8
1.0
1.2
1.4
1.6
1.8
2.0
2.2
2.4
2.6
2.8
Str
ain
Relative Humidity (%)
Neat 30C
Neat 60C
2h 30C
2h 60C
6h 30C
6h 60C
Notice that figure 31 offers a clearer view of the differences between the behavior of the
fibers at 30oC and 60oC. Within each temperature the trend is the same for both neat and
sonicated fibers. At 30oC (plots with square symbols), show an increase in the strain as the
humidity increases. Once it reaches 80%RH and the humidity proceeds to decrease, the
amount of strain is almost constant for the neat fibers and those sonicated for 2 hours.
Fibers sonicated for 6 hours show an increment in their strain as the humidity is brought
Figure 31. Strain percent difference under each condition related to the initial strain
percent at 0%RH.

36
back to 0% RH. At this temperature, the fibers can adsorb more water. Therefore, the strain
values are greater at 30oC than at 60oC.
On the other hand, at 60oC the strains are lower and the overall trend is different. As
humidity increases there is more strain, but once the humidity returns to 0%RH the amount
of strain decreases. This could be due to the desorption of water which reduces the amount
of water layers between the crystallites and induce stronger hydrogen bonding.
8.2 Cycle-humidity test
As described on section 7.2.2, the cycle-humidity test consisted in detecting the amount of
creep after loading and unloading the sample yarns at 0% RH and 80%RH. Figure 32-34
show the strain percentage neat and sonicated fibers undergo at 30oC. The results show that
the amount of strain increases with humidity and also after every cycle.
0 2 4 6 8 10
1.4
1.5
1.6
1.7
1.8
1.9
Str
ain
Time (min)
0%RH 1
0%RH 2
0%RH 3
80%RH 1
80%RH 2
80%RH 3
Figure 32. Cycle-humidity test for neat PPTA fibers at 30oC.

37
0 2 4 6 8 10
1.14
1.16
1.18
1.20
1.22
1.24
1.26
1.28
1.30
Str
ain
Time (min)
0%RH 1
0%RH 2
0%RH 3
80%RH 1
80%RH 2
80%RH 3
0 2 4 6 8 10
1.1
1.2
1.3
Str
ain
Time (min)
0%RH 1
0%RH 2
0%RH 3
80%RH 1
80%RH 2
80%RH 3
Figure 33. Cycle-humidity test for PPTA fibers sonicated for 2 hours.
Figure 34. Cycle-humidity test for PPTA fibers sonicated for 6 hours.
38
0 (I) 0 (II) 0 (III) 80 (I) 80 (II) 80 (III)
0.5
1.0
1.5
2.0
2.5
3.0
3.5
4.0
4.5
5.0
Str
ain
Diffe
rence
Relative Humidity (%)
Neat 30C
2h 30C
6h 30C
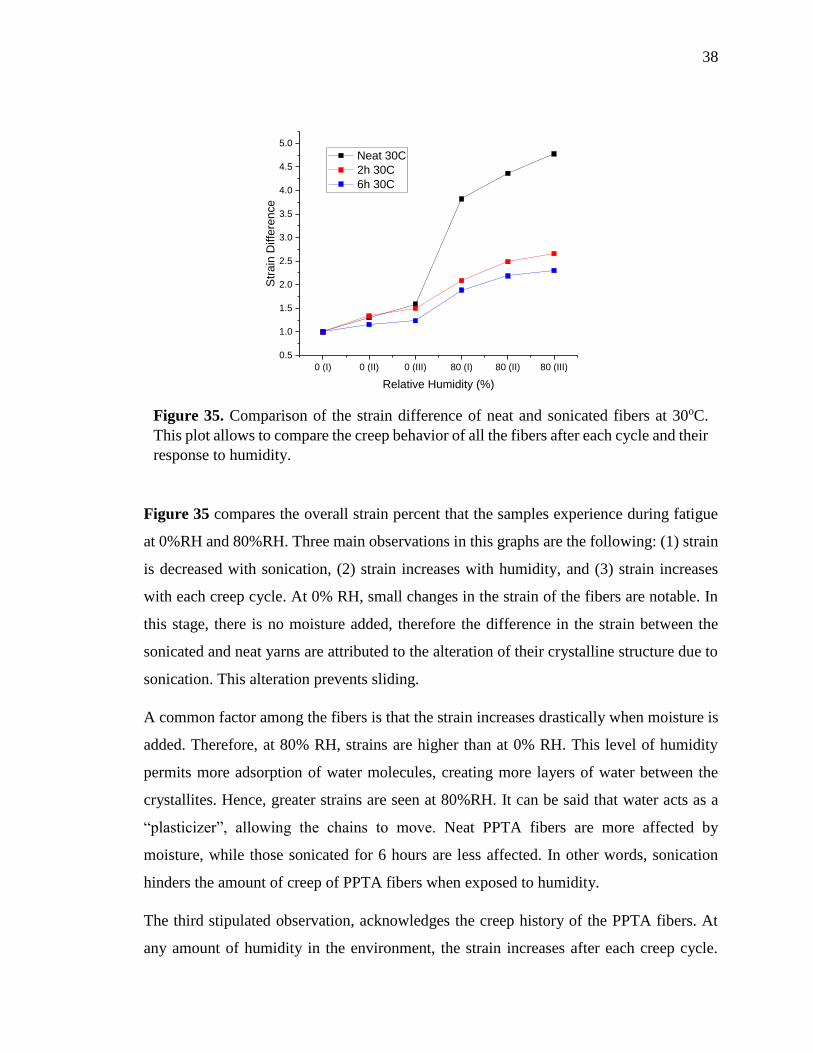
Figure 35 compares the overall strain percent that the samples experience during fatigue
at 0%RH and 80%RH. Three main observations in this graphs are the following: (1) strain
is decreased with sonication, (2) strain increases with humidity, and (3) strain increases
with each creep cycle. At 0% RH, small changes in the strain of the fibers are notable. In
this stage, there is no moisture added, therefore the difference in the strain between the
sonicated and neat yarns are attributed to the alteration of their crystalline structure due to
sonication. This alteration prevents sliding.
A common factor among the fibers is that the strain increases drastically when moisture is
added. Therefore, at 80% RH, strains are higher than at 0% RH. This level of humidity
permits more adsorption of water molecules, creating more layers of water between the
crystallites. Hence, greater strains are seen at 80%RH. It can be said that water acts as a
“plasticizer”, allowing the chains to move. Neat PPTA fibers are more affected by
moisture, while those sonicated for 6 hours are less affected. In other words, sonication
hinders the amount of creep of PPTA fibers when exposed to humidity.
The third stipulated observation, acknowledges the creep history of the PPTA fibers. At
any amount of humidity in the environment, the strain increases after each creep cycle.
Figure 35. Comparison of the strain difference of neat and sonicated fibers at 30oC.
This plot allows to compare the creep behavior of all the fibers after each cycle and their
response to humidity.

39
Fatigue will always affect the fibers regardless the amount of water present and their
previous condition or treatments because it creates changes in the structure, moving any
dislocations. The difference on the response to fatigue between treated and neat fibers
relays on how much fatigue affects the amount of strain. That said, results in figure 35
show that sonication helps reduce the amount of creep contributed to fatigue.
8.3 Long Creep Test
Data obtained from the long creep tests discussed in section 7.2.3 was fitted to the power
law equation. The values of the fitting for each of the cases ( neat fibers and fibers sonicated
in water and hexane), are listed in table 4. These values where used to obtain the respective
equations that will predict the creep behavior at longer periods of time.
Solvent 𝜀0 m n
Neat 1.68 0.22 0.12
Water 1.36 0.19 0.10
Hexane 1.30 0.15 0.11
Figure 36 shows a plot of the creep behavior of the fibers under the different conditions
for longer periods than the 2 hours on which the experiment was carried. For a clearer
understanding of the effects of creep on neat and sonicated fibers on polar and non-polar
solvents, figure 37 offers the same information, however the strain is normalized and the
time axis is set to a logarithmic scale.
Table 4. Values obtained from the fitting of the long creep test.

40
0 200000 400000 600000 800000 1000000
1.2
1.4
1.6
1.8
2.0
2.2
2.4
2.6
2.8
3.0
Str
ain
(%
)
Time (min)
Neat
Water
Hexane
1 10 100 1000 10000 100000 1000000
1.0
1.1
1.2
1.3
1.4
1.5
1.6
1.7
Str
ain
(%
)
Time (min)
Neat
Water
Hexane
From the latter results it is noticed that neat fibers experience more creep than fiber
sonicated for two hours in both water and hexane. This might indicate that sonication
hinders the creep effect on the fibers. However, when the fibers sonicated on water are
Figure 36. Prediction of the creep behavior of Neat and sonicated PPTA fibers on polar
and non-polar solvents for 2 hours.
Figure 37. Prediction of the creep behavior of Neat and sonicated PPTA fibers on
polar and non-polar solvents for 2 hours. Normalized strain and logarithmic time
scale.

41
compared to those sonicated on hexane, the former experience more creep than the latter.
The formation of water layers between the PPTA crystallites allows more creep to take
place. No hydrogen bonding is formed when fibers are submerged in a non-polar solvent,
therefore, these fibers experience less creep.
In conclusion, sonication does hinder the creep effect on fibers, but the presence of water
counteracts this effect, increasing the amount of creep but not in a higher rate than that of
neat fibers.
8.4 SEM images
Cross sectional images where taken with the scanning electron microscope. The samples
where set on epoxy and polished to obtain a flat surface to observe the cross sectional
structure of the fibers. Figure 38a show a group of fibers in a PPTA yarn. A closer look
is taken in figure 38b, where the microstructure can be seen as well as some voids. Another
detail that can be seen in this figure is the appearance of two fibers that seem to be attached
to each other, which is commonly found in the rest of the sample. This could be as a result
of the spinning process.
Figure 38c is a closer look at the microstructure of the fibers. These PPTA fibers are
approximately 20µm in diameter. However, the images obtained through this method
might not resemble the real structure because in the polishing process heat is produce and
abrasion is exerted on the microstructure. This is why the structure looks flattened in a
direction. For this reason, other methods for the preparation of the samples to avoid damage
are proposed in section 9.0. One of the proposed alternatives is to plasma etch the fibers
in order to have a view of their microstructure in the lateral direction without cutting
recurring to polishing that will cause additional harm to the sample.
Images of PPTA sonicated fibers were also obtained through scanning electron microscopy
and show that there is no much of a difference between 2, 4 and 6 hours of sonication
(Figure 39). Nevertheless, there are clear signs of fibrillation among the fibers.

42
A closer look reveals the presence of kink bands (see Figure 40a). Structure of fibers tested
to failure are shown in figures 40b and 40c. In the latter evidence of fibrillar failure is
observed.
Figure 39. SEM images of PPTA fibers sonicated at (a) 2 hours, (b) 4 hours and (c) 6
hours. All images have a 100x magnitude.
Figure 40. (a) Evidence of the presence of kink bands in sonicated PPTA fibers. Kink
bands are a sign that the fibers experienced compression. 2000x magnitude. (b) Evidence
of fibrillation fracture. 500x magnitude. (c) Closer look of the fibrillation in the fracture
area of a fiber sonicated for 2 hours. 2000x magnitude
Figure 38. Cross sectional images of PPTA fibers in epoxy. (a) Cross sectional view of
neat PPTA yarn. (b) Closer look of PPT fibers from the same yarn as in figure 36a,
where some fibers are adhered to each other. (c) Cross sectional image of a single PPTA
fiber.

43
8.5 Thermogravimetrical analysis (TGA)
Data obtained from the TGA is analyzed as explained in figure 41. This is a straight
forward measurement of the amount of water that the fibers retain in terms of weight
percent. According to the information provided by the manufacturer, Twaron PPTA fibers
can have moisture uptake of 3.2-5 wt.% (see table 2). Neat and sonicated fibers are tested
under the conditions mentioned in sections 7.3 and 7.5.
Results for the TGA analysis are plotted on figure 42 Fibers sonicated for 2 hours retain
less moisture than those sonicated for 6 hours. Therefore, the amount of moisture increases
with sonication time. However, the amount of moisture decreases after 24 hours at 30oC
and 50%RH. This could be for various reasons such as: evaporation of water and
temperature gradient in the humidity chamber. The latter is due to the contact of the fibers
to the bottom of the flask, which it is assumed that has a higher temperature than the rest
of the round flask because it is in direct contact with the sand bath.
Figure 41. Example of how TGA data is analyzed. The x axis indicates the temperature.
Change in weight is measured at 200 C to obtain the amount of water lost. This indicates
the amount of water retained by the fibers. Results are reported as weight percent.

44
On the other hand, results show that neat PPTA fibers has an average moisture uptake
similar to the fibers sonicated at 2 hours. Despite the trend seen among sonicated and
sonicated-humidified fibers, where there is a reduction of the retained moisture after 24
hours, neat PPTA after 24 hours in the humidity chamber has a higher amount of moister
than the rest, including the completely neat fibers. These results also might be an indication
of changes in the crystalline structure of the fibers that cause greater water uptake.
8.6 Tensile Testing
Results of the discussed test in section 7.6 are shown on figure 43, where the modulus of
neat, and sonicated PPTA fibers where tested to failure. These also include the testing of
humidified fibers for 24 hours. Neat PPTA fibers have an average modulus of 105 GPa,
however, after 24 hours of humidification the modulus decreases to 93 GPa. A greater
decrease on the modulus is obtained after 2 hours of sonification. The effect of humidity
after 24 hours for fibers sonicated for two hours does not have a dramatic effect on the
modulus. As sonication is continued for 6 hours, modulus is slightly increased when
0
2
4
6
8
10
12
Mo
istu
re (
wt.
%)
Neat Neat 24hrs 30C 50RH 2US 2US 24hrs 30C 50RH 6US 6US 24hrs 30C 50RH
Figure 42. Moisture uptake of sonicated PPTA fibers after sonication and after 24
hours exposed to 30oC and 50% RH.

45
compared to the fibers sonicated for 2 hours. Nevertheless, humidification for 24 hours
does decrease the modulus, having a similar behavior as the neat PPTA fibers. Overall,
there is not a significant change in the modulus.
Although no significant changes in the modulus are detected, the peak load of the fibers is
affected by sonication and humidity. The peak load of the fibers is the load at which the
fibers break, also known as the ultimate tensile strength (UTS). Figure 44 shows the results
of the peak load of neat and sonicated fibers. The peak load of the neat fibers is the same
even after 24 hours of humidification. As the fibers are sonicated, the peak load increases,
which can be attributed to changes in the crystalline structure and the amount of water
between the crystallites. In section 6.3, we discussed that water molecules enter the fibers
and form layers that are attached to the crystallites by hydrogen bonding. A monolayer of
water may increase the strength between the crystallites, preventing their mobilization. It
can be assumed that as sonication time increases, more areas where the water layers can
form are created. Hence, the peak load increases with sonication.
0
20
40
60
80
100
120
Mo
du
lus
(GP
a)
Neat Neat 24hr 30C 50RH 2US 2US 24hrs 30C 50RH 6US 6US 24hrs 30C 50RH
Figure 43. Elastic modulus of neat and sonicated fibers after sonication and 24 hours
in the humidity chamber at 30oC and 50% RH.

46
Comparing the results of neat and sonicated fibers to their humidified counterparts, a
decrease in the peak load is the detected. As mentioned before, sonication may produce
more dislocations or changes in the crystalline structure of the fibers, permitting the
adsorption of more water molecules. However, if the amount of water increases (more
layers of water are formed), the strength of bonds between the water molecules and the
crystallites decrease. This is why after 24 hours in the humidity chamber there is a decrease
in the peak load for sonicated fibers. Fibers sonicated for 6 hours and exposed to humidity
for 24 hours have a more dramatic decrease in the peak load.
205
210
215
220
225
230
235
240
245
Pea
k Lo
ad (
N)
Neat Neat 24hr 30C 50RH 2US 2US 24hrs 30C 50RH 6US 6US 24hrs 30C 50RH
Figure 44. Peak load of neat and sonicated fibers after sonication and 24 hours in the
humidity chamber at 30oC and 50% RH.

47
CHAPTER 9: CONCLUSIONS AND FUTURE WORK
Results of this project show that both sonication and humidity affect the creep behavior of
PPTA fibers. Moreover, the dynamic mechanical analysis is a viable method to detect small
changes in the strain of PPTA fibers. This technique allows the measurement of the amount
of creep in the fibers while controlling the temperature and humidity in the environment.
Therefore, the creep detected in this study is the immediate response of this material to the
changes in these factors. These results are related to the early stage of creep (where the
strain rate decreases), more known as the primary creep stage, and can help predict the
failure of these fibers that have been exposed to these factors for a longer amount of time.
DMA results are correlated to the results obtained through tensile testing to failure.
Sonicated fibers that went through various load and unloading cycles show lower amount
of creep (lower values of strain) when compared to neat fibers (see section 8.2). This is a
trend also observed in the results of the tensile test, where sonicated fibers showed higher
peak load than neat fibers.
Humidity plays an important role on the property loss resulting from degradation of PPTA
fibers. The amount of water retained between the crystallites determines the creep response
of the fibers. If there is more water, more strain and therefore more creep is experienced.
Moreover, fibers that have higher amount of water tend to fail at lower loads. This explains
why sonicated fibers that where humidified for 24 hours in the humidity chamber at 30oC
show failure at lower applied loads.
Although other studies have concluded that sonication prevents UV degradation of PPTA
fibers and it might seem beneficial, exposure to UV radiation is not the only factor that
causes the loss of performance. Humidity is a very common factor that contributes to the
degradation of polymeric materials such as fibers, and can be provided by sweat, the
storage environment, and even the weather. The magnitude of the effects contributed by
humidity increased with time and the ability of the material to retain moisture.
One of the reasons why sonication seems to increase the strength of the fibers can be the
alteration of the crystalline structure. These changes act as an obstacle for the movement
of dislocations and together with the small amount of water that might be trapped by

48
hydrogen bonding, strengthens the material. However, as the humidity increases more
water is able to get trapped between the crystallites on sonicated and have the contrary
effect. Still, sonication can hinder the effects of fatigue (as seen in the results of the cycle-
humidity DMA test), reducing the amount of creep, but the presence of high amounts of
moisture increases the amount of strain.
Moreover, the formation of water layers between PPTA crystallites is confirmed when
compared to the effects of a non-polar solvent like hexane. PPTA fibers sonicated in hexane
show lower creep at longer times than fibers exposed to water. Hence, water layers and
hydrogen bonding form between PPTA crystallites.
At higher temperatures like 60oC, desorption can take place in a greater magnitude than at
temperatures closer to room temperature (30oC). Results on the humidity ramp DMA test
at 60oC confirm this conclusion, where the fibers tested at 30oC show a higher amount of
creep. The former shows a decrease in the amount of creep when the humidity is lowered
back to 0%RH. This can be attributed to the removal of water between the crystallites,
hence may be occurring. Overall, fibers tested at 60oC show a lower strain difference
because they experience a higher apparent temperature. The apparent temperature refers to
the temperature that is perceived as a result of the combination of the actual temperature
and the percentage of relative humidity. This temperature increases with relative humidity.
Therefore, the samples at 60oC may behave as if they were on an environment with higher
temperatures. That said, at higher temperatures neat fibers show more strain than those
sonicated, thus, sonication seems to hinder the effects of creep at these conditions.
To confirm and obtain a quantitative measurement of the effects of sonication in the
crystalline structure, techniques such as small angle x-ray diffraction may be used in the
future. However, to study the effects of humidity on the crystalline structure can be more
complex. DMA results show that really small changes in the temperature and relative
humidity alter the strain of the fibers. Therefore, an experimental setup show be developed
to study these measurements in-situ and x-ray diffraction data is acquired.
Likewise, another characterization technique can be used to study the effects of humidity
and temperature at early degradation stages. It is a non-destructive characterization method
known as positron annihilation lifetime spectroscopy (PALS). PALS consists in emitting

49
positron form a radioactive source (Na 22) that is in contact with the material. The positrons
diffuse through the material and occupy areas of low electron density like the free volume
in polymers. When a positron annihilates with an electron a positronium is formed and
emitted. The lifetime of a positronium is related to the size of the free volume and the
intensity is related to the amount of free volume. The result of the spectroscopy is a lifetime
distribution.
Although PPTA fibers are highly crystalline and the free volume is found the amorphous
areas, changes in the small quantity of free volume and in the defects of the polymer can
be detected with PALS. Through this method early signs of degradation may be detected
and can complement the information obtained in this study. Neat and fibers sonicated for
2 and 6 hours will be tested will PALS for 24 hours. To study the effects of humidity as
the experiment is taking place, a humidity chamber will be attached to the PALS setup.
Data for the latter experiment will also be acquired for 24 hours.
More studies can be developed based on these data. Further and more thorough SEM
images of the structure of the PPTA fibers can be obtained by submitting the sample to
plasma etching. Also, studies on the effects of sonication under different media- like water
with a pH range of 3 to 11- can be carried out and used to mimic the effects of wear and
exposure to human sweat.
Long term studies of the hydrothermal degradation of PPTA fibers will be performed.
These will consist in aging the fibers that are submerged in different water solutions that
vary in their pH and exposed to a constant temperature for 6 weeks. Data will be collected
with characterization methods such as DMA, tensile testing, TGA, FTIR, PALS and SEM
to gather as much information of the chemical and mechanical changes through the
degradation process. This study will be extended to other high performance fibers such as
PBO, UHMWPE among others.

50
REFERENCES
(1) Materials, F. Physical Properties of Fillers and Filled Materials. c, 241–303.
(2) Mather, R. R.; Wardman, R. H. The Chemistry of Textile Fibers; RSC Publishing,
2011.
(3) Strobl, G. R. Chapter 10: Deformation, Yielding and Fracture. In The Physics of
Polymers; 2007.
(4) Piazza, R. Soft Matter: The Stuff that Dreams are Made of; Springer: Milan, Italy,
2010.
(5) Buschow, K.H. Jürgen Cahn, Robert W. Flemings, Merton C. Ilschner, Bernhard
Kramer, Edward J. Mahajan, S. Encyclopedia of Material-Science and
Technology; Elsevier, 2001; Vol. 1–11.
(6) Ahmed, D.; Hongpeng, Z.; Haijuan, K.; Jing, L.; Yu, M.; Muhuo, Y.
Microstructural Developments of Poly ( p-phenylene terephthalamide ) Fibers
During Heat Treatment Process : A Review. Mater. Researh 2014, 17 (5), 1180–
1200 DOI: 10.1590/1516-1439.250313.
(7) Wilusz, E. Military Textiles; Woodhead Publishing Limited, 2008.
(8) Dobb, M. G.; Johnson, D. J.; Majeed, A.; Saville, B. P. Microvoids in aramid-type
fibrous polymers. Polymer 1979, 20, 1284–1288 DOI: 10.1016/0032-
3861(79)90157-5.
(9) Committee on Opportunities in Protection Materials Science and Technology for
Future Army Applications, and National Research Council. Opportunities in
Protection Materials Science and Technology for Future Army Applications.
Washington, DC, USA: National. 2016, No. March.

51
(10) Fukuda, M.; Ochi, M.; Miyagawa, M.; Kawai, H. Moisture Sorption Mechanism of
Aromatic Polyamide Fibers: Stoichiometry of the Water Sorbed in Poly(para-
phenylene Terephthalamide ) Fibers. Text. Res. J. 1991, 61 (11), 668–680 DOI:
10.1177/004051759106101107.
(11) Marissen, R.; Duurkoop, D.; Hoefnagels, H.; Bergsma, O. K. Creep forming of
high strength polyethylene fiber prepregs for the production of ballistic protection
helmets. Compos. Sci. Technol. 2010, 70 (7), 1184–1188 DOI:
10.1016/j.compscitech.2010.03.003.
(12) Li, C. S.; Zhan, M. S.; Huang, X. C.; Zhou, H. Degradation behavior of ultra-high
molecular weight polyethylene fibers under artificial accelerated weathering.
Polym. Test. 2012, 31 (7), 938–943 DOI: 10.1016/j.polymertesting.2012.06.009.
(13) Twaron – a versatile high-performance fiber.
(14) Kitagawa, T.; Yabuki, K.; Young, R. . An investigation into the relationship
between processing, structure and properties for high-modulus PBO fibres. Part 1.
Raman band shifts and broadening in tension and compression. Polymer 2001, 42
(5), 2101–2112 DOI: 10.1016/S0032-3861(00)00571-1.
(15) Park, E. S.; Sieber, J.; Guttman, C.; Rice, K.; Flynn, K.; Watson, S.; Holmes, G.
Methodology for detecting residual phosphoric acid in polybenzoxazole fibers.
Anal. Chem. 2009, 81 (23), 9607–9617 DOI: 10.1021/ac901602x.
(16) Forster, A. L.; Pintus, P.; Messin, G. H. R.; Riley, M. a.; Petit, S.; Rossiter, W.;
Chin, J.; Rice, K. D. Hydrolytic stability of polybenzobisoxazole and
polyterephthalamide body armor. Polym. Degrad. Stab. 2011, 96 (2), 247–254
DOI: 10.1016/j.polymdegradstab.2010.10.004.
(17) Gabra, V.; Hartzler, J. D.; Lee, K. S.; Rodini, D. J.; Yang, H. H. Handbook of
Fiber Chemistry; Taylor & Francis Group, 2006.
(18) Wallenberger, F. T.; Industries, P. P. G. Introduction to Reinforcing Fibers. 2001,
21, 50–53 DOI: 10.1361/asmhba0003352.

52
(19) Rebouillat, S. High Performance Fibres; Hearle, J. W. S., Ed.; Woodhead
Publishing Limited: Cambridge, England, 2001.
(20) Young, R. J.; Lovell, P. A. Introduction to Polymers, 3rd ed.; CRC Press: Boca
Raton, FL, 2011.
(21) Sawyer, L. C.; Chen, R. T.; Jamieson, M. G.; Musselman, I. H.; Russell, P. E. The
fibrillar hierarchy in liquid crystalline polymers. J. Mater. Sci. 1993, 28 (1), 225–
238 DOI: 10.1007/BF00349055.
(22) Yang, H. H. Kevlar Aramid Fiber; John Wiley & Sons, Inc., 1992.
(23) Yang, H. H. Aramid fibers. In Comprhensive Composite Materials; 2000; pp 199–
229.
(24) Chatzi, E. G.; Koenig, J. L. Morphology and structure of Kevlar fibers: a review.
Polym. Plast. Technol. Eng. 1987, 26 (3–4), 229–270 DOI:
10.1080/03602558708071938.
(25) Li, L. S.; Allard, L. F.; Bigelow, W. C. On the morphology of aromatic polyamide
fibers (Kevlar, Kevlar-49, and PRD-49). J. Macromol. Sci. Part B 1983, 22 (May
2014), 269–290 DOI: 10.1080/00222348308215504.
(26) Dobb, M. G.; Johnson, D. J.; Saville, B. P. Supramolecular structure of a high-
modulus polyaromatic fiber (Kevlar 49). J. Polym. Sci. Polym. Phys. Ed. 1977, 15,
2201–2211 DOI: 10.1002/pol.1977.180151212.
(27) Morgan, R. J.; Pruneda, C.; Steele, W. J. The Relationship between the Physical
Structure and the Microscopic Deformation and Failiure Processes of Poly(p-
Phenylene Terephthalamide) Fibers. J. Polym. Sci. Polym. Phys. Ed. 1983, 21,
1757–1783 DOI: 10.1002/pol.1983.180210913.
(28) Kelen, T. Polymer Degradation; Van Nostrand Reinhold Company, 1983.
(29) Forster, A. L. Long Term Stability and Implications for Performance of High
Strength Fibers Used in Body Armor, University of Maryland, 2012.

53
(30) Hearle, J. W. S. Fracture of highly oriented, chain-extended polymer fibres;
Elsevier Science Ltd., 2002.
(31) Menard, K. P. An Introduction to Dynamic Mechanical Analysis. Dyn. Mech.
Anal. A Pract. Introd. 1997, No. approximately 1958, 7–22.
(32) Barrett, C. R.; Nix, W. D.; Tetelman, A. S. The Principles of Engineering
Materials; Prentice Hall: New Jersey, 1973.
(33) Moosbrugger, C.; International, A. S. M. Representation of Stress-Strain Behavior.
No. Eq 3, 1–19.
(34) Callister, W. D. Materials Science and Engineering : An Introduction; John Wiley
& Sons, Inc., 2007.
(35) Abu Obaid, A.; Deitzel, J. M.; Gillespie, J. W.; Zheng, J. Q. The effects of
environmental conditioning on tensile properties of high performance aramid
fibers at near-ambient temperatures. J. Compos. Mater. 2011, 45 (11), 1217–1231
DOI: 10.1177/0021998310381436.
(36) Liu, X.; Yu, W. Evaluating the thermal stability of high performance fibers by
TGA. J. Appl. Polym. Sci. 2006, 99 (3), 937–944 DOI: 10.1002/app.22305.
(37) Perepelkin, K. E.; Andreeva, I. V; Pakshver, E. A. Thermal Characteristic of para-
Aramid Fibers. 2003, 35 (4), 22–26.
(38) Kim, J. H.; Brandenburg, N.; McDonough, W.; Blair, W.; Holmes, G. a. A Device
for Mechanically Folding Yarns and Woven Fabrics of Ballistic Fibers. J. Appl.
Mech. 2008, 75 (1), 15001 DOI: 10.1115/1.2755131.
(39) Holmes, G. A.; Kim, J.-H.; Ho, D. L.; McDonough, W. G. The Role of Folding in
the Degradation of Ballistic Fibers. Polym. Compos. 2010, 879–886 DOI:
10.1002/pc.
(40) Mcluckey, S. A. Chapter 24. Proteins 492, 664–700 DOI: 10.1007/978-1-59745-
493-3.
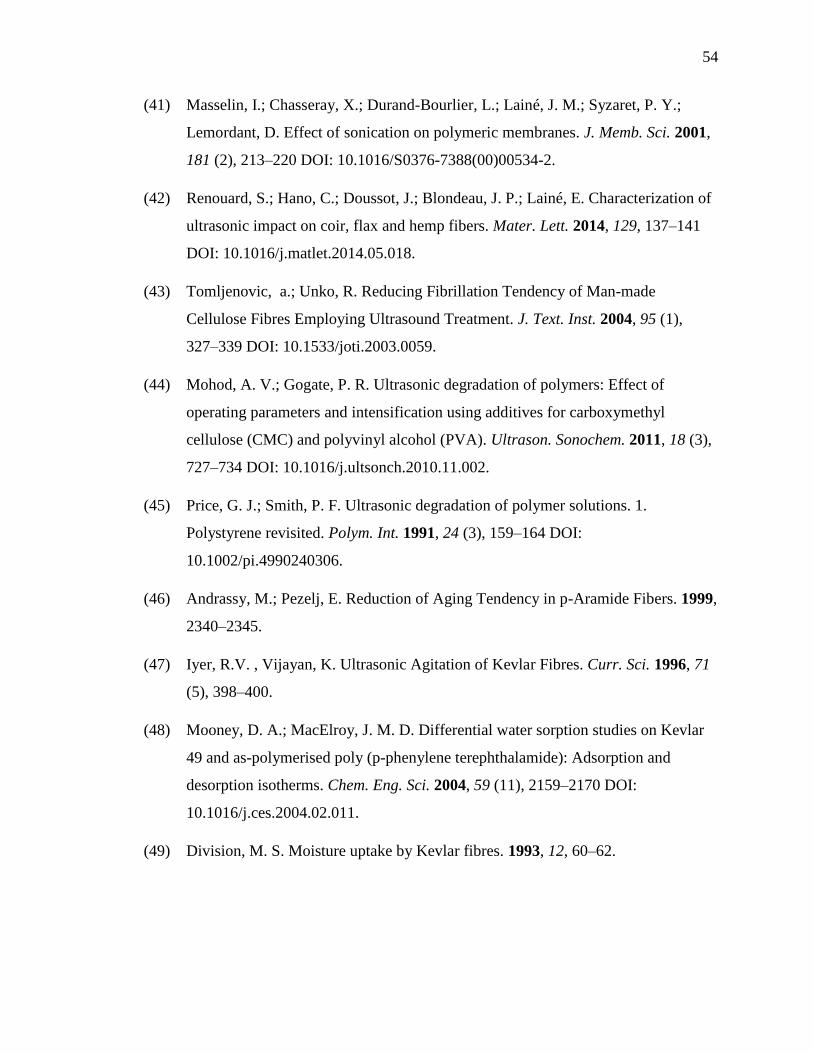
54
(41) Masselin, I.; Chasseray, X.; Durand-Bourlier, L.; Lainé, J. M.; Syzaret, P. Y.;
Lemordant, D. Effect of sonication on polymeric membranes. J. Memb. Sci. 2001,
181 (2), 213–220 DOI: 10.1016/S0376-7388(00)00534-2.
(42) Renouard, S.; Hano, C.; Doussot, J.; Blondeau, J. P.; Lainé, E. Characterization of
ultrasonic impact on coir, flax and hemp fibers. Mater. Lett. 2014, 129, 137–141
DOI: 10.1016/j.matlet.2014.05.018.
(43) Tomljenovic, a.; Unko, R. Reducing Fibrillation Tendency of Man-made
Cellulose Fibres Employing Ultrasound Treatment. J. Text. Inst. 2004, 95 (1),
327–339 DOI: 10.1533/joti.2003.0059.
(44) Mohod, A. V.; Gogate, P. R. Ultrasonic degradation of polymers: Effect of
operating parameters and intensification using additives for carboxymethyl
cellulose (CMC) and polyvinyl alcohol (PVA). Ultrason. Sonochem. 2011, 18 (3),
727–734 DOI: 10.1016/j.ultsonch.2010.11.002.
(45) Price, G. J.; Smith, P. F. Ultrasonic degradation of polymer solutions. 1.
Polystyrene revisited. Polym. Int. 1991, 24 (3), 159–164 DOI:
10.1002/pi.4990240306.
(46) Andrassy, M.; Pezelj, E. Reduction of Aging Tendency in p-Aramide Fibers. 1999,
2340–2345.
(47) Iyer, R.V. , Vijayan, K. Ultrasonic Agitation of Kevlar Fibres. Curr. Sci. 1996, 71
(5), 398–400.
(48) Mooney, D. A.; MacElroy, J. M. D. Differential water sorption studies on Kevlar
49 and as-polymerised poly (p-phenylene terephthalamide): Adsorption and
desorption isotherms. Chem. Eng. Sci. 2004, 59 (11), 2159–2170 DOI:
10.1016/j.ces.2004.02.011.
(49) Division, M. S. Moisture uptake by Kevlar fibres. 1993, 12, 60–62.

55
(50) Mooney, D. A.; Macelroy, J. M. D. Differential water sorption studies on Kevlar
49 and as-polymerized poly(p-phenylene terephthalamide): Determination of water
transport properties. Langmuir 2007, 23 (23), 11804–11811 DOI:
10.1021/la7017538.
(51) Brinson, H. F.; Brinson, L. C. Polymer Engineering Science and Viscoelasticity;
2015.
(52) Wang, J. Z.; Dillard, D. A.; Ward, T. C. Temperature and stress effects in the creep
of aramid fibers under transient moisture conditions and discussions on the
mechanisms. J. Polym. Sci. Part B Polym. Phys. 1992, 30 (12), 1391–1400 DOI:
10.1002/polb.1992.090301210.
(53) Argon, A. S. The Physics of Deformation and Fractures of Polymers; Cambrige
Solid State Science Series, 2013.
(54) Hearle, J. W. S. Forms of fibre fracture. In FIBER FRACTURE; Elsevier Science
Ltd., 2002; pp 57–71.
(55) Group, T. and F. Hexane-Properties of Organic Compounds.