degradation, metabolism and relaxation properties of iron - diva
TRANSCRIPT

Comprehensive Summaries of Uppsala Dissertationsfrom the Faculty of Medicine 1362
Degradation, Metabolism andRelaxation Properties of IronOxide Particles for Magnetic
Resonance Imaging
BY
KAREN BRILEY SAEBO
ACTA UNIVERSITATIS UPSALIENSISUPPSALA 2004

Uppsala UniversityDepartment of Oncology, Radiology and Clinical Immunology
Section of RadiologyAkademiska sjukhuset
SE-751 85 Uppsala, Sweden

Dissertation in Radiology to be publicly examined in Gröwallsalen, Akademiska sjukhuset, Uppsala, Th ursday, June 3, 2004, at 13:15, for the degree of Doctor of Philosophy (Faculty of Medicine). Th e examination will be conducted in English.
AbstractBriley Saebo, K. Degradation, Metabolism and Relaxation Properties of Iron Oxide Particles for Mag-netic Resonance Imaging. Acta Universitatis Upsaliensis. Comprehensive summaries of Uppsala Disser-tations from the Faculty of Medicine 1362. 92 pp. Uppsala. ISBN 91-554-5998-6.
Whereas the eff ect of size and coating material on the pharmacokinetics and biodistribution of iron oxide based contrast agents are well documented, the eff ect of these parameters on liver metabolism has never been investigated. Th e primary purpose of this work was to evaluate the eff ect of iron oxide particle size and coating on the rate of liver clearance and particle degradation using a rat model.
Th e magnetic and relaxation properties of fi ve diff erent iron oxide contrast agents were determined prior to the onset of the animal studies. Th e R2* values and the T1-enhancing effi cacy of the agents were also evaluated in blood using phantom models. Th e results of these studies indicated that the effi -cacy of these agents was matrix and frequency dependent. Correlations between the R2* values and the magnetic properties of the agents were established and a new parameter, Msat/r1, was created to enable better estimations of contrast agent T1-enhancing effi cacy in blood.
Th e bio-distribution of one of the agents was also evaluated to assess the importance of sub-cellular particle distribution, using an isolated rat liver cell model. Phantom models were also used to verify that materials with magnetic properties similar to the particle breakdown products (ferritin/hemo-siderin) may induce signal reduction when compartmentalized in a liver cell suspension. Th e results revealed that the cellular distribution of the agent did not infl uence the rate of particle degradation. Th is fi nding confl icted with current theory. Additionally, the study indicated that the compartmen-talization of magnetic materials similar to ferritin may induce signifi cant signal loss.
Methods enabling the accurate determination of contrast agent concentration in the liver were devel-oped and validated using one of the agents. From these measurements the liver half-life of the agent was estimated and compared to the rate of liver clearance, as determined from the evolution of the eff ective transverse relaxation rate (R2*) in rat liver. Th e results indicate that the liver R2* enhance-ment persisted at time points when the concentration of contrast agent present in the liver was below method detection limits. Th e prolonged R2* enhancement was believed to be a result of the compart-mentalisation of the particle breakdown products within the liver cells.
Finally, the liver clearance and degradation rates of the fi ve diff erent iron oxide particles in rat liver were evaluated. Th e results revealed that for materials with similar iron oxide cores and particle sizes, the rate of liver clearance was aff ected by the coating material present. Materials with similar coating, but diff erent sizes, exhibited similar rates of liver clearance.
In conclusion, the results of this work strongly suggest that coating material of the iron oxide par-ticles may contribute signifi cantly to the rate of iron oxide particle clearance and degradation in rat liver cells.
Key words: Magnetic Resonance Imaging; contrasts agents, iron oxide particles, metabolism, relaxa-tion mechanisms.Karen Briley Saebo, Department of Oncology, Radiology and Clinical Immunology, Akademiska sjukhuset, Uppsala University, SE-751 85 Uppsala, Sweden
© Karen Briley Saebo 2004
ISSN 0282-7476ISBN 91-554-5998-6urn:nbn:se:uu:diva-4311 (http://urn.kb.se/resolve?urn=urn:nbn:se:uu:diva-4311)

˜
To my loving husband Jan Eystein.
To love someone deeply gives you strength. Being loved by someone deeply gives you courage.
˜
5
ORIGINAL PAPERS
I. Characterisation of Th e Relaxation and Magnetic Properties of Five Diff erent Iron Oxide Particles: Evaluation of T1-enhancing Effi cacy.
Karen Briley-Saebo, Yves Gossuin, Alan Roch, Håkan Ahlström, Robert N Muller and Atle Bjornerud
Submitted MRM
II. Hepatic Cellular Distribution and Degradation of Iron Oxide Nanoparticles Fol-lowing Single Intravenous Injection in Rats: Implications For Magnetic Resonance Imaging.
Karen Briley-Saebo, Atle Bjornerud, Derek Grant, Håkan Ahlström, Trond Berg and Grete Mork Kindberg
In press Cell Tissue Res. 2004
III. Long-Term Imaging Eff ects in Rat Liver Following a Single Injection of an Iron Oxide Nanoparticle Based MR Contrast Agent.
Karen Briley-Saebo, Svein Olaf Hustvedt, Anita Haldorsen and Atle Bjornerud Accepted JMRI 2004
IV. Temporal Changes in Liver R2* Values of Various Superparamagnetic Iron Oxide Contrast Agents: Importance of Hydrated Particle Size and Coating Material on Th e Rate of Liver Clearance.
Karen C. Briley-Saebo, Lars O. Johansson, Svein Olaf Hustvedt, Anita Haldorsen, Atle Bjornerud and Håkan Ahlström
Submitted Invest Radiol

6
CONTENTS
Abstract ......................................................................................................3
Original papers ............................................................................................5
1. Abbreviations ........................................................................................8
2. Introduction ....................................................................................... 11Summary ................................................................................................................112.1 Basics of MRI ........................................................................................... 122.1.1 Historical Overview .................................................................................. 122.1.2 Classical Physics of MRI ............................................................................132.1.3 Magnetic Properties of Molecules .............................................................172.1.4 Contrast Agents and Measurement of Relaxation Times .......................... 242.1.5 Relaxation of water protons by iron oxide particles: Relaxation theory ......352.2 Iron metabolism ....................................................................................... 462.2.1 Transferrin ................................................................................................ 482.2.2 Ferritin ......................................................................................................512.2.3 Th e Liver and Cells of the RES ..................................................................53
3. Study Aims ......................................................................................... 573.1 Main Aims ................................................................................................573.2 Specifi c Aims .............................................................................................573.3 Purpose of individual studies .....................................................................573.3.1 Study I .......................................................................................................573.3.2 Study II .................................................................................................... 583.3.3 Study III ................................................................................................... 583.3.4 Study IV ................................................................................................... 58

7
4. Methods .............................................................................................. 594.1 Test systems ...............................................................................................594.2 Ex vivo Models (All studies) .......................................................................594.3 Animal Models (Studies II, III and IV) .....................................................614.4 Contrast Agents ........................................................................................ 624.5 MR Imaging (All studies) ......................................................................... 634.6 Determination of R2* values (All studies) ................................................ 644.7 Relaxation Analysis ................................................................................... 644.8 Magnetisation and core size (Study I) ....................................................... 664.9 Particle size (Studies I and IV) .................................................................. 664.10 Total Iron determination (All studies) ...................................................... 664.11 Phantom preparation (Studies I and II) .................................................... 66
5. Results and Discussions ...................................................................... 675.1 Study I .......................................................................................................675.2 Study II .................................................................................................... 725.3 Study III ....................................................................................................765.4 Study IV ................................................................................................... 78
6. Conclusions ........................................................................................ 83
7. Acknowledgements ............................................................................. 85
8. References ...........................................................................................87
9. Colour supplement .............................................................................89

8
1. ABBREVIATIONS
List of terms and abbreviations in alphabetical order:
A Distance of closest approach between the protons and the paramagnetic metal ion
a Radius of the hydrated iron oxide particleα Angle of rotation of the magnetization vector (Greek symbol alpha)B0 Magnetic fl ux density, commonly referred to as the applied magnetic fi eldβ Bohr magneton (Greek symbol beta)C Curie constant per unit massc Concentration of the magnetic centerCA Contrast agentχ Magnetic susceptibility (Greek symbol chi)CPMG Carr-Purcell-Meiboom-Gill spin echo sequenceD Diff usion coeffi cient that is proportional to the temperature divided by the
radius of the molecule times the viscosity of the matrix.d Distance of proton from the center of the paramagnetic ion. Calculated based
on the assumption that the magnetic center is spherical<d>p Total mean hydrated particle diameterη Viscosity of the liquid (Greek symbol eta)ex vivo Tissue analyzed after removal from the bodyFFE Fast fi eld echo sequences. A vendor specifi c term for gradient echo (GRE)
sequence FID Free Induction Decayγ Gyromagnetic ratio of the proton (Greek symbol gamma)GRE Gradient echo sequenceH Applied magnetic fi eldin vivo Tissue in the living organismIR Inversion recovery sequenceJA Ayant spectral density functionJF Freed spectral density functionk Boltzmann constant = 1.3181x10⁻²³ JK-1
KV Anisotropy energy often defi ned as KV where K is the anisotropy constant and V is the crystal volume
M Macroscopic magnetization

9
NM Number of metal ions per cubic centimeter NMR Nuclear Magnetic Resonance ω0 Larmor frequency or precessional frequency of the proton (Greek symbol
omega)ωs Precession frequency of the electrons∆ω Shift in the Larmor frequency of the protons in the hydration sphereg Landè factorP Spin angular momentumP(ω) Frequency-distribution within a voxelq Number of water molecules in the hydration sphere of the paramagnetic ionr Radius of a paramagnetic moleculeR1 Longitudinal relaxation rate equal to 1/T1 (unit=1/s)r1 Dipolar longitudinal relaxivity of a contrast agent describing the increase in R1
per unit concentration of the contrast agent (unit=s-1mM-1)R2 Transverse relaxation rate equal to 1/T2 (unit=1/s) r2 Dipolar transverse relaxivity of a contrast agent describing the increase in R2
per unit concentration of the contrast agent (unit=s-1mM-1)RES Reticuloendothelial system rf Radio frequency S Electronic spin quantum numberSE Spin Echo sequenceSI Signal intensityσ2
p Variance of the fi eld distribution within the voxel (Greek symbol Sigma)σ2
Ml Variance related to the line width of the NMR spectrum of the sample tissueSPIO Superparamagnetic iron oxide particles made up of particles with aggregated
iron oxide cores (not single crystals) and <d>p greater than 50 nm.SR Saturation Recovery sequence T Absolute temperature (unit=Kelvin)Tc Transition temperature often referred to as the Curie temperature for ferromag-
netic materials and the Nèel temperature for ferrimagnetic materialsT1 Spin-lattice or longitudinal relaxation time (unit=ms) T2 Spin-spin or transverse relaxation time (unit=ms)T2* Eff ective transverse relaxation time (unit=ms)τ Time between the 180° and 90° pulsesτc Modulation of the dipolar coupling

10
τD Modulation of the relative translational diff usion time where τD = d2/3(Dwater + Dparamagnetic complex) D is the diff usion coeffi cient
τE Modulation of the scalar coupling τm Exchange correlation time describing the exchange rate of water molecules in
and out of the hydration sphere of a paramagnetic ionτN Nèel relaxation time that describes the rate of the fl ipping of electrons along the
easy anistropic axisτo Pre-exponential factor relating the anistropic energy to the Nèel relaxation
timeτr Rotational correlation time τs1 Th e electron relaxation TE Th e echo time associated with a SE sequence. TE equals 2 times the τ value or
the time between the 90° and the 180° pulses in a SE experiment.TR Repetition time or time between the 90° pulsesµ Magnetic moment µ0 Permeability of free space = 4πx10-7 H/m.<µZ> Th e resultant mean magnetization USPIO Ultrasmall iron oxide particles made up of single crystal iron oxide cores with a
total mean hydrated particle diameter that is less than 50 nmħ Planck’s constant (Latin letter wit)
11
2. INTRODUCTION
SummaryMagnetic Resonance Imaging (MRI) is a diagnostic tool used to visualize the structure (morphology) and function of intact tissue in living organisms (in vivo). Th e contrast associated with MRI is due the response of water protons to an external magnetic fi eld. Energy is applied to the protons (in the radio frequency range), exciting the water pro-tons. When the radio frequency source is removed, the water protons relax or return to a state of equilibrium. During the relaxation process energy is emitted, and it is this energy that gives the signal that is observed in MRI.
Th e relaxation of the water protons is dependent upon the local environment of the protons, so that diff erent tissue will relax at diff erent rates. Th e diff erence in relaxation rates and proton densities within the various tissues is responsible for the native soft-tis-sue contrast that is characteristic for MRI. Despite the inherent contrast of MRI, there are situations where contrast agents are required to enhance the relaxation of water pro-tons in specifi c tissues. Contrast agents may be water soluble paramagnetic complexes, or superparamagnetic particles. Most water soluble contrast agents used today are excreted intact by the kidneys and are not metabolised within the body. Superparamagnetic con-trast agents are made up of iron oxide particles that are metabolised by cells of the reticu-loendothelial system (RES). Despite the initial biodistribution of these contrast agents, a portion of the injected dose will be taken up by the RES cells of the liver. Within the liver RES cells, the iron oxide particles are degraded, and the iron from the particles eventually enters the normal iron pool of the body.
Th e eff ect of particle size on the biodistribution of iron oxide particles has been well documented. Generally, smaller particles circulate longer than larger particles and can be taken up by RES cells of the lymphatic system and bone marrow. Larger particles (> 50 nm) are generally taken up quickly by the RES cells of the liver, and have limited uptake into lymph and bone. Th e eff ect of coating material on biodistribution has also been explored in the relevant literature. If has been observed that the circulation times and cellular uptake can be manipulated by altering the coating material of small particles. However, the eff ect of coating material on liver clearance and particle degradation within RES cells has never been addressed. Prolonged liver clearance may result in decreased signal intensity over extended periods of time. Slow liver clearance may interfere with subsequent liver examinations, if methods that rely on signal enhancement are employed. Additionally, there may be safety issues related to the prolonged storage of iron within certain cell types of the liver.
Th e purpose of this thesis is to address the infl uence of iron oxide particle coating mate-rial and size on the rate of liver clearance and particle degradation using a rat model. Th e following introduction is designed to provide the theoretical background of MRI physics, relaxation, and liver metabolism that is central to this work.
12
2.1 Basics of MRI
2.1.1 Historical Overview“History is the short trudge from Adam to atom.” --Leonard Louis Levinson
Th e existence of nuclear spin was fi rst suggested by Pauli in 1924 in order to explain hyperfi ne structure in atomic spectra. Pauli’s experiments demonstrated that nuclei of diff erent elements (and diff erent isotopes of the same element) diff er in spin angular momentum. Like neutrons and electrons, protons (1H) have spin quantum numbers of ½. For nuclei other than protons, the spin angular momentum is a sum of all individual nucleons. For example, nuclei with an odd mass number exhibit half-integral spins (e.g. 1H , 13C, 17O, 19F, 23Na, 31P) and nuclei with even mass numbers, but odd charge numbers have integral spin (e.g. 14N, 2H). Nuclei with both even mass and charge numbers do not exhibit spin angular momentum (e.g. 12C, 16O, and 32S). In 1946 two American scien-tists, Felix Bloch and Edward M. Purcell, independently published the fi rst manuscripts related to the potential application of Nuclear Magnetic Resonance (NMR) (1, 2). Bloch and Purcell discovered that there is a linear relationship between the magnetic fi eld expe-rienced by nuclei with non-zero quantum spin, and the resulting angular frequency of rotation, known as the Larmor frequency. Bloch and Purcell found that when these nuclei were placed in an external magnetic fi eld they absorbed energy in the radio frequency (rf) range, and re-emitted the energy when the rf source was removed. Th is discovery was the fi rst step towards the development of Nuclear Magnetic Resonance Imaging (MRI); and both Bloch and Purcell were awarded the Nobel Prize in Physics in 1952 for these impor-tant discoveries.
Following the work of Bloch and Purcell, two groups led by Proctor and Dickinson discovered the chemical shift eff ect in 1950 (3, 4). Th e discovery of chemical shift turned NMR into a powerful analytical tool, since it was shown that the resonance frequency is dependent upon the structure or chemical environment of the nuclei. In 1953 the fi rst commercial NMR spectrometers became available and groups began experimenting with the use of linear gradients. In 1971 Damadian began experimenting with ex vivo cancer tissue and found diff erences between the relaxation properties of normal tissue and can-cer tissue (5). Damadian then went on to develop fi eld focussing NMR (FONAR) in 1972 (6). FONAR was used to selectively measure the relaxation time of tissue in vivo, and images were obtained as the patient was manually moved. As a result, Damadian was the fi rst to show that the relaxation properties of tissues may be used to diff erentiate tis-sue types (7).
In 1972 Paul C. Lauterbur submitted a manuscript to Nature describing a new imaging technique called zeugmatography. After fi rst being rejected, the manuscript was printed in Nature in March 1973 (8). Th is manuscript was entitled: “Image formation by induced local interactions: examples of employing nuclear magnetic resonance” and is considered to be the foundation of MRI. In this pioneering work, Lauterbur presented 2-dimensional
13
images of water fi lled objects. Th e images were reconstructed from a number of NMR measurements each obtained in the presence of a linear fi eld gradient applied in diff erent directions. Lauterbur was awarded the Nobel Prize in Medicine and Physiology in 2003 for his contribution to the development of MRI.
In 1974, Hinshaw building on the two-gradient concept of Lauterbur, introduced the “sensitive point” technique that utilises three alternating gradients to allow signal selec-tion by suppressing all NMR signals from defi ned areas in the object, except from areas or points where all gradient fi elds are zero (9). Later, Hinshaw developed the multiple sensi-tive point technique, which is the foundation of imaging acquisition and slice selection used in MR scanners today. In this technique a frequency encoding direction is defi ned along the sensitive line by the application of a stable gradient (10). Scanning is then per-formed by a parallel shifting of the sensitive line within selected planes. In 1977, Hinshaw published the fi rst detailed cross-sectional image of a human wrist using the multiple sen-sitive point technique (11).
Since the fi rst crude images generated in the early 1970s, MRI has grown to become a powerful tool for both diagnostic and functional imaging, with more than 20,000 MRI scanners operating worldwide. MRI is unique, in comparison to PET, SPECT or ultra-sound, in that it off ers high soft-tissue contrast combined with a fl exibility that allows for the evaluation of both morphology and function.
2.1.2 Classical Physics of MRI“All science is either physics or stamp collecting”. --Ernest Rutherford in J. B. Birks “Rutherford at Manchester” (1962)
A correct description of MRI physics relies on quantum mechanics, since quantum phys-ics is needed to describe the transition of nuclei with non-zero spin quantum numbers between diff erent energy states. However, classical physics can be used to give an ade-quate introduction into MRI theory. According to the classical model, protons (or other nuclei having non-zero spin quantum numbers) can be considered small magnets, as shown in Fig. 1.
Protons are charged particles that spin around their axis (Fig. 1). Since the motion of a charged materials results in the generation of electromagnetic fi elds, protons possess a characteristic dipolar magnetic moment (µ) that is associated with the spin angular momentum (P). In classical terms, the magnetic moment is described by the product of the gyromagnetic ratio (γ) that is unique for each nucleus and refl ects the charge number and mass number of the nuclei, and the angular momentum µ = γP. Currently, most magnetic resonance imaging (MRI) is based on proton NMR, where γ/2π =.42.6 x 106 Hz/T.
In the absence of an applied magnetic fi eld, the magnetic moment associated with an individual proton is randomly orientated in space. However, when a magnetic fi eld of strength B0 is applied in a direction defi ned as z, the individual magnetic moments associ-ated with each proton will align either parallel µ+z or anti-parallel µ-z to the applied fi eld.

14
Th e orientation of the individual magnetic moment refl ects the energy level or state of the nuclei, with parallel orientation representing the low energy state and anti-parallel orien-tation representing the high energy state. If a sample consists of many identical molecules (e.g. water), each with a magnetic nucleus of spin ½, then population of the two energy states can be estimated using Boltzmann’s equation (13):
[1]
where Nl is the number of protons in the low energy state (µ+z) and Nh is the number of protons in the high energy state (µ-z). ∆E is the energy diff erence between the two levels, T is the absolute temperature (Kelvin) and k is a constant (Boltzmann constant = 1.3181x10⁻²³ JK-1)
From Equation 1 it is evident that as the energy separation between the levels increases, the diff erence in the populations between low and high energy nuclei increases. In addi-tion, the change in energy (∆E) is proportional to the applied fi eld strength so that the population diff erence increases linearly with the applied fi eld. For proton MRI, the popu-lation diff erence between the high and low energy states (Nl/Nh) is 8x10⁻⁶ at 2.35 Tesla and 300 Kelvin. Th e NMR signal is directly related to the population diff erence defi ned by Equation 1, since it is only the small excess of nuclei aligned with the applied fi eld (Nl with µ+z) that can emit signal. As a result, more signal (or greater signal-to-noise ratios) is observed at higher applied fi eld strengths when ∆E is larger and there is a larger popu-lation diff erence. It is also apparent from Equation 1, that MRI is not a very sensitive method, since only a small population of the nuclei are able to emit a signal. Fortunately,
Nl/Nh = exp( E/kT)
Fig. 1: Classical description of the magnetic moment associated with a proton.(Colour print available in the supplement - page 89).

15
living organisms have a high natural abundance of water protons that increase the sensi-tivity of the method thereby allowing for the inherent soft-tissue contrast that is observed with proton MRI.
Th e sum of the individual magnetic moments aligned with the magnetic fi eld (based on Nl/Nh) is fi nite and is often referred to as the macroscopic net magnetization, M, of the sample. Th e macroscopic magnetization is characterised by a vector with both magni-tude, depending upon the number of protons per cubic centimetre, and a direction. Th e behaviour of the macroscopic magnetization vector may be described classically by the Bloch equations (2). Th ese equations show that the macroscopic magnetization vector M precesses or rotates about the direction of the applied magnetic fi eld. Bloch and Purcell’s experiments from 1946 revealed that there is a simple linear relationship between the magnetic fi eld, B0, experienced by protons, and the resulting angular frequency of rota-tion (precession), ω0, of the magnetization (1, 2):
[2]
where γ is the gyromagnetic ratio that is a unique constant for each nuclei possessing a spin. ω0 is the Larmor frequency and is identical to the frequency of the electromagnetic radiation associated with the possible spin energy transitions (∆E) induced by the mag-netic fi eld.
When the spin system is in a state of equilibrium the net magnetization is aligned with the applied magnetic fi eld (z-direction) with a magnitude given by Mz. Th e net mag-netization vector Mz is small compared to the applied fi eld. Bloch and Purcell showed that in a steady-state NMR experiment, the spin system (Mz) can absorb energy from radio frequency (rf) radiation (1, 2). Radio waves that oscillate at the Larmor frequency, so that the energy delivered equals ∆E (Equation 2), will cause a transition between the spins that are aligned with the applied fi eld (µ+z) to the higher energy state anti-parallel to the fi eld (µ-z). Once the rf source is removed, the spins will return to a state of equilib-rium aligned parallel to the applied magnetic fi eld. In the process of returning to a state of equilibrium, the eff ected spins will emit energy equal to ∆E. It is the emitted energy that results in the signal observed by NMR. Th e perturbation of Mz from equilibrium is therefore performed by applying an rf pulse that oscillates at the Larmor frequency of the nuclei.
Th e Bloch equations can be used to describe the motion of the magnetization vector in the presence of both the applied fi eld B0 and the rf pulse, often defi ned as B1 (2). A rotat-ing frame is often employed to help visualise the eff ect of B1 on the magnetization vec-tor Mz. In this frame of reference, one needs to imagine the x, y and z coordinate system rotating at the Larmor frequency (13). In this frame, the nuclei that are rotating at the Larmor frequency will appear static or stationary as long as magnetic fi eld is exactly equal to B0. Nuclei that are precessing at other frequencies will appear to be rotating at a rate
0 = B0

16
equal to the diff erence between their precessional frequency and the Larmor frequency. When an rf pulse is applied at the Larmor frequency, a static fi eld is created (in the rotat-ing frame) perpendicular to Bo, causing the magnetization vector Mz to rotate or precess about the B0 axis. Th e precessional frequency of this rotation is given by ω1=γB1 (note that this is the same as Equation 2, except now the spins have a frequency that is relative to B1 and not Bo). In addition, the angle of rotation (α) of the magnetization vector at time t is given by α = γB1t. Since the net magnetization is a vector, it can have components in both the xy and z planes of a three dimensional coordinate system. Following an rf pulse, the magnetization is defi ned by components of both Mz and Mxy. As the magneti-zation returns to a state of equilibrium, the component aligned with the magnetic fi eld will increase (Mz increases) and the component in the xy-plane (Mxy) will decrease, as shown in Fig. 2. When a state of equilibrium is reached Mz is at a maximum value and Mxy is zero.
Traditionally the duration of the rf pulse is used to change the angle of rotation often
Fig. 2: Magnetization after the application of an rf 90° pulse.(Colour print available in the supplement - page 89).

17
denoted as α (14). If the rf is applied so that the entire net magnetization Mz is inverted to point along the –z-axis, then a 180o pulse was applied. A 90o pulse can also be created that will cause the entire net magnetization vector Mz to point along the xy, or transverse plane. In this situation, the Mz component of the vector is zero and the Mxy component is at a maximum value. According to Faraday’s law of induction, the Mxy component of the magnetization can induce a current (at the Larmor frequency) in a coil placed on the x-axis. Th erefore, one can measure the loss of the Mxy component as a function of time after removal of the rf pulse. Th e signal induced in the coil is a free precession signal and is called the free induction decay (FID).
2.1.3 Magnetic Properties of Molecules“One of the problems in magnetism is that there are serious mathematical diffi culties in tackling parts of the subject with theories that are very realistic.”-John Crangle in Solid-State Magnetism 1991
Following the application of an rf pulse, the net magnetization is perturbed from equi-librium and is in a high energy state. In order for the net magnetization of the proton to return to equilibrium (as shown in Fig. 2), the energy within the spin system must be transferred or emitted. Due to the large magnetic moment of electrons (658 times greater than that of protons), the electron spin-orbit associated with certain atoms or molecules may absorb energy from the proton spin system, thereby inducing proton relaxation (12). Th e rate by which the magnetization returns to equilibrium along the direction of the applied fi eld, Mz, is the spin-lattice or longitudinal relaxation, and is defi ned by the lon-gitudinal relaxation time, T1, or the longitudinal relaxation rate (R1=1/T1). Th e rate by which the magnetization decays in the xy-plane, or Mxy goes to zero, is defi ned by the spin-spin or transverse relaxation time, T2, or transverse relaxation rate (R2=1/T2).
A single unpaired electron is a charged particle and therefore has angular momentum (similar to that of the proton). In addition, however, an electron in an atom may have two diff erent kinds of angular momentum, its orbital angular momentum and its spin angular momentum (15). Th ese two magnetic moments may interact (like any pair of dipoles). It this interaction that is often referred to as the spin-orbital coupling that gives rise to the magnetic properties of atoms and molecules. If the spin and orbital momenta are oriented in the same direction, then the total angular momentum (often denoted as j or j-coupling) takes the largest energy value. When the two magnetic moments are anti-parallel, or oriented in diff erent directions, the orbital and spin momenta is in the lowest energy state. Like in any other physical system, the low energy state is preferred and the energy required to cause a transition to a higher energy level is defi ned by a discrete value. Th e diff erence between spin-orbital energy levels is known as Zeemann splitting, and is important for the relaxation of water protons interacting with the electron spin orbitals of nearby molecules or atoms (15). In addition to the spin-orbital coupling, the electrons in an atom may also interact with each other (paired) or they may be alone. Th e magnetic moments of paired electrons are opposed and the total magnetic moment associated with

18
the pair is zero. If only paired electrons are present, then the material will be diamag-netic (16). When placed in an external magnetic fi eld, diamagnetic materials will try to oppose the fi eld. Traditionally, the response of a material to an applied fi eld is defi ned by the magnetic susceptibility (16):
[3]
where χ is the magnetic susceptibility of the molecules, H is the applied magnetic fi eld, and M is the net magnetization of the material. It should be noted, however, that the magnetic fi eld used to determine the magnetic susceptibility of various materials is dif-ferent from the magnetic fl ux density B0 (unit: Tesla) from Equation 2. Th e magnetic fi eld density B0 is commonly referred to as the ‘fi eld strength’ in MRI literature and is the magnetic induction that is proportional to the magnetic fi eld: B = µ0(H+M) ≈ µ0H where µ0 is the permeability of free space = 4πx10-7 H/m.
Th e magnetic susceptibility value for diamagnetic materials is small and negative. Most tissue, biological fl uids, and proteins are diamagnetic, so that the relaxation times obtained in pure water or tissue solutions are long (T1 and T2 of pure water is approxi-mately 4 seconds).
For atoms that have unpaired electrons located in their outer spin-orbitals, the mag-netic moment is non-zero and when placed in an external magnetic fi eld these materials acquire a magnetization (in a similar fashion as that observed for protons). For example gadolinium, (Gd3+) has seven unpaired electrons in the 4f orbital, dysprosium (Dy3+) has 5 unpaired electrons in the 4f orbital, and iron (Fe3+) has 5 unpaired electrons in the 3d orbital (12). Th e molar bulk magnetic susceptibilities of gadolinium and dysprosium ions measured at room temperature are 2.54 x 10⁻² and 4.94 x 10⁻² cm3mol-1 (19).
Paramagnetism is generally defi ned by the following two magnetic properties: First, a positive magnetic susceptibility that is directly proportional to the external fi eld (16). Th is means that the induced magnetization increases or decreases linearly with the applied magnetic fi eld. Second, in the absence of an external magnetic fi eld the individual mag-netic moments are randomly oriented so that the net resultant magnetization is zero. Th erefore, paramagnetic materials have no remenant magnetization.
When individual magnetic moments do not interact, every single spin will react to an external magnetic fi eld, independently of neighbouring spins. Th e spins will always try to orient themselves in the direction of the external magnetic fi eld, since this is the low energy state. However, thermal shaking or the thermal energy of the system acts as sort of an entropy factor in that it tries to force the spin back into a random orientation. Since thermal energy is directly related to the temperature of the system, the observed suscep-tibility (that describes the net magnetization as a function of the external fi eld) becomes dependent upon the temperature as described by the Curie Law (16):
M= H

19
[4]
where χ is the susceptibility as described in Equation 3, C is curie constant per unit mass, and T is temperature.
At low temperatures paramagnetism is never observed. Th is is due to the cooperative behaviour between the spins (or spin-coupling) below a specifi ed transition temperature, defi ned as Tc. Below the transition temperatures of paramagnetic materials, the interac-tions between spins (or spin-coupling) can result in one of three diff erent types of mag-netism: ferromagnetism, ferrimagnetism and antiferromagnetism.
In ferromagnetic systems, the spins are aligned in the same direction following place-ment into an external fi eld. In addition, strong spin-coupling persists after the external magnet is removed, resulting in permanent magnetism of the material or remenant mag-netization. Above the transition temperature, Tc (often referred to as the Curie temper-ature of ferromagnetic material) the system becomes paramagnetic with susceptibility defi ned by the Curie-Weiss law (16):
[5]
where χ is the susceptibility as described in Equation 3, C is curie constant per unit mass, and T is temperature, and Tc is the transition or Curie temperature. Metallic iron is ferromagnetic at all temperatures below 1000 Kelvin.
Ferrimagnetism results when paramagnetic materials are placed in an external fi eld at temperatures below the transition temperature causing, some of the spins to aligned with the applied fi eld (S1 position) and some to aligned against the fi eld in the high energy state (S2 position). For ferrimagnetic material, the diff erence between the spin popula-tions in the S1 and S2 energy levels is not equal, so that a net resultant magnetization is present. Th e spin-coupling is not very strong, so that when the external magnetic fi eld is removed, thermal shaking causes the spins to return to a random state. Th us, there is no remenant or permanent magnetization present. Above the transition temperature the system becomes paramagnetic and the evolution of the susceptibility may be defi ned by Curie-Weiss Law (Equation 6). However, for ferrimagnetic systems, the transition tem-perature is often referred to as the Nèel temperature. Th e Nèel temperature is the same as the Curie temperature used to describe ferromagnetism. All iron oxide particles based on magnetite are either ferro- or ferrimagnetic at physiological temperatures (transition temperature is 850 Kelvin) (16).
If there are equal populations in the S1 and S2 energy states following application of an external fi eld below the transition temperature, then the system is antiferromagnetic and there is no resultant net magnetization. Above the transition temperature the system is
=C/(T - Tc)
=C/T

20
paramagnetic and the susceptibility may be described by (16):
[6]
where χ is the susceptibility as described in Equation 3, C is curie constant per unit mass, and T is temperature, and Tc is the transition = Curie temperature = Nèel tempera-ture. Some important biological materials are antiferromagnetic (for example deoxyhae-moglobin and ferritin).
In order to fully understand superparamagnetism, the concept of anisotropy must be addressed. If a large number of paramagnetic ions are arranged in an orderly fashion (as in a crystal lattice) the spins will interact (via spin-coupling) so that when placed in an external fi eld, the resultant magnetization is no longer isotropic. Anisotropy, therefore, describes the fact that the coupled-spins may align in more than one direction relative to the external fi eld (15-18). Th ese directions are often referred to as the anistropic axes and are determined by the symmetry of the crystal. Th e diff erence between isotropic and ani-stropic systems is that in isotropic materials all spins (or individual magnetic moments) align in the z direction (with the fi eld), and in anistropic materials spins can assume other directions relative to the fi eld. For crystals of magnetite there are six possible anisotropic axes (16). If it were possible to freeze a crystal of magnetite and measure the energy along the six anistropic axes (referred to as the anistropic energy), the result would be six dif-ferent energy values, with lowest energy obtained in the “easy” direction that is parallel to the external fi eld, and the highest energy obtained perpendicular to the external fi eld. Normally, only the “easy” anisotropic axis is important, since in solution the movement or motion of the crystals causes an averaging of the anistropic energy.
For materials made up of large crystals (diameters greater than 14 nm), the spins are divided and aligned within small magnetic domains called Weiss-domains (16). Th e direction of individual spins in the various domains is random prior to exposure to an external fi eld. Once exposed to an external fi eld, all the spins adopt the same direction along the anisotropic axes; the anisotropic energy is at a minimum value and the system may be considered isotropic. Th is explains why ferromagnetic crystals of magnetite must be magnetised by placement into an external fi eld in order to gain remenance or perma-nent magnetism.
If the crystals of magnetite become smaller then the Weiss-domains then superpara-magnetism may be observed, as shown in Fig. 3. In order for the spins to move from one anistropic axes to another requires the input of energy that is equal to the desired transi-tion. Th e anisotropy energy is often referred to as KV and is proportional to the follow-ing physical and chemical properties of the crystal (17, 18): 1) Th e larger the volume (or crystal size) the greater the values of KV. 2) Th e ions making up the crystal infl uence KV so that crystals made of materials other than Fe(II) and Fe(III), as in magnetite, will have diff erent energies. 3) Th e shape of the crystal infl uences KV, with energy increasing as
=C/(T + Tc)

21
the crystals become less spherical. 4) Th e surface of the crystal eff ects KV since the diff er-ent spin-orbital couplings can change the symmetry at the boarder of the crystal. Th ere-fore, the coating material of iron oxide particles may be important if the layer of coating directly at the surface of the particles is diff erent. Alterations in the coating further away from the surface are not expected to infl uence KV. 5) Th e distance between various crys-tals infl uences the KV since crystals in close proximity to each other (as in aggregates) may allow interactions between the spins resulting in dramatic increases of KV.
If we only consider the fl ipping of the spins (or magnetic moment) along the easy axis (from parallel to antiparallel relative to the external fi eld) then the rate of the fl ipping is defi ned by the Nèel relaxation time, τN, and is a result of the thermal agitation of the crystals (18). At low temperatures, the system does not have enough energy to make the transition from parallel to antiparallel, and the spins become locked along the anistropic axis. Th is is the transition temperature shown in Equation 5 and is referred to as the Nèel temperature for ferrimagnetic materials, and the Curie temperature for ferromagnetic
Fig. 3: Superparamagnetic crystals. Th e anisotropy energy, E=KV, increases as the spins move away from the easy axis parallel to the external fi eld. Fig. courtesy of Dr. Alan Roch, University of Mons- Hainut, Belgium.(Colour print available in the supplement - page 90).

22
materials. For practical applications, the systems are always above the transition tem-perature at physiological temperatures. Th erefore, the rate of fl ipping or fl uctuation of the spins is critical for the relaxation properties of small iron oxide particles, especially in the low to mid-fi eld frequency range. Th e Nèel relaxation time, τN, may be expressed as (18):
[7]
where K is the anisotropy constant, V is the crystal volume (proportional to the radius of the crystal cubed) and τo is the pre-exponential factor.
From Equation 7 it is evident that as the crystal volume decreases the exponential term goes to 1, and the pre-exponential factor becomes increasingly important. Note that the pre-exponential term is not a constant value and is dependent upon the spin-orbital cou-pling of the system. For large crystals, however, the Nèel relaxation time is very long, so that the magnetic moment does not fl ip, and is essentially locked along the easy anistropic axis. For small crystals (< 6 nm in diameter) the transitions are fast and on the order of nanoseconds. When small ferrimagnetic crystals are in aqueous solution the fl uctuations are modulated not only by the Nèel relaxation time, but also by the rotation of the crys-tals. Th e rotation time, τr, of the spin system is given by:
[8]
where a is the radius of the particle, η is the viscosity of the liquid, T is the temperature and k is the Boltzmann constant. In summary there are two factors that cause re-orienta-tion of the anisotropy: the fl uctuation of the spins as defi ned by τN, and the rotation of the spins as defi ned by τr. If the Nèel relaxation times are long, then the spins may still re-orient along the anistropic axes if the rotation is adequate (1/ τr small so that a is small and T is large). For a system of superparamagnetic crystals the macroscopic or resultant magnetization, M, may be determined by (16):
[9]
where L(α)=coth(α) –(1/α) and α=µBo/kT. µ is the total magnetic moment of the crys-tal, Bo is the external magnetic fi eld, k is the Botlzmann constant, T is temperature and Msat defi nes the fi eld at which the magnetization is locked or saturated along the easy axis.
Based on the discussions above, it is possible to defi ne superparamagnetism based on the magnetic moment of the crystal (which is much greater than the individual magnetic moments associated with the paramagnetic ions that make up the crystal) and by the fact
M = Msat · L( )
N = o e(KV/kT)
r = 4 a3 /3kT

23
that in the absence of the magnetic fi eld, the mean magnetic moment of the crystal is zero (due to averaging caused by the Nèel relaxation and rotation of the crystal lattice). As a result, the separation between superparamagnetism and ferromagnetism for iron oxide particles is primarily related to the size and structure of the crystal lattice. Fig. 4 shows that the anistropic energy is reduced for small crystal systems.
Superparamagnetic iron oxide crystals of magnetite with core sizes smaller than a Wiess domain exhibit low anistropic energy compared to particles composed of larger iron oxide cores. As a result, the energy barrier that allows individual magnetic moments to align in diff erent anisotropy directions is low for small iron oxide particles. As a result, the prob-ability of fi nding spins in diff erent anistropic directions is greater for small particle when the energy required to move the spins away from the easy axis is relatively small as shown Fig. 4. Th e high probability of fi nding spins in other anistropic directions (non-easy axes) greatly infl uences the low fi eld relaxation properties of small iron oxide particles.
Fig. 4: Probability of fi nding the anistropic in energy as function of direction.Figure courtesy of Dr. Alan Roch, University of Mons- Hainut, Belgium.(Colour print available in the supplement - page 90).
24
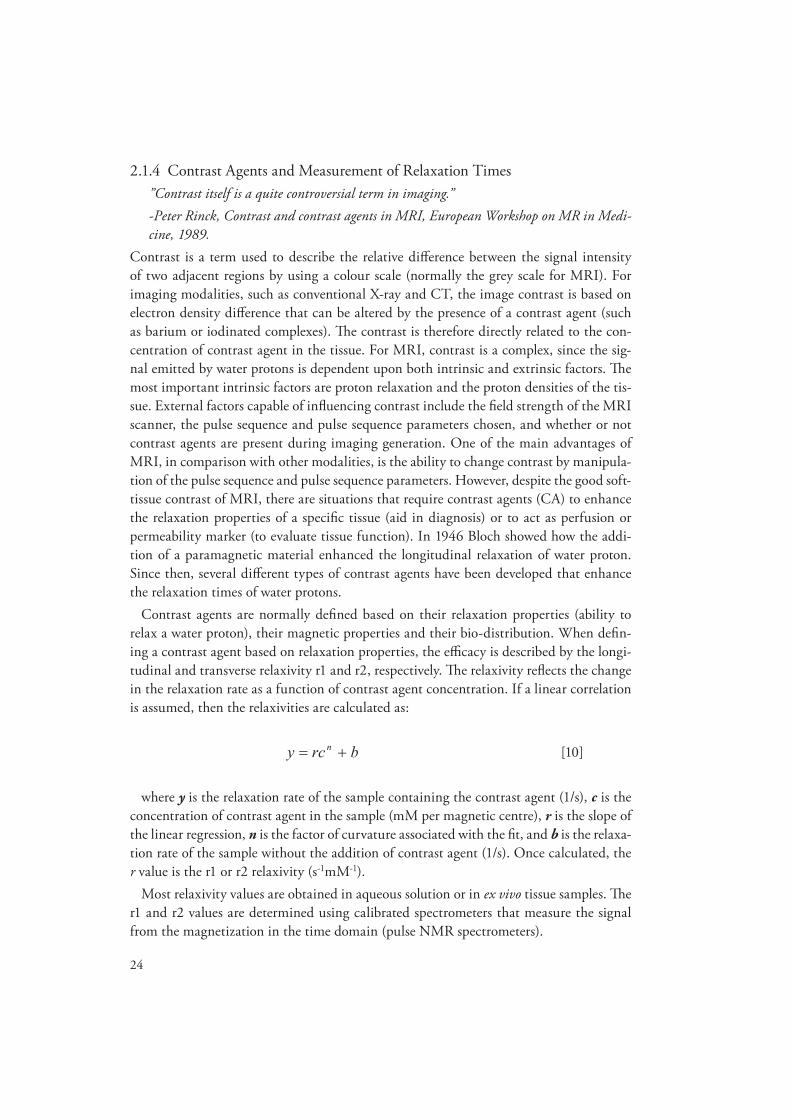
2.1.4 Contrast Agents and Measurement of Relaxation Times”Contrast itself is a quite controversial term in imaging.”-Peter Rinck, Contrast and contrast agents in MRI, European Workshop on MR in Medi-cine, 1989.
Contrast is a term used to describe the relative diff erence between the signal intensity of two adjacent regions by using a colour scale (normally the grey scale for MRI). For imaging modalities, such as conventional X-ray and CT, the image contrast is based on electron density diff erence that can be altered by the presence of a contrast agent (such as barium or iodinated complexes). Th e contrast is therefore directly related to the con-centration of contrast agent in the tissue. For MRI, contrast is a complex, since the sig-nal emitted by water protons is dependent upon both intrinsic and extrinsic factors. Th e most important intrinsic factors are proton relaxation and the proton densities of the tis-sue. External factors capable of infl uencing contrast include the fi eld strength of the MRI scanner, the pulse sequence and pulse sequence parameters chosen, and whether or not contrast agents are present during imaging generation. One of the main advantages of MRI, in comparison with other modalities, is the ability to change contrast by manipula-tion of the pulse sequence and pulse sequence parameters. However, despite the good soft-tissue contrast of MRI, there are situations that require contrast agents (CA) to enhance the relaxation properties of a specifi c tissue (aid in diagnosis) or to act as perfusion or permeability marker (to evaluate tissue function). In 1946 Bloch showed how the addi-tion of a paramagnetic material enhanced the longitudinal relaxation of water proton. Since then, several diff erent types of contrast agents have been developed that enhance the relaxation times of water protons.
Contrast agents are normally defi ned based on their relaxation properties (ability to relax a water proton), their magnetic properties and their bio-distribution. When defi n-ing a contrast agent based on relaxation properties, the effi cacy is described by the longi-tudinal and transverse relaxivity r1 and r2, respectively. Th e relaxivity refl ects the change in the relaxation rate as a function of contrast agent concentration. If a linear correlation is assumed, then the relaxivities are calculated as:
[10]
where y is the relaxation rate of the sample containing the contrast agent (1/s), c is the concentration of contrast agent in the sample (mM per magnetic centre), r is the slope of the linear regression, n is the factor of curvature associated with the fi t, and b is the relaxa-tion rate of the sample without the addition of contrast agent (1/s). Once calculated, the r value is the r1 or r2 relaxivity (s-1mM-1).
Most relaxivity values are obtained in aqueous solution or in ex vivo tissue samples. Th e r1 and r2 values are determined using calibrated spectrometers that measure the signal from the magnetization in the time domain (pulse NMR spectrometers).
brcy n

25
Longitudinal relaxation, T1Following the application of an rf pulse, the time that is required for the net magnetiza-
tion Mz to reach a state of equilibrium is defi ned by the spin-lattice or longitudinal relaxa-tion time, T1. Starting from zero magnetization in the +z direction, the z magnetization will increase to 63% of its maximum value with a time of T1.
Any change in Mz is accompanied by an energy fl ow between the proton spin system and other degrees of freedom (electron spin-orbitals) in nearby molecules of the matrix known as the lattice. In tissues, the lattice is made up of the random fi elds that are gener-ated by the magnetic moment of protons due to thermal motion of the molecules. Interac-tion of the spins with these fi elds results in a stimulated emission of energy (equal to ∆E in Equation 1) with a gradual recovery of the longitudinal component of the magnetiza-tion, Mz. Since all biological tissues are made up of a variety of molecules, the T1 values of tissue will be diff erent, as shown in Fig. 5. From this fi gure it is apparent that the con-trast, or diff erence in T1 values between tissues, is dependent upon the repetition time (TR) used to generate the image. If the environment is heterogeneous, then the T1 value obtained will refl ect the average properties of the material, and multi-exponential recov-
Fig. 5: Relative signal intensity (SI) observed for three tissues (CSF, grey and white brain matter) with diff erent T1 relaxation times. Th e contrast, or diff erence in T1 values, is dependent upon the TR used. Figure courtesy of Atle Bjornerud.
26
ery of the longitudinal magnetization may be observed. In addition, since the net mag-netization M is a vector, the magnetization will always have components of both Mz and Mxy following the application of a 90° rf pulse (or any pulse less than180°). Th erefore, T1 and T2 can be considered interrelated processes, with dephasing of the magnetization in the xy-plane and recovery in the z direction. In all matrices (e.g. tissues, blood, plasma, ect.) except pure water, the decay of Mxy occurs faster than the recovery of Mz so that T2 is always shorter than T1.
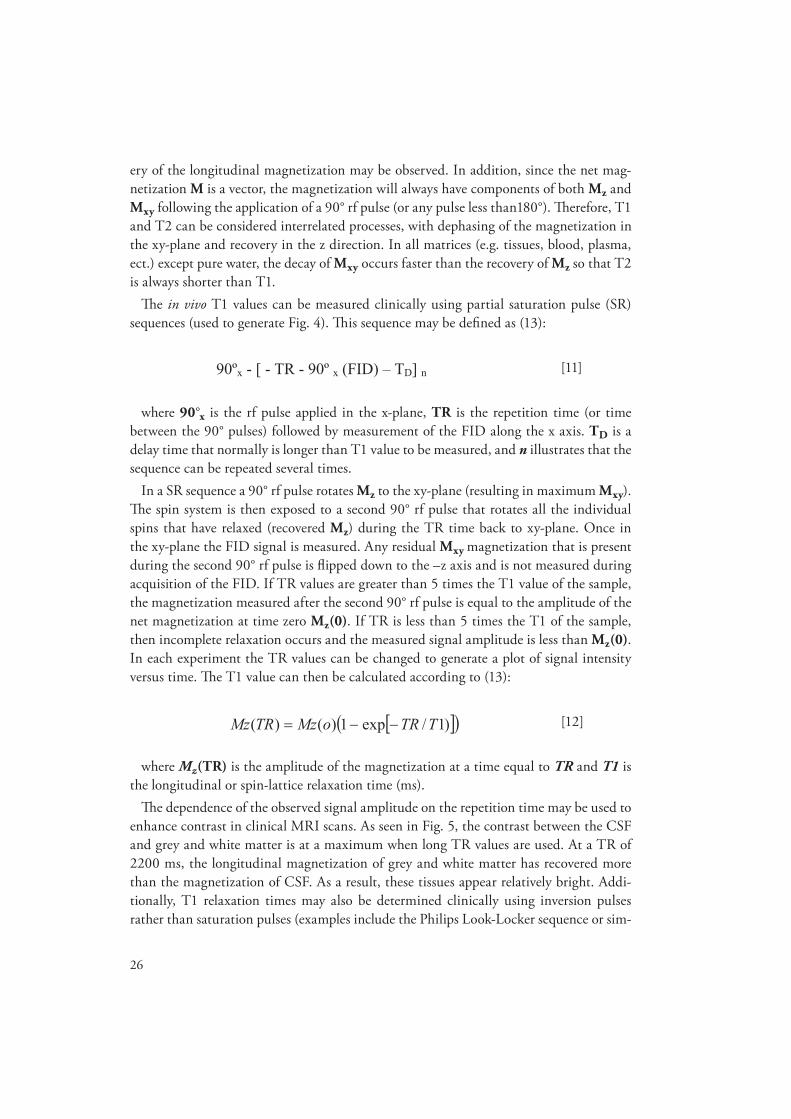
Th e in vivo T1 values can be measured clinically using partial saturation pulse (SR) sequences (used to generate Fig. 4). Th is sequence may be defi ned as (13):
[11]
where 90°x is the rf pulse applied in the x-plane, TR is the repetition time (or time between the 90° pulses) followed by measurement of the FID along the x axis. TD is a delay time that normally is longer than T1 value to be measured, and n illustrates that the sequence can be repeated several times.
In a SR sequence a 90° rf pulse rotates Mz to the xy-plane (resulting in maximum Mxy). Th e spin system is then exposed to a second 90° rf pulse that rotates all the individual spins that have relaxed (recovered Mz) during the TR time back to xy-plane. Once in the xy-plane the FID signal is measured. Any residual Mxy magnetization that is present during the second 90° rf pulse is fl ipped down to the –z axis and is not measured during acquisition of the FID. If TR values are greater than 5 times the T1 value of the sample, the magnetization measured after the second 90° rf pulse is equal to the amplitude of the net magnetization at time zero Mz(0). If TR is less than 5 times the T1 of the sample, then incomplete relaxation occurs and the measured signal amplitude is less than Mz(0). In each experiment the TR values can be changed to generate a plot of signal intensity versus time. Th e T1 value can then be calculated according to (13):
[12]
where Mz(TR) is the amplitude of the magnetization at a time equal to TR and T1 is the longitudinal or spin-lattice relaxation time (ms).
Th e dependence of the observed signal amplitude on the repetition time may be used to enhance contrast in clinical MRI scans. As seen in Fig. 5, the contrast between the CSF and grey and white matter is at a maximum when long TR values are used. At a TR of 2200 ms, the longitudinal magnetization of grey and white matter has recovered more than the magnetization of CSF. As a result, these tissues appear relatively bright. Addi-tionally, T1 relaxation times may also be determined clinically using inversion pulses rather than saturation pulses (examples include the Philips Look-Locker sequence or sim-
)1/exp1)()( TTRoMzTRMz
90ºx - [ - TR - 90º x (FID) – TD] n

27
ilar magnetization prepared rapid GRE sequences from other vendors). Analytical spectrometers also use inversion-recovery (IR) sequences for the determi-
nation of T1. Th e advantages of using IR sequences are related to gains in accuracy and precision. In the IR sequence a 180° pulse is applied and the net magnetization is rotated to the –z direction. No signal is observed as the spins return to a state of equilibrium, since no magnetization is produced in the xy direction. However, at any time τ (known as the inversion time, TI) following the 180° pulse, the state of the magnetization can be monitored by applying a 90° pulse (known as the read pulse). Th e IR pulse sequence can be summarized as (13):
[13]
where τ is time between the 180° and 90° pulses (TI), the signal of the FID is read immediately after the 90° pulse, TD is a delay time (normally fi ve times longer than T1 to be measured), and n illustrates that the sequence can be repeated several times.
A 180° pulse is succeeded only by spin-lattice relaxation. Th e experiment is repeated several times by changing the time τ between the 180° and 90° pulses and measuring the signal amplitude. From these recovery curves the T1 value is calculated as:
[14]
Whereis the signal amplitude of the magnetization in the z direction at time �, is the amplitude of the net magnetization in the z direction at time zero, � is the time between the 180° and 90° pulses, and T1 is the longitudinal or spin-lattice relaxation time.Transverse relaxation, T2 Th e loss of signal observed in the FID is a result of spin dephasing. Immediately follow-ing a 90° rf pulse (time=0 after the rf pulse is removed) all individual spins precess at the same frequency (equal to ω1) and Mxy is at a maximum value (Fig. 2). As the time after removal of the rf pulse increases, the individual spins start to loose their phase coher-ence. Phase coherence means that all individual spins rotate or precess at the same ω1 frequency. Th e loss of phase coherence, called dephasing, is primarily due to the fol-lowing two eff ects: First, other spins and local magnetic fi elds generated by macromol-ecules in the tissue (Bm) alter the magnetic fi eld experienced by diff erent individual spins as they randomly diff use through the endogenous Bm fi elds. Th e precessional frequen-cies of these spins (ωm) are no longer equal to ω1 and are now precessing at a frequency ωm=γBm. Since the precessional frequency of each spin is randomly changed, there is a loss of phase coherence (dephasing), and the net Mxy transverse magnetization decays at a rate defi ned by the spin-spin or the dipolar transverse relaxation time T2. Th e T2 values are measured in milliseconds (ms) and are usually on the order of 50 to 200 ms, depend-
[180º - - 90º (FID) – TD] n
)1/exp(21)0()( TMzMz

28
ing upon the sample measured and the experimental conditions (e.g. type of tissue, pres-ence of a contrast agent, and/or pulse sequence parameters used). Second, inhomogenei-ties in the macroscopic magnetic fi eld in the sample (Bs) cause an increase in the rate of spin dephasing, and thereby a reduction in the T2 values. Macroscopic variations in the magnetic fi eld may occur due to diff erences in the magnetic properties within the tissue (susceptibility diff erences), or due to systematic fi eld inhomogenities within the external applied fi eld Bo, or within the rf coil B1. Spin dephasing occurs when the magnetic fi eld is not constant over the normal diff usion distance of the proton (or spins). As a result, the individual spins that randomly diff use into Bs will precess at frequencies that are not equal to ω1, and a loss of phase coherence is observed. Th e reduction in the Mxy magneti-zation by inhomogeneous macroscopic fi elds is called T2* and is known as T2*-eff ects or susceptibility eff ects. T2* decay is normally much faster than the dipolar T2 decay. T2*-eff ects refl ect the net loss of Mxy magnetization and are dependent upon both dipolar T2 relaxation (discussed in the next chapter), and the inhomogeneous macroscopic fi elds as described by (13):
[15]
where γ∆Bs is the spread in the Larmor frequencies due to the fi eld inhomogenities in the sample, over then normal diff usion distance of the proton within a specifi ed time frame (normally the echo time, TE, of the sequence). 1/T2 is the dipolar spin-spin transverse relaxation time that is characteristic of the magnetization decay of the individual spins without any fi eld inhomogenities. If fi eld inhomogenities were absent, then T2* would equal T2.
In 1950 Hahn discovered a method of measuring dipolar T2 values by reducing the eff ect of the applied fi eld inhomogenities on spin coherence. His discovery was known as the Hahn echo, and was later expanded into the spin-echo (SE) sequences that are used today. SE sequences are used either to accurately measure T2 values by spectroscopy methods, or utilised in MRI to weight the observed images with respect to T2 (by mini-mizing T2* eff ects). Th e MRI SE pulse sequence is currently the most commonly used pulse sequence for clinical diagnosis.
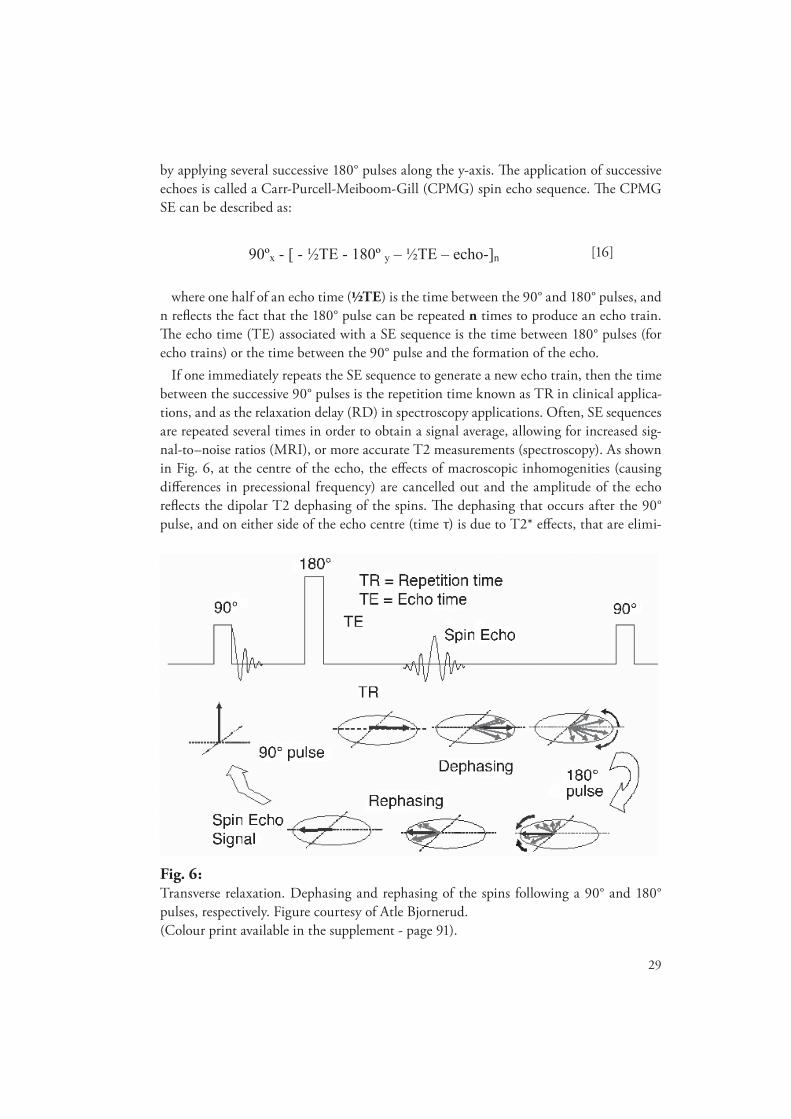
Th e spin echo sequence is described by a 90° pulse that moves the magnetization to the xy-plane and generates Mxy . After the 90° pulse a 180° pulse is applied that refocuses the spins that have dephased due to macroscopic fi eld inhomogenities. Th e 180° pulse is applied along the y-axis after a time τ, following the 90° rf pulse, as shown in Fig. 3. Th e 180° pulse (often referred to as the refocusing pulse) has the eff ect of rotating all indi-vidual magnetizations by 180°, and refl ecting them into the yz-plane. Any magnetization along the z direction is inverted to the –z direction and does not produce signal. Since the spins continue to move in the same direction after the 180° pulse is applied, the spins will refocus and be in phase in the y-direction after a time τ. Th e process can be repeated
1/T2* = 1/T2 + Bs
29
by applying several successive 180° pulses along the y-axis. Th e application of successive echoes is called a Carr-Purcell-Meiboom-Gill (CPMG) spin echo sequence. Th e CPMG SE can be described as:
[16]
where one half of an echo time (½TE) is the time between the 90° and 180° pulses, and n refl ects the fact that the 180° pulse can be repeated n times to produce an echo train. Th e echo time (TE) associated with a SE sequence is the time between 180° pulses (for echo trains) or the time between the 90° pulse and the formation of the echo.
If one immediately repeats the SE sequence to generate a new echo train, then the time between the successive 90° pulses is the repetition time known as TR in clinical applica-tions, and as the relaxation delay (RD) in spectroscopy applications. Often, SE sequences are repeated several times in order to obtain a signal average, allowing for increased sig-nal-to–noise ratios (MRI), or more accurate T2 measurements (spectroscopy). As shown in Fig. 6, at the centre of the echo, the eff ects of macroscopic inhomogenities (causing diff erences in precessional frequency) are cancelled out and the amplitude of the echo refl ects the dipolar T2 dephasing of the spins. Th e dephasing that occurs after the 90° pulse, and on either side of the echo centre (time τ) is due to T2* eff ects, that are elimi-
90ºx - [ - ½TE - 180º y – ½TE – echo-]n
Fig. 6: Transverse relaxation. Dephasing and rephasing of the spins following a 90° and 180° pulses, respectively. Figure courtesy of Atle Bjornerud.(Colour print available in the supplement - page 91).

30
nated when the echo amplitudes are used to calculate T2. Th e amplitude of successive spin echoes decays exponentially, and the dipolar T2
value(s) can be calculated as a function of time, t, according to (13):
[17]
where My(t) is the magnetization in the y plane at a given time t, My(0) is the ampli-tude at time zero, and T2 is the transverse relaxation time. Equation 17 describes a mono-exponential decay of the transverse magnetization. However, if diff erent water protons in the sample experience diff erent microscopic or local magnetic fi elds during a given echo time, then the decay is no longer mono-exponential, and multi-exponential fi tting func-tions should be employed.
As mentioned previously, the decay of the net Mxy magnetization can be measured by placing a coil on the x-axis and measuring the FID. In Fourier Transform (FT) NMR, the T2* values can also be determined directly from the line width of the proton peak obtained in the frequency spectra. It is also possible to determine the T2* of in vivo tis-sue using commercially available MRI scanners. Th e 1/T2* relaxation rate (R2*) may be quantifi ed using gradient echo (GRE) double echo, or multiple echo sequences. GRE sequences use initial rf pulses that are less than 90° and echoes are formed by gradient switching. Th is method enables the use of very short TE and TR times that are required to evaluate the T2* in tissue.
If the decay of the net Mxy magnetization is assumed to be mono-exponential, then R2* is then given by (20):
[18]
where SI(TE1) and SI(TE2) are the measured signal intensities at the fi rst echo time TE1 and the second echo TE2, respectively and ∆TE = TE2-TE1. Th e signal intensi-ties (SI) can be measured from a region of interest (ROI), determined after the image is obtained. Bio-distribution of contrast agentsCurrently contrast agents can be placed in one of fi ve groups, based on their bio-distri-bution: I) Low molecular weight, water soluble materials that distribute into the extra-cellular space and are primarily renally excreted via glomular fi ltration with limited bio-transformation. II) Water soluble materials that have some degree of interaction with the endogenous materials of blood, resulting in increased r1 effi cacy. Th ese materials are primarily renally excreted with limited uptake by the cells of the RES. III) Intravascular particulate contrast agents that are eliminated or degraded by the cells of the RES. IV) Seconardy bio-distribution mechanisms that rely on the contrast agents being seques-
TETESITESIR /
)2()1(ln*2
)2/exp()0()( TtMytMy

31
tered into specifi c cells or tissue, using passive targeting mechanisms. Th is includes pas-sive targeting due to variations in excretion kinetics (for low molecular weight materials) and passive targeting of particles into macrophages. V) Contrast agents that are actively targeted to specifi c cells or tissues.
Most paramagnetic based contrast agents are water soluble extra-cellular agents made from the lanthanide metals gadolinium (Gd3+), manganese (Mn2+) and dysprosium (Dy3+). Although gadolinium and manganese agents are currently on the market, dys-prosium based agents have been tested for various indications, but are not commercially available. Gadolinium and dysprosium metal ions are quite toxic if administered as free metal ions. As a result, these materials are chemically linked to carrier molecules that can safely transport them out of the body without any signifi cant bio-transformation. Th ese agents are eliminated intact by renal excretion so that the half-life of the agent in the blood is determined by the glomerular fi ltration rate. Th e carrier molecule is known as the ligand or chelating agent.
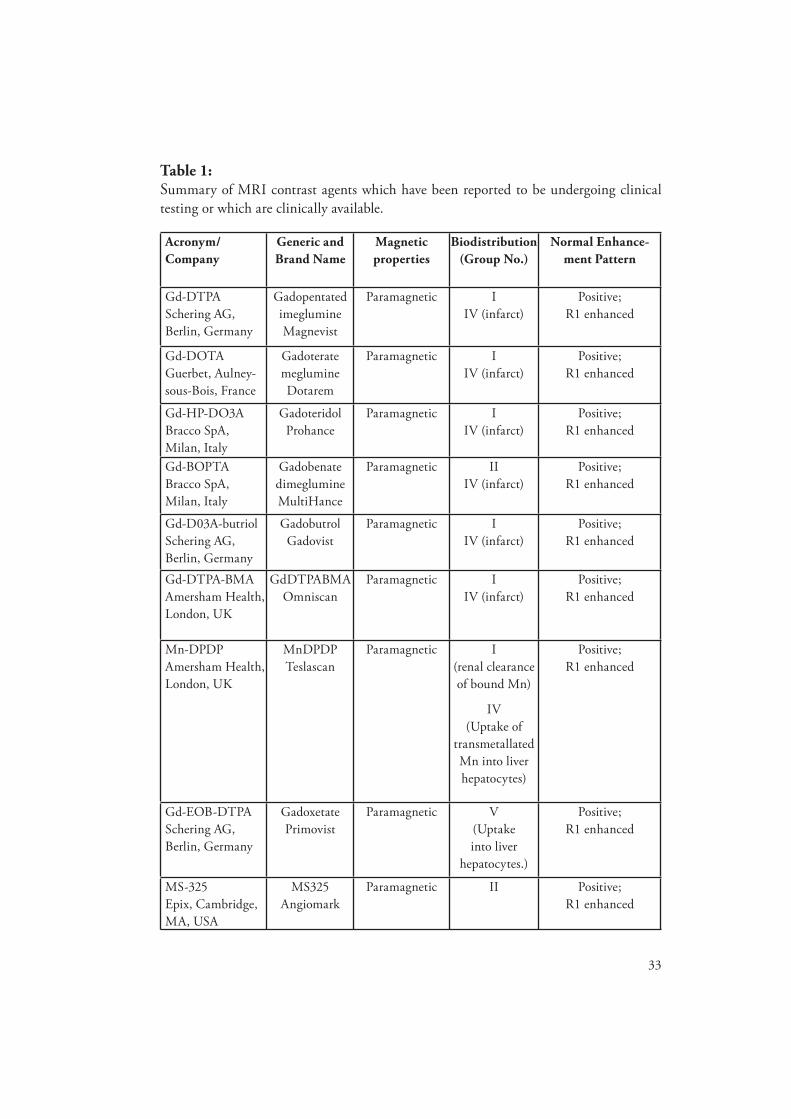
For Group I materials, the ligand inhibits interactions between the metal ion and endog-enous components in blood or tissue (limited protein binding), and has a high selectivity (log S) to the metal ion in order to avoid transmetallation with the multitude of endog-enous in vivo cations. Th e Group I contrast agents were the fi rst to be developed and used clinically for diagnostic imaging of the central nervous system. Examples of Group I com-pounds include GdDTPA, GdDTPABMA and GdDOTA. A complete list of the current Group I contrast agents are shown in Table 1. Whereas high molecular weight lanthanide agents are currently in development, the only commercially available agents today are low molecular weight chelates with relatively low in vivo effi cacy. As a result, relatively large doses (0.1 to 0.3 mmol metal ion/Kg body weight) of Group I agents must be adminis-tered. Group I agents may also exhibit Group IV characteristics, since the excretion kinet-ics may be altered based on the morphology of the tissue. For example, gadolinium based agents may be used to access myocardial infarct, since the excretion of the material is delayed in infracted tissue, compared to normal tissue. By imaging at relatively late time points (10-15 minutes post injection) the areas of infarct that retain the agent will have increased signal intensity compared to normal tissue allowing for infarct detection (21).
It is possible to intraveneously administer unchelated manganese (Mn2+) without seri-ous toxic eff ects, as long as the injection rate is slow and the concentrations are low. Th e cardiotoxicity observed with manganese (Mn2+) is directly related to the speed of admin-istration, since the free Mn2+ ions will compete with calcium for the calcium gated chan-nels in myocytes (22). Manganese (Mn2+) that is administered as a free ion will bind immediately with serum protein albumin and will be eliminated via the portal system with excretion into the bile and eventually into the faeces, making this a Group IV agent. Since most vertebrates have an eff ective mechanism for eliminating Mn2+, contrast agents made using this ion do not require a strong chelating agent. In fact, the only Mn2+ agent currently in clinical use for liver imaging (see Table 1) relies on the small concentration of unbound transmetallated metal ions to cause signal enhancement in normal hepatocytes

32
of the liver. Although Mn2+contrast agents may be desirable from a safety point of view, they are not as eff ective as the lanthanides at enhancing the relaxation of protons. As a result, Mn2+contrast agents often require high doses, thereby increasing the risk of car-diotoxic side eff ects. Th e r1 of chelate bound Mn2+ (MnDPDP) is half that of GdDTPA and the r1 of protein bound Mn2+ is 1.5 times larger than that of GdDTPA at 20 MHz and 37° C.
Currently there is only one paramagnetic Group V agent in clinical development (Gd-EOB-DTPA). However, an increasing number of targeted paramagnetic compounds are currently being developed and tested pre-clinically. Most paramagnetic contrast agents, with the exception of dysprosium, are called positive contrast agents, since they primarily increase R1, resulting in signal enhancement. However, all contrast agents will enhance both R1 and R2 of water protons. Whether or not the signal intensity is increased or decreased is dependent upon which eff ect predominates. Since most paramagnetic agents produce only weak local magnetic fi elds, the R1 enhancement is greater than R2* enhancement. As a result, the observed signal intensity (that refl ects the average eff ect) increases. When gadolinium complexes are compartmentalised at high concentrations, or when T2* weighted sequences are used (long TE GRE sequences), the R2* eff ects pre-dominate and signal decrease is observed.
Superparamagnetic contrast agents are composed of a water insoluble crystalline mag-netic core, usually magnetite (Fe3O4) or maghemite (γ-Fe2O3). Th e mean core diameters normally range from 4 – 10 nm, and the core is often surrounded by a polyoside layer based on dextran or starch derivatives. Th e total size of the particle is expressed as the mean hydrated particle diameter, since it includes water molecules that are associated with particle surface. Iron oxide particles are often characterized by their mean hydrated diameters <d>p as follows: Nanoparticles are mono-disperse iron oxide cores, where <d>p is less than 15 nm. Ultrasmall iron oxide particles (USPIO) are also made up of single crystal iron oxide cores with a total mean hydrated particle diameter <d>p that is less than 50 nm. In these samples there may also be a relatively larger distribution in particle sizes, so that a small percentage of the particles in the sample may have diameters signifi -cantly greater than 50 nm.
A superparamagnetic iron oxide particle (SPIO) refers to particles with aggregated iron oxide cores (not single crystals) and <d>p greater than 50 nm. Iron oxide particles are classifi ed in Group III with some of the nano-particles and USPIOs also exhibiting Group IV characteristics, since these materials may be passively taken up and excreted by other macrophages (see Table I). Th e r1 of iron oxide based agents is extremely dependent upon the Larmor frequency of the applied imaging fi eld (as discussed in the next section). Generally r1 values are 4-5 times greater than that of GdDTPA at 20 MHz. Th e r2 values obtained for iron oxide agents are dependent primarily upon the size of the particle, and ranges from 5 to more than 20 times that of GdDTPA at 20 MHz in water. Most Group IV agents currently under development utilise the high R2* relaxation of iron oxides when trying to actively target a tissue or receptor.
33
Acronym/ Company
Generic and Brand Name
Magnetic properties
Biodistribution (Group No.)
Normal Enhance-ment Pattern
Gd-DTPASchering AG, Berlin, Germany
Gadopentated imeglumineMagnevist
Paramagnetic IIV (infarct)
Positive;R1 enhanced
Gd-DOTAGuerbet, Aulney-sous-Bois, France
Gadoterate meglumineDotarem
Paramagnetic IIV (infarct)
Positive;R1 enhanced
Gd-HP-DO3ABracco SpA, Milan, Italy
GadoteridolProhance
Paramagnetic IIV (infarct)
Positive;R1 enhanced
Gd-BOPTABracco SpA, Milan, Italy
Gadobenate dimeglumineMultiHance
Paramagnetic IIIV (infarct)
Positive;R1 enhanced
Gd-D03A-butriol Schering AG, Berlin, Germany
GadobutrolGadovist
Paramagnetic IIV (infarct)
Positive;R1 enhanced
Gd-DTPA-BMAAmersham Health, London, UK
GdDTPABMAOmniscan
Paramagnetic IIV (infarct)
Positive;R1 enhanced
Mn-DPDPAmersham Health, London, UK
MnDPDPTeslascan
Paramagnetic I(renal clearance of bound Mn)
IV(Uptake of
transmetallated Mn into liver hepatocytes)
Positive;R1 enhanced
Gd-EOB-DTPASchering AG, Berlin, Germany
GadoxetatePrimovist
Paramagnetic V(Uptake into liver
hepatocytes.)
Positive;R1 enhanced
MS-325Epix, Cambridge, MA, USA
MS325Angiomark
Paramagnetic II Positive;R1 enhanced
Table 1: Summary of MRI contrast agents which have been reported to be undergoing clinical testing or which are clinically available.

34
AMI-25Guerbet, Aulney-sous-Bois, France
FerumoxidesEndorem Feridex
Ferrimagnetic at temp.
< Nèel temp.
Superparamag-netic at temp. > Nèel temp.
SPIOIII
Negative;R2* enhanced in nor-mal RES cells of the
liver/spleen.
AMI-227Guerbet, Aulney-sous-Bois, France
FerumoxtranSinerem
Combidex
Ferrimagnetic at temp.
< Nèel temp.
Superparamag-netic at temp. > Nèel temp.
USPIOIII, IV
Negative; R2* enhanced in nor-mal RES cells of the lymph/bone marrow/
liver/spleen.
Positive; R1 enhancement
observed in blood and highly perfused tissue at early time points.
AMI-121Guerbet, Aulney-sous-Bois, France
LumiremGastromark
Ferrimagnetic at temp.
< Nèel temp.
Superparamag-netic at temp. > Nèel temp.
SPIOIV
(Orally or rectally
administered)
Negative;R2* enhanced in gas-tro-intestinal system.
SHU 555 C Schering AG, Berlin, Germany
FerucarotranResovist
Ferrimagnetic at temp.
< Nèel temp.
Superparamag-netic at temp. > Nèel temp.
SPIOIII
Negative;R2* enhanced in nor-mal RES cells of the
liver and spleen.
Positive;R1 enhancement
observed in blood and highly perfused tissue at early time points.

35
NC100150 Injection Amersham Health, London, UK
Clariscan Ferrimagnetic at temp.
< Nèel temp.
Superparamag-netic at temp. > Nèel temp.
Nano-particleIII, IV
Negative;R2* enhanced in nor-mal RES cells of the
liver and spleen.
Positive;R1 enhancement
observed in blood and highly perfused tissue at early time points.
OMP Amersham Health, London, UK
Abdoscan Ferromagnetic at temp.
< Nèel temp.
Superparamag-netic at temp. > Nèel temp
SPIOIV
(Orally or rectally
administered)
Negative;R2* enhanced in gas-tro-intestinal system.
Biodistribution grouping: I) ECF agents that are renally excreted with limited bio-trans-formation. II) ECF agents that have some degree of interaction with the endogenous materials of blood. III) Intravascular agents that are eliminated by the cells of the RES. IV) Secondary passive targeting mechanisms. V) Agents that are actively targeted to spe-cifi c cells or tissues.
2.1.5 Relaxation of water protons by iron oxide particles: Relaxation theory“Since almost the beginning of the study of the NMR phenomenon, investigators have real-ised the large eff ects that could be caused by the magnetism of unpaired electrons”- Charles S. Springer, JR. in NMR in Physics and Biomedicine, 1994, Academic Press, Inc.
Although the present work concentrates on the relaxation of water molecules in the pres-ence of iron oxide based contrast agents, current ultra-small superparamagnetic iron oxide (USPIO) relaxation theory is built upon the original theory developed for paramagnetic systems. As a result, a brief discussion of paramagnetic relaxation theory is critical for the understanding of the mechanisms underlying USPIO relaxation theory.Origins of USPIO relaxation theory: Paramagnetic relaxation
For water protons to relax following the administration of an rf-pulse there must be some sort of interaction between the individual protons and electrons in a spin-orbital. Th is interaction, whatever the type, is always modulated so that relaxation is defi ned by both an interaction and a modulation. In aqueous solution there are two types of inter-actions, or proton-electron couplings: intramolecular and intermolecular. Th e processes that modulate these interactions are molecular rotation and proton diff usion for the intra- and intermolecular interactions, respectively. In pure water the interactions are weak and

36
the T1 values are relatively high (4 seconds). However, in the presence of a paramagnetic ion, the relaxation times can be signifi cantly reduced (T1 below 1 second). For paramag-netic relaxation, there are two contributions to proton relaxation: 1) Inner-sphere relaxa-tion and 2) Outer-sphere relaxation.
Inner-sphere relaxation deals with the direct exchange of energy between protons and electrons located in the hydration sphere of a paramagnetic ion (Group I contrast agent), and is dominated by both a dipolar and scalar coupling of the spins. Th e dipolar coupling can be described by an energy exchange model that defi nes the interactions infl uencing the rate of exchange between water protons in the hydration sphere of the paramagnetic ion and protons in the bulk water (in the matrix). Th e dipolar coupling is modulated by the rotation of the paramagnetic centre τr, the exchange rate of water molecules in and out of the hydration sphere τm, and the electron relaxation of the electronic spin associ-ated with the paramagnetic ion τs1. Recall that the electronic relaxation time refers to the fl uctuation of electrons between various energy levels that defi ne the orbital confi gu-ration of the system. If the fl uctuations are slow, then the proton experiences a constant electronic fi eld and is able to undergo eff ective dipolar coupling with the electron spin. If the fl uctuations are fast, then protons experience fl uctuating electron fi elds and dipolar coupling may be limited.
A correlation term, τc, is used to defi ne the modulation of the dipolar couplings. For the inner-sphere contribution, there are three diff erent modulations, so that the correla-tion time is defi ned by (23, 24):
[19]
Th e fastest modulation (or greatest 1/τ value) will dominate Equation 19. As a result, it is the fastest modulation that has the greatest infl uence on the total correlation time τc.
Whereas the molecular rotation and exchange times may be altered by changing the structure of the ligand, the electronic relaxation time is dependent upon both the lig-and and the paramagnetic ion used. For dysprosium, the symmetry of the electrons in the outer-orbitals causes the electronic relation time of this ion to be extremely fast (so that the 1/τs1 value is very large). Even though molecular size and/or the access to the hydration sphere may be increased, the relaxation properties of dysprosium based contrast agents are completely dominated by the electronic relaxation of the ion (23).
Inner-sphere relaxation accounts for approximately 50% of the relaxation eff ect observed with Gd based contrast agents. Th e contribution of inner-sphere relaxation on the total relaxation rate of water protons may be predicted using the Solomon-Bloembergen Equa-tions (23, 24):
1/ c = 1/ r + 1/ m + 1/ s1

37
[20]
where
where c is the concentration of the metal ion, q is the number of water molecules in the hydration sphere of the ion, and ∆ω is the shift in the Larmor frequency of the protons in the hydration sphere. γ is the gyromagnetic ratio of the proton, g is the Landè factor, S is the electronic spin quantum number, β is the Bohr magneton, ħ is the Reduced Planck’s constant, A is the distance of closest approach between the protons and the paramagnetic metal ion, r is the radius of the molecule, ω0 is the precessional frequency of the proton and ωs is the precessional frequency of the electrons. Th e modulation of dipolar coupling is defi ned by the τc1 and τc2 correlation times. Th e modulation of the scalar coupling is defi ned by τE1 and τE2.
Although the inner-sphere equations may look intimidating at fi rst glance, it is impor-tant to observe that the frequency terms (1/ω0 and 1/ωs) will approach zero at high fi eld. As a result, 1/T1M will approach zero at high frequency, and 1/T2M will approach a con-stant value due to the additional scalar term, which describes the relaxation caused by interaction of proton spins with the magnetic moment associated with the ion.
When the paramagnetic ions are complexed and the number of water molecules in the hydration sphere decreases (q=0), then the outer-sphere relaxation mechanism becomes important. Outer-sphere relaxation arises due to the movement of the water protons near the local magnetic fi eld gradients generated by the paramagnetic ion. Th e interaction between proton spins and the magnetic moment is also a dipolar interaction. No scalar coupling is possible since the proton and ion are never in direct contact. Th e modulation of this interaction is due to the diff usion of the water molecules τD and the electronic relaxation of the electronic spin of the ion, τs1. Th e eff ect of the outer-sphere relaxation on R1 (1/T1os) and R2 (1/T2 os) may be predicted by (23, 24):
22
22
22
22
10
16
222
1 )(13)1(2
17
)(13
15)1(21
ES
E
CS
C
C
C
M
ASSrSSg
T
22
21
2
22
22
10
116
222
2 )(13)1(2
113
)(134
15)1(1
ES
EE
CS
C
C
CC
M
ASSrSSg
T
R1inner-sphere = cq/55.5 · 1/(T1M+ M)
R2inner-sphere = cq/55.5 · 1/(T2M+ M) · [(1+( · M · T2M)2/ ( M · ( M+T2M)T2M))/
(1+( · M · T2M)2/ ( M+T2M)2)]
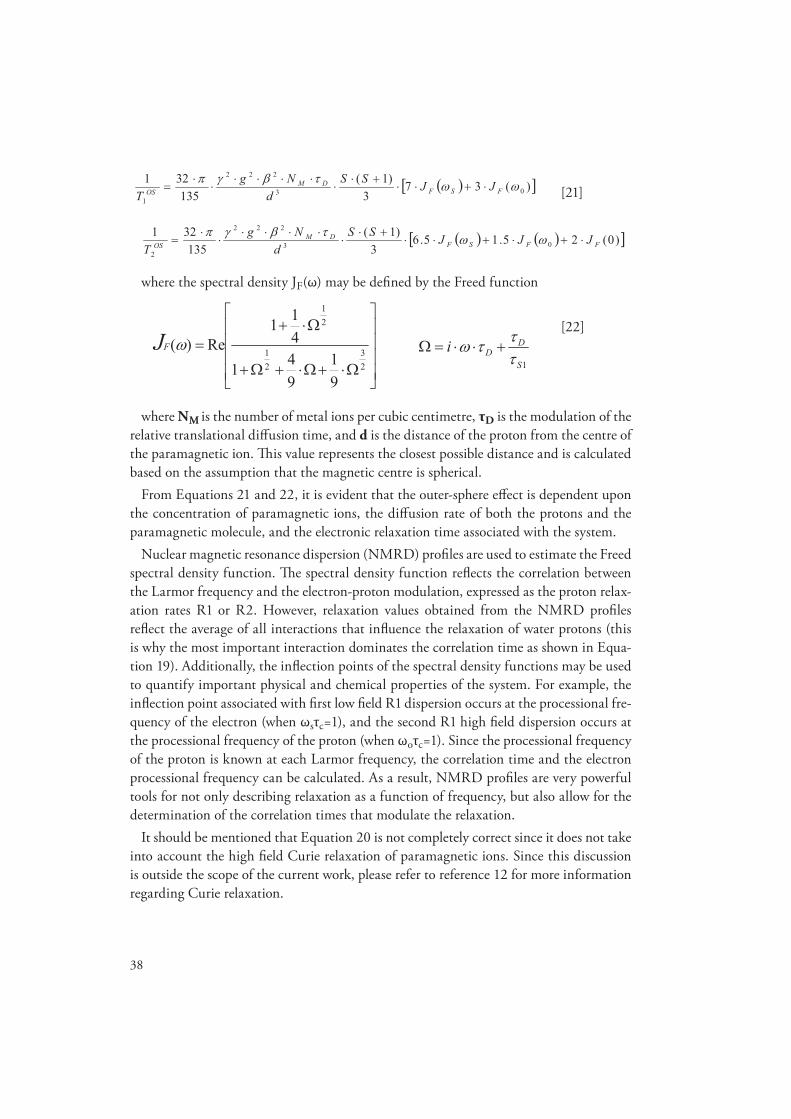
38
[21]
where the spectral density JF(ω) may be defi ned by the Freed function
[22]
where NM is the number of metal ions per cubic centimetre, τD is the modulation of the relative translational diff usion time, and d is the distance of the proton from the centre of the paramagnetic ion. Th is value represents the closest possible distance and is calculated based on the assumption that the magnetic centre is spherical.
From Equations 21 and 22, it is evident that the outer-sphere eff ect is dependent upon the concentration of paramagnetic ions, the diff usion rate of both the protons and the paramagnetic molecule, and the electronic relaxation time associated with the system.
Nuclear magnetic resonance dispersion (NMRD) profi les are used to estimate the Freed spectral density function. Th e spectral density function refl ects the correlation between the Larmor frequency and the electron-proton modulation, expressed as the proton relax-ation rates R1 or R2. However, relaxation values obtained from the NMRD profi les refl ect the average of all interactions that infl uence the relaxation of water protons (this is why the most important interaction dominates the correlation time as shown in Equa-tion 19). Additionally, the infl ection points of the spectral density functions may be used to quantify important physical and chemical properties of the system. For example, the infl ection point associated with fi rst low fi eld R1 dispersion occurs at the processional fre-quency of the electron (when ωsτc=1), and the second R1 high fi eld dispersion occurs at the processional frequency of the proton (when ωoτc=1). Since the processional frequency of the proton is known at each Larmor frequency, the correlation time and the electron processional frequency can be calculated. As a result, NMRD profi les are very powerful tools for not only describing relaxation as a function of frequency, but also allow for the determination of the correlation times that modulate the relaxation.
It should be mentioned that Equation 20 is not completely correct since it does not take into account the high fi eld Curie relaxation of paramagnetic ions. Since this discussion is outside the scope of the current work, please refer to reference 12 for more information regarding Curie relaxation.
)(37
3)1(321 222
DM SNg135 03
1FSFOS JJS
dT
)0(25.15.63
)1(135
32103
222
2FFSF
DMOS JJJSS
dNg
T
31 14ReJ
22
21
991
411
)(F1S
DDi
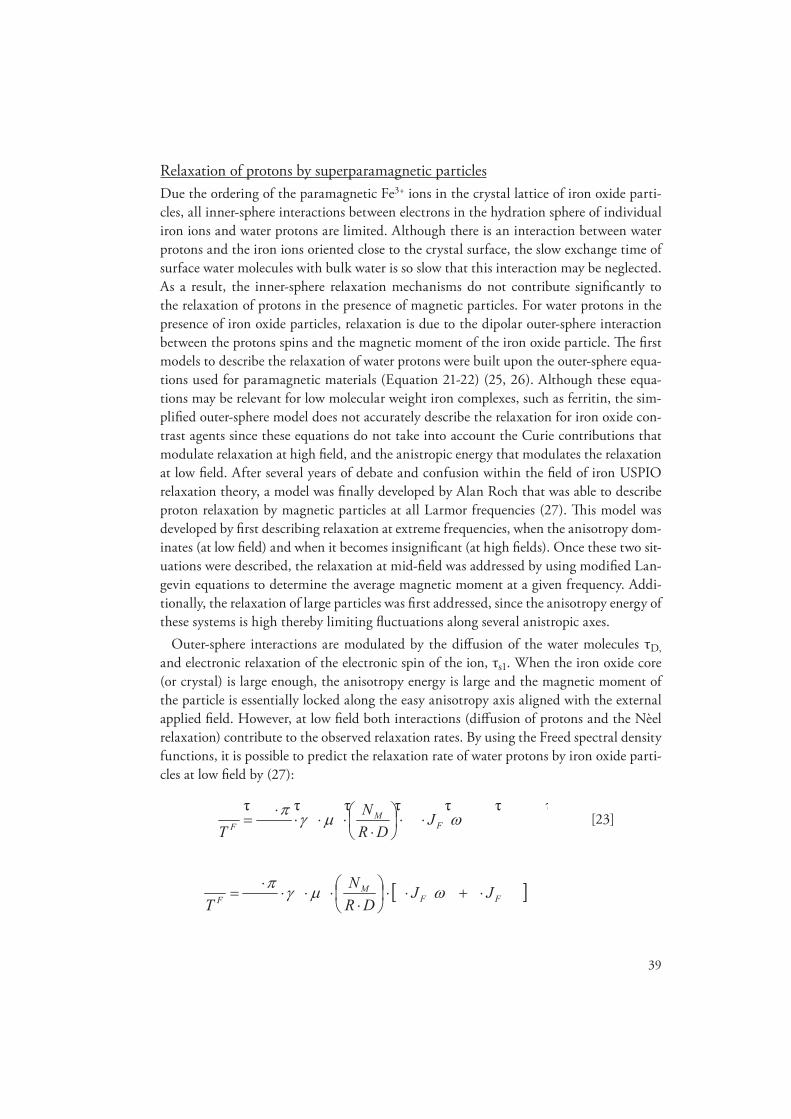
39
Relaxation of protons by superparamagnetic particlesDue the ordering of the paramagnetic Fe3+ ions in the crystal lattice of iron oxide parti-cles, all inner-sphere interactions between electrons in the hydration sphere of individual iron ions and water protons are limited. Although there is an interaction between water protons and the iron ions oriented close to the crystal surface, the slow exchange time of surface water molecules with bulk water is so slow that this interaction may be neglected. As a result, the inner-sphere relaxation mechanisms do not contribute signifi cantly to the relaxation of protons in the presence of magnetic particles. For water protons in the presence of iron oxide particles, relaxation is due to the dipolar outer-sphere interaction between the protons spins and the magnetic moment of the iron oxide particle. Th e fi rst models to describe the relaxation of water protons were built upon the outer-sphere equa-tions used for paramagnetic materials (Equation 21-22) (25, 26). Although these equa-tions may be relevant for low molecular weight iron complexes, such as ferritin, the sim-plifi ed outer-sphere model does not accurately describe the relaxation for iron oxide con-trast agents since these equations do not take into account the Curie contributions that modulate relaxation at high fi eld, and the anistropic energy that modulates the relaxation at low fi eld. After several years of debate and confusion within the fi eld of iron USPIO relaxation theory, a model was fi nally developed by Alan Roch that was able to describe proton relaxation by magnetic particles at all Larmor frequencies (27). Th is model was developed by fi rst describing relaxation at extreme frequencies, when the anisotropy dom-inates (at low fi eld) and when it becomes insignifi cant (at high fi elds). Once these two sit-uations were described, the relaxation at mid-fi eld was addressed by using modifi ed Lan-gevin equations to determine the average magnetic moment at a given frequency. Addi-tionally, the relaxation of large particles was fi rst addressed, since the anisotropy energy of these systems is high thereby limiting fl uctuations along several anistropic axes.
Outer-sphere interactions are modulated by the diff usion of the water molecules τD, and electronic relaxation of the electronic spin of the ion, τs1. When the iron oxide core (or crystal) is large enough, the anisotropy energy is large and the magnetic moment of the particle is essentially locked along the easy anisotropy axis aligned with the external applied fi eld. However, at low fi eld both interactions (diff usion of protons and the Nèel relaxation) contribute to the observed relaxation rates. By using the Freed spectral density functions, it is possible to predict the relaxation rate of water protons by iron oxide parti-cles at low fi eld by (27):
[23]�������
�� �� N��
�F
MF J
DRT
����������
����
��
�FF
MF JJ
DRN
T

40
where NM is the concentration of iron oxide particles, R is the radius of the iron oxide core (or crystal), D is the diff usion coeffi cient, γ is the gyromagnetic ratio of the proton, µ is the magnetic moment of the iron oxide particle, ω0 is the precessional frequency of the proton and JF represents the Freed spectral density function described in Equation 22.
From Equation 23 it is apparent that as the fl uctuation rate increases (Nèel relaxation is fast), the τs decreases, the NMRD dispersion shifts to the right toward high frequency, and the amplitude of the relaxation rate at low fi eld decreases. Systems with high ani-sotropy energy have limited fl uctuations (since they need to get over the energy barrier to allow for the fl uctuation), so that the amplitude of the relaxation rates at low fi eld are high for iron oxide particles with large iron oxide cores. Th e smaller the core, the smaller the energy diff erence between the two energy levels and the faster fl uctuation of the indi-vidual magnetizations. As a result, smaller particles generally have less eff ective low fi eld relaxation (refl ected by the decrease in the relaxation rates).
At high fi eld, the magnetization is locked parallel to the applied fi eld (no Nèel relaxa-tion) so that the relaxation values refl ect the modulation of the diff usion interaction only. At high fi eld, when only τD modulates the relaxation, the Ayant spectral density func-tions can be used to predict the relaxation of the water protons by the particles according to (27):
[24]
At intermediate fi elds, the relaxation is modulated by both the Freed and the Ayant spectral density functions. Here relaxation values will refl ect a weighted average of the two eff ects, with the dominate eff ect exerting greater infl uence on the value obtained. As a result, the probability of fi nding the magnetization parallel to the applied fi eld or fl uc-tuating along the x,y, or z axes is used to weight the averaging of the two equations. Th e resultant mean magnetization <µZ> is then used to approximate the relaxation rates. Th e mean magnetization from the mixing of equations 23-24 may be described by (27):
)321 22A JN (9
405 01
AM
DRT
)0(6)(5.4405
3210
22
2AA
MA JJ
DRN
T
64881814
621
8851
)( 65432
2
uuuuuu
uu
J A Du 2

41
[25]
Equation 25 is similar to the Langevin function described previously in Equation 10. However, the average magnetization <µZ> obtained by Equation 25 takes into account possible fl uctuations of the magnetic moment due to anisotropy energy. Th is is critical at mid-fi eld, when the external applied fi eld is not strong enough to orient all spins parallel to the fi eld. Th e percentage of spins aligned parallel will increase (Boltzmann’s distribu-tion) until the fi eld is strong enough to align the spin and lock them parallel.
By combining Equations 22-25 it is possible to create a single set of equations that can be used to predict the relaxation of water protons in the presence of large iron oxide cores (radius greater than 7.5 nm) at all frequencies (27).
When the size of the iron oxide core is small (< 7.5 nm) then the anisotropy energy is relatively low and the magnetic moment of the particle is no longer locked along the easy anisotropy direction, as shown in Fig. 7. At zero-fi eld, there is a precession of the spins around the anistropic fi eld. Th e angle of rotation (relative to the z-direction) depends
µC = <µZ> = L( )·µ
<µZfluc> = (1 - 2L( )/ – L2( ))·µ2
<µZfluc> = <(µy
fluc)> = L( )/
Fig. 7: NMRD profi le for SPIO with large core size (> 7.5 nm). Description of the contribution from the Freed and Ayant components to the observed R1 relaxation. Th e weighting factor at mid fi eld depends upon the square of the Langevin function.(Colour print available in the supplement - page 91).
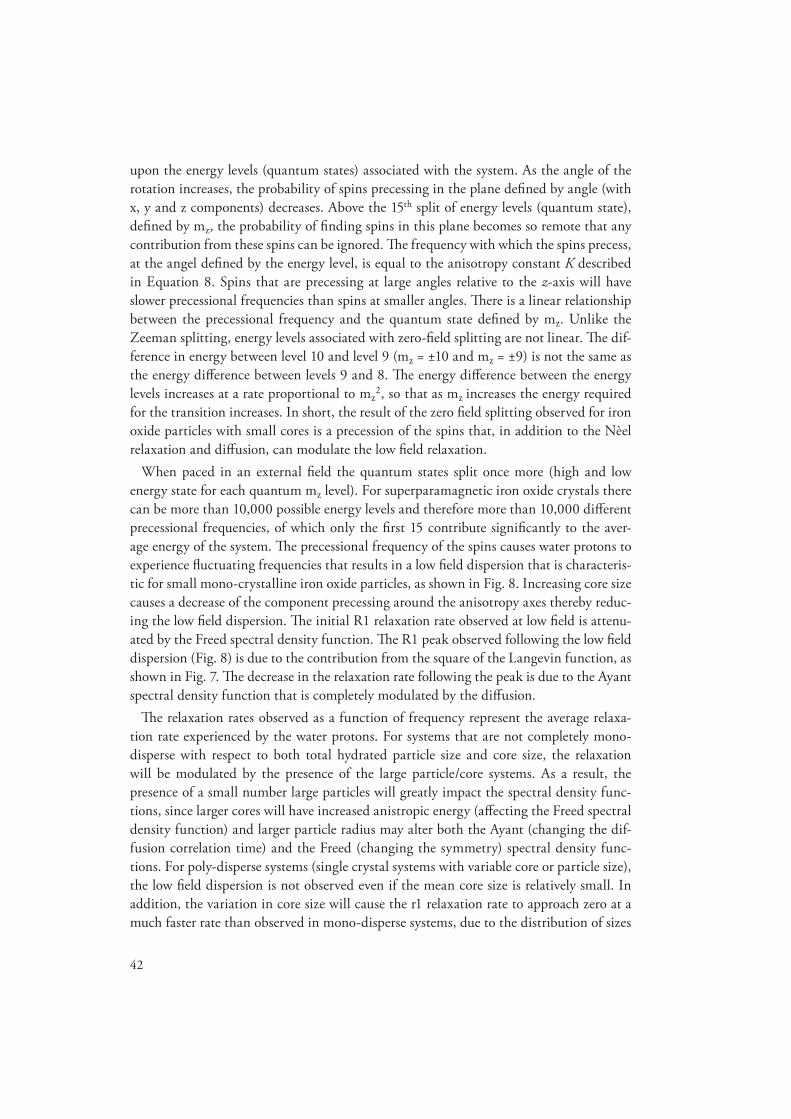
42
upon the energy levels (quantum states) associated with the system. As the angle of the rotation increases, the probability of spins precessing in the plane defi ned by angle (with x, y and z components) decreases. Above the 15th split of energy levels (quantum state), defi ned by mz, the probability of fi nding spins in this plane becomes so remote that any contribution from these spins can be ignored. Th e frequency with which the spins precess, at the angel defi ned by the energy level, is equal to the anisotropy constant K described in Equation 8. Spins that are precessing at large angles relative to the z-axis will have slower precessional frequencies than spins at smaller angles. Th ere is a linear relationship between the precessional frequency and the quantum state defi ned by mz. Unlike the Zeeman splitting, energy levels associated with zero-fi eld splitting are not linear. Th e dif-ference in energy between level 10 and level 9 (mz = ±10 and mz = ±9) is not the same as the energy diff erence between levels 9 and 8. Th e energy diff erence between the energy levels increases at a rate proportional to mz
2, so that as mz increases the energy required for the transition increases. In short, the result of the zero fi eld splitting observed for iron oxide particles with small cores is a precession of the spins that, in addition to the Nèel relaxation and diff usion, can modulate the low fi eld relaxation.
When paced in an external fi eld the quantum states split once more (high and low energy state for each quantum mz level). For superparamagnetic iron oxide crystals there can be more than 10,000 possible energy levels and therefore more than 10,000 diff erent precessional frequencies, of which only the fi rst 15 contribute signifi cantly to the aver-age energy of the system. Th e precessional frequency of the spins causes water protons to experience fl uctuating frequencies that results in a low fi eld dispersion that is characteris-tic for small mono-crystalline iron oxide particles, as shown in Fig. 8. Increasing core size causes a decrease of the component precessing around the anisotropy axes thereby reduc-ing the low fi eld dispersion. Th e initial R1 relaxation rate observed at low fi eld is attenu-ated by the Freed spectral density function. Th e R1 peak observed following the low fi eld dispersion (Fig. 8) is due to the contribution from the square of the Langevin function, as shown in Fig. 7. Th e decrease in the relaxation rate following the peak is due to the Ayant spectral density function that is completely modulated by the diff usion.
Th e relaxation rates observed as a function of frequency represent the average relaxa-tion rate experienced by the water protons. For systems that are not completely mono-disperse with respect to both total hydrated particle size and core size, the relaxation will be modulated by the presence of the large particle/core systems. As a result, the presence of a small number large particles will greatly impact the spectral density func-tions, since larger cores will have increased anistropic energy (aff ecting the Freed spectral density function) and larger particle radius may alter both the Ayant (changing the dif-fusion correlation time) and the Freed (changing the symmetry) spectral density func-tions. For poly-disperse systems (single crystal systems with variable core or particle size), the low fi eld dispersion is not observed even if the mean core size is relatively small. In addition, the variation in core size will cause the r1 relaxation rate to approach zero at a much faster rate than observed in mono-disperse systems, due to the distribution of sizes
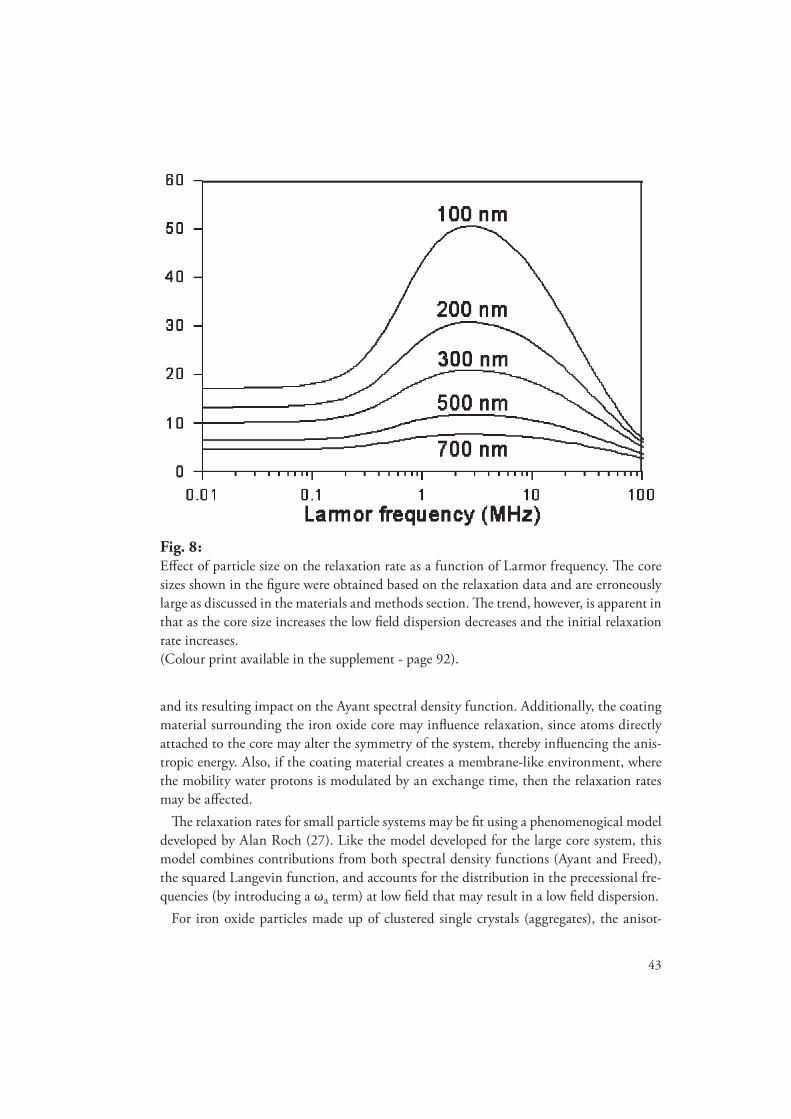
43
and its resulting impact on the Ayant spectral density function. Additionally, the coating material surrounding the iron oxide core may infl uence relaxation, since atoms directly attached to the core may alter the symmetry of the system, thereby infl uencing the anis-tropic energy. Also, if the coating material creates a membrane-like environment, where the mobility water protons is modulated by an exchange time, then the relaxation rates may be aff ected.
Th e relaxation rates for small particle systems may be fi t using a phenomenogical model developed by Alan Roch (27). Like the model developed for the large core system, this model combines contributions from both spectral density functions (Ayant and Freed), the squared Langevin function, and accounts for the distribution in the precessional fre-quencies (by introducing a ωa term) at low fi eld that may result in a low fi eld dispersion.
For iron oxide particles made up of clustered single crystals (aggregates), the anisot-
Fig. 8: Eff ect of particle size on the relaxation rate as a function of Larmor frequency. Th e core sizes shown in the fi gure were obtained based on the relaxation data and are erroneously large as discussed in the materials and methods section. Th e trend, however, is apparent in that as the core size increases the low fi eld dispersion decreases and the initial relaxation rate increases.(Colour print available in the supplement - page 92).

44
ropy energy increases dramatically, since the direction of the spins in several interacting crystals need to be turned simultaneously along the easy anistropic axis. In these systems, the aggregate itself can be considered a magnetized sphere and the matrix in which the crystals are embedded may infl uence relaxation if the water exchange between bulk water and the water caught in the matrix is long (restricted diff usion of the protons). For iron oxide particles containing crystal aggregates there is a dominant R2 eff ect, since the scalar term corresponding to diff usion around the magnetized sphere dominates the high fi eld relaxivity (> 20 MHz) and keeps R2 from dispersing to zero at high fi eld. Normally, high anistropic energy results in high initial R1 values that are modulated by the Freed spectral density function. However, for iron oxide crystal aggregates this is not the case, since the thermal energy of these systems is much greater than the Nèel relaxation of the electrons. Th e shaking caused by thermal energy acts as an entropy factor prevents the interacting spins in the aggregate from orienting with the fi eld (all spins in the same direction). Even though the anistropic energy is high for aggregates, the relaxation observed at low fi eld is surprisingly low, and much lower than that observed for mono-crystalline systems.
Since the r1 values are lower (due to thermal energy), and the r2 values higher (due to the scalar term), the r2/r1 ratio obtained for aggregated crystal systems is much greater than the ratio obtained for mono-crystalline particles. Initially, the r2/r1 ratio was corre-lated to the hydrated particle size. However, it has been recently shown that it is not the hydrated size that is critical but the physical and chemical properties of the iron oxide core (size, dispersity, symmetry and if there is interaction with other crystals in close proxim-ity) (27). Susceptibility induced dephasing based on the Static Dephasing Regime Model
Th e relaxation described by the phenomenogical model may be used to predict the relaxation properties of water protons in aqueous solution. However, in tissue, this model is limited since it does not account for restrictions of water diff usion and/or particle dif-fusion due to the compartmentalization of particles within various tissues or cells. Th e restriction of diff usion will dramatically enhance the dephasing of water protons, since compartmentalization produces large susceptibility diff erences between the tissues con-taining the contrast agent, and tissues that do not. In addition, the diff usion restriction of water protons (through membranes of cells and vessels) will limit the R1 enhance-ment, and may enhance dephasing if the water protons do not move out of the local magnetic fi eld inhomogenities during the echo time (TE) used for image collection (nor-mally < 3ms). As a result, the eff ect of a contrast agent on the transverse relaxation can be dramatically higher in vivo, than what is predicted by the phenomenogical model for enhancement.
Th e increase of T2 in tissues or other compartmentalised systems is due to what is called susceptibility induced relaxation, or susceptibility eff ects, and is based on the mod-els describing the dependence of R2 on the magnetic moment of particles in solution. In the static dephasing regime, the R2 enhancement is augmented by the presence of static local magnetic fi elds that assume a Lorentzian fi eld distribution. In this case the free

45
induction decay (FID = 1/T2* = R2*) is proportional to the concentration of the mag-netic material and the magnetization (Ml) generated by the particles at the location of the water proton (1/T2*≈NMMl) (20, 28).
Th e local magnetic fi elds are generated by compartmentalization of the contrast agent whereby the agent is contained to a fraction of the total tissue volume. Th e contrast agent-containing compartment itself acts as a contrast agent, since a susceptibility diff erence is created between this tissue and other tissues not containing the contrast agent. Th e net magnetization created by the tissue containing the contrast agent is a sum of all the indi-vidual magnetic moments of each particle in the tissue. Th e net result is often described as the generation of one giant magnetic particle with the diameter and shape of the cell or tissue that contains the compartmentalised contrast agent. Th e susceptibility eff ect does not aff ect the longitudinal relaxation since the size of the local magnetic fi elds generated in vivo are so large that the T1-relaxivity has dispersed to zero at clinically relevant fre-quencies.
Th e amount of signal that is lost due to dephasing is dependent upon the echo time (TE) used to generate the image. Th e longer the echo time, the more time spins have to diff use into the local magnetic fi elds, and greater the probability of dephasing. Signal loss, as a function of TE due to the susceptibility eff ect, can then be expressed in terms of the frequency distribution (due to the local magnetic fi eld gradients) within the image voxel (defi ned volume obtained within the image) (20).
[26]
where TE is the echo time, S0 is the signal at TE=0 and P(ω) is the frequency-distribu-tion within a voxel.
Susceptibility eff ects are most prevalent with pulse sequences that utilise gradients to produce echo trains (GRE sequences). In spin echo sequences (SE) the susceptibility eff ects are minimized, since the phase of individual spins is refocused in every echo with a consequent reduction in the total dephasing observed at time TE.
Based on the static regime model, proton diff usion eff ects can be neglected if the pro-tons do not migrate out of the local magnetic fi elds during a given echo time. To estimate R2* enhancement, the fi eld distribution (or Ml ) within the voxel must be known. How-ever, estimation of the variations in the local magnetic fi eld is complex and requires exact information related to the geometry of the cell or tissue containing the contrast agent. Since the geometry is often variable and undefi ned, most models assume that the material is compartmentalised into spheres or cylinders with infi nite length. Equation 27 describes the signal decay if the fi eld distribution is shown to be Gaussian. Th e fi eld distribution is generally assumed to be Lorenzian (mono-exponential), or Gaussian, or something in between, so that R2* is either independent (Lorenzian) or dependent (Gaussian) on the echo time used to measure it and scales either linearly (Lorenzian) or quadratically (Gaus-
dePSTES TEi)()( 0
46
sian) with the magnetization of the contrast agent. In most systems, there is probably a mixed Lorenzian/Gaussian distribution of magnetic fi elds (20, 28, 29).
[27]
where ∆R2* is the increase in transverse relaxation rate due to susceptibility eff ects and σ2
p is the variance of the fi eld distribution within the voxel. Th e variance σ2Ml is related
to the line width of the NMR spectrum of the sample tissue (or, from a single tissue voxel in imaging).
2.2 Iron metabolism“Life in any form, without iron is in all likelihood impossible”-JB Neilands
Prior to discussing the possible pathways of iron oxide particle metabolism, it is important to understand normal iron metabolism and the function of RES cells. When dissolved in water, iron can be present in two diff erent oxidation states: the ferrous Fe (II) form and the ferric Fe (III) form. However, due to the normal physiologic pH and oxygen tension range found in plasma, the preferred oxidation state of iron is the ferric Fe (III) form. Any ferrous iron present in plasma will be readily oxidized by endogenous molecular oxy-gen, resulting in the conversion of ferrous iron to ferric iron. Although ferric iron is the preferred physiological oxidation state of iron, Fe (III) is highly reactive and can induce catalytic activity that may result in severe oxidative cell damage. As a result, iron carrier proteins and chelates are used to allow for safe transfer of iron from cell to cell within the body, and for safe intra-cellular storage of excess iron. In vertebrates it is primarily transferrin (Tf) that is responsible for safe iron transport, and ferritin that is involved in iron storage. Both these proteins strongly bind iron, limiting the reactivity of the iron, and reduce the formation of hydrolytic products that may cause cell damage. In addition, the binding of iron in these proteins is reversible, so that the iron can be obtained when needed by the cells for metabolic processes, protein and enzyme synthesis, and/or heme production.
Dietary iron is taken by mature intestinal mucosa cells, known as entrocytes, that line the apical membrane of the intestinal villus (30). Th e entrocytes are the fi rst line of defence for maintaining iron homeostasis in the body. Th ese cells are programmed to store excess iron that the body does not require and release iron required for normal cell metabolism and heme production into systemic circulation. Th e entrocytes are formed within the Crypts of Lieberkuhn and migrate to the tips of the villus that are present in the absorptive areas of the intestine (30, 31). Th e normal lifetime of the mucosa cell is approximately 2 days, so that each individual cell only experiences a limited amount or iron during its journey from the crypts to the villus.
Normal adults ingest 12-18 mg of dietary iron per day (31, 32). Th e mucosa cells only
)),(exp( 2*20 TETERSS Ml
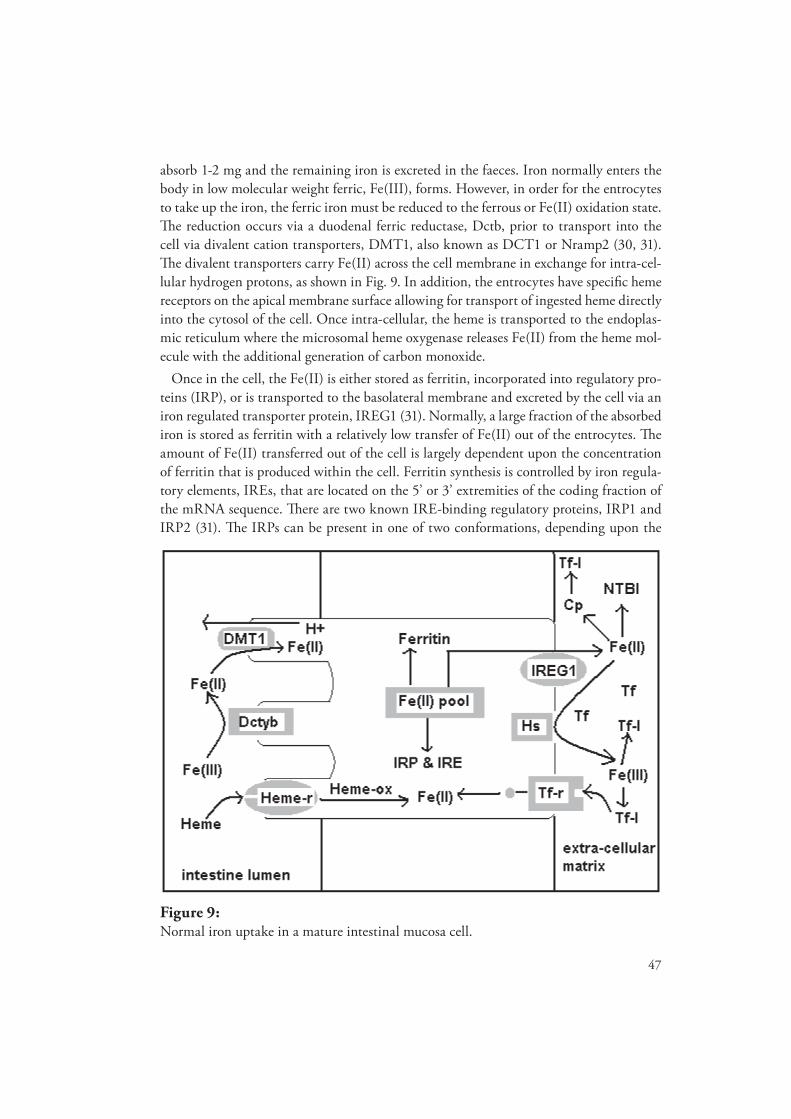
47
absorb 1-2 mg and the remaining iron is excreted in the faeces. Iron normally enters the body in low molecular weight ferric, Fe(III), forms. However, in order for the entrocytes to take up the iron, the ferric iron must be reduced to the ferrous or Fe(II) oxidation state. Th e reduction occurs via a duodenal ferric reductase, Dctb, prior to transport into the cell via divalent cation transporters, DMT1, also known as DCT1 or Nramp2 (30, 31). Th e divalent transporters carry Fe(II) across the cell membrane in exchange for intra-cel-lular hydrogen protons, as shown in Fig. 9. In addition, the entrocytes have specifi c heme receptors on the apical membrane surface allowing for transport of ingested heme directly into the cytosol of the cell. Once intra-cellular, the heme is transported to the endoplas-mic reticulum where the microsomal heme oxygenase releases Fe(II) from the heme mol-ecule with the additional generation of carbon monoxide.
Once in the cell, the Fe(II) is either stored as ferritin, incorporated into regulatory pro-teins (IRP), or is transported to the basolateral membrane and excreted by the cell via an iron regulated transporter protein, IREG1 (31). Normally, a large fraction of the absorbed iron is stored as ferritin with a relatively low transfer of Fe(II) out of the entrocytes. Th e amount of Fe(II) transferred out of the cell is largely dependent upon the concentration of ferritin that is produced within the cell. Ferritin synthesis is controlled by iron regula-tory elements, IREs, that are located on the 5’ or 3’ extremities of the coding fraction of the mRNA sequence. Th ere are two known IRE-binding regulatory proteins, IRP1 and IRP2 (31). Th e IRPs can be present in one of two conformations, depending upon the
Figure 9: Normal iron uptake in a mature intestinal mucosa cell.
48
intra-cellular iron concentration. When intra-cellular iron concentrations are low, the IRPs can bind to the IREs with high affi nity, preventing the translation of mRNA ferritin synthesis. In addition, the apo-IRPs promote iron uptake by promoting mRNA synthesis of the transferrin-receptor (Tf-r). When intra-cellular iron concentrations are high, the presence of iron changes the conformation of IRP1 and degrades IRP2, thereby inhib-iting interaction with IREs. Since the IRPs are not bound to the IREs, the translation of mRNA to ferritin continues while the Tf receptor mRNA is degraded so that basola-teral uptake of iron is reduced. Th erefore, the cell controls the amount of Fe(II) released by controlling the amount of ferritin and Tf-r produced. Th e production is controlled by IPRs, whose conformation and therefore ability of promote translation of mRNA, is determined by the intra-cellular iron concentration (31).
Once the Fe(II) leaves the cell and enters the extra-cellular matrix, the iron is either oxi-dized to Fe(III) by the membrane bound protein hephaestin (Hs) or it binds to chelates, thereby forming the non-transferrin bound (NTBI), or liable iron pool (LIP) (30, 31). Once Fe(II) is oxidized to Fe(III) it binds rapidly to transferrin (Tf), the iron transport protein of the body. However, if Tf is saturated, then the Fe(III) will bind to other lig-ands, such as citrate, and contribute to the LIP. Th e oxidation of Fe(II) to Fe(III) by hep-hastin is critical since Tf only has affi nity for ferric iron. In addition to the hephastin that is bound to the cell membrane, ceruloplasmin (Cp) that is present in plasma can catalyse the oxidation of Fe(II) and promote incorporation in Tf. By oxidizing the Fe(II) and by the incorporation of ferric iron into Tf, the body can safely transport iron without induc-ing oxidative stress.
Most dietary iron is used for the production of haemoglobin, the oxygen –carrying pigment of red blood cells. Haemoglobin is a globular protein containing four protein chains, each of which is wrapped around an iron containing heme group. Haemoglobin synthesis occurs in erythroid cells that acquire iron exclusively from transferrin by a well defi ned mechanism involving the endocytosis of transferrin-receptor complexes. Th e iron found in haemoglobin (or heme iron) accounts for approximately 80% of the body’s func-tional iron (33). Mature erythrocytes (red blood cells) have a mean functional lifetime of 120 days in humans. At the end of their functional lifetime changes in their membrane structure activate uptake by liver Kupff er cells and spleen macrophages. After phagocy-tosis, the globin chains of haemoglobin are denatured, thereby releasing the heme iron. Intra-cellular unbound heme iron is degraded by heme oxygenase and the resulting iron is then bound to transferrin, ferritin or other iron binding proteins, and exocytosed out of the cell (33).
2.2.1 Transferrin“Quantitatively, the most signifi cant iron transport molecule in vertebrates is transfer-rin”.-John L Beard in Nutrition Reviews 1996;54:295-317
Th e most important function of serum Tf is the safe transport of ferric iron within the

49
body. Tf is a carrier protein that is produced within the hepatocytes of the liver and is recycled and conserved through many cycles of iron transport. Although the ferric iron that is bound to Tf is cleared quickly from the plasma (half-life of less than 2 hours), the unbound Tf protein can circulate in the blood with a half-life of approximately 8 days (34). It is therefore estimated that each Tf protein synthesized in the hepatocytes will experience more than 100 cycles of iron binding before it is fi nally degraded and removed from circulation.Physical and Chemical Properties
Transferrin is a glycoprotein that consists of a single polypeptide chain (MW approxi-mately 80,000) with two identical branched heteroscaccharide chains that are able to bind iron tightly and reversibly. Th e shape of Tf is similar to that of an ellipsoid and is more compact or compressed when the protein is loaded with iron. Studies show that the compression of the loaded protein is critical to the iron loaded proteins stability and resistance of to denaturation (34, 35).
In human Tf the sequence of each of the iron bonding side chains diff ers only slightly in that one binding chain contains Manα (1 3) and the other Manα (1 6). Although the diff erence between the sequences appears small, the affi nity of the iron binding chain to ferric iron is dependent upon the form of Manα present. At pH 6.7 the Manα (1 3) iron binding chain has a ferric iron affi nity that is approximately 20 times greater than that of the Manα (1 6) binding chain. As the pH increases to 7.4, the affi nities diff er only by a factor of 5 or 6, indicating that the binding of ferric iron is more selective within the lysosomes of the cells where pH is low, relative to that of plasma. In addition, studies have shown that the binding sites are independent, since the loading of one site does not infl uence the affi nity of the other site (34).
Transferrin is widely distributed in most physiological fl uids and cells. Th ere are cur-rently three diff erent identifi ed types of human Tf: Serum Tf of serotransferrin; lactotrans-ferrin found in milk, tears and leukocytes; and ovotransferrin known also as conalbumin (34). Regardless of the type of Tf discussed, the binding of ferric iron to the iron bind-ing side chain requires the additional binding of a counter anion. Normally the counter anions are either bicarbonate or carbonate, however oxalate, EDTA, malonate, glyninate and thioglycolate can also act as counter anions if bicarbonate or carbonate are not avail-able. Th e strength of the ferric iron and side chain bond is dependent upon the counter anion that is also bound. Normally, the ferric iron is so tightly bound that iron will only be released when the protein enters the acidic environment within the endosomes of cells. NMR studies indicate that the counter anion is coordinated with the ferric metal ion and acts as both a bridge between the protein and Fe (III), and a shield that prevents hydroly-sis of the Fe (III)–iron binding side chain in plasma. In the absence of a suitable counter anion, Tf will not bind ferric iron. Carbonate and oxalate may be weakly bound to Tf in the absence of ferric iron, but it is not known if the binding is specifi c. In addition, Tf has only a weak affi nity for ferrous Fe (II) iron so that the majority of iron bound to Tf is in the Fe(III) oxidation state (34).

50
In vivo and ex vivo studies show that the ferric iron bound to Tf can be released by uti-lizing one of three methods (36). First, the use of iron binding chelates with higher affi n-ity for ferric iron than Tf. DFO is an iron chelating agent commonly used clinically to treat iron overload. DFO and other iron chelating agents are eff ective since the affi nity of ferric iron to the chelate is greater than that of Tf so that iron is literally stripped off of Tf and taken up by the chelate. Most chelating agents are renally excreted, so that the transmetallated ferric iron is excreted and, thereby, removed from the normal iron pool. Second, materials can be used that labialize the Fe (III)-iron binding side chain bond by disrupting the counter anion. Th ese agents may work on the counter anion directly or by protonation of the iron binding side chain. Lastly, agents that reduce Fe (III) to Fe (II) will also promote the release of iron from Tf. Th is technique is most eff ective in combi-nation with a chelating agent that can trap the released Fe (II) and thereby stimulate the reduction process. In vitro studies show that the time required for Tf to release all its iron in the presence of a reduction agent and chelating agent is similar to the time required for Tf to release iron into Reticulocytes. It now commonly accepted that the fi rst step of release of ferric iron into the cell involves the protonation of the anion followed by bind-ing with a chelate. Electron Paramagnetic Resonance Spectroscopy (EPR) has been used to confi rm the paramagnetic nature of ferric loaded Tf. Cellular Uptake Reticulocytes have specifi c receptors on the cell surface that actively bind Tf. Iron is released from the protein and delivered to ferro chelatase for heme synthesis. Th e iron-deplete Tf protein is recycled and returned to circulation for another cycle of iron trans-port. Human Reticulocytes have more than 300,000 receptors per cell and can easily incorporate over one million atoms of iron per cell per minute (36). Despite the high clearance of Tf by the cell, it is possible however to saturate the Tf specifi c receptors on the Reticulocytes. Specifi c Tf binding receptors are also found on hepatocytes and stud-ies show that the uptake of Tf by hepatocytes is dependent upon the iron saturation of the Tf protein. At relatively low iron Tf saturation levels (< 30% possible iron bound), spe-cifi c uptake mechanisms are observed. At higher saturation levels, however, a non-specifi c uptake (presumably fl uid phase endocytosis) is observed.
In both Reticulocytes and hepatic cells, Tf is internalized within the cell as follows (30): Diferric-Tf binds to receptor on the surface of the cell membrane and the entire pro-tein- receptor complex is internalized by receptor-mediated endocytosis via coated pits. Once in the cell, the vesicles lose their coating and fuse with the endosomes. Th e protein remains bound to the receptor during the entire internalization and iron release process. Th e receptor protects the protein from protonation in the acidic endosome environment during the release of ferric iron from the protein. Th e ferric iron is reduced to the ferrous form (ferrireductase) and transported out of the endosome by a divalent cation carrier (DMT1). Once the iron is released and reduced, it enters a low molecular weight iron pool, where the iron can be used for several cellular processes. Most of the iron, however, is oxidized and incorporated into ferritin, the major iron storage protein. Studies show
51
that the once the iron is released, the affi nity of the resulting iron-free Tf protein (known as apo-Tf) to the receptor increases ensuring that both the protein and receptor are recy-cled into the extra-cellular medium.
2.2.2 Ferritin“Th is iron storage protein (ferritin) exhibits a structure highly conserved among plants, animals and bacteria.” -Ugo Testa in Th e Hematology Journal 2002;3:63-89
Th e liver, spleen and bone marrow of all mammals is rich in ferritin. Th e protein, how-ever, is also found in other tissues, such as serum, circulating red blood cells and the heart (30, 31). Th e concentration of ferritin present in the various cells is a direct refl ec-tion of the current iron status in the body as a whole. Transcription of the ferritin protein increases as a direct response to high Tf saturation levels in the blood, which result in iron storage by apo-ferritin. Apo-ferritin subunits inhibit translation of ferritin mRNA by directly binding to the ferritin mRNA. When iron interacts with the apo-ferritin subu-nits, the subunits disassociate from the mRNA, thereby releasing the mRNA for ferritin translation. Iron is therefore believed to simulate ferritin synthesis even when other pro-tein syntheses may be limited.Physical and Chemical Properties Th e ferritin protein, apo-ferritin, has a MW of approximately 450,000, and a hydrated diameter of 12-13 nm (30, 31). Th e protein consists of 24 sub-units that are equiva-lent in their spatial orientation, resulting in the spherical nature of the protein. Th e sub-units, however, are not identical, so that diff erent iso-forms of the protein may be present. Within the protein shell there is a 7.5 nm central cavity that contains 8 shallow pockets used to store iron. High resolution X-ray crystallography reveals that there are six chan-nels located around the four-fold axes of the protein which lead into the central cavity. Th e size of the channels changes from 1 nm at the surface of the shell to only 0.6 nm at the entrance of the cavity. Although little is known about these channels, it is believed that they are critical to the deposition and mobilization of iron from the ferritin protein (39). It has been recently found that fl avins (such as FADH2, FMNH2 or ribofl avin) must enter the ferritin cavity in order to reduce and mobilise the stored iron. Two equivalents of ferric iron are reduced per fl avin in a sequential one-electron transfer reaction. Specifi c chelating molecules or carrier molecules are also believed critical for iron deposition into the ferritin core and may facilitate the removal of the iron from the core after the initial reduction by fl avins.
Th e central cavity of the ferritin protein is able to store approximately 2,500 iron atoms (34). Th e iron is stored as a polynuclear hydrated ferric oxide phosphate (ferrihydrite). Th e hydrated ferric Fe (III) cores are arranged as hexagonal units within the central cav-ity (34). In high density iron-loaded ferritin, the shape of the particle is highly depend-ent upon the shape of the protein cavity. As a result, ferritin particles may have variable shapes and sizes, depending upon the degree of iron loading. In partially fi lled molecules,

52
the iron appears to form micro-crystals of ferrihydrite that are in direct contact with the inner surface of the protein. However, ferritin found in hepatocytes is often poly-disperse with respect to both loading and aggregation. Aggregates of ferritin may form as mono-mers, trimers or larger aggregates depending upon the loading of ferritin within the cell. Th e intra-cellular aggregation of ferritin is believed to be the initial step in hemosiderin formation, and the boundary between ferritin and hemosiderin is not always clear.
Ferritin produced in diff erent tissues will have diff erent amino-acid compositions, allowing the various forms of human ferritin to be characterised.. Human ferritins from the heart, kidney, placenta and malignant tissue have high molecular weight sub-units (20,000-21,000) and are often referred to as H-types. Ferritin from the liver, spleen or iron rich tissue have low molecular weight sub-units (< 19,000) and are referred to as L-types (30, 34). Both the H and L types have similar amino acid groups but diff erent typ-tic peptides. Unfractionated rat liver mRNA can, however, synthesize both sub-units (H and L types). Th e kinetics of iron uptake by ferritin is dependent upon the form of the ferritin (H or L type), the pH, and the species. However, despite diff erences in type, all apo-ferritin will gradually incorporate iron into the core of the protein. Molecules con-taining partially fi lled cores take up iron more readily than apo-ferritin. One theory of ferritin formation is that the protein subunits assemble fi rst into a hollow sphere followed by migration of mono-nuclear iron complexes (chelates) into the central cavity. Th e iron is then polymerised within the interior of the sphere until the polymer becomes too large to escape through the channels in the molecule. In order for the chelate-bound iron to be polymerised into ferrihydrite, oxygen must be present to produce the iron core and to participate in the oxidation of incoming Fe(II) atoms.
Ferrihydrite is an antiferromagnetic hydrated iron oxide, and nanoparticles of ferrihy-drite are superparamagnetic at physiological temperatures (above the Nèel temperature) (38). However, at room temperature the magnetization of a ferritin particle does not satu-rate even at fi elds as high as 5 Tesla. As a result, at physiological temperatures, ferritin pro-duces a magnetization that is directly proportional to the applied fi eld (similar to para-magnetic materials). Additionally, studies have shown that the transverse relaxation itself is directly proportional to the applied magnetic fi eld, something that is not observed with superparamagnetic particles commonly used as contrast agents (38). A proton exchange dephasing model has been developed to describe the relaxation of protons by ferritin par-ticles (38). In this model the interaction of hydroxyl groups on the surface of the ferritin particle is an important modulation factor for the transverse relaxation, since the mobility of these protons is restricted by proton exchange (exchange of protons with the absorption sites on the particle surface). Protons that are bound to the absorption site will experi-ence a diff erent local magnetic fi eld relative to protons free to move around the particle, thereby inducing dephasing of the spins with a subsequent increase in R2. Th e relaxation properties of ferritin are also pH dependent (39). At a pH of 7.1 (and Larmor frequency of 20 MHz), the r1 and r2 values are less than 1 s-1mM-1 (41).

53
Cellular uptake Non-phagocytosing cells acquire iron by processing Tf through acidic vesicles during receptor mediated endocytosis. Hepatocytes, however, have ferritin specifi c receptors that allow active uptake in these cells (30, 40-42). Although the hepatocellular ferritin recep-tor has been described and isolated, its physiological role is still unclear. It is believed that the ferritin receptor may be involved in the transfer iron from ferritin to heme in the mitochondria of the hepatocytes, or that the receptor is critical for iron plasma homeos-tasis, since the receptors may be up-regulated during times of plasma iron overload (satu-rated Tf).
KCs release a large fraction of the iron obtained by erythrophagocytosis in the form of ferritin (40-42). Th e ferritin released by KCs after erythrophagocytosis is similar to that of tissue ferritin, with an average of 2,400 iron atoms per molecule. Studies indicate that the iron rich ferritin released by the KCs is rapidly removed from circulation, presum-ably via hepatic receptor-mediated uptake (41). Studies in rats demonstrate that hepato-cytes quickly take up the iron rich ferritin released by the KCs. It has been shown that ferritin released from KCs fi rst binds to the plasma membrane followed by incorporation of the protein into the hepatocytes (40). Once in the lysosome of the cell, the protein is degraded, resulting in the release of the bound iron. All degradation products and protein fragments are exocyosed into the extra-cellular medium. Th is mechanism is signifi cantly diff erent than the mechanism observed for Tf cycle, where the carrier Tf protein is recy-cled without degradation.
Ferritin may also be released by macrophages in the spleen after erythrophagocytosis, resulting in ferritin delivery to the hepatocytes via the portal vein. Th e high KC release of ferritin during erythrophagocytosis may result in severe liver iron over load for conditions that require blood transfusion. It has been shown using ex vivo models that hepatocytes are able to acquire more than 30,000 iron atoms per hepatocyte per minute, making these cells effi cient scavengers of plasma ferritin (40). In addition it has been speculated that these receptors are important for ferritin clearance after cell necrosis or death.
2.2.3 Th e Liver and Cells of the RES“In its dependence on iron, the organism must always gapple with the twin hazards of iron overload and iron defi ciency”-Philip Aisen in Ann. Rev. Biochem 1980;49:357-393
In vertebrates, the liver is the largest of all internal organs. Th e liver lies toward the right side of the body, just under the diaphragm. Blood fl ow into the liver comes from two sources: First, oxygenated blood enters the liver via the hepatic artery. In humans, approximately 27% of the total blood fl ow is distributed to the liver (based on a per 100-g tissue-weight basis), making this the most perfused organ of the human body (kidneys 20% and muscle 21% at rest) (32). Th e blood entering the liver via the hepatic artery con-tains metabolites of hormones and drugs as well as important nutrients such as glucose and oxygen. Second, deoxygenated blood enters the liver via the portal vein. Th is blood

54
is rich in absorbed nutrients from the digestive tract, bile salts, bilirubin (heme iron) from haemoglobin breakdown in the spleen, and metabolites from peripheral tissues of the body. Th e liver uses the nutrients and metabolites for protein and hormone synthesis, urea and bile production, detoxifi cation of the blood, glucose and fat metabolism, and stor-age of necessary materials such as the iron from bilirubin. Th e bile produced by the liver hepatocytes is a non-enzyme solution that contains salts for fat digestion, bile pigments (bilirubin from haemoglobin degradation), and cholesterol. Th e waste material from the liver is excreted into the bile and secreted into common hepatic duct. Th e bile is then temporarily stored in the gallbladder prior to secretion into the lumen of the intestine (via the common bile duct), and then eliminated from the body in the faeces. Although blood can enter the liver via two pathways, all blood leaves the liver through the hepatic vein. Blood leaving the liver often contains glucose, plasma proteins (albumin, clotting factors, angiotensinogen), urea, vitamin D, and somatomedins that are produced within the liver (32).
Blood entering the liver fi rst meets liver endothelial cells that make up the vessels. Along with the obvious function of these cells with respect to the regulation of blood fl ow, these cells are also important for the protection of the hepatocytes from leukocytes and other antigens (43). Th e combined eff orts of liver endothelial cells and Kupff er cells results in hepatic immune tolerance that is ciritical for the normal functioning of the hepatocytes. Additionally, it has been demonstrated that lysed (or completely destroyed) red blood cells and cell fragments that contain heme iron are taken up by liver endothelial cells (44). Studies have also indicated that small iron oxide particles may also be taken up by liver endothelial cells (45). Th e sub-cellular distribution of the particles appears to be modulated by the size of the particles and by the coating materials. Once taken up by the liver endothelial cells, the iron oxide particles are degraded and cleared at a relatively slow rate, compared to clearance rate observed in liver Kupff er cells (45).
Lining the blood vessels are Kupff er cells that extend into the Spaces of Disse (the area located between the vessel and the hepatocytes). Th e Kupff er cells are responsible for the majority of senescent (old or damaged) red blood cell uptake via phagocytosis mecha-nisms. Th e Kupff er cells are also responsible for the removal of macromolecules, bacteria and other foreign material from the blood.
Important proteins, nutrients and enzymes that reach the Space of Disse come into con-tract with liver hepatocytes. Hepatocytes, which make up most of the liver volume, are critical with respect to iron metabolism and homeostasis. Th e most important functions of these cells (with respect to iron metabolism) are control of iron storage and release, syn-thesis of transferrin, and synthesis of specialised proteins used to recover heme iron (hap-toglobin and heamopexin) (30). Th e membrane surface of hepatocytes contains receptors that allow for receptor-mediated endocytosis of heam-haemopexin, transferrin and fer-ritin (35, 40). Since the majority of heme iron is released in one of these three forms, the hepatocytes acquire most of the heme iron released after erythrophagocytosis (destruc-tion red blood cells in Kupff er cells or macrophages of the spleen). Th e hepatocytes are

55
organised into irregular hexagonal units called lobules that are centred on a central vein. Along the lobule periphery, there are branches of the hepatic portal vein and hepatic artery that feed into a capillary bed and the central vein located within the lobule. Th e vessel network within a given lobule branches among the hepatocytes and forms sinusoids into which the blood fl ows. Approximately 70% of the surface area of each hepatocyte faces the sinusoids, maximising the exchange between blood and the cells. Only 15% of the hepatocyte membrane faces the bile canaliculi that are the small channels where bile is excreted.

56

57
3. STUDY AIMS
3.1 Main Aims• To evaluate the infl uence of iron oxide coating material and particle size on: 1) Rate of liver clearance in rats. 2) Rate of particle degradation in rat liver cells.
3.2 Specifi c Aims• To characterise the physical and chemical properties of fi ve iron oxide particles used
as contrast agents for MRI. Characterisation includes the evaluation of the magnetic properties, relaxation properties and T1-enhancing effi cacy in blood.
• To determine the sub-cellular biodistribution of one of the contrast agents studied using an isolated rat liver cell model.
• To determine if uptake into endothelial cells limits the degradation rate of iron oxide particles using an isolated rat liver cell model.
• To show that materials with magnetic properties similar to the breakdown products of iron oxide particles (ferritin/hemosiderin) may induce signifi cant signal loss (as R2*) in ex vivo rat Kupff er cell suspensions.
• To develop and validate methods to allow for the evaluation of liver clearance and iron oxide particle degradation rates using a rat model.
3.3 Purpose of individual studies
3.3.1 Study I• To characterise the physical and chemical properties of the fi ve iron oxide particles
that were used in the current work. Th e following physical and chemical properties were obtained using validated methods: Magnetic saturation, iron oxide core size and core size distribution, total hydrated particle size, and the relaxivities in water at dif-ferent Larmor frequencies and in a variety of matrices.
• To access the R2* eff ects in blood and correlate the results to the magnetic properties of the iron oxide particles (Msat values).
• To compare the T1-enhancing effi cacy of the iron oxide contrast agents in oxygenated blood using a phantom model.
• To introduce a new parameter, Msat/r1 , that may be used as an analytical tool for the prediction of the T1-enhancement effi cacy of iron oxide particles in blood.

58
3.3.2 Study II• To determine the sub-cellular biodistribution of NC100150 Injection in rat liver by
using isolated cell methods.• To quantify the uptake and degradation rate of NC100150 Injection rat liver Kupff er
cells, endothelial cells, and hepatocytes. • To evaluate the clearance of NC100150 Injection in isolated rat liver cells by monitor-
ing the concentration of breakdown products present in each cell fraction as a func-tion of time post-injection.
• To determine if uptake into liver endothelial cells limits the rate of iron oxide particle degradation and clearance, by comparing the results obtained in this cell fraction to the results obtained for Kupff er cells.
• To compare the rate of degradation of NC100150 Injection to other iron oxide parti-cles presented in the literature.
• To show by phantom models that the concentration of ferritin present during iron oxide degradation is adequate to produce signifi cant R2* eff ects in the liver.
3.3.3 Study III• To develop and validate the methods required to assess the rate of iron oxide particle
clearance and degradation in the liver of rats. • To determine the half-life of NC100150 Injection in rat liver at three dose levels (1, 2
and 5 mg Fe/kg b.w.). Th e concentration of iron oxide particles was determined using spectroscopy methods over a 133 day time period post-injection.
• To perform quantitative analysis of the liver R2* response as a function of time post NC100150 Injection administration using a rapid double-echo gradient echo sequence.
• To use the in vivo liver R2* results to defi ne the time post-injection when the iron oxide particles and breakdown products are cleared for the liver and released into the normal iron pool.
3.3.4 Study IV• To evaluate the infl uence of coating material and iron oxide particle size on the liver
clearance and degradation rates in rat liver. • To compare the liver half-lives of fi ve diff erent iron oxide particles using the same rat
model. Two of the materials studied had equivalent iron oxide cores and similar sizes, but the coating materials were diff erent. Additionally, two of the particles had diff er-ent sizes and but equivalent iron oxide cores and coating materials.

59
4. METHODS
4.1 Test systemsMR Imaging was performed ex vivo to investigate the relaxation enhancement eff ects in blood due to the presence of iron oxide contrast agents (Study I). Additionally, the eff ect of compartmentalisation on the eff ective transverse relaxation rates was evaluated by altering the concentration of hematocrit in the blood for one of the contrast agents tested (Study I). Ex vivo imaging was also performed in phantoms containing isolated rat Kupff er cells (Study II). Th e phantom studies were performed to verify that materi-als with magnetic properties similar to ferritin (the main breakdown product of particle degradation) may induce signifi cant signal loss when compartmentalised in a Kupff er cell suspension (Study III). In vivo imaging was performed on rats in order to defi ne a time point by which all the iron oxide particles and particle breakdown products were cleared from the liver (Study III and IV).
Additionally, pulse NMR spectrometry was performed to determine the transverse and longitudinal relaxivities of the fi ve contrast agents studied in the following matrices: aqueous solution, ex vivo blood, isolated rat liver cells and ex vivo rat liver homogenate. R1 nuclear magnetic dispersion (NMRD) profi les were obtained for all contrast agents in aqueous solution (Study I). Th e relaxivities of the contrast agents in ex vivo tissue (blood, isolated cells and liver homogenate) were obtained at 10, 20 and 60 MHz only. Th e relax-ivities obtained at 20 MHz for the isolated rat liver cells and the ex vivo liver homoge-nate were used to calculate the concentration of contrast agent present in the cells or liver homogenate, as a function of time post injection (Studies II-IV). Th ese values were then used to determine the degradation rates of iron oxide particles in the liver.
4.2 Ex vivo Models (All studies)Blood Samples (Study I)Th e eff ect of the applied magnetic fi eld strength on the longitudinal and transverse relax-ivity (r1 and r2, respectively) was determined for each of the contrast agents tested in oxygenated human blood ex vivo (Study I). Ex vivo human blood samples were prepared by obtaining 350 ml of blood from a local blood bank. Th e blood was type A+ with 46% hematocrit and sodium heparin as the anti-coagulant. Th e ex vivo blood was divided into fi fty 7-ml aliquots. Th e required amount of contrast agent was then added to each sample so that the concentration of iron oxide particles added ranged from 0 to 1.2 mM Fe. At least eight diff erent concentration levels were prepared for each contrast agent tested. Th e samples were mixed by gentle inversion for one minute and analysed within 2 hours after addition of the iron oxide particles.
Immediately after relaxation analysis, the percent hematocrit (Hct) in all blood sam-ples tested was determined using ultra-centrifugation techniques. After Hct determina-tion, the blood samples were then centrifuged for 10 minutes at room temperature and 3000 rpm. Th e plasma fraction was isolated and total iron content was determined using
60
inductively coupled plasma atomic emission (ICP-AES). Th e concentration of iron oxide particles present in each blood sample was determined by the following expression:
[28]
where [Fe]plasma is the total iron concentration in the plasma as determined by ICP-AES (mM Fe) and Hct is the percent hematocrit for the same sample as determined by ultracentrifugation.Variable Hematocrit Concentration (Study I)In order to obtain information related to the importance of compartmentalisation on the eff ective transverse relaxation; three samples were prepared with 0, 23, and 52% Hct (Study I). Human blood samples were prepared at the diff erent Hct levels by either diluting whole blood with plasma to produce samples with 23% Hct, or by adding addi-tional erythrocytes to produce samples with 53% Hct. NC100150 Injection was added to the blood samples at concentrations ranging from 0 to 0.5 mM. Th e concentration of NC100150 Injection was determined based on the blood volume, so that the concentra-tion of NC100150 Injection remained constant despite the changes in Hct.Isolated rat liver cells (Study II) A total rat liver cell suspension was obtained by enzymatic perfusion of the liver by a two step procedure (Study II). Th e liver cell suspension was fi ltered through a double layer of nylon gauze (100 µm and 250 µm) and rapidly cooled to 4° C. Th e parenchymal cells were sedimented by centrifugation for 2 min at 34 x g. Th e pellet was resuspended in a Hepes buff er containing bovine serum albumin (BSA, 1% w/v) and the centrifugation was repeated. Non-parenchymal liver cells were sedimented from the supernatants by centrifugation for 5 min at 677 x g. For further purifi cation the NPCs were resuspended in Nycoprep (1.15 g/ml) diluted in the Hepes-buff er containing BSA (1% w/v) to 0.86 g/ml, carefully overlaid with Hepes buff er containing BSA (1% w/v) and centrifuged for 3 min at 69 x g and then for 12 min at 2254 x g. Th e NPC fraction was collected from the interface, washed and resuspended in the Hepes buff er containing BSA (1% w/v). Th e NPCs were separated by centrifugal elutriation using a Beckman J-6M/E (Glerlothes, Scotland) centrifuge equipped with a Beckman JE-5.0 elutriation rotor with a standard chamber. Liver endothelial cells (ECs) and Kupff er cells (KCs) were eluted at 2500 rpm/min at a fl ow rate of 22 ml/min and 28-55 ml/min, respectively.
Th e parenchymal cells, identifi ed by their characteristic morphology, were more than 95 % viable as tested by Trypan Blue exclusion test; and the NPCs were close to 100 % viable by the same criterion. Th e diff erent NPCs were distinguished by their negative (ECs) or positive (KCs) staining of endogenous peroxidase. To obtain pure endothelial and Kupff er cell fractions, the suspensions of NPC (containing KC and EC) were seeded on glutaraldehyde-fi xed albumin coated dishes (Study II). Th ey were incubated for 20 minutes at 37° C, resulting in attachment and spreading of KCs only. Unattached cells
[Fe]blood = [Fe]plasma x (1-Hct)
61
were transferred to fi bronectin-coated dishes to enable attachment and spreading of ECs. Th e purities of the Kupff er and endothelial cells in the cultures were at least 99%, moni-tored by counting the percentage of peroxidase positive Kupff er cells.Rat liver homogenate (Studies II - IV)Samples of rat liver homogenate were prepared immediately following sacrifi ce or quan-titative R2* analysis (Study II, III and IV). Th e livers were excised, cleaned for excess fat and blood and homogenised using a Constant Cell Disruption System (Holly Farm Busi-ness Park, Warickshire, UK). Complete destruction of all liver cells by the homogenisa-tion process was confi rmed by light microscopy.
4.3 Animal Models (Studies II, III and IV) In the current work either Male BLK or male Wister rats were used to evaluate liver clear-ance and degradation of iron oxide based contrast agents. All rats were approximately 6 weeks old at the study’s start and were assigned to their cages by defi ned randomisation methods. Each animal was marked with a numbered ear tag and acclimatised for at least 5 days before administration of the test or control substances. During all studies, animals were kept at 12 hours of light and 12 hours of darkness per 24 hours, in phase with natu-ral daylight.
Th e general appearance and behaviour of all rats was observed prior to and during dosing, at least twice following dosing, and at least once daily thereafter. Any responses including onset of clinical signs, progression of eff ects, duration and mortality were moni-tored and recorded. Body weights were measured prior to dosing and weekly thereafter until sacrifi ced. Animals were weighed immediately prior to sacrifi ce by CO2 affi xation. All injection volumes, actual dosages administered, and animal and liver weights were recorded. Th e animals used in Studies II-IV are described separately below.Study IIMale, Wistar rats (B&K, Sweden, n=38) were approximately 6-14 weeks old and weighed 233 - 435 grams at time of sacrifi ce. Animals were housed at the Department of Biology at the University of Oslo, Oslo, Norway, for the duration of the study. Th e experiments were performed with the approval of the Ethical Committee for Animal Experiments of the University of Oslo. All animals were allowed ad libitum access to both food (Rat & Mouse No. 1 Maintenance Diet, B&K, Sweden) and water until 24 hours prior to liver perfusion. All animals were fasted overnight before termination.Study IIIA total of 108 male rats (Bkl: SD, B&K, Sweden) were included in the study. Rats were approximately 6 weeks old and weighed 160-190 grams upon arrival. Th e animals were kept three per cage in macrolon cages type III, and placed on racks in the assigned ani-mal room at Amersham Health (Oslo, Norway). Type Beekay Lab cage bedding (B & K Universal A/S, Norway) was used. Th e temperature was kept at 21 ± 2° C and the humid-ity maintained at 55 ± 10% during the entire duration of the study. Ventilation provided
62
approximately 20 air changes per hour. All rats were fed ad libitum (Rat & Mouse No. 1 Maintenance Diet, Expanded Special Quality Control (Special Diets Services, Sweden). Rats were allowed to drink municipally supplied tap water ad libitum. Th e study was approved by the local ethics committee in accordance with Norwegian regulations. Study IVTh e experiments were performed with the approval of the Ethical Committee for Animal Experiments of Uppsala University. A total of 150 male, Bkl: SD rats (B&K, Denmark) were used in this study. Rats were approximately 6 weeks old and weighed 160-190 grams at arrival. All animals were allowed ad libitum access to both food (R3 from EWOS AB, Södertälje, Sweden) and water.
4.4 Contrast AgentsTh e following fi ve diff erent iron oxide based contrast agents were used in this work: AMI-227 (Study I and IV), SHU 555A (Study I and IV), Fractionated SHU 555A (Study I and IV), NC100150 Injection (All studies) and unformulated NC100150 (Study I and IV).
AMI-227 (Sinerem™, Laboratoire Guerbet SA, France, purchased in Sweden), also known as Ferumoxtran, has a reported mean hydrated particle size and iron oxide core diameter of approximately 20 nm and 4-5 nm, respectively. AMI-227 has a neutral Dex-tran T-10 coating associated with the surface of the iron oxide core and exhibits relatively long blood half-lives (>200 minutes) in rats. Due to the long circulation times, this par-ticle is primarily taken up by the RES of bone marrow and lymphatic tissue with only approximately 6% of the injected dose (%ID) taken up by the RES of the liver. As a result AMI-227 is used primarily for imaging of the lymphatic system and bone marrow.
SH U555A (Resovist™, Schering AG, Berlin) has a reported mean hydrated particle size of 57-59 nm. SHU 555A has a relatively short blood half-life (order of minutes) in rats and is primarily taken up by the RES of the liver (80% ID). As a result, SHU 555A is used primarily for the detection and diff erentiation of liver lesions.
Ultracentrifugation methods were used to produce the Fractionated SHU 555A pre-sented in this study. Undiluted SHU 555A was centrifuged at 4000 rpm using ultracen-trifuge fi lters with a cut off size of 20 nm. Th e resulting fi ltrate was then sterile fi ltered and analysed with respect to total hydrated particle size and total iron content, prior to injection into animals. Th e blood half-life of this material in rats was 90 minutes follow-ing administration of a 2 mg Fe/kg dose.
Th e reported mean hydrated particle diameter of NC100150 Injection (Amersham Health, Oslo) in water is 12 nm. NC100150 Injection has a methoxy polyethylene glycol phosphate (Molecular weight 2000 often referred to as MPP2K) coating and is the only non-dextran based particle currently in clinical use. Despite the small size of this parti-cle, the blood half-life is comparatively shorter (45 minutes in rats following a 2 mg Fe/kg dose) than that observed for AMI-227. NC100150 Injection is primarily taken up by the RES of the liver (80% injected dose) and can be used for MRA, perfusion and liver imaging.


64
Phantoms were imaged using RF-receive only head coil (Studies I and II). Nine rats were imaged simultaneously using RF-receive only head coil (Studies III and IV).
4.6 Determination of R2* values (All studies)Study IFrom the multiple-echo images, quantitative R2* values (1/T2*) were calculated by assuming mono-exponential signal decay:
[29]
where SI(TE) is the signal intensity observed at a given echo time, TE, and C is a con-stant that refl ects the background noise.
Th e signal intensities were measured from a region of interest (ROI) covering a substan-tial portion of the blood in the phantom. Th e quantitative R2* analysis was performed with a dedicated image processing package (DimView, Rikshospitalet University Hospi-tal, Oslo, Norway). Studies II-IVTh e 1/T2* relaxation rate (R2*) was quantifi ed using 2D-FFE (fast fi eld) double echo sequences by assuming the signal decay to be mono-exponential. R2* values were deter-mined according to Equation 18.
Th e signal intensities were measured from a region of interest (ROI) covering a substan-tial part of the phantom tube or the liver parenchyma. For liver samples, care was taken to avoid inclusion of large vessels in the ROIs.
4.7 Relaxation AnalysisNMRD Profi les in Water (Study I)T1 NMRD profi les were recorded at 37° C from 0.01 MHz to 10 MHz on a Spinmaster fast fi eld cycling relaxometer (Stelar, Mede, Italy) (Study I). Th e marginal error on the relaxation times was less than 4%. Additional high fi eld points were obtained at 20 and 60 MHz, using two diff erent NMR pulse spectrometers (Bruker Medical BmbH, Ettin-gen, Germany). Th e results from the NMRD analysis were fi t according to current iron oxide relaxation theory (26). From the fi tting, the average diameter of the crystals, the specifi c magnetization and the Neel relaxation times were obtained. Relaxometry (All studies)All relaxation analysis was performed at 10, 20 and 60 MHz and 40° C using three diff er-ent Bruker Minispec spectrometers (Bruker Medical GmbH, Ettlingen, Germany). Th e longitudinal relaxation times, T1, were determined using an inversion-recovery sequence with 15 inversion times, and values were calculated based on a mono-exponential fi t of signal intensity versus time. Transverse relaxation times, T2, were obtained by using a CPMG spin echo sequence with an echo time 0.5 milliseconds, with the total echo num-
CTERSITESI )exp()0()( *2
65
bers obtained ranging from 50, at high iron oxide particle concentrations, and 100 for the controls. Th e signal from every second echo was obtained and the relaxation time calcu-lated from a mono-exponential fi t of echo intensity versus time. In order to avoid changes in T1 or T2 due to denaturing or decomposition of cell fragments or liver homogenate samples, all relaxometry was performed within 15 minutes after homogenisation and exposure to 40° C.
To obtain dose-response curves for the contrast agents in aqueous solution (Study I), rat liver cell homogenate (study II), and homogenised rat liver (Studies III and IV), known concentrations of the contrast agents were added to the background matrix. At least 7 diff erent concentration levels were prepared with iron oxide concentrations ranging from 0 to 1.2 mM Fe. Immediately after relaxation analysis, all samples were sent to ICP-AES for measurement of the total iron concentration. Calculation of Relaxivity (All studies) From the dose-response curves, the longitudinal (r1) and transverse (r2) relaxivities in blood were determined according to the following expression:
[30]
where Y is the relaxation rate of the sample containing the iron oxide particles (1/s), x is the concentration of iron oxide particles present (in mM, as determined by ICP-AES), r is the slope of the linear correlation (equal to the relaxivity in s-1mM-1), b is the relaxa-tion rate of a blank sample not containing the contrast agent (1/s), and n is the factor of curvature associated with the fi t.
A linear correlation was defi ned by the following criteria: factor of curvature between 0.90 and 1.10, correlation coeffi cient greater than 0.985, and the distribution of points around the regression curve randomly distributed. For data exhibiting non-linear corre-lations, polynomial expressions were used to fi t the data. All analysis was performed in Excel (Microsoft).
Once the correlation between the R1 and R2 values and contrast agent concentration were established, the corresponding iron oxide concentrations found in the various matri-ces were calculated according:
[31]
[Fe] is the concentration of test material in mmol/L, R1,2dosed and R1,2c are the longitu-dinal (R1) and transverse (R2) relaxation rates for the dosed and control groups, respec-tively; and r1,2 is the relaxivity of the test material in the matrix.
2,12,12,1 /)( rRRFe cdosed
Y = rxn + b

66
4.8 Magnetisation and core size (Study I)Magnetization curves were obtained using a Vibrating Sample Magnometer (VSM, Lake-shore model 7307, Oxford Instruments, UK) within a fi eld range of ± 0.1 Tesla and ± 1.0 Tesla. Tefl on sample holders were used with sample volumes of 50 microlitres. Th e satu-ration magnetization, Msat, was calculated and expressed in units of emu/g iron. Th e iron oxide core size and core size distributions were calculated for each of the contrast agents studied based on a log-normal distribution of size with the assumption that the iron oxide cores were single domain. Th e fi tting of the data was performed with Matlab (Th e Math-Works Inc. USA). All measurements were performed using the undiluted stock solutions for each of the contrast agents.
4.9 Particle size (Studies I and IV)Th e mean hydrated particle sizes were determined using a Brookhaven light scattering spectrophotometer (BI-9000AT; Brookhaven Instruments Corporation, Holtsville, NY) equipped with a 150 mW laser (514 nm). Th e scattering angle was 90° and data was ana-lysed by the method of cumulants.
4.10 Total Iron determination (All studies)Th e total iron concentrations in water and plasma were determined by inductively coupled plasma atomic emission (ICP-AES). Th e analytical precision of the ICP-AES method, as refl ected by the relative standard deviation, is better than 2% in both water and plasma.
4.11 Phantom preparation (Studies I and II)Study ITwo round glass phantoms (2 litres) were prepared by fi xing either thirty-two 5-ml glass vials (for the evaluation of the eff ect of concentration on R2*) or twelve 5-ml glass vials (for the eff ect of %Hct on R2*) in agarose gel suspensions with T1 value of 800 ms at 60 MHz. Th e glass vials were fi lled with the same blood samples or %Hct samples prepared for the relaxation analysis. All imaging was performed within 5 hours after addition of the test material to the blood samples. Study IITwo glass tubes (14 mm diameter) were fi xed in a 135 mm diameter glass bowl contain-ing 2% agar gel. One glass tube contained a Gd-DTPA-BMA in a Hepes buff er solution containing bovine serum albumin (BSA, 5% w/v) and the other tube contained Gd-DTPA-BMA in a suspension of isolated rat Kupff er cells at a concentration of 9 x 10⁶ KCs/ml. Gd-DTPA-BMA was added to both phantom tubes (BSA buff er and Kupff er cell suspension) so that the concentration of gadolinium was 3 mM. Th e phantom was imaged immediately. Th e phantom was then removed from the scanner and an additional 3 mM of Gd was added so that the total concentration was 6 mM Gd in both tubes. Th e sample was imaged immediately after addition of Gd-DTPA-BMA. Th e contrast agent was repeatedly added to the phantom tubes so that the total concentration of gadolinium injected ranged from 0 to 33 mM (for a total of 11 standard additions).
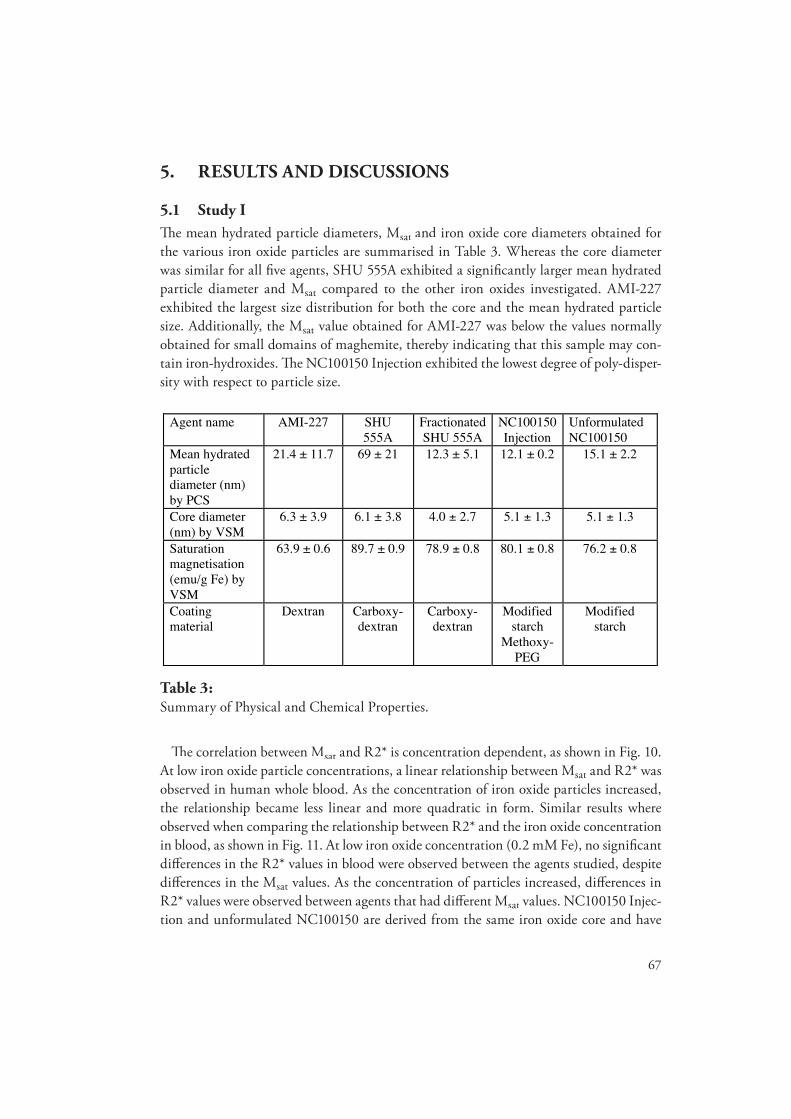

68
similar Msat and core sizes, as shown in Table 3. As a result, the R2* values obtained for these two agents were not signifi cantly diff erent at any of the concentration levels stud-ied.
Th e results of the present study strongly suggest that the distribution of the local mag-netic fi eld generated by the particles may change as the concentration, or degree of com-partmentalization, increases. At low particle concentrations (low degree of compartmen-talization) the distribution in the local magnetic fi elds may be more Lorentizan, so that a linear relationship between R2* and Msat may be observed. As the concentration of par-ticles increases (and the degree of compartmentalization) the distribution may become more Gaussian, resulting in non-linear, almost quadratic relationship between R2* and concentration and R2* and Msat.
Whereas the hydrated particle size defi nitely infl uences the dipolar R2 values, the parti-cle size did not appear to infl uence the R2* values obtained in this study. No direct corre-
Fig. 10: Correlation between Msat and R2* in blood at 1.5 Tesla as a function of iron oxide concentration.
y = 0.4882x2 - 62.543x + 2482.3
R2 = 0.937
0
100
200
300
400
500
600
700
800
900
60 70 80 90
Msat (emu/g Fe)
R2*
(1/
s)
[Fe] 1.2 mM
[Fe] 0.8 mM
[Fe] 0.4 mM
[Fe] 0.2 mM
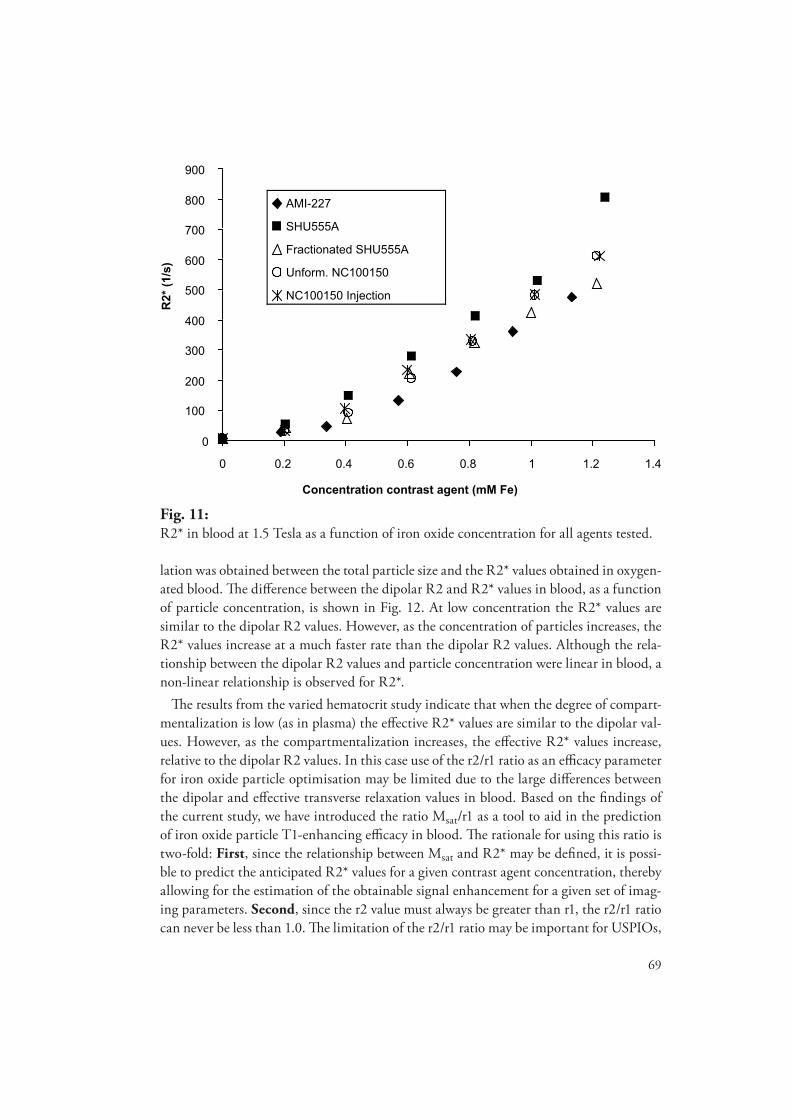
69
lation was obtained between the total particle size and the R2* values obtained in oxygen-ated blood. Th e diff erence between the dipolar R2 and R2* values in blood, as a function of particle concentration, is shown in Fig. 12. At low concentration the R2* values are similar to the dipolar R2 values. However, as the concentration of particles increases, the R2* values increase at a much faster rate than the dipolar R2 values. Although the rela-tionship between the dipolar R2 values and particle concentration were linear in blood, a non-linear relationship is observed for R2*.
Th e results from the varied hematocrit study indicate that when the degree of compart-mentalization is low (as in plasma) the eff ective R2* values are similar to the dipolar val-ues. However, as the compartmentalization increases, the eff ective R2* values increase, relative to the dipolar R2 values. In this case use of the r2/r1 ratio as an effi cacy parameter for iron oxide particle optimisation may be limited due to the large diff erences between the dipolar and eff ective transverse relaxation values in blood. Based on the fi ndings of the current study, we have introduced the ratio Msat/r1 as a tool to aid in the prediction of iron oxide particle T1-enhancing effi cacy in blood. Th e rationale for using this ratio is two-fold: First, since the relationship between Msat and R2* may be defi ned, it is possi-ble to predict the anticipated R2* values for a given contrast agent concentration, thereby allowing for the estimation of the obtainable signal enhancement for a given set of imag-ing parameters. Second, since the r2 value must always be greater than r1, the r2/r1 ratio can never be less than 1.0. Th e limitation of the r2/r1 ratio may be important for USPIOs,
0
100
200
300
400
500
600
700
800
900
0 0.2 0.4 0.6 0.8 1 1.2 1.4
Concentration contrast agent (mM Fe)
R2*
(1/
s)
AMI-227
SHU555A
Fractionated SHU555A
Unform. NC100150
NC100150 Injection
Fig. 11: R2* in blood at 1.5 Tesla as a function of iron oxide concentration for all agents tested.

70
where the ratios are normally less than 3 (in water at 20 MHz). As shown in Fig. 13, for the USPIOs that exhibit small ratios in water (< 3), is was not possible to correlate the r2/r1 ratio with the relative contrast enhancement obtained in static blood samples sus-pended in a phantom. A linear correlation was, however, observed for the Msat/r1 ratio, and relative contrast enhancement for all the agents studied. However, one limitation of using the Msat/r1 ratio is that this value will be over estimated at low fi eld strengths prior to saturation of the magnetization. In these cases, Magnetization/r1 values should be used for predicting or optimising the T1-enhancing effi cacy of USPIOs. Th e r2/r1 and Msat/r1 ratios are analytical tools to aid in the design, optimisation and prediction of the T1 enhancing effi cacy of iron oxide particles. Th e enhancement observed in vivo, however, will also be dependent upon the pulse sequence, pulse sequence parameters and other physiological properties (such as water exchange that may modulate the eff ective r1values, and aggregation that infl uences r2*).
r1 NMRD profi les are used to evaluate the spectra density functions (Freed and Ayant) that modulate the relaxation of water protons in the presence of iron oxide particles. In addition, low fi eld dispersion may be used to verify that the agents are composed of small mono-disperse single domain iron oxide cores.
y = 47.544x + 5.4906
R2 = 0.9944
y = 217.64x2 + 252.47x - 8.6933
R2 = 0.9961
-100
0
100
200
300
400
500
600
700
0 0.5 1 1.5
Concentration NC100150 (mM Fe)
tran
sver
se r
elax
atio
n r
ate
(1/s
)
R2 at 60 Mhz
R2* at 63 MHz
Fig. 12: Comparison of the dipolar and eff ective relaxation rates for blood containing the NC100150 injection.
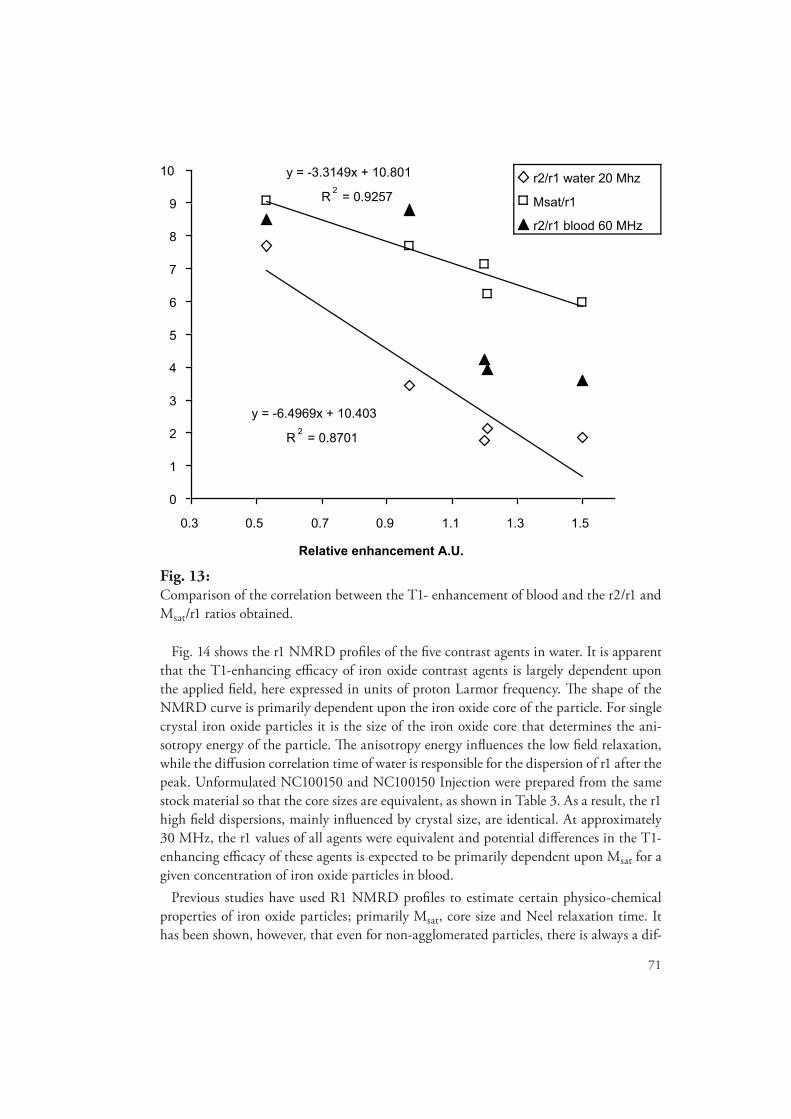
71
Fig. 14 shows the r1 NMRD profi les of the fi ve contrast agents in water. It is apparent that the T1-enhancing effi cacy of iron oxide contrast agents is largely dependent upon the applied fi eld, here expressed in units of proton Larmor frequency. Th e shape of the NMRD curve is primarily dependent upon the iron oxide core of the particle. For single crystal iron oxide particles it is the size of the iron oxide core that determines the ani-sotropy energy of the particle. Th e anisotropy energy infl uences the low fi eld relaxation, while the diff usion correlation time of water is responsible for the dispersion of r1 after the peak. Unformulated NC100150 and NC100150 Injection were prepared from the same stock material so that the core sizes are equivalent, as shown in Table 3. As a result, the r1 high fi eld dispersions, mainly infl uenced by crystal size, are identical. At approximately 30 MHz, the r1 values of all agents were equivalent and potential diff erences in the T1-enhancing effi cacy of these agents is expected to be primarily dependent upon Msat for a given concentration of iron oxide particles in blood.
Previous studies have used R1 NMRD profi les to estimate certain physico-chemical properties of iron oxide particles; primarily Msat, core size and Neel relaxation time. It has been shown, however, that even for non-agglomerated particles, there is always a dif-
y = -3.3149x + 10.801
R2 = 0.9257
y = -6.4969x + 10.403
R2 = 0.8701
0
1
2
3
4
5
6
7
8
9
10
0.3 0.5 0.7 0.9 1.1 1.3 1.5
Relative enhancement A.U.
r2/r1 water 20 Mhz
Msat/r1
r2/r1 blood 60 MHz
Fig. 13: Comparison of the correlation between the T1- enhancement of blood and the r2/r1 and Msat/r1 ratios obtained.

72
ference between the core size and Msat values obtained by NMRD and magnetometry. Th e method dependent variation in core size and Msat is primarily due to the high sen-sitivity of R1 to variations in the size distribution of the particles. For example, whereas R1 values are proportional to the iron oxide core radius raised to the fi fth power (r5), the magnetization obtained by magnetometry is only dependent upon the core radius cubed (r3). For purely mono-disperse particles, the values should be similar. However, all mate-rial in the present study exhibited some degree of poly-dispersity, as shown in Table 3. As a result, when the core sizes were estimated from the fi t of the r1 NMRD profi les, the val-ues obtained were over-estimated by a factor of 27 to 65%, relative to the results obtained by magnetometry. In addition, the Msat values were over-estimated (5-38%) for contrast agents except NC100150 Injection (under-estimated by 4%). Th e results of this study suggest that magnetometry methods should be employed for the determination of Msat.
5.2 Study IITh e main fi nding of this study was that rat liver endothelial and Kupff er cells exhibit similar uptake patterns and particle clearance rates following a single 5 mg Fe/kg bolus injection of NC100150 Injection, as shown in Fig. 15. Th e relatively effi cient uptake in Kupff er and endothelial cells indicates that these particles may be taken up by adsorptive or receptor-mediated endocytosis. NC100150 particles were not found in the hepatocytes at any of the time points studied, indicating that fl uid-phase endocytosis cannot explain the high uptake into Kupff er and endothelial cells.
0
20
40
60
80
100
120
0.1 1 10 100 1000
Larmor Frequency (MHz)
r1 (
s-1m
M-1)
unformulated NC100150
AMI-227
Fractionated SHU 555A
NC100150 Injection
SHU 555A
Fig. 14: r1 NMRD profi le of the contrast agents tested in aqueous solution.
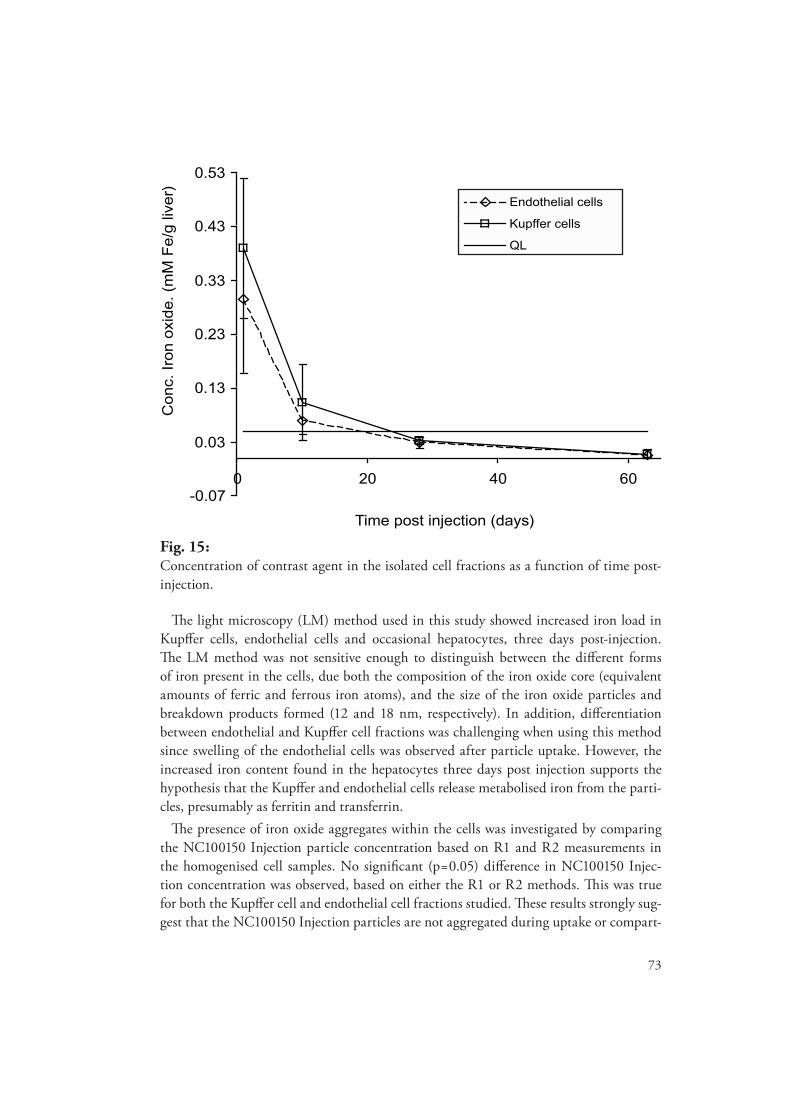
73
Th e light microscopy (LM) method used in this study showed increased iron load in Kupff er cells, endothelial cells and occasional hepatocytes, three days post-injection. Th e LM method was not sensitive enough to distinguish between the diff erent forms of iron present in the cells, due both the composition of the iron oxide core (equivalent amounts of ferric and ferrous iron atoms), and the size of the iron oxide particles and breakdown products formed (12 and 18 nm, respectively). In addition, diff erentiation between endothelial and Kupff er cell fractions was challenging when using this method since swelling of the endothelial cells was observed after particle uptake. However, the increased iron content found in the hepatocytes three days post injection supports the hypothesis that the Kupff er and endothelial cells release metabolised iron from the parti-cles, presumably as ferritin and transferrin.
Th e presence of iron oxide aggregates within the cells was investigated by comparing the NC100150 Injection particle concentration based on R1 and R2 measurements in the homogenised cell samples. No signifi cant (p=0.05) diff erence in NC100150 Injec-tion concentration was observed, based on either the R1 or R2 methods. Th is was true for both the Kupff er cell and endothelial cell fractions studied. Th ese results strongly sug-gest that the NC100150 Injection particles are not aggregated during uptake or compart-
Fig. 15: Concentration of contrast agent in the isolated cell fractions as a function of time post-injection.
-0.07
0.03
0.13
0.23
0.33
0.43
0.53
0 20 40 60
Time post injection (days)
Conc.
Iro
n o
xide.
(mM
Fe/g
live
r)
Endothelial cells
Kupffer cells
QL

74
mentalization within the cells. Aggregation of NC100150 Injection particles will result in artifi cially high concentration values based on R2, due to the enhancement of T2-eff ects above the dipolar values.
Th e rat liver is made up of three main cell types: Kupff er cells (18 million cells/g liver), endothelial cells (36 million cells/g liver) and parenchymal cells (125 million cells/g liver). In addition there are a small number of Stellate cells and NK-cells. Previous studies have indicated that Kupff er cells may be more effi cient at metabolising iron oxide particles than liver endothelial cells. Th e rate of metabolism in these cells is believed to be depend-ent upon the concentration of iron oxide particles taken up by each cell type. As a result, the rate of iron oxide metabolism in the liver is believed to be dependent upon the dose injected, percent initial dose taken up by the liver, and cellular distribution within the liver. However, Fig. 15 and Fig. 16 indicate that the concentration of NC100150 Injection particles and the concentration of breakdown products were similar in both Kupff er and endothelial cells at all time-points studied, with the exception of days 10 post injection. Th is implies that the endothelial cells and Kupff er cells were equally eff ective in metabo-lising the NC100150 Injection particles. Th e variation observed between this study and previously published studies may be due to diff erences in the iron oxide particles used (coating materials and size) and/or diff erences in methodology.
0
0.05
0.10
0.15
0.20
0.25
0.30
0 20 40 60 80 100
Time post injection (days)
[ F
e]
(mM
)
Endothelial cells
Kupffer cells
Fig. 16: Concentration of breakdown products in the isolated cells as a function of time post-injection.

75
Fig. 17 shows that the compartmentalization of a material with a magnetic moment similar to that of ferritin (Gd-DTPA-BMA) in a viable cell suspension may induce sig-nifi cant R2* enhancement. Th e eff ect of the compartmentalization on R2* is related to a variety of factors, including: the degree of compartmentalization (number of cells), the relative size of the compartment, rate of water exchange through the cell or compartment, concentration of the magnetic material within the compartment, and the magnetic sus-ceptibility (or magnetization) of the magnetic material at the applied fi eld strength. Th e phantom model used in this study is, therefore, equivalent to a compartmentalised system in which the susceptibility diff erence is induced by increasing intra-cellular susceptibil-ity, rather than increasing extra-cellular susceptibility, as done here for practical reasons. In the current study, the concentration of iron in the breakdown products was approxi-mately 0.06 mM in the Kupff er cell fraction at 84 days post injection (see Fig. 16). Th is concentration represents the iron concentration of the breakdown products in the total liver volume. Given that the Kupff er cell volume fraction is about 2%, and assuming that the lysosome volume fraction is less than 10% of the Kupff er cell, the actual intra-cellular concentration of iron is at least two orders of magnitude higher then the total liver volume concentration. Consequently, the concentration of breakdown product in the lysosomes of Kupff er cells at 84 days is likely to be greater than 60 mM Fe (two orders of magnitude higher than the 0.06 mM value obtained from Fig. 16).
y = 4.5756x + 0.8221
R2 = 0.9997
y = 5.6056x + 5.3081
R2 = 0.9982
0
50
100
150
200
250
0 10 20 30 40
Concentration of gadolinium (mM)
R2*
(1/
s) a
t 1.5
Tes
la5% Albumin Buffer
Viable KC suspension
Fig. 17: Eff ect of materials with similar magnetic properties as ferritin on the eff ective transverse relaxation rates in buff er and a cell suspension.

76
5.3 Study IIITh e main fi nding of this study was that following single bolus administration of NC100150 Injection, the R2* values obtained in rat liver remained enhanced even though the iron oxide particle concentration was below method quantifi cation limits. Th e prolonged liver R2* enhancement was dose dependent, with liver R2* values returning to control values within 63 days following a 1 mg Fe/kg dose, and exceeding 133 days following a 5 mg Fe/kg dose, as shown in Fig. 18. Th e concentration of iron oxide particles in the liver, how-ever, was below quantifi cation limits within 18 and 63 days following administration of 1 and 5 mg Fe/kg NC100150 Injection, respectively as shown in Fig. 19. Based on these fi ndings it is possible to conclude that the prolonged liver R2* enhancement observed following administration of NC100150 Injection is due to the presence of the iron oxide breakdown products that are compartmentalised within the lysosomes of the sinusoidal liver cells.
ICP-AES analysis was performed so that the concentration of breakdown products in ex vivo liver homogenate could be monitored as a function of time post-injection. After 28 days post injection, no signifi cant diff erence in the mean total liver iron concentrations were observed between the treated animals and the untreated control group. However, relaxometric analysis clearly indicated that signifi cant amounts of iron oxide particles
Fig. 18: Eff ective transverse relaxation rate of rat liver as a function of time post-injection, following administration of NC100150 Injection.
-20
30
80
130
180
230
280
330
380
430
0 15 30 45 60 75 90 105 120 135
Time post injection (days)
R2*
(1/
s) in
rat
live
r 1 mg Fe/kg2 mg Fe/kg5 mg Fe/kg
*
*
**
*
* *
**
** *
*
* *
**
*
*
In vivo rat liver

77
were present in the liver for more than 42 days following administration of 5 mg Fe/kg NC100150 Injection. In addition, the R2* results clearly indicate that particle breakdown products were present in the liver for more than 133 days following injection of the high dose. Based on these fi ndings, it may be concluded that the ICP-AES method is not sensi-tive enough to detect the presence of iron oxide particles or particle breakdown products at late time points following the administration of NC100150 Injection.
Th e liver R2* values obtained in this study were used to determine the time at which the iron oxide particles were degraded and the breakdown products (primarily as ferritin) were exocytosed out of the liver cells and returned to normal iron pool. In this respect, the R2* results obtained in this study were used as metabolic endpoints, and not used to determine the kinetics associated with the liver metabolism.
Relaxometry results were used to determine the half-life of the iron oxide particles in the liver as a function of dose. Due to the limited number of data points obtained, data was fi t using a biphasic clearance model only. Th e results indicate that the degradation of iron oxide particles is dose dependent with relatively fast mono-exponential degrada-tion at low doses (half-life of 8 days following administration of 1 mg Fe/kg) and slow bi-exponential degradation at higher dose levels. Th ese results correlate well with the liver
Fig. 19: Concentration of contrast agent found in rat liver homogenate as a function of time post-injection.
Ex vivo rat liver homogenate
-0.25
-0.10
0.05
0.20
0.35
0.50
0.65
0.80
0.95
1.10
1.25
1.40
15 30 45 60 75
Time post injection (days)
[Fe]
mM
bas
ed o
n R
1 re
sult
s
1 mg Fe/kg
2 mg Fe/kg
5 mg Fe/kg
QL


79
Iron oxide particles with the same coating material but diff erent particle sizes exhibited similar rates of iron oxide particle degradation in the liver. As shown in Table 4, Fraction-ated SHU 555A and SHU 555A are made up of the same core and coating material, but have diff erent hydrated particle sizes and size distributions. Despite diff erences in size, the liver R2* values in rats returned to baseline, relative to the control values, at similar time points for both the doses studied. In addition, both materials exhibited similar liver half-lives of 10 days following administration of a 5 mg Fe/kg dose (Table 4). Th ese results strongly suggest that SHU 555A and Fractionated SHU 555A may have similar rates of degradation and clearance in the liver of rats.
Although the hydrated particle size does not seem to regulate the rate of iron oxide clearance, the amount of iron oxide particles taken up by liver cells is expected to greatly infl uence the rate of clearance. Table 4 summarises the time required for the liver R2* values to return to baseline control values as a function of dose. For all contrast agents tested, the liver R2* values returned to baseline values at earlier time points when lower doses were administered, thereby indicating that degradation and clearance are directly linked to the amount of particles taken up by the liver cells.
Th e results of this study support the hypothesis that the compartmentalization of the breakdown products of iron oxide particles (primarily as ferritin/hemosiderin) can induce signifi cant R2* eff ects in the liver. Th e concentration of unformulated NC100150 found in liver homogenate was below quantifi cation limits 18 days after the administration of the high dose, as shown in Fig. 20. However, the liver R2* values remained greater than control values for up to 42 days post injection (p=0.002) as shown in Fig. 21. All contrast agents tested exhibited the same trend, in that the liver iron oxide particle concentrations returned to control values at a much faster rate than the liver R2* values. Since no quan-tifi able amount of iron oxide particles were present at these time points, the elevated liver R2* values may be attributed to compartmentalization of the breakdown products within the cells.
In the present study, no signifi cant (p>0.05) diff erence in iron oxide concentration in homogenised liver was observed based on either the R1 or R2 methods for all contrast agents studied, except Fractionated SHU 555A. Th ese results strongly suggest that sig-nifi cant aggregation occurs when Fractionated SHU 555A is either taken up or compart-mentalised within the lysosomes of liver cells. Despite the discrepancy between concen-trations, both methods show that the concentration of Fractionated SHU 555A in rat liver is below quantifi cation limits after 42 days following the administration of a 5 mg Fe/kg dose. Th erefore, no quantifi able amounts of the iron oxide particles are present in the liver after this time point post-injection. Since Fractionated SHU 555A is produced from SHU 555A it is interesting that no intra-cellular iron oxide aggregation was observed for SHU 555A. It is likely that the changes in relaxation parameters induced by the intra-cel-lular aggregation of the small particle fraction is below this method’s detection limits and therefore not observed. As a result, it is only when the small particle fraction is isolated that the eff ects of intra-cellular aggregation may be fully appreciated.

80
Fig. 20: Concentration of contrast agent found in rat liver homogenate as a function of time post-injection, following administration of the high dose.
5 mg Fe/kg
0
0.2
0.4
0.6
0.8
1.0
1.2
0 10 20 30 40 50 60 70
Time post injection (days)
Co
nc.
of
iro
n o
xid
e p
arti
cles
in li
ver
(mM
Fe)
NC100150 Inj
unform. NC100150

81
Fig. 21: Evolution of the eff ective transverse relaxation rate in rat liver as a function of time post-injection, following administration of the high dose.
High Dose
0
100
200
300
400
500
600
700
800
900
0 10 20 30 40 50 60
Time post injection (days)
R2*
(1/
s)Control
AMI-227
SHU 555A
Fract. SHU 555A
NC100150 Inj.
unform. NC100150

82

83
6. CONCLUSIONS
• Th e coating material of the iron oxide particle contributes signifi cantly to the rate of iron oxide particle clearance and degradation in sinusoidal liver cells. Materials with similar hydrated particles sizes and similar iron oxide cores exhibited diff erent rates of particle degradation, dependent upon the coating material present. Additionally, materials with similar coating materials, but diff erent particles sizes, exhibited similar rates of liver clearance and degradation.
• Iron oxide particles with coating materials that limit or hinder water access to the core exhibit signifi cantly longer degradation rates, as refl ected by the increase in liver half-lives of these particles.
• Phantom studies indicate that the measured concentration of breakdown products present in isolated rat liver cells may induce signifi cant R2* eff ects, with a correspond-ing prolonged liver imaging eff ect. Th e duration of the R2* eff ect in the liver may therefore not be deduced from the half-life of the contrast agent in liver.
• For all contrast agents tested, the R2* liver enhancement persisted at time points when the concentration of iron oxide particles present in the liver was below method detection limits. Based on these fi ndings, it is believed that the prolonged liver R2* enhancement is due primarily to the compartmentalization of particle breakdown products within the lysosomes of sinusoidal liver cells.
• Th e liver clearance and particle degradation rates were aff ected by the dose admin-istered, with faster rates occurring at lower doses. Th ese results suggest that particle degradation and liver clearance are directly linked to the amount of particles taken up by the liver cells.
• NC100150 Injection was taken up and distributed equally in both liver endothelial and Kupff er cells following a single 5 mg Fe/kg b.w bolus injection in rats. Liver parenchymal cells did not take up NC100150 Injection.
• Liver endothelial and Kupff er cells exhibited similar rates of uptake and clearance of NC101050 Injection. Th ese results confl ict with current theory that suggests Kupff er cells are much more eff ective than liver endothelial cells in degrading and clearing particulate forms of iron.
• Th e relationship between R2* and Msat is concentration dependent. Additionally, the relationship between R2* and iron oxide particle concentration in human whole blood is non-linear and almost quadratic in nature.
• Due to the high R2* values in blood, the Msat/r1 ratio may prove to be a useful ana-lytical tool when developing or optimising iron oxide particles for use in indications that require T1 enhancement.

84
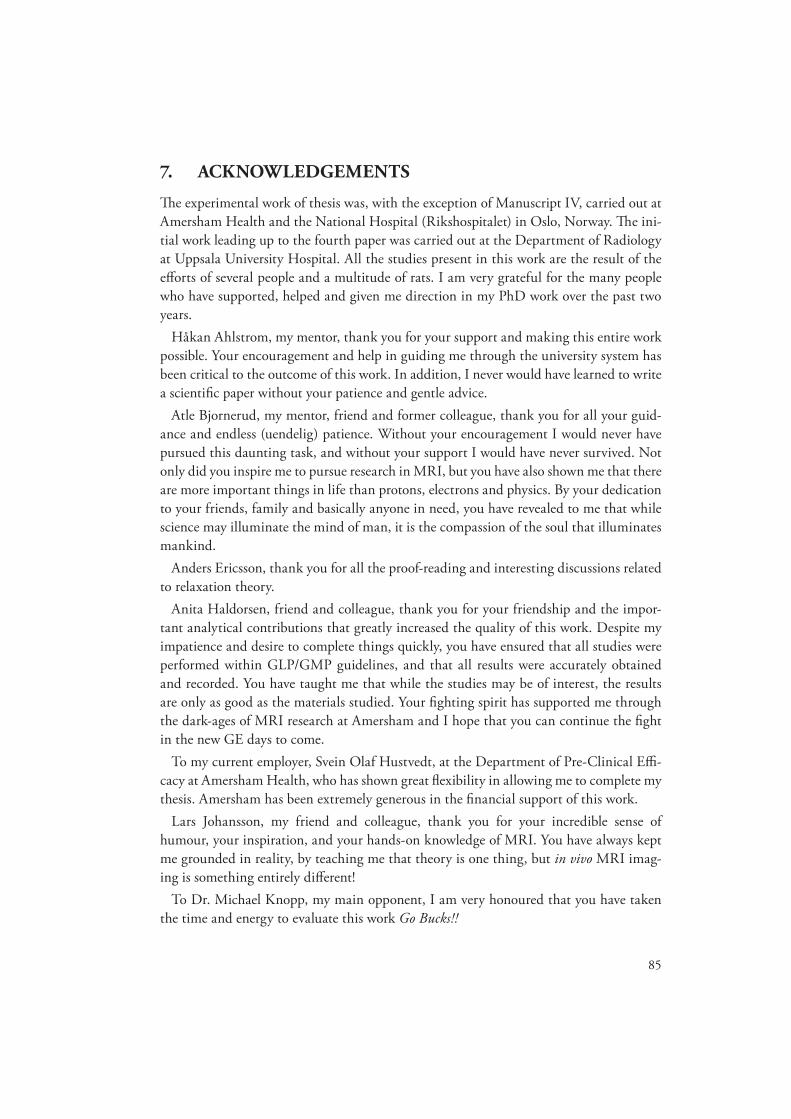
7. ACKNOWLEDGEMENTS
Th e experimental work of thesis was, with the exception of Manuscript IV, carried out at Amersham Health and the National Hospital (Rikshospitalet) in Oslo, Norway. Th e ini-tial work leading up to the fourth paper was carried out at the Department of Radiology at Uppsala University Hospital. All the studies present in this work are the result of the eff orts of several people and a multitude of rats. I am very grateful for the many people who have supported, helped and given me direction in my PhD work over the past two years.
Håkan Ahlstrom, my mentor, thank you for your support and making this entire work possible. Your encouragement and help in guiding me through the university system has been critical to the outcome of this work. In addition, I never would have learned to write a scientifi c paper without your patience and gentle advice.
Atle Bjornerud, my mentor, friend and former colleague, thank you for all your guid-ance and endless (uendelig) patience. Without your encouragement I would never have pursued this daunting task, and without your support I would have never survived. Not only did you inspire me to pursue research in MRI, but you have also shown me that there are more important things in life than protons, electrons and physics. By your dedication to your friends, family and basically anyone in need, you have revealed to me that while science may illuminate the mind of man, it is the compassion of the soul that illuminates mankind.
Anders Ericsson, thank you for all the proof-reading and interesting discussions related to relaxation theory.
Anita Haldorsen, friend and colleague, thank you for your friendship and the impor-tant analytical contributions that greatly increased the quality of this work. Despite my impatience and desire to complete things quickly, you have ensured that all studies were performed within GLP/GMP guidelines, and that all results were accurately obtained and recorded. You have taught me that while the studies may be of interest, the results are only as good as the materials studied. Your fi ghting spirit has supported me through the dark-ages of MRI research at Amersham and I hope that you can continue the fi ght in the new GE days to come.
To my current employer, Svein Olaf Hustvedt, at the Department of Pre-Clinical Effi -cacy at Amersham Health, who has shown great fl exibility in allowing me to complete my thesis. Amersham has been extremely generous in the fi nancial support of this work.
Lars Johansson, my friend and colleague, thank you for your incredible sense of humour, your inspiration, and your hands-on knowledge of MRI. You have always kept me grounded in reality, by teaching me that theory is one thing, but in vivo MRI imag-ing is something entirely diff erent!
To Dr. Michael Knopp, my main opponent, I am very honoured that you have taken the time and energy to evaluate this work Go Bucks!!
85

86
Håkan Pettersson and Nora Velastegui for excellent support with the design of this the-sis. You have handled the extended time limits with unbelievable patience.
Christl Richter-Frohm for dealing with all the administrative work associated with this thesis and organising all of my courses in Uppsala. I am very grateful and would not have completed the course work as quickly without your endless help and support.
To Alan Roch, Yves Gossuin and Robert Muller - I am eternally grateful that you were willing share your immense knowledge within the fi eld of USPIO relaxation theory. It has been an honour for me to learn theory from the group that actually created it.
To my colleagues at Amersham Health: Grete Mork Kindberg for your expertise in liver cell biology, Derek Grant for your discussions of iron metabolism, Grete Friisk for your analytical and organisation skills (and for dealing with 180 rats), Tore Skotland for your long hours spent editing my manuscripts, Sunder Rajan for all your inspiration and vast knowledge of the business of MRI, and Svein Olaf Hustvedt for not only convincing the management to support this work, but also for all your inspiration.
To my family and friends for supporting me through this and helping Jan Eystein with the children during my long stays in Uppsala. A special thanks to Mona Unni and Magne Saebo for your compassion, endless hours of baby-sitting, and showing me that a life with God is never dull.
To my dear, lovely children Alexander Marshall, Lisa Celine and little Magnus Mar-shall, who have given me strength in the darkest hours. It is only through you that I am complete.
To Jan Eystein, my friend, my husband, my love and my life, thanks for all the sacrifi ces you made to make this dream become a reality.

8. REFERENCES
1. Purcell EM, Torrey HC, Pound RV. Phys Rev 1946; 69:37.2. Bloch F, Hanson WW, Packard ME. Phys Rev 1946; 69:127.3. Proctor WG, Yu FC. Phys Rev 1950; 77:717.4. Dickinson, WC. Phys Rev 1950; 77:736.5. Damadian R. Science 1971;171:1151.6. Damadian R. US Patent No 3789823 fi led 17 March 1972.7. Damadian R. Physiol Chem Phys 1976;8:61.8. Lauterbur PC. Nature 1973;242:190.9. Hinshaw WS. Phys Letters 1974;48A:78.10. Hinshaw WS. J Appl Phys 1976;47:3709.11. Hinshaw WS, Bottomley PA, Holland GN. Nature (London) 1977;270:723. 12. Abragam A. Th e principles of nuclear magnetism. Oxford University Press, 1978,
Oxford. ISBN 019-851236-8.13. Rinck PA. Magnetic Resonance in Medicine. 4th Completely revised Edition includ-
ing MR Image Expert, version 2.5 and Dynalize, version 1.0 Demo. Blackwell Wis-senschafts-Verlag Berlin. Vienna 2001.ISBN 0-632-05986-9
14. Vlaardingerbroek MT, den Boer JA. Magnetic Resonance Imaging: Th eory and Prac-tice. 2nd Edition. Springer-Verlag Berlin Heidelberg New York 1999. ISBN 3-540-64877-1
15. Atkins PW. Molecular Quantum Mechanics. 2nd Edition, Oxford University Press 1983. Oxford New York. ISBN 0-19-855170-3
16. Crangle J. Solid-State Magnetism. Edward Arnold 1991. ISBN 0-340-54552-6.17. Bean CP, Livingston JD. Appl Phys 1959;30:120-129.18. Dormann JL. Rev Phys Appl 1981;16:275-301.19. Fossheim S, Saebo KB, Fahlvik AK, Rongved P, Klaveness. J. Magn Reson Imag-
ing1997;7:251-7.20. Bjornerud A, Briley-Saebo K, Johansson LO, Kellar KE Magn Reson Med.
2000;44:803-7.21. Lesser JR, Johnson K, Lindberg JL, Reed J, Tadavarthy SM, Virmani R, Schwartz
RS. Circulation. 2003 Jul 8;108(1):116-7.22. Grant D, Toft KG, Martinsen I, Atzpodien E Acta Radiol 1997;38:732-9.23. Lauff er RB. Chem Rev 1987;87:901-27.24. Kellar KE, Henrichs PM, Spiller M, Koenig SH. Magn Reson Med 1997;37:730-5.25. Koenig SH, Kellar KE. Acad Radiol 1996;3 Suppl 2:S273-6.26. Koenig SH, Kellar KE. Magn Reson Med 1995;34:227-33.
87
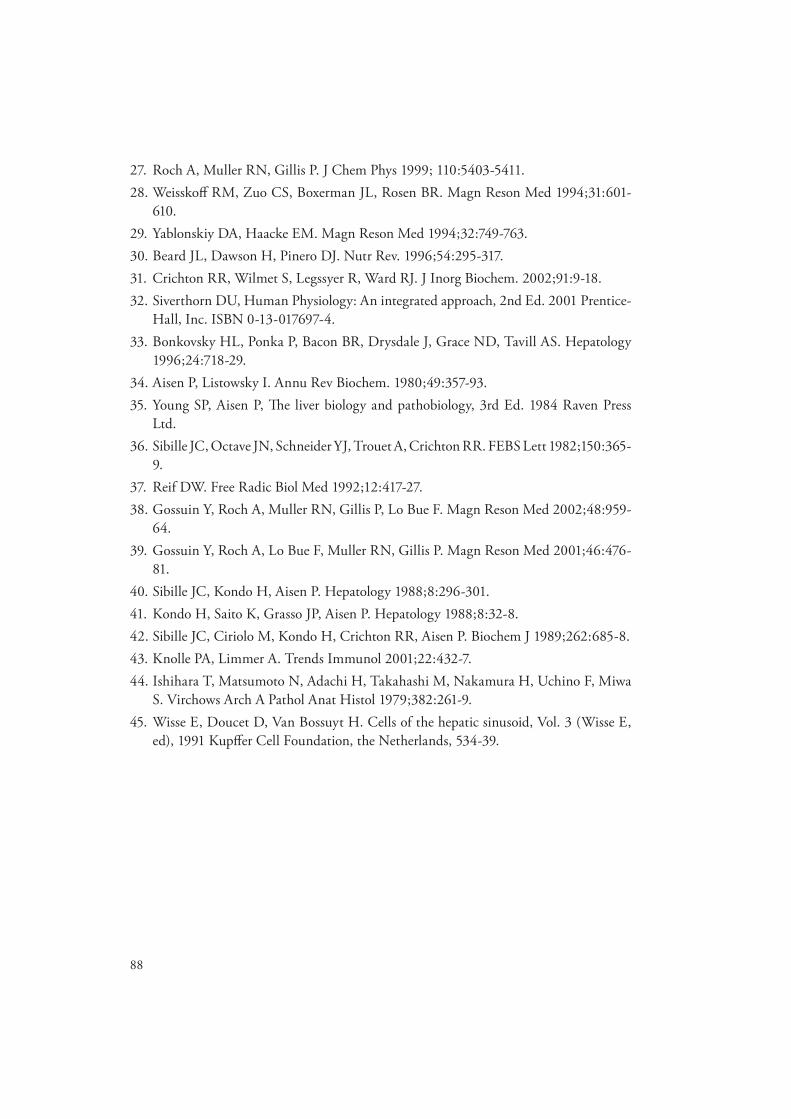
88
27. Roch A, Muller RN, Gillis P. J Chem Phys 1999; 110:5403-5411.28. Weisskoff RM, Zuo CS, Boxerman JL, Rosen BR. Magn Reson Med 1994;31:601-
610.29. Yablonskiy DA, Haacke EM. Magn Reson Med 1994;32:749-763. 30. Beard JL, Dawson H, Pinero DJ. Nutr Rev. 1996;54:295-317.31. Crichton RR, Wilmet S, Legssyer R, Ward RJ. J Inorg Biochem. 2002;91:9-18.32. Siverthorn DU, Human Physiology: An integrated approach, 2nd Ed. 2001 Prentice-
Hall, Inc. ISBN 0-13-017697-4. 33. Bonkovsky HL, Ponka P, Bacon BR, Drysdale J, Grace ND, Tavill AS. Hepatology
1996;24:718-29.34. Aisen P, Listowsky I. Annu Rev Biochem. 1980;49:357-93.35. Young SP, Aisen P, Th e liver biology and pathobiology, 3rd Ed. 1984 Raven Press
Ltd.36. Sibille JC, Octave JN, Schneider YJ, Trouet A, Crichton RR. FEBS Lett 1982;150:365-
9.37. Reif DW. Free Radic Biol Med 1992;12:417-27.38. Gossuin Y, Roch A, Muller RN, Gillis P, Lo Bue F. Magn Reson Med 2002;48:959-
64.39. Gossuin Y, Roch A, Lo Bue F, Muller RN, Gillis P. Magn Reson Med 2001;46:476-
81.40. Sibille JC, Kondo H, Aisen P. Hepatology 1988;8:296-301.41. Kondo H, Saito K, Grasso JP, Aisen P. Hepatology 1988;8:32-8. 42. Sibille JC, Ciriolo M, Kondo H, Crichton RR, Aisen P. Biochem J 1989;262:685-8.43. Knolle PA, Limmer A. Trends Immunol 2001;22:432-7.44. Ishihara T, Matsumoto N, Adachi H, Takahashi M, Nakamura H, Uchino F, Miwa
S. Virchows Arch A Pathol Anat Histol 1979;382:261-9.45. Wisse E, Doucet D, Van Bossuyt H. Cells of the hepatic sinusoid, Vol. 3 (Wisse E,
ed), 1991 Kupff er Cell Foundation, the Netherlands, 534-39.

89
9. COLOUR SUPPLEMENT
Fig. 1. page 14.
Fig. 2. page 16.
90
Fig. 3. page 21.
Fig. 4. page 23.

91
Fig. 6. page 29.
Fig. 7. page 41.

92
Fig. 8. page 43.


Acta Universitatis UpsaliensisComprehensive Summaries of Uppsala Dissertations
from the Faculty of MedicineEditor: The Dean of the Faculty of Medicine
Distribution:Uppsala University Library
Box 510, SE-751 20 Uppsala, Swedenwww.uu.se, [email protected]
ISSN 0282-7476ISBN 91-554-5998-6
A doctoral dissertation from the Faculty of Medicine, Uppsala University,is usually a summary of a number of papers. A few copies of the completedissertation are kept at major Swedish research libraries, while the sum-mary alone is distributed internationally through the series Comprehen-sive Summaries of Uppsala Dissertations from the Faculty of Medicine.(Prior to October, 1985, the series was published under the title “Abstracts ofUppsala Dissertations from the Faculty of Medicine”.)