deglobalization? - europa
TRANSCRIPT

Deglobalization?Comments on paper by Pol Antràs
November 11, 2020
Susan Lund, McKinsey Global Institute
ECB Forum on Central Banking 2020
McKinsey & Company 2
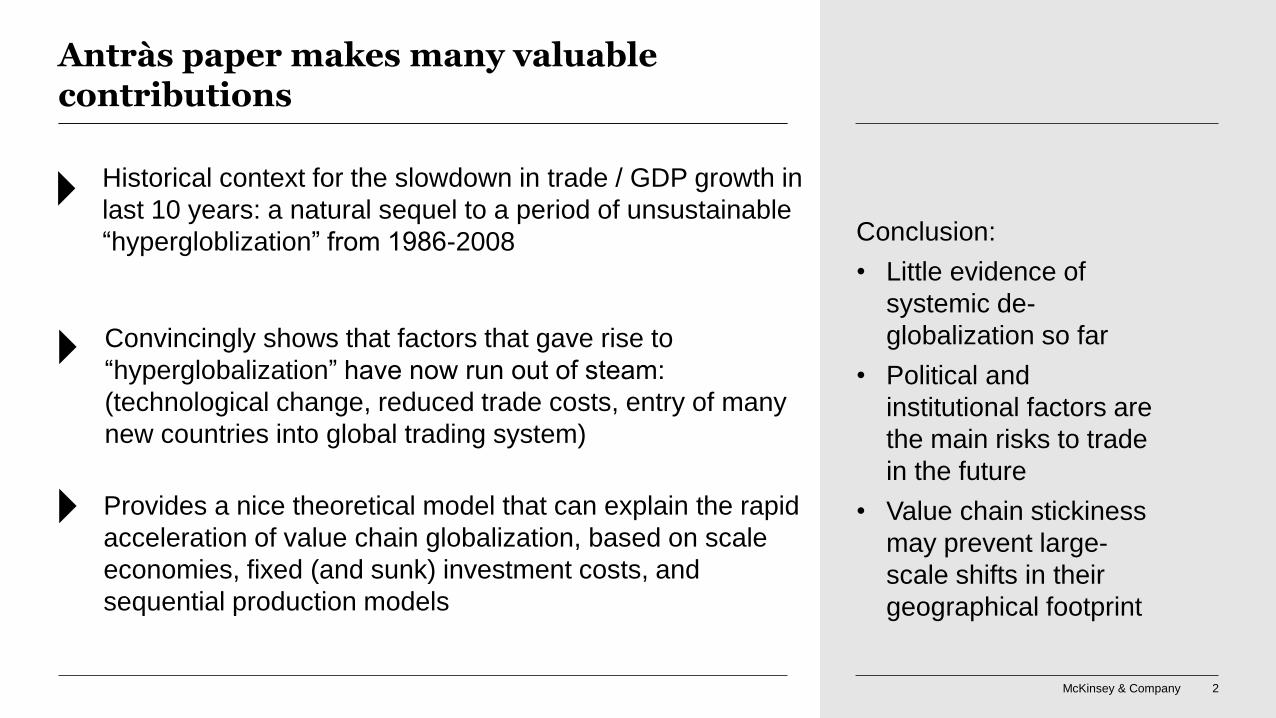
Antràs paper makes many valuable contributions
Historical context for the slowdown in trade / GDP growth in
last 10 years: a natural sequel to a period of unsustainable
“hypergloblization” from 1986-2008
Convincingly shows that factors that gave rise to
“hyperglobalization” have now run out of steam:
(technological change, reduced trade costs, entry of many
new countries into global trading system)
Provides a nice theoretical model that can explain the rapid
acceleration of value chain globalization, based on scale
economies, fixed (and sunk) investment costs, and
sequential production models
Conclusion:
• Little evidence of
systemic de-
globalization so far
• Political and
institutional factors are
the main risks to trade
in the future
• Value chain stickiness
may prevent large-
scale shifts in their
geographical footprint
McKinsey & Company 3
My comments will focus on two areas
01 Micro-empirical look at past slowdown in
global trade
02 Firm-level view on how global value chain risk
could lead to a rebalancing of trade
McKinsey & Company 4
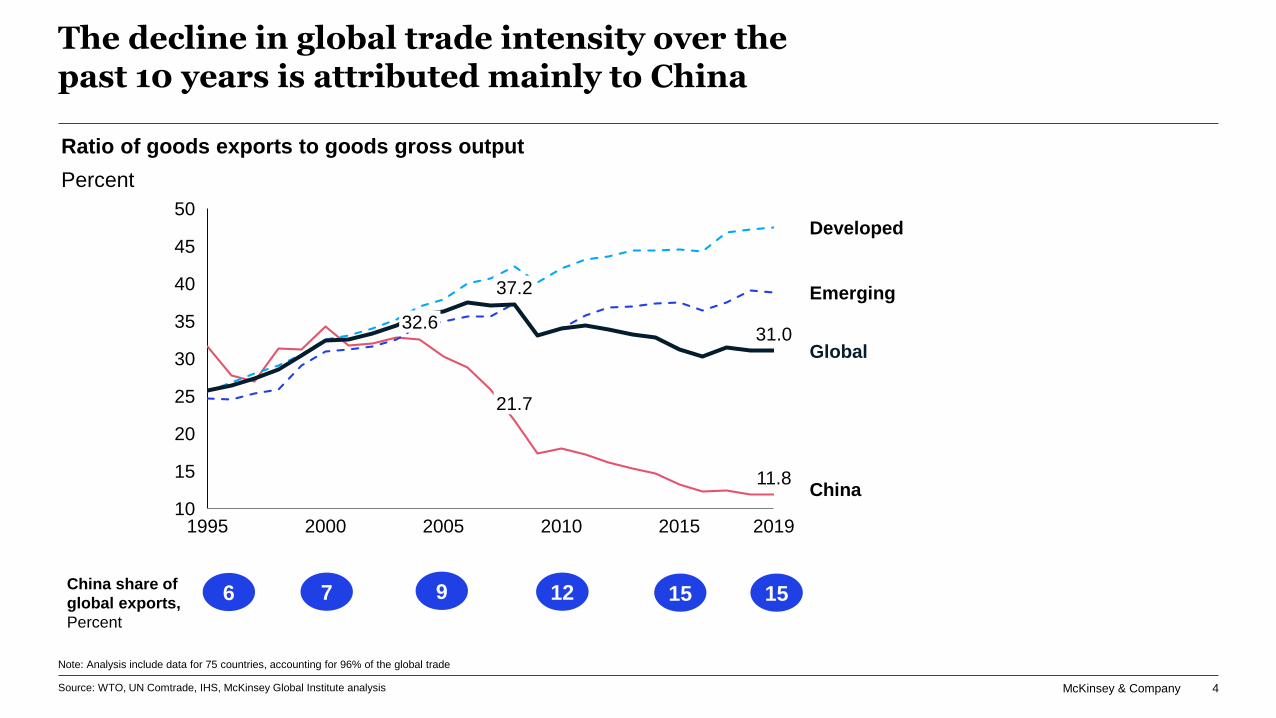
The decline in global trade intensity over the past 10 years is attributed mainly to China
45
30
10
40
15
20
25
35
50
20151995 2000
11.8
32.6
2005
21.7
37.237.2
2010
31.0
2019
China
Developed
Emerging
Global
Ratio of goods exports to goods gross output
Percent
Source: WTO, UN Comtrade, IHS, McKinsey Global Institute analysis
Note: Analysis include data for 75 countries, accounting for 96% of the global trade
China share of
global exports,
Percent
6 7 9 12 15 15

McKinsey & Company 5
China is consuming more of what it produces and
exporting less......and China’s domestic supply chains are also
growing
22
64
Computer &
electronics
Textile &
Apparel
Machinery &
equipment
61
Automotive
97
27
914
4
2007 2018
China’s exports as a share of gross output,
2007 vs. 2018Share of imported intermediate inputs to total inputs,
2007 vs. 2017
Source: UN Comtrade, IHS, WIOD, McKinsey Global Institute analysis
10
47
Textile &
Apparel
3
19
Computer &
electronics
Machinery &
equipment
Automotive
57
52
2007 2017
China
exports
CAGR
(2007-18)
0.6% 2.5% 1.9% 2.4%
China’s decline in trade intensity reflects two factors
McKinsey & Company 6
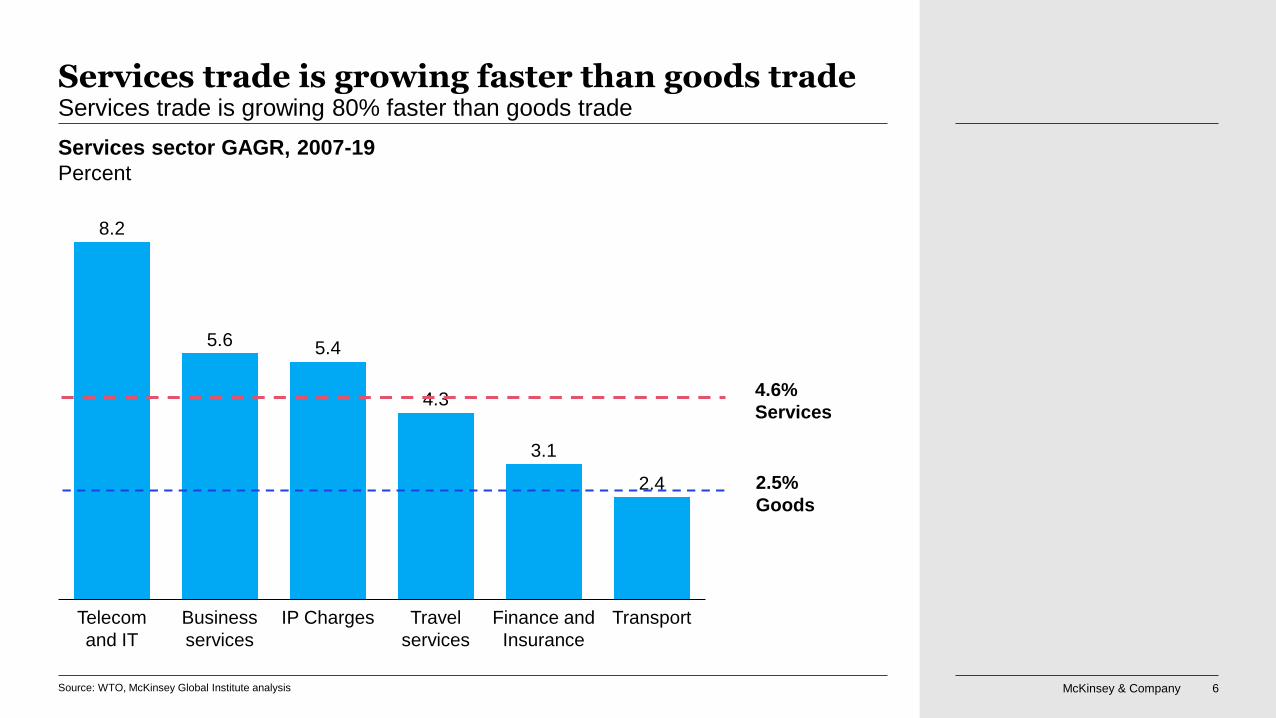
Services trade is growing faster than goods tradeServices trade is growing 80% faster than goods trade
Services sector GAGR, 2007-19
Percent
Telecom
and IT
4.3
8.2
TransportFinance and
Insurance
Travel
services
IP ChargesBusiness
services
2.4
3.1
5.45.6
4.6%
Services
2.5%
Goods
Source: WTO, McKinsey Global Institute analysis

McKinsey & Company 7
Implications of the “China story” of trade slowdown
Decline in trade / GDP is a sign of success, not failure, of
globalization – it reflects China’s economic development
We might expect the slower growth of trade / GDP will
continue as India and other low-income countries develop
domestic consumers and supplier industries
Conclusion: no evidence of systemic de-globalization, just a
different type of globalization
Services trade is growing faster than goods trade

McKinsey & Company 8
My comments will focus on two areas
01 Micro-empirical look at past slowdown in global
trade
02 Firm-level view on how global value chain
risk could lead to a rebalancing of trade
McKinsey & Company 9
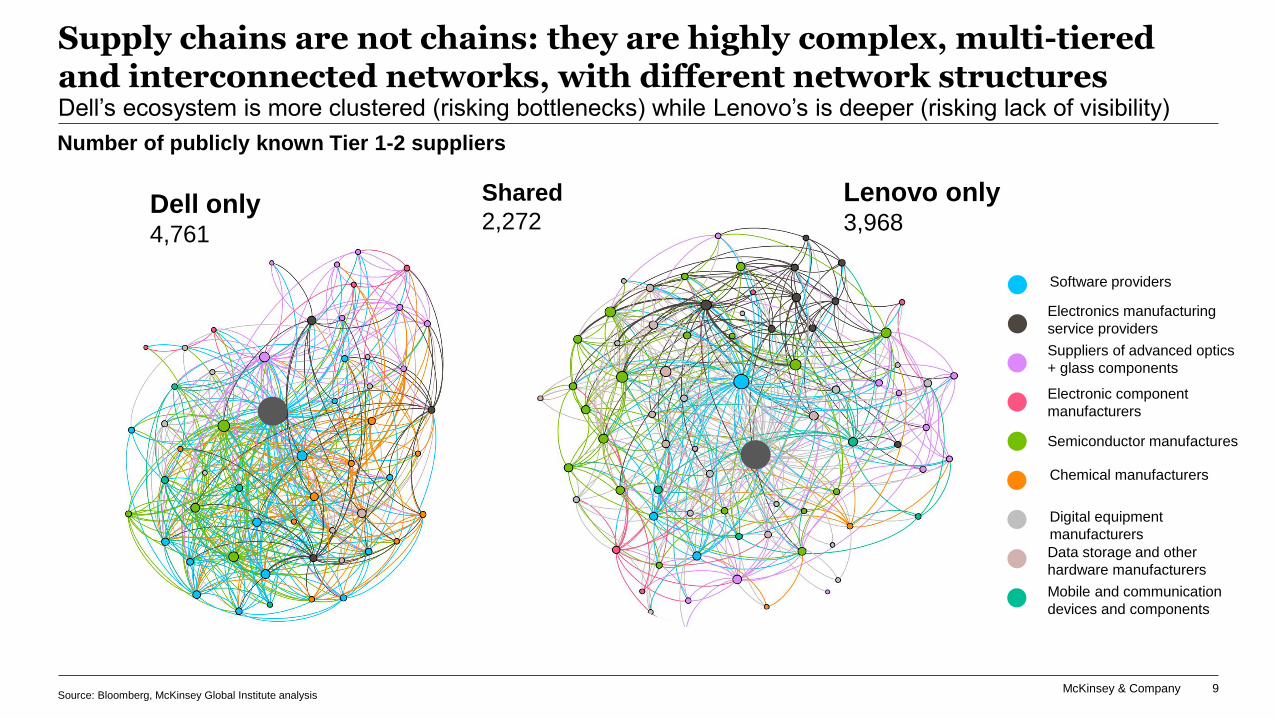
Supply chains are not chains: they are highly complex, multi-tiered and interconnected networks, with different network structures Dell’s ecosystem is more clustered (risking bottlenecks) while Lenovo’s is deeper (risking lack of visibility)
Source: Bloomberg, McKinsey Global Institute analysis
Number of publicly known Tier 1-2 suppliers
Dell only4,761
Shared
2,272
Lenovo only3,968
Software providers
Electronics manufacturing
service providers
Suppliers of advanced optics
+ glass components
Electronic component
manufacturers
Semiconductor manufactures
Chemical manufacturers
Digital equipment
manufacturers
Data storage and other
hardware manufacturers
Mobile and communication
devices and components
McKinsey & Company 10
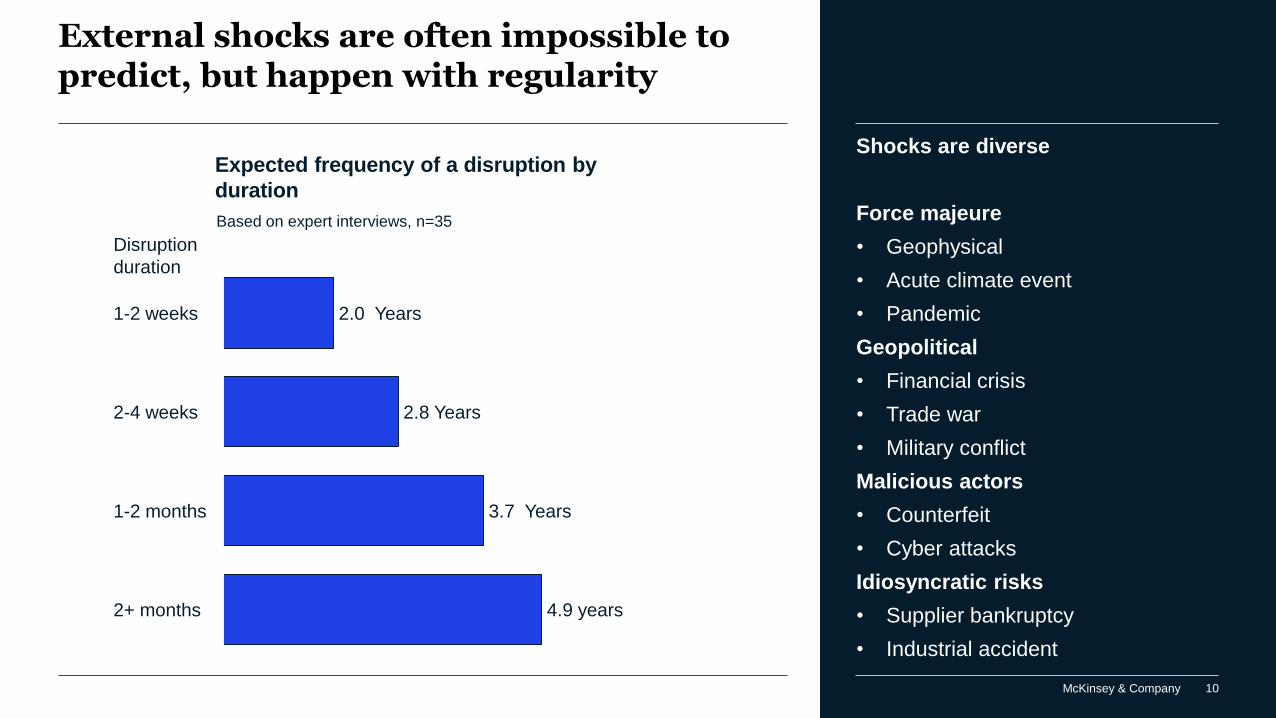
External shocks are often impossible to predict, but happen with regularity
Expected frequency of a disruption by
duration
1-2 months
2-4 weeks
1-2 weeks
2+ months
2.0 Years
2.8 Years
3.7 Years
4.9 years
Based on expert interviews, n=35
Disruption
duration
Shocks are diverse
Force majeure
• Geophysical
• Acute climate event
• Pandemic
Geopolitical
• Financial crisis
• Trade war
• Military conflict
Malicious actors
• Counterfeit
• Cyber attacks
Idiosyncratic risks
• Supplier bankruptcy
• Industrial accident
McKinsey & Company 11
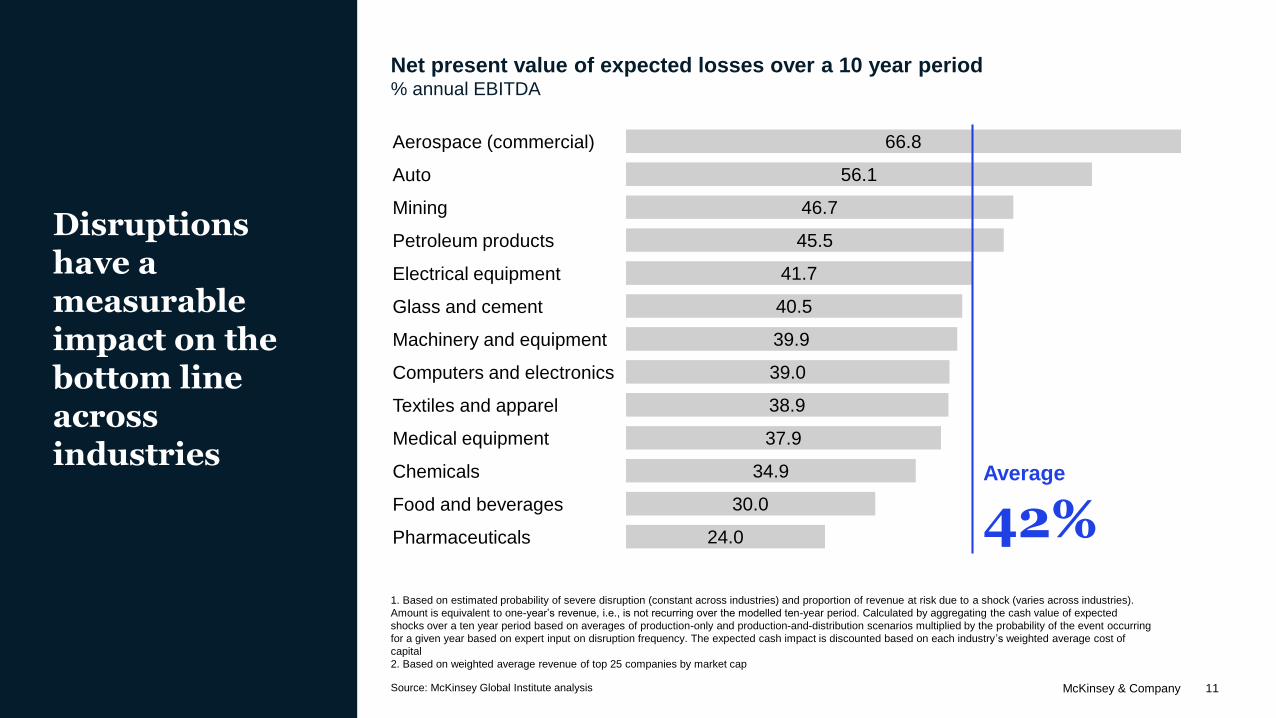
Net present value of expected losses over a 10 year period% annual EBITDA
1. Based on estimated probability of severe disruption (constant across industries) and proportion of revenue at risk due to a shock (varies across industries).
Amount is equivalent to one-year’s revenue, i.e., is not recurring over the modelled ten-year period. Calculated by aggregating the cash value of expected
shocks over a ten year period based on averages of production-only and production-and-distribution scenarios multiplied by the probability of the event occurring
for a given year based on expert input on disruption frequency. The expected cash impact is discounted based on each industry’s weighted average cost of
capital
2. Based on weighted average revenue of top 25 companies by market cap
66.8
56.1
46.7
45.5
41.7
40.5
39.9
39.0
38.9
37.9
34.9
30.0
24.0
Computers and electronics
Machinery and equipment
Glass and cement
Pharmaceuticals
Mining
Aerospace (commercial)
Auto
Electrical equipment
Petroleum products
Textiles and apparel
Medical equipment
Chemicals
Food and beverages
Average
42%
Disruptions have a measurable impact on the bottom line across industries
Source: McKinsey Global Institute analysis
McKinsey & Company 12
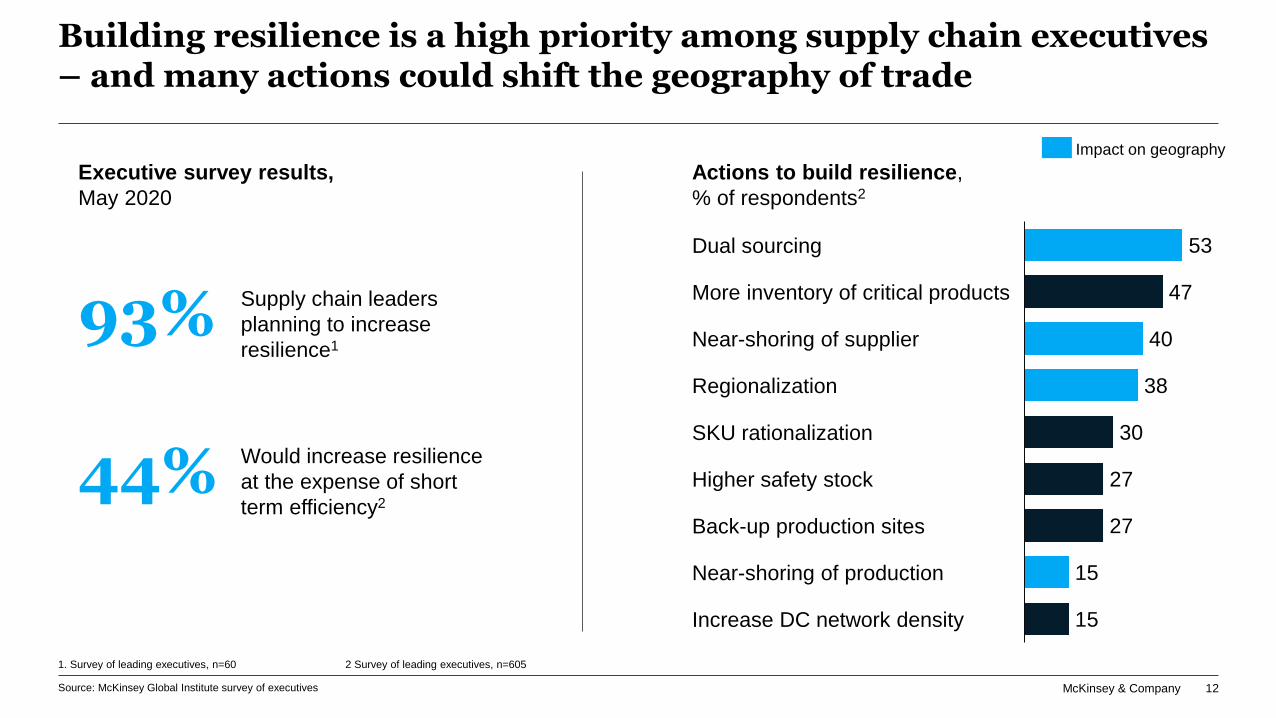
Building resilience is a high priority among supply chain executives – and many actions could shift the geography of trade
Executive survey results,
May 2020
93% Supply chain leaders
planning to increase
resilience1
44% Would increase resilience
at the expense of short
term efficiency2
Source: McKinsey Global Institute survey of executives
1. Survey of leading executives, n=60 2 Survey of leading executives, n=605
53
47
40
38
30
27
27
15
15
SKU rationalization
Increase DC network density
Higher safety stock
Dual sourcing
More inventory of critical products
Back-up production sites
Near-shoring of supplier
Regionalization
Near-shoring of production
Actions to build resilience,
% of respondents2
Impact on geography
McKinsey & Company 13
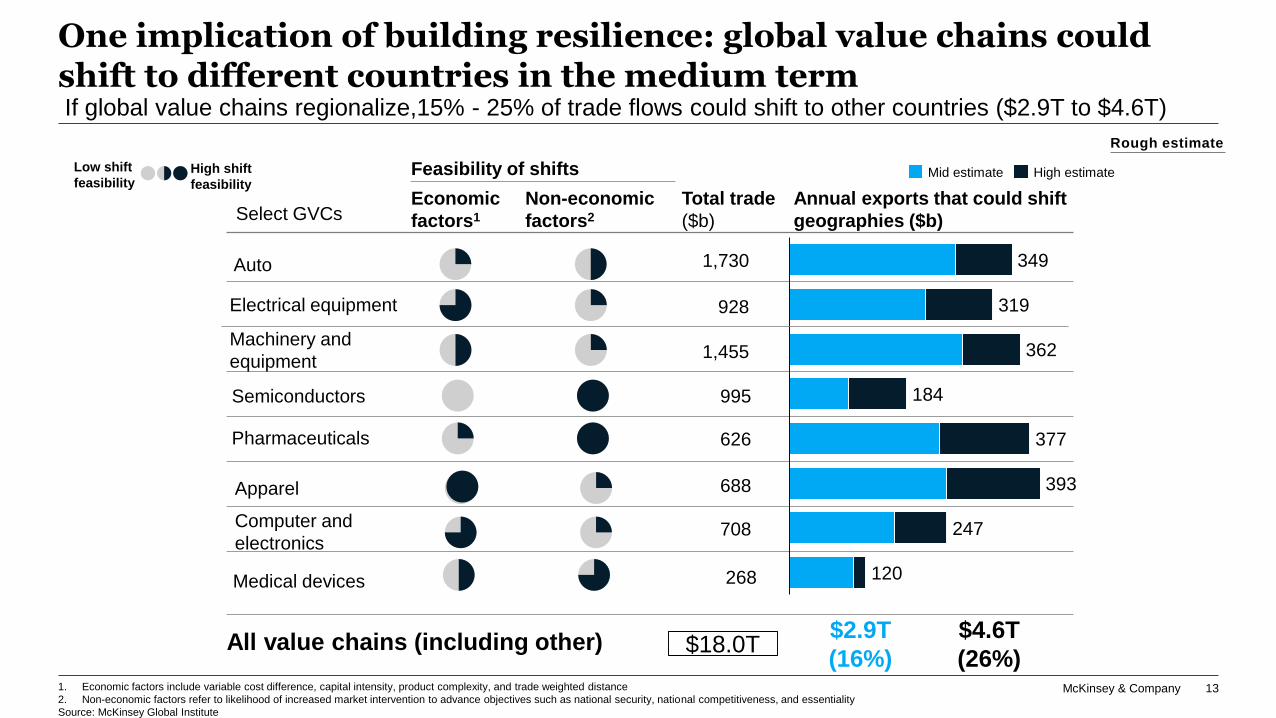
If global value chains regionalize,15% - 25% of trade flows could shift to other countries ($2.9T to $4.6T)
Annual exports that could shift
geographies ($b)
Mid estimate High estimate
Non-economic
factors2
Economic
factors1
Feasibility of shifts
Total trade
($b)
Machinery and
equipment
Computer and
electronics
Auto
Electrical equipment
Semiconductors
Pharmaceuticals
1,455
708
688
1,730
928
995
626
349
319
362
377
184
247
393
120
$4.6T
(26%)
$2.9T
(16%)$18.0T
1. Economic factors include variable cost difference, capital intensity, product complexity, and trade weighted distance
2. Non-economic factors refer to likelihood of increased market intervention to advance objectives such as national security, national competitiveness, and essentiality
Source: McKinsey Global Institute
All value chains (including other)
268Medical devices
Apparel
Low shift
feasibilityHigh shift
feasibility
Select GVCs
Rough estimate
One implication of building resilience: global value chains could shift to different countries in the medium term

CONFIDENTIAL AND PROPRIETARY
Any use of this material without specific permission of McKinsey & Company
is strictly prohibited
Thank you
Please see full MGI report at:
https://www.mckinsey.com/business-
functions/operations/our-insights/risk-resilience-and-
rebalancing-in-global-value-chains