deformation mechanisms of ods steels - main | matisse ods alloy and fe-9cr ods steels. the behavior...
TRANSCRIPT

Support to the development of joint research actions
between national programmes on advanced nuclear materials
FP7-Fission-2013 Combination of Collaborative project (CP) and Coordination and Support Actions (CSA)
Grant agreement no: 604862
Start date: 01/11/2013 Duration: 48 Months
D4.12
Deformation mechanisms of ODS steels

MatISSE – D4.12 – revision 0 issued on 1/12/2016
Page 2/45
MatISSE – Contract Number: 604862
Document title Deformation mechanisms of ODS steels
Author(s) J. Malaplate (CEA), M.Hernández-Mayoral (CIEMAT), E. Oñorbe (CIEMAT), M.
Serrano (CIEMAT), A. Chauhan (KIT), J. Aktaa (KIT)
Number of pages 45
Document type Deliverable
Work Package WP4
Document number D4.12
Issued by CEA
Date of completion 30/09/2016
Dissemination level Confidential, only for consortium members (including the Commission Services)
Summary
This reports presents the works performed by CEA, CIEAMAT and KIT on the deformation mechanisms of
ODS material. Many results were obtained during the first three years of the Matisse project, concerning Fe-
14Cr ODS alloy and Fe-9Cr ODS steels.
The behavior of Fe-14Cr ODS steels has been analyzed at the grain scale by in-situ TEM deformation
experiments between room temperature and about 650°C and a clear evolution with temperature of the motion
of the dislocations has been shown.
On Fe-9Cr ODS alloy, tensile tests were performed at temperatures ranging from 25°C to 800°C. At 25°C, the
tempered martensitic 9YWT-MATISSE exhibits a high yield strength and ultimate tensile strength of 929 and
1052 MPa, respectively. As temperature increases, a decrease in strength is observed, with 156 MPa of
ultimate tensile strength at 800°C. The total elongation-to-failure that was 7.6% at 25°C increases sharply with
increase in temperature and reaches a maximum of 38.4% at 700°C. In order to compare the influence of heat
treatment the tensile tests were also performed on specimens when in a ferritic state. Interestingly, at elevated
temperatures both states present a similar trend of strength and elongation. In comparison to other
commercial, as well as experimental, ODS steels, tempered 9YWT-MATISSE offers an excellent compromise
between strength and ductility. As temperature increases, the fracture surface forms with a shear-lip zone at
the outer periphery and increased dimple size. These observations appear associated with the increased
ductility. The dimpled fracture surface indicates intragranular crack growth that leads to failure. The change in
fracture mechanism from intragranular to intergranular fracture at 650°C becomes fully apparent at 800°C,
where it is associated with a reduced ductility. The change in damage mechanism is due to the modification
of the deformation mechanism.

MatISSE – D4.12 – revision 0 issued on 1/12/2016
Page 3/45
Approval
Rev. Date First author WP leader Project Coordinator
0 Sept.2016 J. Malaplate, CEA M. Serrano, CIEMAT P.F. Giroux, CEA
30/09/16 01/12/2016
23/03/2017
Distribution list
Name Organisation Comments
All beneficiaries MatISSE

MatISSE – D4.12 – revision 0 issued on 1/12/2016
Page 4/45
Table of contents
Introduction ........................................................................................................................................................ 5
1 CEA Experiments and studied materials ................................................................................................... 6
Experiments ............................................................................................................................................... 6
Materials ..................................................................................................................................................... 6
CEA Results ............................................................................................................................................... 7
1.1.1 Behavior at low temperature ................................................................................................. 7
1.1.2 Behavior at high temperature .............................................................................................. 10
1.1.3 Dynamic strain ageing at intermediate temperature ........................................................... 14
1.1.4 Complementary analyses .................................................................................................... 16
Conclusions on CEA Results ................................................................................................................... 20
2 CIEMAT experiments ............................................................................................................................... 21
TEM examination of the deformed microstructure after tensile tests ...................................................... 21
2.1.1 Results of TEM examination of the Fe14Cr-ODS deformed at different temperatures ...... 22
2.1.2 Summary of TEM examination of deformed microstructures .............................................. 26
TEM in-situ straining experiments............................................................................................................ 26
Synchrotron experiments ......................................................................................................................... 27
2.1 Conclusions on CIEMAT experiments ........................................................................................... 28
3 KIT contribution on the mechanical behaviour on 9Cr-ODS steel bar ..................................................... 29
KIT Experiments and studied material ..................................................................................................... 29
3.1.1 Materials .............................................................................................................................. 29
3.1.2 Experiments ......................................................................................................................... 29
KIT results ................................................................................................................................................ 30
3.1.3 Microstructure in as-received state ..................................................................................... 30
3.1.4 Tensile properties ................................................................................................................ 32
3.1.5 Deformed microstructure ..................................................................................................... 35
3.1.6 Fracture characteristics ....................................................................................................... 38
Discussion of KIT results ......................................................................................................................... 41
Conclusion on KIT experiments ............................................................................................................... 42
4 Conclusion ............................................................................................................................................... 44

MatISSE – D4.12 – revision 0 issued on 1/12/2016
Page 5/45
Introduction
This document corresponds to the deliverable D4.12 of the MATISSE program (work package 4 – task 4.1). It presents the work performed by CEA, CIEMAT and KIT on the deformations mechanisms in ODS steels.
Due to their good resistance to swelling under irradiation and their improved mechanical properties, ODS steels are promising candidates as cladding materials for the next nuclear fission reactor generation or as structural materials for fusion reactors. Nevertheless, a clear understanding of the fine mechanisms of deformation of these ODS materials is still lacking. To this end, this work has been performed to obtain a better description of the deformation at the grain scale, notably of the dislocation motion and of their interaction with microstructure, particularly the nano-precipitates.
This document is thus divided into three independent parts (one for each laboratory). The contributions of the CEA and CIEMAT are relating to in-situ deformation in a Transmission Electron Microscope (TEM) on Oxide Dispersion Strengthened (ODS) Fe-Cr Materials. The KIT study deals with the analysis of the mechanical behaviour of the Fe-9Cr ODS alloy after conventional mechanical tests.

MatISSE – D4.12 – revision 0 issued on 1/12/2016
Page 6/45
1 CEA Experiments and studied materials
Experiments
To perform this ODS deformation mechanisms analysis, in-situ straining experiments in a TEM have been carried out at the CEMES (Centre d’Elaboration des Matériaux et d’Etudes Structurales) laboratory with F. Mompiou and D. Caillard in the frame of two PhD thesis (M. Praud and M. Dadé) on a TEM (200 kV JEOL 2010). These experiments allow obtaining dynamic observations of moving dislocations and thus identifying the deformation mechanisms. In particular, the gliding plane can be determined. Moreover, the analysis of the tangled dislocations curvature indicates the local stress value. Indeed, between two pinning points a dislocation will be curved by the applied stress. This curvature induces an increase of the line tension giving rise to a back stress orientated into the curvature and acting against the dislocation motion. The stress needed to overcome the pinning points (critical stress) is equal to the back stress. This value can be estimated by in-situ observations from the curvature just before the dislocation motion. This back stress value can be estimated with DISDI software. DISDI can determine the shape of a dislocation for a given stress from a line tension
calculation. However in first approximation, the line tension T µb² and the resolved shear stress is thus
τ=T/bRµb/R, with R the dislocation curvature radius.
Specimens are put in a dedicated TEM sample-holder (figure 1a). The grip allow imposing a stress on the sample (the value of the stress is however unknown). Video sequences are recorded by a camera during stress relaxation. This sample-holder is equipped with heating resistance. Experiments at temperatures higher than room temperature can thus be performed. Two specimen shapes (figure 1b) were used for these experiments. The first one exhibits rectangular shape and is fixed by glue on fastening collar to put on the grip. The second type corresponds to mini-tensile specimens adapted for the grip. This more convenient shape was finally preferred for most experiments. In both cases, the mini-samples were prepared for TEM observations (thin area ~ 100 nm). They were mechanically polished to less than 100 µm thick and then thinned to TEM thin foils using a Tenupol twin-jet electropolisher.
Experiments were carried out between room temperature and about 650°C. Several experiments were realized. Nevertheless, the different conditions and specimen types, the difficulties of the experiments (samples preparation, magnetism and surface state, limited well oriented area…) hindered obtaining a large statistic or comparison between specimens at each temperature. However main deformation aspects have been identified.
a)
b)
Figure 1: a) TEM in-situ straining sample-holder, b) TEM in-situ straining specimens.
Materials
The experiments focused on 14Cr-1W-Ti-Y2O3 ODS steels that were consolidated by hot extrusion (HE) as rod (around 16 mm diameter) or by high isostatic pressing (HIP) as can. The results concern mainly the 14Cr-1W-0.3Ti-0.3Y2O3 grades. HE sample’s microstructure is typical of ferritic ODS steels elaborated by hot
Fastening
collar
Heating
resistance
Mobile
tensile grip
Furnace
bottom
Fixed
grip
2 mm
2 mm

MatISSE – D4.12 – revision 0 issued on 1/12/2016
Page 7/45
extrusion process. Indeed, grains are elongated in the extrusion direction and a strong -fiber texture is noticed as illustrated in EBSD orientation map in figure 2a. On the contrary, the HIP samples microstructure is composed of rather equiaxed grains, without particular crystallographic orientation (figure 2b).
Experiments have also been performed to complete the analysis (i) on HIP samples with different oxide contents from the un-reinforced matrix up to 1% Y2O3 and (ii) on an almost fully recrystallized microstructure obtained by thermomechanical treatment of 14Cr-1W-0.3Ti-0.3Y2O3 HE samples. At a lesser extent, test on HE 9Cr-1W-0.3Ti-0.3Y2O3 were also carried out.
Information on the materials are gathered in table 1.
Table 1: Chemical composition and elaboration route
Specimen SRMA code Elaboration route
14Cr-1W-0.3Ti-0.3Y2O3 K05 LTMEX milling, HIP 1100°C/2h
14Cr-1W-0.3Ti-0.3Y2O3 J05 PLANSEE milling, HE 1100°C
14Cr-1W L23 HIP 1100°C/2h
14Cr-1W-1Ti-1Y2O3 K18 LTMEX milling, HIP 1100°C/2h
14Cr-1W-0.05Ti-0.05Y2O3 K19 LTMEX milling, HIP 1100°C/2h
14Cr-1W-0.3Ti-0.3Y2O3 J56-M2 LTMEX milling, HE 1100°C, cold deformation, annealing 1400°C/1h
9Cr-1W-0.3Ti-0.3Y2O3 J24 PLANSEE milling, HE 1100°C
a)
b)
c)
Figure 2: EBSD orientation map for 14Cr-1W-0.3Ti-0.3 Y2O3 a) HE sample and b) HIP sample; c) corresponding color triangle code. The arrow on figure 2a indicates the extrusion direction.
CEA Results
1.1.1 Behavior at low temperature
At room temperature, dislocations tend to be pinned on precipitates. Motion of dislocation is hindered by precipitates. Individual dislocations move thus in the grains in a jerky way, being successively unpinned and
10 m 100 m
MatISSE – D4.12 – revision 0 issued on 1/12/2016
Page 8/45
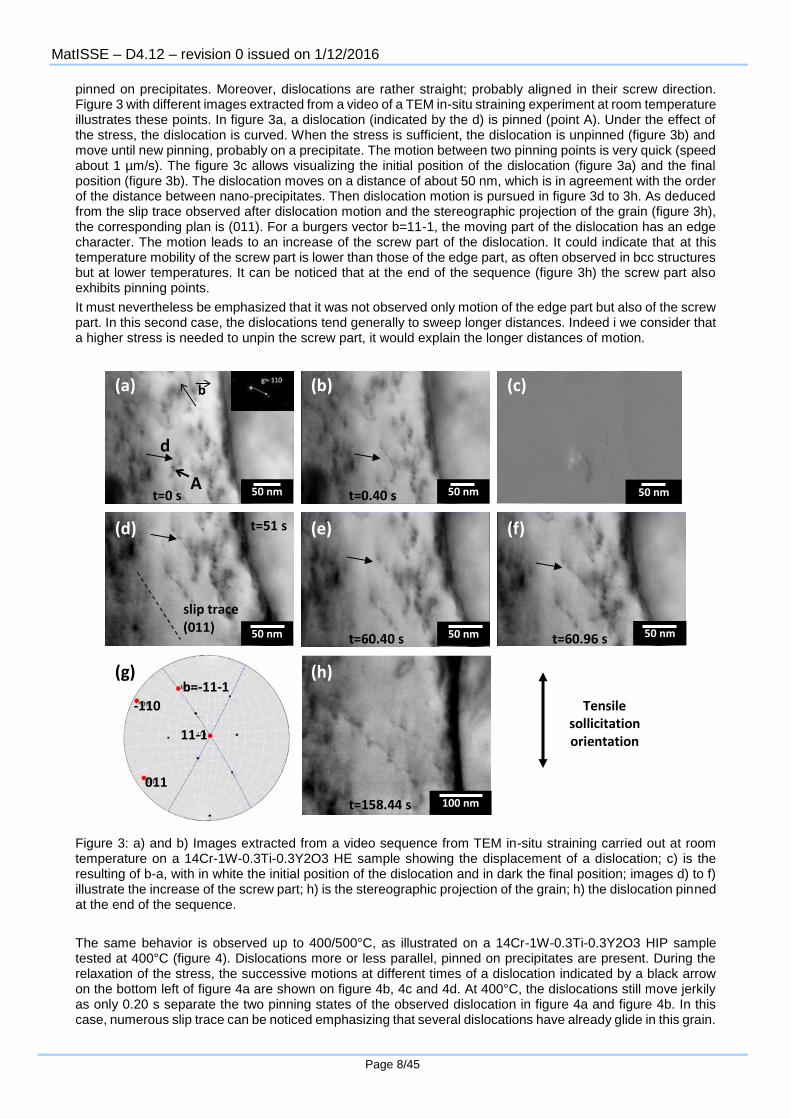
pinned on precipitates. Moreover, dislocations are rather straight; probably aligned in their screw direction. Figure 3 with different images extracted from a video of a TEM in-situ straining experiment at room temperature illustrates these points. In figure 3a, a dislocation (indicated by the d) is pinned (point A). Under the effect of the stress, the dislocation is curved. When the stress is sufficient, the dislocation is unpinned (figure 3b) and move until new pinning, probably on a precipitate. The motion between two pinning points is very quick (speed about 1 µm/s). The figure 3c allows visualizing the initial position of the dislocation (figure 3a) and the final position (figure 3b). The dislocation moves on a distance of about 50 nm, which is in agreement with the order of the distance between nano-precipitates. Then dislocation motion is pursued in figure 3d to 3h. As deduced from the slip trace observed after dislocation motion and the stereographic projection of the grain (figure 3h), the corresponding plan is (011). For a burgers vector b=11-1, the moving part of the dislocation has an edge character. The motion leads to an increase of the screw part of the dislocation. It could indicate that at this temperature mobility of the screw part is lower than those of the edge part, as often observed in bcc structures but at lower temperatures. It can be noticed that at the end of the sequence (figure 3h) the screw part also exhibits pinning points.
It must nevertheless be emphasized that it was not observed only motion of the edge part but also of the screw part. In this second case, the dislocations tend generally to sweep longer distances. Indeed i we consider that a higher stress is needed to unpin the screw part, it would explain the longer distances of motion.
Figure 3: a) and b) Images extracted from a video sequence from TEM in-situ straining carried out at room temperature on a 14Cr-1W-0.3Ti-0.3Y2O3 HE sample showing the displacement of a dislocation; c) is the resulting of b-a, with in white the initial position of the dislocation and in dark the final position; images d) to f) illustrate the increase of the screw part; h) is the stereographic projection of the grain; h) the dislocation pinned at the end of the sequence.
The same behavior is observed up to 400/500°C, as illustrated on a 14Cr-1W-0.3Ti-0.3Y2O3 HIP sample tested at 400°C (figure 4). Dislocations more or less parallel, pinned on precipitates are present. During the relaxation of the stress, the successive motions at different times of a dislocation indicated by a black arrow on the bottom left of figure 4a are shown on figure 4b, 4c and 4d. At 400°C, the dislocations still move jerkily as only 0.20 s separate the two pinning states of the observed dislocation in figure 4a and figure 4b. In this case, numerous slip trace can be noticed emphasizing that several dislocations have already glide in this grain.
slip trace (011)
(b) (c)
(d) (e) (f)
(h)
(a)
50 nm 50 nm
d
50 nm
50 nm 50 nm 50 nm
t=0 s t=0.40 s
t=51 s
t=60.40 s t=60.96 s
t=158.44 s
(g)
100 nm
b=-11-1
-110
11-1
011
b
A
Tensile sollicitation
orientation

MatISSE – D4.12 – revision 0 issued on 1/12/2016
Page 9/45
It cannot be firmly concluded, however it seems that a higher activity of dislocation is observable at higher temperatures.
In this range of temperature (between room temperature and about 400°C), the activity of the dislocations is mainly intragranular. Several intragranular sources were observed.
Figure 4: a), b), c), d) Images extracted from a video sequence from TEM in-situ straining carried out at 400°C on a 14Cr-1W-0.3Ti-0.3Y2O3 HIP sample showing the displacement of a dislocation. Arrows indicate the position of the dislocation at the beginning. Dashed arrows illustrate the dislocation displacement. e), f), g) images differences illustrating the motion of the dislocation.
200 nm
(a) t0=0 Slip
trace
(b) t1=t
0+0.20 s
200 nm
(c)
t2=t
0+1.60
s
200 nm
(d) t3=t
0+1.68 s
200 nm
t0-t
1 (e)
t1-t
2 (f
)
t2-t
3 (g)

MatISSE – D4.12 – revision 0 issued on 1/12/2016
Page 10/45
1.1.2 Behavior at high temperature
At high temperature (above 500/600°C), dislocations move in a more viscous way. Dislocations’ pinning on precipitates is still observed. However, dislocations seem to pin and unpin in a more continuous way, not as jerky as at lower temperature. Precipitates seem to slow the motion of the dislocations without really stopping it. Indeed dislocations curvature between pinning points are less pronounced that at lower temperature. Overcoming of precipitates seems easier at higher temperature. The viscous motion is illustrated in figure 5 from images extracted from an experiment on a 14Cr-1W-0.3Ti-0.3Y2O3 HIP sample at 650°C. In figure 5a, two anchored dislocations are indicated. The pinning positions are indicated by black arrows and the position of the head of the dislocations by dashed arrows. The dislocations are moving in opposite direction letting parallel slip traces on the surface of the thin foil. The motion of the dislocations is followed by dashed arrows indicating the position of the dislocations at the successive times. In the figure 5b, a part of the left dislocation has unpinned and moves up. In figure 5c, another part of the dislocation has finally unpinned. The dislocation moves up to pin again in figure 5d. Meanwhile, the right dislocation slowly moves down with successive pinning and unpinning.
Figure 5: a) to d) Images extracted from a TEM in-situ straining experiment on a 14Cr-1W-0.3Ti-0.3Y2O3 HIP sample at 650°C. Arrows indicate pinning positions; dashed arrows indicate the position of the dislocations.
On this sequence, the dislocations appear rather straight, as observed at lower temperature. It is not always the case as illustrated in figures 6 and 7. The images of the figure 6 are extracted from a video of TEM in-situ straining experiment carried out at 600°C on a 14Cr-1W-0.3Ti-0.3Y2O3 HIP sample. The viscous motion of dislocations is observed. The dislocations are slightly curved and do not particularly exhibits pinning points on precipitates (dislocations are rather smooth). However, dislocations interactions are also present. Between images 6a and 6b, dislocations move and new dislocations can be seen (motion illustrates in figure 6h). A loop (indicated by a black arrow) is present on a dislocation. Between images 6b and 6c, dislocations pursue their motion. In particular a dislocation on the right side of image 6b moves towards the left side (motion indicated by the dashed arrow), coming close to the loop just mentioned and also seems to anchor on another
t = 0 s t = 1.8 s
t = 3.48 s t = 5.6 s
(a)
(c) (d)
(b)

MatISSE – D4.12 – revision 0 issued on 1/12/2016
Page 11/45
dislocation. Between image 6c and 6d, this dislocation slowly curves on both sides of the pinning points. The left part comes in contact with the loop. Between images 6d and 6e, this dislocation pursues its motion. The curvatures increase. A new pinning point on another dislocation also appears. The left part interacts with the loop, leading to part of the loop annihilation.
Figure 6: a), b), c), d) and e) Images extracted from a TEM in-situ straining experiment at 600°C on a 14Cr-1W-0.3Ti-0.3Y2O3 HIP sample illustrating the viscous movements of dislocations; f), g), h) and i) image resulting from the difference respectively between images a and b, b and c, c and d, d and e showing the dislocation motion between first and second image. Dashed arrows illustrate direction of motion. Particular points are indicated by black arrows.
(a) t0=0
(b) t1=t
0+0.96 s
(c) t2=t
0+3.92 s
(d) t3=t
0+4.28 s
(e) t4=t
0+4.48 s
200 nm
t0-t
1 (f)
t1-t
2 (g)
t2-t
3 (h)
t3-t
4 (i)
200 nm
200 nm
200 nm
200 nm

MatISSE – D4.12 – revision 0 issued on 1/12/2016
Page 12/45
The images of figure 7 were extracted from a video of TEM in-situ straining experiment performed at 580°C also on a 14Cr-1W-0.3Ti-0.3Y2O3 HIP sample. The viscous motion can be noticed: between figure 7a and 7b, several dislocations have slowly moved from their initial position to final close positions, as shown in figure 7c. These dislocations are weakly curved.
Figure 7: a), b) Images extracted from a TEM in-situ straining experiment at 580°C on a 14Cr-1W-0.3Ti-0.3Y2O3 HIP sample illustrating the viscous movements of dislocations. T indicates the direction of solicitation; c) Image resulting from the difference between images a and b.
Compared to room temperature, more dislocations activity seems observable. Indeed once sufficient stress is reached to trigger the motion of dislocations, several dislocations moved successively/simultaneously during the relaxation, whereas scarcer motions are observed at room temperature. This point can be noticed in figure 6 for example, where the motion of several dislocations is shown, or in figure 7, where different dislocations motion is observed.
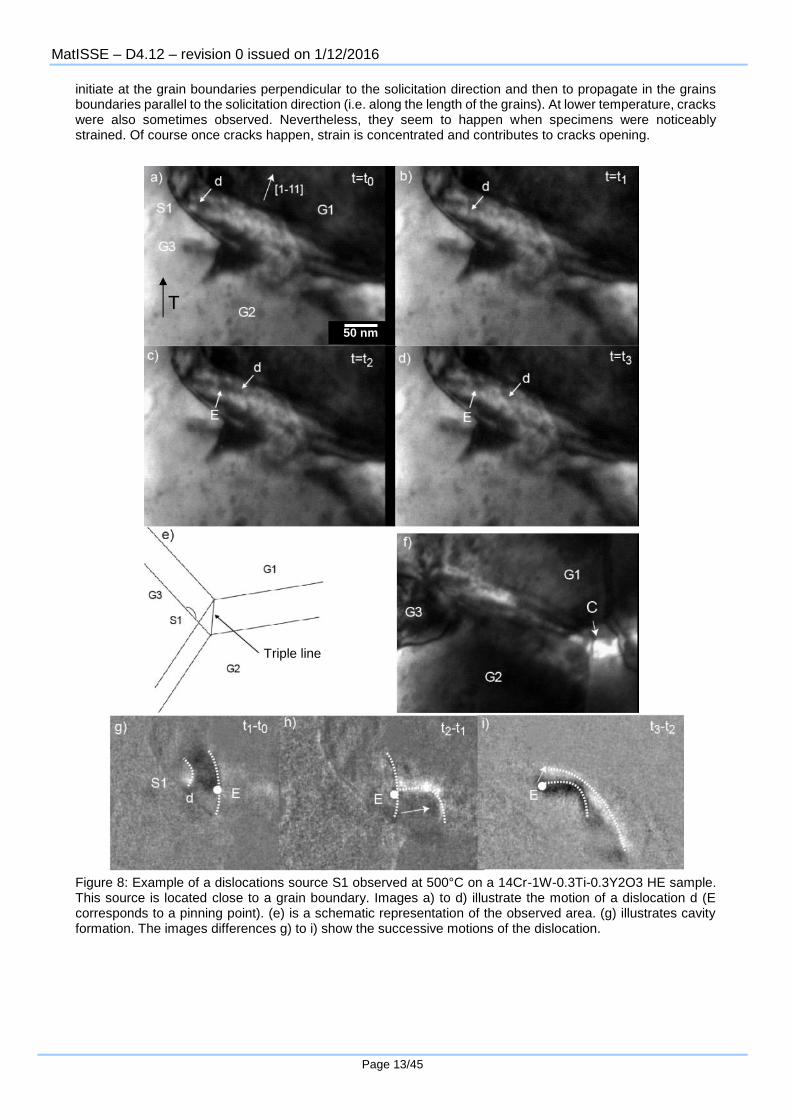
As shown on the former figures, the motion of dislocations still happens inside the grains. However at 500°C, intergranular motions were also noticed. Dislocations sources in the grain boundary or in their vicinity have been observed as shown in figure 8. The sources are strongly activated. For the source shown in figure 8, more than 20 successive motions have been detected. The dislocations seem to arrive from the triple line (Figure 8e). The source may however be close to the grain boundary. The position cannot be clearly determined. The images a) to d) illustrate the motion of a dislocation noted d. On figure 8b, the dislocation is pinned (anchored point noted E). Then a part of the dislocation move (figure 8c) and finally the dislocation glide away from the E pinning point (figure 8d). Images g) to i) allow better visualization of the dislocation motion. The dislocation is curved between the pinning points. Nevertheless as already shown at high temperature, the by-passing of the obstacles occurs in a more continuous way. The dislocation arrives on the precipitate; the dislocation is thus slowed but the pinning time is shorter than at room temperature. This dislocations activity at the grain boundary results in grain sliding along the grain boundary. As a consequence, cavities are formed (noted C in figure 8f) and grain boundary damaging is observed. It illustrates the impossibility of stress transmission between adjacent grains. As a result grains decohesion appears. The decohesion is visible in figure 9 corresponding to a panorama obtained at the end of an experiment at 500°C on an HE sample. The solicitation direction is parallel to the length of the grains. The decohesion seems to
MatISSE – D4.12 – revision 0 issued on 1/12/2016
Page 13/45
initiate at the grain boundaries perpendicular to the solicitation direction and then to propagate in the grains boundaries parallel to the solicitation direction (i.e. along the length of the grains). At lower temperature, cracks were also sometimes observed. Nevertheless, they seem to happen when specimens were noticeably strained. Of course once cracks happen, strain is concentrated and contributes to cracks opening.
Figure 8: Example of a dislocations source S1 observed at 500°C on a 14Cr-1W-0.3Ti-0.3Y2O3 HE sample. This source is located close to a grain boundary. Images a) to d) illustrate the motion of a dislocation d (E corresponds to a pinning point). (e) is a schematic representation of the observed area. (g) illustrates cavity formation. The images differences g) to i) show the successive motions of the dislocation.
T
50 nm
Triple line

MatISSE – D4.12 – revision 0 issued on 1/12/2016
Page 14/45
Figure 9: Panorama realized at the end of a TEM in-situ straining experiment at 500°C on a 14Cr-1W-0.3Ti-0.3Y2O3 HE sample showing grain boundary decohesion. The double arrow indicates the direction of solicitation.
As noticed at lower temperature, intragranular activity is still present. Nevertheless intergranular activity and associated grain boundary damaging are also present. The behavior of the ODS seems thus resulting from a competition between intragranular plasticity and intergranular damaging. However, experiments were mainly realized by increasing temperature by steps. Thus when arriving at high temperature, samples were already noticeably strained and sensitization of grain boundary to damaging cannot be excluded. Also an effect of high temperature could be present, but I suspect if present it is only of second order at the investigated temperatures.
The beginning temperature for the ‘high’ temperature behavior depends of course of the materials, but it should happen above 400°C (between 500/600°C), rather around 600°C in case of dynamic strain ageing phenomenon (following paragraph).
1.1.3 Dynamic strain ageing at intermediate temperature
As shown in the former chapter, the dislocations motion evolves with temperature:
at low temperature, the dislocations move individually in a jerky way,
at higher temperature, the dislocations move in a more viscous way.
At intermediate temperature, observations indicated the existence of dynamic strain ageing phenomenon, at least for some grades. This phenomenon is classically associated to the interactions between dislocations and solute atoms, leading in a range of temperature to plastic instabilities. Observations of avalanches of moving dislocations separated by long waiting times allow assessing the existence of dynamic strain ageing phenomenon. Indeed such a motion where the dislocation velocity is very high or very low, but never intermediate is a proof of dynamic strain ageing phenomenon.
First indications of dynamic strain ageing phenomenon are shown in figure 10 on a 14Cr-1W-0.3Ti-0.3Y2O3 HIP specimen tested at 575°C. At this temperature, slow and quick dislocations movements are observed in the same grain. On figure 10a, a dislocation, called d1 and anchored in A, is indicated. This dislocation moved slowly during all the sequence. Indeed slow curvature of the d1 dislocation is shown between figure 10a and 10b. This dislocation speed is estimated around few nanometers per second. Another dislocation, d2, appeared suddenly between figure 10c and 10d letting slip traces on the surface of the sample. This dislocation moves faster at a speed around 10 µm per second. The coexistence of these two speeds suggests that the transition between quick and slow motion happens around 575°C. Indeed, as shown previously, at 580°C a viscous motion is observed in this material. Further observations allow observing limited bursts of dislocations (simultaneous jerky motion of dislocations) at 500°C on the 14Cr-1W-0.3Ti-0.3Y2O3 HIP specimen as illustrated in figure 11. Between images 11a and 11b, dislocations suddenly glide (between two successive video images acquisition) on the top right corner as shown by the numerous slip traces present in image 11b.These slip traces exhibit all the same orientations.
Bursts of dislocations were also observed on the almost fully recrystallized microstructure (thermomechanical treatment of 14Cr-1W-0.3Ti-0.3Y2O3 HE samples). In these cases, the bursts were observed in areas close to cracks and exhibiting already numerous dislocations.

MatISSE – D4.12 – revision 0 issued on 1/12/2016
Page 15/45
Figure 10: a), b), c), d) Images extracted from a TEM in-situ straining experiment at 575°C on a 14Cr-1W-0.3Ti-0.3Y2O3 HIP sample illustrating the dynamic strain ageing. Coexistence of slow movements (a-b: d1 dislocation) and quick displacements (c-d: d2 dislocation).
a) b)
Figure 11: a), b) Images extracted from a TEM in-situ straining experiment at 500°C on a 14Cr-1W-0.3Ti-0.3Y2O3 HIP sample illustrating the dynamic strain ageing phenomenon.
It seems that the range of temperature for the dynamic strain ageing phenomenon is dependent on the material. Indeed in the almost fully recrystallized microstructure, obtained by thermomechanical treatment of 14Cr-1W-0.3Ti-0.3Y2O3 HE samples, the dynamic strain ageing phenomenon is observed between 400°C and 550°C. For the 14Cr-1W-0.3Ti-0.3Y2O3 HIP sample, as shown before, the end happens around 580-600°C. The beginning is more difficult to detect and should happen at around 500°C since individual jerky movements and burst of dislocations are simultaneously observed at 500°C, but in the same time bursts were not clearly observed at 550-560°C. Finally for the 14Cr-1W-1Ti-1Y2O3, the phenomenon was not detected up to 550°C. From the microstructure of these materials it can be suspected that the domain of strain ageing

MatISSE – D4.12 – revision 0 issued on 1/12/2016
Page 16/45
phenomenon is displaced or restricted to higher temperature with an increase of nanoclusters population and/or a decrease of the grain size.
It must also be stressed out that the dynamic strain ageing phenomenon has only been observed on HIP type microstructures. On HE samples, this phenomenon has not been evidenced. Thus this phenomenon is well present but the experiments were performed at temperatures not included in the range of temperature of the phenomenon. Or else this phenomenon is not present in HE samples (or visible as bursts of dislocations). Indeed as just explained, the dynamic strain ageing phenomenon happens at different temperatures according to the material. Moreover the grain microstructure of the HE samples is relatively fine, which is in agreement with the suspected grain size effect (paragraph just before). Finally, the fact that the almost fully recrystallized microstructure exhibits a domain of strain dynamic ageing phenomenon is another argument in favor of the grain size effect since this material is obtained by thermomechanical treatment of HE samples.
From the suspected effect of nanocluster content or grain size, it seems that the occurrence of the dynamic strain ageing phenomenon is dependent of the local stress. It happens when local stress is sufficiently high. Indeed, as noticed previously in the almost fully recrystallized microstructure, bursts were observed close to cracks. It is suspected that local stress is relatively high. Moreover in both materials where the dynamic strain ageing phenomenon was noticed, experiments were carried out with temperature increases steps. Thus when phenomenon was noticed, samples were already plastically deformed.
The dynamic strain ageing phenomenon is often associated to a minimum of ductility, that is observed on the ODS tensile curves, generally between 400°C/600°C. As it is also observed on HE samples, it may signify that even if the bursts of dislocations are not observed, some effects could nevertheless be present. This minimum of ductility suggests that at these temperatures, grain boundaries tend to be damaged. Thus we can wonder on the correlation between this phenomenon and the decohesion observed at high temperature, particularly for the experiments with temperature increases steps.
1.1.4 Complementary analyses
1.1.4.1 Stress for precipitates by-passing
Estimations of the local stress at different temperatures have been realized on the 14Cr-1W-0.3Ti-0.3Y2O3 HIP, as shown on the figure 12. The curvature of the dislocation just before unpinning is fitted with an ellipsoid. Its axes allow evaluating the back stress thanks to the DISDI software. Figure 12 illustrates the ellipsoids obtained at room temperature, 500°C and 600°C. The determined stresses are respectively 930 MPa, 810 MPa and 210 MPa. These results clearly show that the overcoming of obstacles happens at lower stress when temperature increases. This phenomenon is more pronounced at higher temperature since the decrease is sharper between 500°C and 600°C than between room temperature and 500°C. This decrease of the overcoming stress cannot be attributed only to the decrease of the elastic constant with the temperature, but suggests that a mechanism of obstacles overcoming is thermally activated.
Figure 12: Determination on a 14Cr-1W-0.3Ti-0.3Y2O3 HIP of the local stress at different temperatures: a) 20°C, b) 500°C, c) 600°C; ellipsoids are used to fit the curvature of the dislocations; axes of the ellipsoids allow evaluating the back stress thanks to the DISDI software.
1.1.4.2 Slip planes determination
An analysis of the slip planes at different temperatures has been carried out on the 14Cr-ODS steels. From the acquisition of the diffraction pictures of a grain at different tilts, it is possible to reconstruct the stereographic projection of the grain (shown in figure 13b). This projection allows more or less determining the slip planes of dislocations from the knowledge of the tilt of the images and the orientation of the slip traces on the surface as illustrated in figure 13. The figure 13a corresponds to an image taken at -23° of tilt. On this image, slip traces are observed at an angle of 80° to the perpendicular to the image. This angle is reported on the stereographic

MatISSE – D4.12 – revision 0 issued on 1/12/2016
Page 17/45
projection of the grain, giving the red point on the blue curve that represents the surface thin foil. Three {112} planes could correspond as three red curves of the {112} planes, i.e. (12-1), (21-1) and (2-1-1), and the blue curve of the surface intercept close to the red point. Taking into account the uncertainty, it is not possible to clearly discriminate between the three planes. Nevertheless, the (21-1) plane is the only one exhibiting a Burgers vector of <111> type in agreement with the suspected screw character of the dislocation. The corresponding Burgers vector would thus be [1-11].
a)
b)
Figure 13: Determination of the slip plane at 400°C in a grain of the 14Cr-1W-0.3Ti-0.3Y2O3 HIP; a) image at -23° of tilt showing slip traces on the surface of the thin foil in blue and in red the orientation of the dislocations; b) stereographic projection of the grain with in red the {112} planes and in blue the surface of the thin foil for the grain tilted of -23° and black dashed line identified the <111> type Burgers vector of the dislocations.
A limited number of analyses are available. At room temperature, gliding in {110} planes was observed (figure 3). At 400°C dislocation motion was determined to happen in {112} planes. At 600°C, dislocations gliding in {110} planes were noticed. Finally gliding of dislocations in {112} planes was also observed at 650°C. Thus both at low temperature and high temperature, dislocation motion seems to happen in {110} or {112} planes. There is apparently no effect of temperature on the gliding planes.
1.1.4.3 Behavior of Fe-14Cr without nano-precipitates
Experiments carried out at different temperatures on the non re-inforced Fe-14Cr matrix indicate similar behavior as the Fe-14Cr re-inforced matrix (ODS). At low temperatures, individual dislocations move in a jerky way. However, dislocations of this grade seem to exhibit slightly more pronounced curvatures. At intermediate temperatures, dynamic strain ageing phenomenon was detected, as illustrated in figure 14. At high temperature, viscous motion of dislocations is observed. At 600°C, grain boundary sliding is also noticed, surely favored by noticeable surface oxidation. The dynamic strain ageing domain starts for temperatures between 200°C and 300°C. From the observation of the coexistence of slow and quick motion of dislocations, the temperature of transition to viscous motion is determined to be around 500°C. Compared to the re-inforced materials the nano-precipitates do not seem to have an effect on the nature of the mechanisms (dislocation behavior). Nevertheless, the ranges of temperatures of the different behavior are not the same. These differences could be due to the presence of the nano-precipitates and their effects on the motion of dislocations.
The determination of the slip planes on the non re-inforced matrix was also performed in some deformed grains at room temperature and 400°C. In all cases, the most appropriates planes were {112} type planes. In ODS steels, these planes were also observed, nevertheless slip in {110} planes were also observed.
23° of tilt, 80°
Tilt of -23°
80°

MatISSE – D4.12 – revision 0 issued on 1/12/2016
Page 18/45
Figure 14: a) and b) Images extracted from a video sequence of a TEM in-situ straining experiment at 450°C on non re-inforced material showing burst of dislocations.
1.1.4.4 Behavior of 9Cr-ODS
TEM in-situ straining experiments have also been performed between room temperature and 500-550°C on 9%Cr ODS steels. The behavior is the same as for 14%Cr-ODS steels. At room temperature, the dislocations move in a jerky way and pin on precipitates as illustrated in figure 15. They are curved by the stress (figure 15c). When unpinned, their motion is fast (several hundreds of nanometers per second). In this figure the dislocations come from the same area. Thus the presence of an intragranular source can be suspected. At high temperature (500-550°C), the motion of the dislocations is more viscous. The formation of cavities at triple grain boundaries was observed (figure 16), leading to grain boundary decohesion at the end of the experiment.
Figure 15: a), b) Images extracted from a video of a TEM in-situ straining experiment carried out at room temperature on a 9Cr ODS steel; c) image resulting from the difference between images a) and b), with in white the initial positions of dislocations d1 and d2 and in black their final position; black arrows indicate pinning points (referred as A) and dashed arrow the motion of the dislocations.
(b)
(c)
(a)
50 nm 50 nm
50 nm
d1
d2
d1
d2
d1
d2
A
A A
A
A A
t = 0s t = 0.48s
(a) (b)

MatISSE – D4.12 – revision 0 issued on 1/12/2016
Page 19/45
Figure 16: a) Image extracted from a TEM in-situ straining experiment at 500°C on a 9Cr-1W-0.3Ti-0.3Y2O3 HE sample showing cavity formation (c), leading to grain boundary decohesion at the end (b).
100 nm 50 nm
Sollicitation direction C
(a)
(b)

MatISSE – D4.12 – revision 0 issued on 1/12/2016
Page 20/45
Conclusions on CEA Results
The behavior of Fe-14Cr ODS steels has been analyzed at the grain scale by in-situ TEM deformation experiments between room temperature and about 650°C. An evolution with temperature of the motion of the dislocations has been shown. Two domains of temperature have thus been defined.
At low temperature (between room temperature and about 400°C), mechanisms are clearly intragranular. Individual dislocations move in a jerky way, by a nano-precipitates pining-unpinning step.
At higher temperature (from about 400°C to 650°C), intragranular activity is still observed, but thermal activation of the overcoming of the precipitates happens, as can be deduced from the decrease of the measured local stress to overcome precipitates. Indeed, in this range of temperature the dislocations move individually in a more viscous way. Moreover intergranular activity is also detected and noticeable grain boundary damage is obtained.
Between these two domains, in some ODS steels, dynamic strain ageing has been identified in the 400-500°C domain, as bursts of dislocations are observable.
To go further, the development of a sample-holder in order to perform ion irradiations using Jannus facility on samples dedicated to post-irradiation in-situ TEM deformation experiments is under progress at CEA Saclay. The irradiation behavior could thus be addressed. In the same time a cooperative work between CIEMAT, CEMES and CEA is under progress in order to complete ODS behavior analysis on high temperature (up to 700°C) and anisotropy. Indeed in TEM in-situ performed experiments, samples cut in the transversal and longitudinal directions were observed but no evident differences of dislocation moving that would explain anisotropy of the behavior of HE samples, were observed, supplementary experiments will improve this analysis.
Acknowledgement
I wish to thank gratefully Dr. F. Mompiou and Dr. D. Caillard from CEMES to perform the TEM in-situ straining experiments and also the METSA platform to support part of the experiments.

MatISSE – D4.12 – revision 0 issued on 1/12/2016
Page 21/45
2 CIEMAT experiments
The report includes the contribution from CIEMAT to the deformation mechanism investigation carried out in WP4, Task 4.1 of MatISSE project. CIEMAT experiments involve the examination of deformed microstructures after deformation or during in-situ straining, from different types of experiments:
- Tensile tests - In-situ TEM straining experiments - In situ synchrotron compression tests
The investigated material has been in all the cases, an Fe14Cr-ODS hot extruded bar, provided by CEA (France).
TEM examination of the deformed microstructure after tensile tests
Tensile specimens were machined in the transverse and longitudinal orientation with dog-bone geometry with a gauge section of 15x3x2 mm. Tensile tests were performed at RT: 22 ºC (295 K), 400 ºC (673 K), 600 ºC (873 K) and 700 ºC (973 K). Results from the tensile testing and other mechanical properties studies, as well as about the microstructure of this material are recorded in references [1-4].
Figure 1, below, shows the tensile curves obtained at different testing temperatures, together with the images of the tensile broken specimens.
Figure 1: Tensile curves obtained at different testing temperatures and photographs of the tensile broken specimens.
Tensile tests results show a different behavior depending on the testing temperature, i. e., ductile up to 400ºC and brittle at higher testing temperature, indicating a change in the deformation and fracture mode. The objective of the TEM examination is to provide evidence of deformation and strengthening microscopic mechanisms contributing to the observed mechanical behavior.

MatISSE – D4.12 – revision 0 issued on 1/12/2016
Page 22/45
2.1.1 Results of TEM examination of the Fe14Cr-ODS deformed at different
temperatures
Before going into the qualitative description of the deformed microstructure, it is worth mentioning that the initial, as received, microstructure is inhomogeneous. An example is shown in figure 3. The grain structure appears to be composed by large elongated grains, together with regions of small equiaxed grains. Regarding the dislocation structure, regions with different dislocation density are present. The observed strengthening nanoprecipitates are not uniformly distributed and they can be found forming lines, sometimes parallel to grain boundaries, as well as channels free of precipitates. The size distribution of precipitates can be classified in two ranges, smaller than 20 nm and larger than 20 nm, with regions where one or the other predominates. The nanoprecipitates also show different morphologies, square or round, different composition and stoichiometry, implying different crystallography and interfacial structure. These spatial inhomogeneities will offer regions with different obstacles to dislocation motion and will influence the material answer to deformation. It is, then, desirable to understand their role at different temperatures.
Figure 2: Example of initial, as-received, microstructure.
The TEM specimens, 3 mm discs, were extracted out from the gauge section of the tensile broken specimens. They were mechanically thinned up to 0.1 mm and electropolished to electron transparency in 5% perchloric in methanol solution at -60ºC. A final low energy ion milling was given in order to remove the oxide layer. A TEM JEOL JEM-2010 working at 200kV was employed.
Figure 3 shows the microstructure observed after tensile test at RT. In this condition, a very high dislocation density was observed inside the grains, showing a highly stressed microstructure. Dense tangled dislocations appear, due to dislocation-dislocation interactions. A fine dispersion of nanoprecipitates acting as pinning sites were observed, being a mark of the interactions between dislocations and precipitates. Dislocations appear distributed at the interior of the grains, only occasionally regions free of dislocations were observed.

MatISSE – D4.12 – revision 0 issued on 1/12/2016
Page 23/45
Figure 3: Example of the microstructure observed by TEM on the Fe14Cr-ODS tested at RT.
Dislocation loops could also be observed, but it was difficult to discern if they come from Orowan processes or from dislocation-dislocation interaction. An example is shown in figure 4, where arrows point to the location of dislocation loops.
The observed microstructure is the result of dislocation movement during the tensile test. The dislocations move but they are efficiently pinned at precipitates, staying at the interior of the grain, so the deformation accommodates inside the grain. Thus, dislocation-dislocation and dislocation-precipitate interactions seem to be the main contribution to hardening at RT.
Figure 4: Example of the microstructure observed by TEM on the Fe14Cr-ODS tested at RT.
After tensile testing at 400ºC, the observed microstructure is more relaxed than at RT, an example is shown in figure 5 where, qualitatively, lower dislocation density is observed. The dislocations still appear pinned to precipitates, meaning that at 400ºC, the nano-oxides are still persistent barriers to dislocation motion.

MatISSE – D4.12 – revision 0 issued on 1/12/2016
Page 24/45
Figure 5: Example of the microstructure observed by TEM on the Fe14Cr-ODS tested at 400ºC.
Another observed microstructural feature is the presence of regions with low dislocation density in regions with low density of precipitates, shown in figure 6. Due to the different mobility of dislocations in regions with different nano-precipitates density, dislocations accumulate at frontiers delimitating those regions giving place to subgrain boundary formation.
Figure 6: Example of the microstructure observed by TEM on the Fe14Cr-ODS tested at 400ºC.
After testing at 600ºC, where the behavior starts to be brittle, the microstructure shows regions as the one shown in figure 7. Regions with low dislocation density even in regions with high density of precipitates were observed. Again, dislocations accumulate at frontiers between regions of low and high precipitation density forming subgrain boundaries. Free dislocation regions appear even in regions of high density of precipitates,

MatISSE – D4.12 – revision 0 issued on 1/12/2016
Page 25/45
this fact is considered as an indication that precipitates lost their efficiency as pinning sites to dislocations and of a change in dislocation-precipitate interaction mechanism.
Figure 7: Example of the microstructure observed by TEM on the Fe14Cr-ODS tested at 600ºC.
Similar situation than at 600ºC is observed after testing at 700ºC. An example is shown in figure 8 below. Formation of subgrain boundaries is observed due to the accumulation of dislocations at frontiers between inhomogeneous regions. No tangled dislocations in regions with high precipitation density are observed, showing that at this testing temperature, dislocations are able to easily bypass precipitates. Then, the contribution from precipitates to hardening decreases. Other mechanisms start to be relevant, such as the subgrain boundary formation, that may be considered as an “intragranular” mechanism that may reduce ductility but delays brittle fracture.
Figure 8: Example of the microstructure observed by TEM on the Fe14Cr-ODS tested at 700ºC.

MatISSE – D4.12 – revision 0 issued on 1/12/2016
Page 26/45
2.1.2 Summary of TEM examination of deformed microstructures
A qualitative description of the observed microstructural features in the deformed microstructure after tensile tests at different temperatures is given. At low testing temperatures, below 400ºC, the deformed microstructure is dominated by high dislocation density at the interior of the grains due to efficient pinning of the nanoprecipitates. Features indicating a lower efficiency on the pinning of dislocations by precipitates, as testing T increases are the observed free dislocation regions and the formation of subgrain boundaries between regions of different densities of precipitates or region delimitating inhomogeneities, due to the different mobility of dislocations in each region. The described features can be found after deformation in the different conditions, but their proportion would depend on testing T. Further work on quantifying every type of microstructural feature is needed in order to determine the relative importance of every deformation mechanisms depending on T.
TEM in-situ straining experiments
The experiments were performed at CEMES (Toulouse, France) in a TEM JEOL-2010 and employing an straining sample holder with possibility of heating. The experiments were performed thanks to an accepted proposal presented by CIEMAT at the ESTEEM2 platform for use of European facilities. They were performed in collaboration with F. Mompiou (CEMES) and J. Malaplate (CEA) by the end of March 2016. The studied material was Fe14Cr ODS, heat J27 from CEA (Bar 1-3). The orientation of the specimens refered to the received bar is shown schematically in figure 9. Orientation R was selected for this set of experiments in order to be complementary to previous experiments from CEA on L direction.
Figure 9: Sketch of the orientation of the specimens fabricated for in-situ straining experiments.
Table 1: Summary of temperature conditions investigated in the in-situ experiments.
Specimen code
Temperature (ºC)
R1 200 400
600
R2
550 600 620 700
R3 200 400 - - - -
R5 - 400
600
700
R7 - - - 600 650 700
L5 - - - - - 700

MatISSE – D4.12 – revision 0 issued on 1/12/2016
Page 27/45
Synchrotron experiments
Internal strains were evaluated by in-situ synchrotron compressive tests at room temperature conducted at EDDI beamline at the storage ring BESSY, at the Helmholtz Zentrum Berlin (Germany). The high temperature tests were performed at PETRA III-DESY facility (Germany). The investigated material was the Fe14CrODS in as-received estate and aged at 700ºC/10000h. Cylindrical samples were machined along the extrusion direction and 3 mm discs were extracted from the compressed specimens suitable for TEM examination.
Figure 10 shows the curve obtained during in situ compressive tests for the aged extruded 14Cr ODS. The curve can be divided in two parts, the corresponding linear elastic behavior and the plastic region up to 11% engineering strain. The evolution of internal elastic strains as function of internal von Mises stresses in the axial direction is also shown in the right part of figure 10. Three representative reflections of the bulk material have been chosen for ferritic matrix that are (110), (221) and (321) while the (222) reflection is selected for the Y2Ti2O7 present in the aged material. The high energy x-ray diffraction experiments show that there is a load transfer from the ferritic matrix to oxide particles that bear more load than the one applied to the material. High-energy in situ diffraction experiments at different temperatures up to 700 ºC, at PETRA III are under interpretation.
Figure 10: Curves obtained during in situ compressive tests for the aged extruded 14Cr ODS
Figure 11 shows an example of the microstructure observed by TEM after the synchrotron test. After deformation at room temperature there is a high dislocation density within grains. Dislocation are pinned at nano-oxides, showing that deformation is controlled by intragranular mechanisms.
-0.10 -0.05 0.00
0
200
400
600
800
1000
1200
App
lied s
tress (
MP
a)
Engineering strain
Aged
0.00
-0.05
-0.10
-0.15
-4000 -2000 0
stress (MPa)
str
ain
(m
m)
110
211
321
oxide
Aged

MatISSE – D4.12 – revision 0 issued on 1/12/2016
Page 28/45
Figure 11: Example of the microstructure observed by TEM showing a high dislocation density at the interior of the grains after 11% of deformation
2.1 Conclusions on CIEMAT experiments
Many new experimental results were obtained during the last months, the full interpretation is in progress and will be reported as an annex to the present deliverable.
Acknowledgements Authors wish to thank gratefully Dr. F. Mompiou and Dr. D. Caillard from CEMES for performing the TEM in-situ straining experiments and also the ESTEEM2 platform to support these experiments. Additionally, we thanks Dr. G. Garcés, from CENIM (Spain), for his help and collaboration in the synchrotron experiments as well as to BESSY and DESY facilities where the experiments were carried out.
References on Ciemat contribution
1. Serrano et al. J. of Nucl. Mat. 428 (2012) 2. García-Junceda et al. Materials Science and Engineering A (2012) 3. Serrano et al. Materials Science and Technology 30 (2014) 4. Serrano et al. Metallurgical and Materials Transactions E: Materials for Energy Systems (2016)

MatISSE – D4.12 – revision 0 issued on 1/12/2016
Page 29/45
3 KIT contribution on the mechanical behaviour on 9Cr-ODS
steel bar
The part presents an overview on the contribution from KIT which includes microstructure characterization and tensile tests performed on the 9Cr-ODS steel.
KIT Experiments and studied material
3.1.1 Materials
The 9Cr-ODS steel (designated herein as 9YWT-MATISSE) was developed and produced by CEA, France
within the framework of MATISSE. The pre-alloyed metal powder, obtained from Aubert & Duval, was
mechanical alloyed with 0.25 wt.% Y2O3 in a dry- type attrition ball mill. The milling was performed by Plansee
in a hydrogen atmosphere for 24 h. Thereafter, the powder was sealed in a soft steel can and hot extruded at
around 1100°C. The air cool bars, now in a ferritic state, were semi-finished in the form of cylinders with 30
mm length and 4.2 mm diameter. These cylinders were then austenized at 1050C for 10 min, followed by
quenching with helium gas where the cooling rate was carefully chosen (6 - 7 C/s). Then, a tempering
treatment was performed at 750C for 20 min, which was followed by the air cooling. The chemical composition
of the steel is shown in Table 1.
Table 1: Chemical composition (H* in ppm, others in wt.%) of as-received 9YWT-MATISSE.
Element Cr W Ti Si Ni Mn C H* Y2O3 Fe
Amount 9.1 1.1 0.3 0.3 0.5 0.3 0.1 10 0.25 Bal.
3.1.2 Experiments
Microstructural characterization was carried out in both as-received as well as in deformed state by
transmission electron microscopy (TEM). The TEM samples were prepared by cutting platelets using a Well
diamond saw from the gauge section of broken tensile specimen. One or two discs were punched out from
these platelets that were grinded to a thickness of 100 μm. Electrochemical thinning to electron transparency
of these discs was done using a Tenupol 5 jet polisher. As an electrolyte a mixture of sulfuric acid (20%) and
absolute methanol (80%) was used at 23°C, 16-18V and a flow rate of 40 (full scale 50). Finally, the electro-
polished TEM samples were ion milled to obtain a clean surface. The TEM study was performed with a FEI
TECNAI-20F (200 kV) TEM equipped with the high-angle annular dark-field (HAADF) detector for scanning
TEM (STEM). The elemental analysis has been performed using energy dispersive X-ray (EDX) spectroscopy.
The fracture surface was investigated with a Zeiss EVO MA 10 scanning electron microscope (SEM) equipped
with a Bruker EDX detector. The electron backscatter diffraction (EBSD) patterns were acquired using a Bruker
e-Flash detector and analyzed with the QUANTAX ESPRIT 1.9 software (parameters employed for EBSD
measurements are: step size of 0.068 m, voltage of 20 kV and current of 6 nA). The samples were prepared
by vibratory auto-polishing using colloidal alumina for several hours. All analyses were made in the extrusion
direction.
For tensile testing, a universal testing machine (Instron 4505) equipped with a high-temperature furnace and
an extensometer (gauge length of 10 mm) was used for this purpose. Owing to the material quantity limitations,

MatISSE – D4.12 – revision 0 issued on 1/12/2016
Page 30/45
small tensile test specimens with the gauge length of 13 mm and gauge diameter of 2 mm were used. All
specimens were machined parallel to the extrusion direction. All tests were carried out in air at temperatures
ranging from room temperature (25°C) up to 800C with a nominal strain rate of 10-3 s-1. At elevated
temperatures, the dwell time prior to the test start was at least 30 minutes. The temperature was monitored by
a (Ni-Cr)-Ni thermocouple placed in contact with the specimen and was controlled to within 2°C.
Fig. 1: Mini specimen used for the tensile testing.
KIT results
3.1.3 Microstructure in as-received state
Fig. 2 shows HAADF-STEM images of the microstructure of the 9YWT-MATISSE in tempered condition. The
additionally shown schematic in Fig. 2c presents a clear picture of the microstructure. Owing to the composition
and heat treatments, the microstructure typically consists of a tempered martensite with hierarchically
organized internal interfaces. The prior austenitic grains (PAGs) are subdivided into packets of laths and
subgrains with a high dislocation density (Fig. 2b). The typical laths were several µm in length and 0.25 0.06
µm in width. The non-regular shaped M23C6 carbides precipitate heterogeneously and preferentially at prior
austenitic grain boundaries (PAGBs), packet or block and lath boundaries (Fig. 3a). These carbides are rich
in chromium (Cr), iron (Fe) and tungsten (W) as measured via EDX analysis. Relatively large, about 50 to 300
nm, closely spaced M23C6 carbides precipitate at the PAGBs, while smaller carbides, less than 100 nm,
precipitate on the remaining internal interfaces. The finely dispersed complex Y-Ti-O nanoparticles (Fig. 3b
and c) were mostly revealed inside the laths and subgrains, yet at boundaries as well. These spherical Y-Ti-O
particles had a size distribution ranging from 2 to 25 nm. Coarse spherical particles (Fig. 3a), up to 200 nm in
diameter, were also observed at different boundaries, and identified by means of the STEM-EDX detector as
Ti-enriched carbides.
A typical inverse pole figure (IPF) map obtained by EBSD for the 9YWT-MATISSE is presented in Fig. 4a. The
dissimilar colors of the grains in the IPF map reveal the large difference in the orientation of the neighbor
grains. In 9YWT-MATISSE, both high- and low-angle grain boundaries are present. The misorientation
analysis (Fig. 4b) shows that the fractions of high-angle grain boundaries (>15°) and low-angle grain
boundaries (2°-15°) are 78% and 22%, respectively. No texture can be identified on the stereographic
projections (Fig. 4c). The average grain size measured from the EBSD images was 0.46 0.02 µm.

MatISSE – D4.12 – revision 0 issued on 1/12/2016
Page 31/45
Fig. 2: HAADF-STEM images (a) and (b) along with its detailed schematic (c) show a typical tempered
martensitic microstructure that consists of prior austenitic grains sub-structured with the packets or blocks of
laths, ferritic laths and subgrains having high dislocation density. Bright contrast spots are M23C6 type carbides
that decorate different boundaries, and Y-Ti-O particles (not visible here, see Fig. 3) are embedded in the
matrix as well as at the boundaries.
Fig. 3: HAADF-STEM image (a) showing coarse M23C6 type carbides in a bright contrast and Ti-C type
carbides in a dark contrast present at different internal interfaces, (b) shows nano-sized complex Y-Ti-O
MatISSE – D4.12 – revision 0 issued on 1/12/2016
Page 32/45
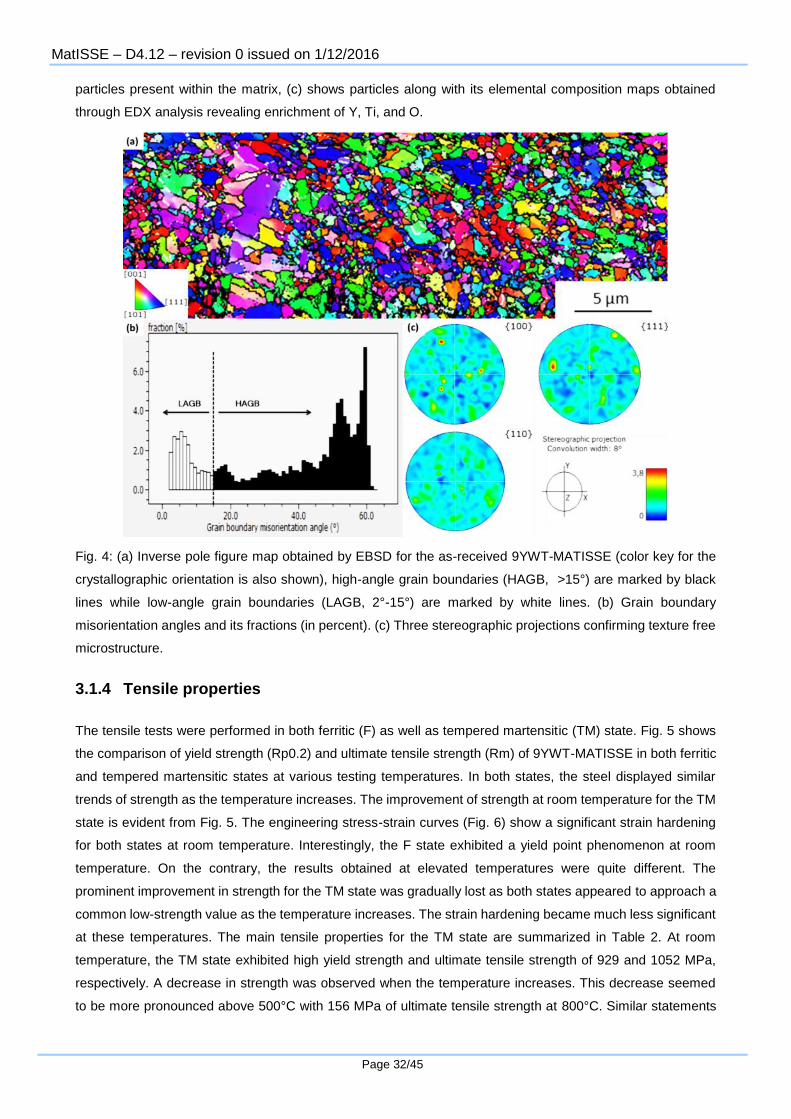
particles present within the matrix, (c) shows particles along with its elemental composition maps obtained
through EDX analysis revealing enrichment of Y, Ti, and O.
Fig. 4: (a) Inverse pole figure map obtained by EBSD for the as-received 9YWT-MATISSE (color key for the
crystallographic orientation is also shown), high-angle grain boundaries (HAGB, >15°) are marked by black
lines while low-angle grain boundaries (LAGB, 2°-15°) are marked by white lines. (b) Grain boundary
misorientation angles and its fractions (in percent). (c) Three stereographic projections confirming texture free
microstructure.
3.1.4 Tensile properties
The tensile tests were performed in both ferritic (F) as well as tempered martensitic (TM) state. Fig. 5 shows
the comparison of yield strength (Rp0.2) and ultimate tensile strength (Rm) of 9YWT-MATISSE in both ferritic
and tempered martensitic states at various testing temperatures. In both states, the steel displayed similar
trends of strength as the temperature increases. The improvement of strength at room temperature for the TM
state is evident from Fig. 5. The engineering stress-strain curves (Fig. 6) show a significant strain hardening
for both states at room temperature. Interestingly, the F state exhibited a yield point phenomenon at room
temperature. On the contrary, the results obtained at elevated temperatures were quite different. The
prominent improvement in strength for the TM state was gradually lost as both states appeared to approach a
common low-strength value as the temperature increases. The strain hardening became much less significant
at these temperatures. The main tensile properties for the TM state are summarized in Table 2. At room
temperature, the TM state exhibited high yield strength and ultimate tensile strength of 929 and 1052 MPa,
respectively. A decrease in strength was observed when the temperature increases. This decrease seemed
to be more pronounced above 500°C with 156 MPa of ultimate tensile strength at 800°C. Similar statements

MatISSE – D4.12 – revision 0 issued on 1/12/2016
Page 33/45
can be made for the steel in the F state. The main tensile properties for the F state are summarized in Table
3.
Fig. 5: Comparison of yield strength (Rp0.2) and tensile strength (Rm) of 9YWT-MATISSE in ferritic (F) and
tempered martensitic (TM) states at various testing temperatures.
Fig. 5: Engineering stress-strain curves of 9YWT-MATISSE in both ferritic (F) and tempered martensitic (TM)
states.

MatISSE – D4.12 – revision 0 issued on 1/12/2016
Page 34/45
Table 2: Tensile data for tempered martensitic 9YWT-MATISSE at various temperatures.
Temperature (°C)
Rp0.2 (MPa) Rm (MPa) Ag (%) A (%)
Z (%)
25
929 1052 2.7 7.6 67.7
500
633 656 0.9 16.5 60.5
550
487
509 1.0 22.6 60.3
600
374 405 1.6 30.7
61.2
650
264 295 2.6 35.0 58.6
700 196
226 6.1 38.4 50.0
800 120 156 8.9 16.7 37.5
Table 3: Tensile data for ferritic 9YWT-MATISSE at various temperatures.
Temperature (°C)
Rp0.2 (MPa) Rm (MPa) Ag (%) A (%)
Z (%)
25
740 903 10.3 20.9 71.4
500
468 495 5.3 19.9 66.0
550
431
442 3.9 22.1 63.4
600
338 341 5.6 30.6
61.9
650
261 271 7.5 32 60.5
700 196
218 8.7 25.6 52.7
The evolution of the uniform elongation (Ag) and total elongation-to-failure (A) in both tested states are shown
in Fig. 6. Based on the relative strength behavior the elongation results were obtained as expected. The TM
state exhibited a relatively low total elongation-to-failure (7.6%) at room temperature. However, with the
increase in testing temperature the total elongation-to-failure increased and reached a maximum of 38.4% at
700C. Thereafter, a drop down to a value of 16.7% at 800°C was observed. Interestingly, at elevated
temperatures the two states also presented a similar trend of total elongation-to-failure, with the TM state curve
coinciding the F state curve. However, the peak ductility for the TM state was shifted towards higher
temperature by 50°C. Although both states revealed a similar trend, a relatively higher uniform elongation was
observed for the F state than for the TM state at all testing temperatures. A difference of necking appeared
depending on the testing conditions (as it will be confirmed later in the fracture surface investigations). A strong

MatISSE – D4.12 – revision 0 issued on 1/12/2016
Page 35/45
reduction of cross-section has been noticed, leading to a high necking coefficient (Z1) for the TM state samples
tested up to 600°C. Thereafter, the gauge section did not vary that much leading to a consistently reduced Z.
Fig. 6: Comparison of uniform (Ag) and total elongation (A) of 9YWT-MATISSE in ferritic (F) and tempered martensitic (TM) states at various testing temperatures.
3.1.5 Deformed microstructure
For investigation under deformed state, TEM samples were prepared from the gauge section region of the TM
state specimens. At room temperature, the deformed microstructure shows similar characteristics as those
typically observed for an as-received state (Fig. 7a). However, the dislocations are mostly bowed out due to
pinning at the nano-sized Y-Ti-O particles (Fig. 7b). It is evident from the Fig. 7a and b that the dislocation
activity is homogeneously distributed across the whole grains. At elevated temperatures, the microstructural
evolution becomes prominent with the decrease in dislocation density and the appearance of polygonal grains
that replace the original lath structure (c.f. Fig. 7a and c). The temperature dependence of grain sizes is shown
in Fig. 9. Interestingly, a more intense dislocation activity is noticed close to the grain boundaries in form of a
dislocation pile-up (Fig. 7c). In addition, slight coarsening of M23C6 carbides was also observed. At 800°C, the
M23C6 precipitate sizes close to PAGBs were in a range of around 100 to 450 nm. However, the Y-Ti-O particles
appeared very stable over the whole investigated temperature range, without any change in shape or size.
Fig. 8 presents TEM images in a deformed state obtained after the tensile test at 800°C. Fig. 8a shows a bright
field image of an equiaxed -Fe grain with high dislocation pile-up at the grain boundaries and dislocations
that are pinned to the Y-Ti-O particles at various locations. The selected area diffraction pattern from the grain
in the middle is near the -Fe [100]-zone axis (inset Fig. 8a). The dark field image (Fig. 8b) obtained from
marked (white circle) reflection �⃗� = {11̅0} reveals the dislocation structure. The partially illuminated grain
displays a dark contrast near the grain boundaries and a bright contrast at the central region. These facts
confirm a large localized deformation due to dislocation pile-up close to the grain boundaries. Moreover, it also
1 Z (%) = (𝑆𝑖𝑛𝑖𝑡𝑖𝑎𝑙−𝑆𝑓𝑟𝑎𝑐𝑡𝑢𝑟𝑒
𝑆𝑖𝑛𝑖𝑡𝑖𝑎𝑙) × 100
Where 𝑆𝑖𝑛𝑖𝑡𝑖𝑎𝑙 is the initial sample cross-section area and 𝑆𝑓𝑟𝑎𝑐𝑡𝑢𝑟𝑒 is the fractured cross-section area.

MatISSE – D4.12 – revision 0 issued on 1/12/2016
Page 36/45
confirms a presence of low-angle grain boundary (LAGB) (as indicated in Fig. 8a), which appears to be
undergoing an annihilation process to form a coarse equiaxed grain. The M23C6 carbides are coherent and
display a similar contrast, i.e., the same crystallographic orientation, with one of their neighboring grains (Fig.
8b). The pronounced dislocation bowing around the Y-Ti-O particles as seen in Fig. 8c represents a strong
particle-dislocation interaction. The contrast difference around the marked particles (1) and (2) reveals
dislocation pinning at the departure side of the particle (1) and the arrival side of the particle (2). This indicates
dislocation pinning at the particle/matrix interfaces. At this temperature, 9YWT-MATISSE showed no sign of a
phase change.
Fig. 7: TEM bright field images of the 9YWT-MATISSE obtained after tensile tests performed at 25°C (a) and (b), and at 550°C (c); dislocations are mostly bowed due to pinning at the Y-Ti-O nanoparticles (marked) in (b) and (c); distinct differences in microstructures are apparent with the reduction of dislocation density, formation of polygonal grains and dislocation pile-up at the grain boundaries with increase in testing temperature.

MatISSE – D4.12 – revision 0 issued on 1/12/2016
Page 37/45
Fig. 8: (a) TEM bright field image of the 9YWT-MATISSE after tensile test performed at 800°C
showing an equiaxed grain with M23C6 carbides, dislocation pile-up at the grain boundaries,
dislocations pinned at the particle/matrix interfaces and a low angle grain boundary (LAGB); (b) dark
field image taken from the marked reflection g⃗⃗ = {11̅0} (white circle) of the diffraction pattern (inset
(a)) of -Fe oriented close to [100] zone axis shows partially illuminated grain confirming large
deformation close to the grain boundaries, LAGB existence, dislocations structure and carbides
coherent with one of the neighboring grains; (c) high magnification bright field image showing
attractive particle/dislocation interaction (interfacial pinning) from the selected area of (a), the
contrast difference around the particles reveal dislocation pinning at the departure side of the particle
1 and the arrival side of the particle 2.

MatISSE – D4.12 – revision 0 issued on 1/12/2016
Page 38/45
Fig. 9: Temperature dependence of the dimple and particle sizes observed on the fracture surface
and grain sizes observed form the TEM investigations.
3.1.6 Fracture characteristics
The overall view of the fracture surface after the room temperature tensile test is shown in Fig. 10a. This macro
view shows the presence of distinct radial macrocracks propagating parallel to the tensile axis (i.e. along the
extrusion direction). Moreover, fracture protrusions and steps are observed perpendicular to the final magistral
failure (see Fig. 10b). At higher magnification (Fig. 11a), the central region exhibits mostly ductile dimples, with
sizes of 0.48 0.24 µm, resulting from the coalescence of microvoids that appear to nucleate from the second
phase particles (like oxides and carbides). The dimpled fracture surface suggests intragranular crack growth.
Nonetheless, the occurrence of some splitting-related decohesion is also observed (see marked arrows in Fig.
11a).
Similar to the behavior at room temperature, the specimens tested at elevated temperatures display significant
necking at failure; however, no radial cracks are observed (see Fig. 10c). At 500C, the fracture surface forms
with a shear-lip zone at the outer periphery and dimples (0.92 0.24 µm) that are larger and deeper in
comparison to those present at room temperature (c.f. Fig. 11a and b). The temperature dependence of dimple
sizes is shown in Fig. 9. At 650C, the fracture surface reveals two distinct mechanisms of failure. The outer
peripheral region (Fig. 11c) shows a fracture surface with dimples that are large (1.56 0.47 µm) and prominent
(c.f. Fig. 11a-c). Conversely, the central region exhibits dimples that are not discernable and have many small
particles (0.52 ± 0.17 µm) present at their walls (see inset in Fig. 11c). At 800C, minor localized necking of
the specimen is observed (Fig. 10d). The entire fracture surface manifests similar small particles (0.62 ± 0.23
µm), as observed in the central region of the 650°C specimen (Fig. 11d). The temperature dependence of

MatISSE – D4.12 – revision 0 issued on 1/12/2016
Page 39/45
particle sizes is shown in Fig. 9. Interestingly, the particle size matches the average grain sizes at 800°C. The
observation of the specimen (800°C) cut along the loading/extrusion direction revealed development of
microvoids and its coalescence to form cavities (Fig. 12).
Fig. 10: SEM fracture surface images of the tested specimens: At 25°C, macro view (a) shows distinct radial
macrocracks propagating parallel to the tensile axis, and magnified image (b) shows radial cracks along with
fracture protrusion and steps perpendicular to the fracture surface. At 500C, the macro view (c) shows a
shear-lip zone at the outer periphery with no radial cracks. At 800C, the macro view (d) shows the fracture
surface that forms without a shear-lip zone and localized necking.

MatISSE – D4.12 – revision 0 issued on 1/12/2016
Page 40/45
Fig. 11: High magnification SEM fracture surface images of the specimens tested at (a) 25°C, (b) 500°C, (c)
650°C, and (d) 800°C. Increased dimple size with temperature and complete change of fracture mechanism
at 800°C is apparent from the figures.
Fig. 12: Backscattered SEM image of a longitudinal sectioned specimen tested at 800°C. The
microvoids and its coalescence to form cavities are apparent.

MatISSE – D4.12 – revision 0 issued on 1/12/2016
Page 41/45
Discussion of KIT results
It is well understood that the resistance of obstacles to dislocation glide determines the flow stress of alloys.
The complex microstructure of ODS steels offers excellent high-temperature strength due to the favorable
superposition of several important strengthening mechanisms including dislocation forest, grain size (Hall-
Petch effect) and nano-phases (oxide dispersion). However, other strengthening contributors such as solid
solution and internal friction play a minor role. At room temperature, all mechanisms are active and contribute
to the total strength. On the contrary, the temperature dependent microstructural evolution that includes
reduced dislocation density, the transformation of lath structure into equiaxed grains, and carbide coarsening,
results in a loss of strength at elevated temperatures. The coarsening rate is much greater in the vicinity of
PAGBs than within the grains, because of enhanced diffusion along the PAGBs. The M23C6 carbides have the
same crystallographic orientation with one of their neighboring grains. Thus, the carbide possesses a coherent
boundary (low-energy interface) on its matrix side and a high-angle boundary on the other side. Since the high-
angle boundary is more mobile and can provide a high-diffusivity path for carbide-forming atoms, the growth
of the carbide particles is more rapid on the high-angle boundary side. This coarsening does not only abates
solid solution strengthening but also allows transformation of lath structure into equiaxed grains, such as seen
in Fig. 8.
At all temperatures, dislocations appear pinned to the highly stable complex Y-Ti-O particles. At moderate
temperatures, high strength originates from particle-dislocation interaction that is exclusively controlled by
Orowan mechanism, which is repulsive in nature. Pronounced dislocation bowing, as seen in Fig. 8c,
represents a strong particle-dislocation interaction even at high temperatures (800°C). Orowan mechanism
does not support such observations, as at high temperatures the contribution of diffusion phenomenon
increases and the climb by-pass of particles become possible. However, this can be explained by an attractive
interaction called ‘interfacial pinning’ (see Fig. 8c), where a dislocation after overcoming the particle by the
climb is being pinned on the departure side of the oxide particles. Hence, there exists a threshold stress to
detach a dislocation out of this pinning, which must be overcome for the plastic deformation to occur. These
results are in good agreement with the tensile properties observed for the tempered martensitic 9YWT-
MATISSE.
Upon comparing the TM state with the F state, the nano-phases are similar in both cases but the main
difference can be attributed to the dislocation forest and the Hall-Petch effect. As the TM state exhibits a fine
grained microstructure with a high dislocation density, the prominent improvement of strength at room
temperature becomes obvious. However, at elevated temperatures the two states display similar trends of
strength. It appears that the specific microstructure of the martensitic steel induces a low contribution of
dislocations and Hall-Petch effect in strengthening mechanisms. Hence, the advantage of TM state over F
state is neutralized at elevated temperatures.
Fracture surface investigations are done in order to understand the damage mechanism. At room temperature,
the dimpled fracture surface suggests intragranular crack growth that leads to failure. This observation appears
to be an outcome of the deformation mechanism where dislocation activity is homogeneously distributed
across the whole grains. Based on its morphological features, the typical radial cracking was commonly referred
to as ‘‘splitting” or “rosette star-type fracture” that generally forms as a result of grain boundary decohesion. At
elevated temperatures, the fracture surface shows a more ductile deformation with formation of an associated

MatISSE – D4.12 – revision 0 issued on 1/12/2016
Page 42/45
shear-lip zone or cone of the cup-cone fracture, and dimples that are larger and deeper in comparison to those
present at room temperature. The dimple sizes increase with the increase in testing temperature and are larger
than the grain sizes. These observations are further reinforced by increased ductility witnessed at these
temperatures. At 650°C, the first evidence of change in fracture mechanism is observed. This change becomes
fully apparent at 800°C where the entire fracture surface manifests sub-microcrystalline particles. These
particles are not oxides or carbides, as it was confirmed by the EDX investigations. Nonetheless, the fact that
the particle sizes matches with the average grain sizes at the corresponding temperatures (Fig. 9) can lead to
a conclusion that they are sub-microcrystalline grains, which are separated from each other by boundary
decohesion. Thus, a change in fracture mechanism from an intragranular fracture at the lower temperature to
intergranular fracture at higher temperatures is realized. This results in a limited amount of plasticity, which is
associated with a reduced ductility and necking at this temperature.
The modification of the damage mechanism appears to be an outcome of the change in deformation
mechanism. At elevated temperatures a more intense dislocations activity in the form of dislocation pile-up is
noticed at grain boundaries. This indicates that at higher temperatures the deformation localizes at grain
boundaries, which could lead to cavitation and porosities in these areas, and hence a modification of the
damage mechanism too.
Conclusion on KIT experiments
1. The tensile tests were performed at temperatures ranging from 25°C to 800°C. At 25°C, the tempered
martensitic 9YWT-MATISSE exhibits a high yield strength and ultimate tensile strength of 929 and
1052 MPa, respectively. As temperature increases, a decrease in strength is observed, with 156 MPa
of ultimate tensile strength at 800°C. The total elongation-to-failure that was 7.6% at 25°C increases
sharply with increase in temperature and reaches a maximum of 38.4% at 700°C. In order to compare
the influence of heat treatment the tensile tests were also performed on specimens when in a ferritic
state. Interestingly, at elevated temperatures both states present a similar trend of strength and
elongation. In comparison to other commercial, as well as experimental, ODS steels, tempered 9YWT-
MATISSE offers an excellent compromise between strength and ductility.
2. The deformed microstructure at room temperature shows similar characteristics as observed for an
as-received state, but with the dislocations that are bowed out due to pinning at the Y-Ti-O particles.
A modification of the deformation mechanism was observed with the temperature. The dislocation
activity that was homogeneously distributed at room temperature was localized close to the grain
boundaries at elevated temperatures. A strong particle-dislocation interaction was observed at all
testing temperatures. Orowan mechanism is supposed to govern particle-dislocation interaction at
moderate temperatures. At higher temperatures, an attractive particle-dislocation interaction
phenomenon called interfacial pinning was identified. An increase in testing temperature causes
microstructural changes that include reduced dislocation density, the transformation of lath structure
into equiaxed grains, and M23C6 carbide coarsening. Such microstructure evolution or instability is
critical as it results in a loss of mechanical properties and can particularly reduce creep lifetime.

MatISSE – D4.12 – revision 0 issued on 1/12/2016
Page 43/45
3. The fracture surface investigation at room temperature shows ductile dimple tearing with distinct radial
macrocracks propagating parallel to the tensile axis. As temperature increases, the fracture surface
forms with a shear-lip zone at the outer periphery and increased dimple size. These observations
appear associated with the increased ductility. The dimpled fracture surface indicates intragranular
crack growth that leads to failure. The change in fracture mechanism from intragranular to intergranular
fracture at 650°C becomes fully apparent at 800°C, where it is associated with a reduced ductility. The
change in damage mechanism is due to the modification of the deformation mechanism.
Further, in this work deformation mechanisms of ODS steels under cyclic loading are under studies.
Acknowledgements
This work was carried out under the financial support of European atomic energy community (Euratom) 7th
Framework Programme FP7-Fission-2013 for Research and Technological Development under the grant
agreement no. 604862 (MatISSE project) and in the framework of the EERA (European Energy Research
Alliance) Joint Programme on Nuclear Materials. The authors would like to thank warmly Dr. Denis Sornin for
his help in this study and the supply of the material.

MatISSE – D4.12 – revision 0 issued on 1/12/2016
Page 44/45
4 Conclusion
This reports presents the works performed by CEA, CIEAMAT and KIT on the deformation mechanisms of
ODS material. Many results were obtained during the first three years of the Matisse project.
The behavior of Fe-14Cr ODS steels has been analyzed at the grain scale by in-situ TEM deformation
experiments between room temperature and about 650°C. An evolution with temperature of the motion of the
dislocations has been shown. Two domains of temperature have thus been defined.
• At low temperature (between room temperature and about 400°C), mechanisms are clearly
intragranular. Individual dislocations move in a jerky way, by a nano-precipitates pining-unpinning step.
• At higher temperature (from about 400°C to 650°C), intragranular activity is still observed, but thermal
activation of the overcoming of the precipitates happens, as can be deduced from the decrease of the
measured local stress to overcome precipitates. Indeed, in this range of temperature the dislocations move
individually in a more viscous way. Moreover intergranular activity is also detected and noticeable grain
boundary damage is obtained.
• Between these two domains, in some ODS steels, dynamic strain ageing has been identified in the
400-500°C domain, as bursts of dislocations are observable.
To go further, the development of a sample-holder in order to perform ion irradiations using Jannus facility on
samples dedicated to post-irradiation in-situ TEM deformation experiments is under progress at CEA Saclay.
The irradiation behavior could thus be addressed. In the same time a cooperative work between CIEMAT,
CEMES and CEA is under progress in order to complete ODS behavior analysis on high temperature (up to
700°C) and anisotropy. Indeed in TEM in-situ performed experiments, samples cut in the transversal and
longitudinal directions were observed but no evident differences of dislocation moving that would explain
anisotropy of the behavior of HE samples, were observed, supplementary experiments will improve this
analysis.
On Fe-9Cr ODS alloy, tensile tests were performed at temperatures ranging from 25°C to 800°C. At 25°C, the
tempered martensitic 9YWT-MATISSE exhibits a high yield strength and ultimate tensile strength of 929 and
1052 MPa, respectively. As temperature increases, a decrease in strength is observed, with 156 MPa of
ultimate tensile strength at 800°C. The total elongation-to-failure that was 7.6% at 25°C increases sharply with
increase in temperature and reaches a maximum of 38.4% at 700°C. In order to compare the influence of heat
treatment the tensile tests were also performed on specimens when in a ferritic state. Interestingly, at elevated
temperatures both states present a similar trend of strength and elongation. In comparison to other
commercial, as well as experimental, ODS steels, tempered 9YWT-MATISSE offers an excellent compromise
between strength and ductility.
The deformed microstructure at room temperature shows similar characteristics as observed for an as-
received state, but with the dislocations that are bowed out due to pinning at the Y-Ti-O particles. A modification
of the deformation mechanism was observed with the temperature. The dislocation activity that was
homogeneously distributed at room temperature was localized close to the grain boundaries at elevated
temperatures. A strong particle-dislocation interaction was observed at all testing temperatures. Orowan
mechanism is supposed to govern particle-dislocation interaction at moderate temperatures. At higher
temperatures, an attractive particle-dislocation interaction phenomenon called interfacial pinning was

MatISSE – D4.12 – revision 0 issued on 1/12/2016
Page 45/45
identified. An increase in testing temperature causes microstructural changes that include reduced dislocation
density, the transformation of lath structure into equiaxed grains, and M23C6 carbide coarsening. Such
microstructure evolution or instability is critical as it results in a loss of mechanical properties and can
particularly reduce creep lifetime.
The fracture surface investigation at room temperature shows ductile dimple tearing with distinct radial
macrocracks propagating parallel to the tensile axis. As temperature increases, the fracture surface forms with
a shear-lip zone at the outer periphery and increased dimple size. These observations appear associated with
the increased ductility. The dimpled fracture surface indicates intragranular crack growth that leads to failure.
The change in fracture mechanism from intragranular to intergranular fracture at 650°C becomes fully apparent
at 800°C, where it is associated with a reduced ductility. The change in damage mechanism is due to the
modification of the deformation mechanism.