deflection and creep of polyvinyl chloride (pvc) sheet ... · soil resistance and a support or...
TRANSCRIPT

Deflection and Creep of Polyvinyl Chloride (PVC) Sheet Piling
by
Nathan Eric Touchstone
(Under the Direction of Sidney Thompson)
ABSTRACT
Synthetic sheet pile has recently become a significant choice in design of sheet pile
structures. While there is abundant literature concerning PVC as a compound there is little
available concerning its use in a structural capacity. Design assistance is also limited and what
exists is based on traditional steel sheet pile design which does not address issues seen in
viscoelastic materials. Full-scale testing was completed using a series of PVC interlocking sheet
piles. The sheet piles were subjected to loading for a duration of seven days while deflection and
strain were measured. The deflection and strain were compared to theoretical values and
previous laboratory testing. Existing deflection prediction equations for creep deflection tend to
overstate deflection measured while the strain measured in full sheets is less than that of
laboratory testing.
INDEX WORDS: Polyvinyl chloride, PVC, Sheet pile, Synthetic sheet pile, Creep, Sheet
pile testing

Deflection and Creep of Polyvinyl Chloride (PVC) Sheet Piling
by
Nathan Eric Touchstone
B.S.A., The University of Georgia, 1997
B.S.B.E., The University of Georgia, 2002
A Thesis Submitted to the Graduate Faculty of The University of Georgia in Partial Fulfillment
of the Requirements for the Degree
Master of Science
Athens, Georgia
2010

© 2010
Nathan Eric Touchstone
All Rights Reserved

Deflection and Creep of Polyvinyl Chloride (PVC) Sheet Piling
by
Nathan Eric Touchstone
Major Professor: Sidney Thompson
Committee: Tim Foutz
Tom Lawrence
Electronic Version Approved:
Maureen Grasso
Dean of the Graduate School
The University of Georgia
December 2010

iv
DEDICATION
To Karen Siegel Touchstone,
Vicki K. Touchstone and Randall E. Touchstone

v
ACKNOWLEDGEMENTS
The Graduate Committee:
Dr. Tim Foutz, Dr. Tom Lawrence, Dr. Sidney A. Thompson
Major Professor:
Dr. Sidney A. Thompson
Graduate School Coordinator:
Dr. Bill Tollner
Department Head:
Dr. E. Dale Threadgill
Experiment Construction and Execution:
Randall E. Touchstone

vi
TABLE OF CONTENTS
Page
ACKNOWLEDGEMENTS . . . . . . . . . . . . . . . . . . . . . . . . . . . . . . . . . . . . . . . . . . . . . . . . . . . . v
LIST OF TABLES . . . . . . . . . . . . . . . . . . . . . . . . . . . . . . . . . . . . . . . . . . . . . . . . . . . . . . . . . . viii
LIST OF FIGURES . . . . . . . . . . . . . . . . . . . . . . . . . . . . . . . . . . . . . . . . . . . . . . . . . . . . . . . . . . . ix
1.0 Introduction . . . . . . . . . . . . . . . . . . . . . . . . . . . . . . . . . . . . . . . . . . . . . . . . . . . . . . . . . . . . . . 1
2.0 Literature Review . . . . . . . . . . . . . . . . . . . . . . . . . . . . . . . . . . . . . . . . . . . . . . . . . . . . . . . . . 5
2.1 Existing Sheet Pile Design Guidance . . . . . . . . . . . . . . . . . . . . . . . . . . . . . . . . . . . . . 5
2.2 Available PVC Sheet Pile Parts Information . . . . . . . . . . . . . . . . . . . . . . . . . . . . . . . 7
2.3 Polyvinyl Chloride (PVC) Material Behavior . . . . . . . . . . . . . . . . . . . . . . . . . . . . . . 8
2.4 Full-Scale Synthetic Sheet Pile Testing . . . . . . . . . . . . . . . . . . . . . . . . . . . . . . . . . . 13
2.5 Summary . . . . . . . . . . . . . . . . . . . . . . . . . . . . . . . . . . . . . . . . . . . . . . . . . . . . . . . . . . 13
3.0 Objectives . . . . . . . . . . . . . . . . . . . . . . . . . . . . . . . . . . . . . . . . . . . . . . . . . . . . . . . . . . . . . . 15
4.0 Material and Methods . . . . . . . . . . . . . . . . . . . . . . . . . . . . . . . . . . . . . . . . . . . . . . . . . . . . . 16
4.1 Multiple Sheet Frame Design . . . . . . . . . . . . . . . . . . . . . . . . . . . . . . . . . . . . . . . . . . 16
4.2 Single Sheet Frame Design . . . . . . . . . . . . . . . . . . . . . . . . . . . . . . . . . . . . . . . . . . . . 23
4.3 PVC Sheet Pile Selection . . . . . . . . . . . . . . . . . . . . . . . . . . . . . . . . . . . . . . . . . . . . . 27
4.4 Experiment Execution . . . . . . . . . . . . . . . . . . . . . . . . . . . . . . . . . . . . . . . . . . . . . . . . 30
5.0 Results and Discussion . . . . . . . . . . . . . . . . . . . . . . . . . . . . . . . . . . . . . . . . . . . . . . . . . . . . 38
5.1 Deflection of Multi Sheet Pile Testing . . . . . . . . . . . . . . . . . . . . . . . . . . . . . . . . . . . 38
5.2 Deflection of Single Sheet Pile Testing . . . . . . . . . . . . . . . . . . . . . . . . . . . . . . . . . . 54
5.3 Strain Data from Full-Scale Sheet Pile Testing . . . . . . . . . . . . . . . . . . . . . . . . . . . . .58
6.0 Conclusions . . . . . . . . . . . . . . . . . . . . . . . . . . . . . . . . . . . . . . . . . . . . . . . . . . . . . . . . . . . . . .61

vii
7.0 Implications for Further Research . . . . . . . . . . . . . . . . . . . . . . . . . . . . . . . . . . . . . . . . . . . . 64
8.0 References . . . . . . . . . . . . . . . . . . . . . . . . . . . . . . . . . . . . . . . . . . . . . . . . . . . . . . . . . . . . . . .65

viii
LIST OF TABLES
Table 1: Total Strain Data from Bench Testing on Various PVC Samples at 4,000 psi Stress . .12
Table 2: Comparison of Net Deflection for Multi Sheet Testing – Initial Loading. . . . . . . . . . . 49
Table 3: Comparison of Modulus of Elasticity of the Full-Scale PVC Sheet Pile Tests After
Initial Loading and Over Time . . . . . . . . . . . . . . . . . . . . . . . . . . . . . . . . . . . . . . . . . . . . . . . . . . 53
Table 4: Total Strain Comparison of Full-Scale PVC Sheet Pile Testing Versus Bench Testing on
Various PVC Samples . . . . . . . . . . . . . . . . . . . . . . . . . . . . . . . . . . . . . . . . . . . . . . . . . . . . . . . . . 59

ix
LIST OF FIGURES
Figure 1. PVC Macromolecular Structure: (a) At Rest, (b) Under a Load Engaging the
Amorphous Poly Chains and (c) After Rupture of Smaller Crystalline Structures (Alfrey et al,
1948) . . . . . . . . . . . . . . . . . . . . . . . . . . . . . . . . . . . . . . . . . . . . . . . . . . . . . . . . . . . . . . . . . . . . . . 10
Figure 2. Multi Sheet Testing Frame (Frame 1) –Side Diagram . . . . . . . . . . . . . . . . . . . . . . . . . 17
Figure 3. Multi Sheet Testing Frame (Frame 1) – Cross Section Diagram . . . . . . . . . . . . . . . . 18
Figure 4. Constructed Frame 1 Photos: (a) Side View and (b) Cross Section View . . . . . . . . . 19
Figure 5. Multi Sheet Testing Frame (Frame 2) – Side Diagram . . . . . . . . . . . . . . . . . . . . . . . . 20
Figure 6. Multi Sheet Testing Frame (Frame 2) – Cross Section Diagram . . . . . . . . . . . . . . . . 21
Figure 7. Constructed Frame 2 Photos: (a) Side View and (b) Cross Section View . . . . . . . . . 22
Figure 8. Single Sheet Testing Frame –Side Diagram . . . . . . . . . . . . . . . . . . . . . . . . . . . . . . . . . 24
Figure 9. Single Sheet Testing Frame – Cross Section Diagram . . . . . . . . . . . . . . . . . . . . . . . . 25
Figure 10. Constructed Single Sheet Frame Photos: (a) Side View and (b) Cross Section View . .
. . . . . . . . . . . . . . . . . . . . . . . . . . . . . . . . . . . . . . . . . . . . . . . . . . . . . . . . . . . . . . . . . . . . . . . . . . . .26
Figure 11. Everlast ESP 2.1 Vinyl Sheet Pile Part Drawing . . . . . . . . . . . . . . . . . . . . . . . . . . . . 28
Figure 12. Everlast ESP 2.1 Vinyl Sheet Pile Modified Part Drawing Based on Measurements
from Five Different Samples . . . . . . . . . . . . . . . . . . . . . . . . . . . . . . . . . . . . . . . . . . . . . . . . . . . . 29
Figure 13. Multi Sheet Frame Loading Diagram . . . . . . . . . . . . . . . . . . . . . . . . . . . . . . . . . . . . . 32
Figure 14. Multi Sheet Frame (Frame 1) – Five Sheets of ESP 2.1 Sheet Pile – Interlock-in-
Compression – Data Measurement Points: (a) Cross Section View and (b) Side View . . . . . . . 33
Figure 15. Multi Sheet Frame (Frame 2) - Five Sheets of ESP 2.1 Sheet Pile – Interlock-in-
Tension – Data Measurement Points: (a) Cross Section View and (b) Side View . . . . . . . . . . . 34
Figure 16. Single Sheet Frame – Interlock-in-Compression – Data Measurement Points: (a)
Cross Section View and (b) Side View . . . . . . . . . . . . . . . . . . . . . . . . . . . . . . . . . . . . . . . . . . . . 36

x
Figure 17. Incremental Deflection of All Four Multi Sheet Test Series of Vinyl Sheet Pile with
Interlock Placed in Compression – 18” Loading Maximum . . . . . . . . . . . . . . . . . . . . . . . . . . . . 39
Figure 18. Incremental Deflection of All Four Multi Sheet Test Series of Vinyl Sheet Pile with
Interlock Placed in Tension – 18” Loading Maximum . . . . . . . . . . . . . . . . . . . . . . . . . . . . . . . 40
Figure 19. Incremental Deflection of All Four Multi Sheet Test Series of Vinyl Sheet Pile with
Interlock Placed in Compression – 24” Loading Maximum . . . . . . . . . . . . . . . . . . . . . . . . . . . 41
Figure 20. Incremental Deflection for Multi Sheet Test Series – Interlock-in-Compression – 18”
Sand Fill . . . . . . . . . . . . . . . . . . . . . . . . . . . . . . . . . . . . . . . . . . . . . . . . . . . . . . . . . . . . . . . . . . . 42
Figure 21. Incremental Deflection for Multi Sheet Test Series – Interlock-in-Tension – 18” Sand
Fill . . . . . . . . . . . . . . . . . . . . . . . . . . . . . . . . . . . . . . . . . . . . . . . . . . . . . . . . . . . . . . . . . . . . . . . 43
Figure 22. Incremental Deflection for Multi Sheet Test Series – Interlock-in-Tension – 6” Sand
Fill . . . . . . . . . . . . . . . . . . . . . . . . . . . . . . . . . . . . . . . . . . . . . . . . . . . . . . . . . . . . . . . . . . . . . . . 45
Figure 23. Comparison of Average Deflection of PVC Sheet Pile for Interlock-in-Compression
(IIC) and Interlock-in-Tension (IIT) Test for 6”, 12” and 18” Sand Depths . . . . . . . . . . . . . . . 47
Figure 24. Comparison of Initial Deflection for Interlock-in-Tension Test – 1st Series – to
Theoretical Deflection Using a Modulus of Elasticity of 380,000 psi . . . . . . . . . . . . . . . . . . . 50
Figure 25. Comparison of Average Deflection of Interlock-in-Compression Test – 1st Series – to
Theoretical Deflection Using a Modulus of Elasticity of 380,000 psi . . . . . . . . . . . . . . . . . . . . 51
Figure 26. Initial Deflection and Creep Deflection After Loading as Compared to Standard
Theoretical Deflection and Predicted Creep Deflection – 18” Final Loading with Interlock in
Tension . . . . . . . . . . . . . . . . . . . . . . . . . . . . . . . . . . . . . . . . . . . . . . . . . . . . . . . . . . . . . . . . . . . . 55
Figure 27. Initial Deflection and Creep Deflection After Loading as Compared to Standard
Theoretical Deflection and Predicted Creep Deflection – 18” Final Loading with Interlock in
Compression . . . . . . . . . . . . . . . . . . . . . . . . . . . . . . . . . . . . . . . . . . . . . . . . . . . . . . . . . . . . . . . . 56
Figure 28. Initial Deflection and Creep Deflection After Loading as Compared to Standard
Theoretical Deflection and Predicted Creep Deflection – 24” Final Loading with Interlock in
Compression . . . . . . . . . . . . . . . . . . . . . . . . . . . . . . . . . . . . . . . . . . . . . . . . . . . . . . . . . . . . . . . . 57

1
1.0 Introduction
Retaining walls are structures which provide lateral support where conditions disallow
the soil to assume its natural slope. These retaining walls must support the lateral pressure
created by the retained soil. There are many different types of retaining walls, gravity walls,
semi-gravity walls, cantilever walls, counterfort walls and sheet pile walls.
Gravity walls, semi-gravity walls, cantilever walls and counterfort walls are all
considered monolithic walls. These types of walls are constructed from concrete and rely on the
weight of their material to resist the overturning and sliding forces created by the soil. Because
of the size and material required, these structures are usually designed for holding heavy loads.
Sheet pile walls can be used for small and large waterfront structure or to retain soil.
Sheet pile walls are normally designed as either cantilever sheet pile walls or anchored sheet pile
walls. Both types of walls develop most of their resistance by being driven into the soil. The soil
at the toe of the sheets, the passive side, resists the sheet being rotated forward by the soil behind
the sheet, the active side. With a cantilever structure the penetration depth of the sheets
determines the resistance of the sheeting. Anchored sheet pile walls have both the passive side
soil resistance and a support or anchor that secures the upper portion of the sheet in place.
Because the sheeting is only acting as a member to mobilize the resistance of the soil, materials
of less weight and size are required to construct these structures. This also means that, in general,
sheet pile structures will be smaller in height than gravity mass structures.
Sheet pile walls are normally constructed of wood, steel, aluminum, concrete or synthetic
materials such as polyvinyl chloride and fiber-glass materials. In the past century, metallic

2
systems i.e. steel and aluminum were primarily used in the construction of sheet pile walls.
However, Lampo et al. (1998) estimates that deterioration of marine structures (docks, walls,
fendering systems) constructed from timber, steel and aluminum have cost the military and
civilian marine communities approximately $1 billion dollars annually. As with other
infrastructure, sheet pile wall systems have begun to move to the use of synthetic wall materials
to extend the lifespan.
The increased availability, low cost and increased lifespan of the synthetic sheet pile
systems have led to their widespread use in both the government/municipal and private sectors.
The first synthetic sheet pile was introduced over twenty years ago. Since its debut, Everlast
Synthetic Products, one manufacturer of synthetic sheet pile, has amassed total sales of $32.5
million with estimated industry wide sales of over $120 million (DiScenza, 2010). Engineers at
the US Army Corp of Engineers have found that the lighter weight sheet pile can save 30% to
50% of the cost on new installations over traditional steel, concrete or timber materials (Dutta
and Vaidya, 2003). The low weight synthetic materials require no specialized equipment be used
during installation, therefore allowing a decrease in the price per linear foot when installed in the
residential market. This translates into a product that is more affordable for the average
residential property owner.
With its increased use as a structural element, vinyl sheet pile has been at the forefront
for both civil and structural engineers specializing in marine structures and shoring. During the
early days of design and use, standard design methods common place to steel were used to
design synthetic sheet pile wall systems. While the geometric properties of the synthetic wall
materials are similar to steel sheet pile, the material properties are vastly different, not only in
strength but also in stiffness and in impact. Steel sheet pile walls are designed primarily on

3
bending moments while synthetic sheet piles are designed primarily on wall deflection. Until the
mid-90’s both steel and synthetic wall systems used moment calculations as the primary design
factor. However, this technique produced sizable wall deflections in the synthetic walls. While
moments were well within the allowable moment limits, usually based on a factor of safety of
two, deflections were well beyond acceptable limits. This has prompted engineers to refocus the
basis for design of these type of wall systems on deflection.
The increased understanding of the limitations of synthetic sheet pile materials has
allowed for a more comprehensive approach to design but there is still no unifying design
standard to promote responsible design. The viscoelastic nature of PVC adds a new element in
the design approach where considerations of short and long-term deflections are critically
important. While metallic sheet pile will act in a predictable fashion based on traditional theory,
synthetic materials have to contend with the effects of long-term creep and the possible
consequences. However, current design philosophy with PVC sheet pile analyzes the wall
structure based on a single modulus of elasticity (MOE) value thus ignoring any effects of creep.
Van De Kuilen (1999) proposed that long-term deflection effects be taken into account using a
creep deflection factor based on experimentally derived MOEs. The creep deflection factor is the
ratio of MOEdesign life / MOEinitial deflection. This technique results in a smaller design MOE. Because
design is based upon deflection criteria this results in a larger required cross section. However,
this technique has not gained favor within the industry because it might put the design at an
economic disadvantage. No other technique has been suggested that takes into account the long-
term field effects of 1) changing modulus based on load/stress, 2) aging effects and 3) the
behavior of the PVC during cyclic loading.

4
This research is to begin the framework for a comprehensive design scheme for PVC
sheet pile. To this end, the research is to achieve this by: 1) comparing the theoretical deflection
of a simply supported beam composed of multiple vinyl sheet piles to data collected on a loaded
frame of vinyl sheet piles, 2) comparing creep and strain data from laboratory testing on samples
to data collected from the loaded frame tests and 3) calculating the apparent modulus of elasticity
for sheets that have been stressed with varying loads for a time duration.

5
2.0 Literature Review
2.1 Existing Sheet Pile Design Guidance
Steel sheet pile design guides published by both US Steel (1984) and British Steel (1997)
provide methodologies to design sheet pile bulkheads. These methodologies are based on the
calculation of pressure diagrams, moments and shear forces. Traditional methods of calculation
such as Free Earth, Fixed Earth and Rowe’s Moment Reduction are highlighted. The Free Earth
method assumes the lower end of the pile is driven only deep enough to restrain the wall but not
induce large resisting moments at the tip of the sheet. The Fixed Earth method is driven deep
enough into soil to act as a partially built-in beam subject to bending moments. Rowe’s Moment
Reduction Theory assumes that the bending moment in sheet piling decreases with increasing
flexibility of the pile. All three design techniques assume that bending moment controls the
design. In neither guide was there a direct limit or limit equation provided regarding deflection.
In the US Steel manual displacement is discussed as a tool in the calculation of Rowe’s Moment
Reduction but not in direct comparison to a defined limit. The British Steel manual offers several
examples of design calculations for bending moment and required section modulus of sheet pile
but no example of deflection calculations were found. Because both manuals focus almost solely
on moment based design they do not lend themselves well to the design of vinyl sheet pile walls.
The US Army Corp of Engineers (USACOE) Design of Sheet Pile Walls manual (EM
1110-2-2504) (1994) contains a section directly covering deflection but only in generic terms
with no deflection criteria defined. The structural design section primarily focuses on the
calculation and comparison of bending moments and shear. The manual does indicate that PVC

6
and other synthetics are possible design materials and lists multiple ASTM standards that apply
to these type materials. These standards provide the methods of evaluating the structural strength
of the various material options. The manual also contains a section on Special Design
Considerations (Chapter 9) that covers design and/or installation issues inherent to general sheet
pile wall systems and specifically to steel sheet pile. However, items unique only to synthetic
sheet pile systems were not discussed.
The document “Interim Report – General Design Guide: PVC Sheet Pile” (Dutta et al.,
2005), as published by the USACOE’s Cold Regions Research Laboratory, provides some
specific design assistance for PVC sheet pile. While it recognizes that there are currently no
national industry consensus standards on allowable stress or deflection in synthetic sheet pile it
does promote the use of vinyl cell classification as a minimum design standard for the PVC
material used in manufacturing the sheeting. The cell classification system (ASTM D4216-03)
classifies materials using a eight digit code based upon the material’s composition and selected
mechanical and material properties. The minimum property value determines the cell number.
The classification system classifies PVC products according to the following characteristics: 1)
base resin, 2) notched Izod, 3) drop dart test (procedure A), 4) drop dart test (procedure B), 5)
tensile strength, 6) modulus of elasticity, 7) ductility and 8) coefficient of thermal expansion.
This report recommends that PVC sheet pile used in design have a minimum modulus of
elasticity of 377,000 psi. In the cell classification system this would correspond to a value of 3 in
the sixth digit of the cell classification numbering scheme. In this manual, allowable deflection is
held as a critical factor in design but the authors indicate that it is a serviceability limit rather
than a true design criterion. A serviceability limit is interpreted to be a qualitative deflection limit
based on appearance of the sheet pile after installation rather than an absolute predetermined

7
design value. They also state that, because of limitations in design software, deflections may be
overstated and only a software package that can calculate deflections using more complex
methods like Rowe’s Moment Reduction should be used for deflection. They suggest that
deflection from creep in PVC sheet piles can be ignored as a design criteria if the design stress
for moment is kept below 3,200 psi. The report references EM 1110-2-2504 for general design
criteria relating to sheet pile walls.
Three pieces of design related literature are available from Crane Materials International,
a vinyl sheet pile manufacturer (Brown, 2006; Yeats, 2004, 2006). Crane Materials International
(CMI) provides “white papers” on design. These papers describe techniques for design stress
selection, deflection and choosing vinyl sheet piles using section modulus. Brown (2006) agrees
with the use of cell classification system as a method of material property selection and that
deflection from creep can be ignored if the design bending stress is kept below 3,200 psi. Brown
proposed that a factor of safety of two be used on tensile stress and that 5% strain is also set as a
limit for strain failure. Yeats (2004) agrees with the Dutta et al. (2005) that deflection is a
serviceability limit and conventional methods over predict deflection. Traditional design
methods normally used with steel sheet pile selection (i.e. use of moment calculation via an
allowable stress and section modulus) are highlighted by Yeats (2006).
2.2 Available PVC Sheet Pile Parts Information
Based upon a review of design support literature provided by several manufacturers of
synthetic sheet piles (CMI, Everlast Synthetic Products (ESP), Shoreline Plastics and Tidewall)
all manufacturers provided technical data specifications on their product lines noting such
properties as general dimensions, allowable moment, tensile strength, modulus of elasticity,
section modulus and area moment of inertia. There is general agreement between manufacturers
8
that a nominal modulus of elasticity of 380,000 psi should be used in design. They also indicate
that all published design values are nominal values and may vary. This information is generally
found on their respective websites.
2.3 Polyvinyl Chloride (PVC) Material Behavior
PVC is a polymer composed of vinyl monomers with a chlorine atom covalently bonded
to its carbon backbone. A series of these monomers form a “poly” chain. PVC sheet pile is
formed by extruding PVC pellets/powder through a heated die. After extrusion the sheet pile is
cooled to form the rigid sheet pile. As the temperature of the extruded material decreases the
resulting solid is composed of both amorphous and crystalline structures. As with many
polymers, PVC exhibits viscoelastic behavior. Creep is very common with these type of
materials (Carter and Paul, 1991). The crystalline fraction of PVC is approximately 10%, a small
but structurally significant fraction (Kim and Gilbert, 2004).
These crystal structures can be oriented by extrusion. Yarahmadi et al. (2003) determined
that in extruded samples oriented by extrusion that elongation in the longitudinal direction was
twice that of the elongation in the cross sample direction at failure. This effect was almost
nullified when samples were heated to a temperature of 187°C leading to the conclusion these
orthotropic effects are created by the extrusion process.
On the crystalline level loads placed on PVC are carried via two different steps. During
the first step the amorphous polymer chains which connect the crystalline structures straightens
until an initial equilibrium is reached. At this time, the initial bonds between the crystallites and
poly strands in the amorphous areas are taut. During this step some of the smaller crystallites fail.
Under increasing load, more crystallites rupture. The crystallite rupture produces an increase in
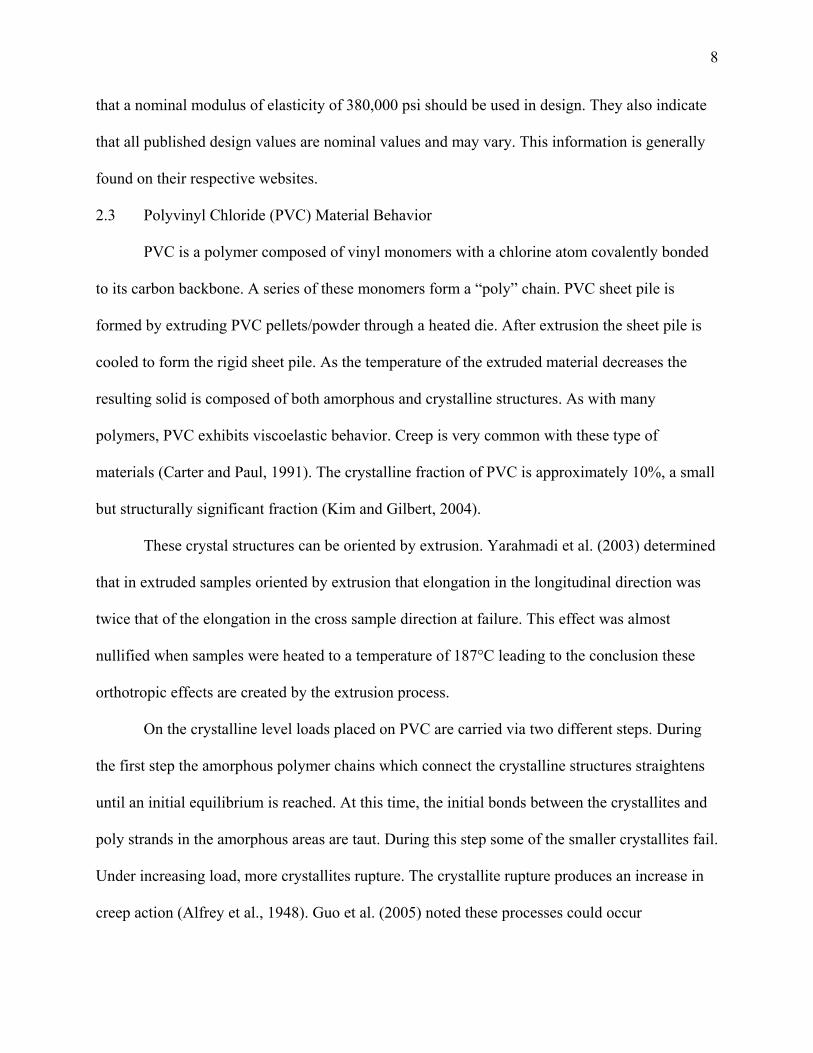
creep action (Alfrey et al., 1948). Guo et al. (2005) noted these processes could occur

9
simultaneously and described them by the following processes: 1.) the time dependence of the
bulk stress-strain relation, 2.) the time dependence of the fracture initiation and 3.) the kinetics of
molecular flow and bond rupture on overstressed polymer chains. These processes are described
graphically in Figure 1.
Many different studies have been conducted on creep in PVC. Alfrey et al. (1948)
allowed PVC films to creep under load. The specimens were loaded, unloaded and then reloaded
at differing time intervals. It was noted that the samples that were allowed to remain unloaded
for the longest interval showed less deflection than samples reloaded immediately after being
unloaded. Findley (1987) conducted creep testing on PVC specimens at 4,000 psi constant stress
for a total of 230,000 hours (approximately 25 years). Using only the data from the first 1900
hrs. of testing the following equation was developed:
e e e e = eeeeo + eeee
+tn (1)
where e is strain, t is time in hours. eeeeo, eeee
+ and n are constants developed based upon testing. This
equation was shown to produce predicted creep values with good agreement to later data
collected between 1,900 hrs. and 230,000 hrs. Van de Kuilen (1999) developed creep factors
using C-Loc vinyl sheet piles. These creep factors were developed for various time intervals
culminating in a 50 year creep factor (kdef) of 2.3. Van de Kuilen proposed that bending
deflection be predicted using the following equation:
ufin = uinst(1+kdef) (2)
where ufin is the final deflection, uinst is the instantaneous deflection after loading and kdef is the
corresponding creep factor.
Northstar, a manufacturer of PVC sheet piling, had creep tests performed by an
independent laboratory on samples taken from mono-extruded PVC sheet pile. This testing was

10
Figure 1. PVC Macromolecular Structure: (a) at rest, (b) under a load engaging the amorphous ploy chains
and (c) after rupture of smaller crystalline structures. (Alfrey et al. 1948)
(c) (b) (a)

11
performed on 0.40” thick material samples under creep loads of 2,667 psi and 4,000 psi for a
duration of 10,000 hrs (SGIa, 2007). They determined total strain at one, 10, 100 and 10,000 hrs
and associated creep rate. Everlast Synthetic Products, another PVC sheet pile manufacturer,
performed similar creep testing with a co-extruded PVC sheet pile product of 0.25” thickness.
The duration of loading and stress levels were the same with one exception of an additional test
specimen creep loaded at 5,000 psi (SGIb, 2007). A summary of these test are shown in Table 1.
The Northstar product showed an increased total stain over the Everlast product through all time
periods. A possible explanation for these differences is that the Northstar product is
manufactured using a mono-extrusion process with recycled vinyl while the Everlast product is
manufactured using co-extrusion process. The observed differences were presumed to be caused
by differences in formulation.
Most vinyl sheet piles have some post-industrial, pre-consumer recycled PVC in its core
substrate. Yarahmadi et al. (2001) tested mechanical properties of unplasticised PVC material
that had previously underwent five extrusions. While the tensile properties of these materials
remained the same over the five extrusions the overall predicted life-expectancy of the samples
decreased to only 47 years after the fifth extrusion, a decrease of approximately 100 years from
that of samples from the first extrusion. Arnold et al. (1996) studied the use of recycled PVC
bottles and the effects produced by introducing recycled materials into the manufacturing
processing i.e use of virgin material versus recycled flake versus recycled powder. Samples
produced using 100% recycled flakes were shown to have significantly lower tensile properties
because of impurities that were introduced by the flake. Samples produced using 100% recycled
powder showed better tensile strength than the flake but slightly lower fatigue resistance than the
virgin material. This would be applicable to PVC sheet pile because the majority of core

12
Source 1 Hr. 10 Hr. 100 Hr. 1000 Hr. 10,000 Hr.
Everlast Vinyl Sheet
(SGI, 2007a)1.48 1.64 1.89 2.23 2.78
Northstar Vinyl Sheet
(SGI, 2007b)1.56 1.77 2.12 2.77 3.45
Table 1 - Total Strain Data from Bench Testing on Various PVC Samples at 4,000 psi Stress
Time Data Measured

13
substrate PVC used in the extrusion of PVC sheet piling comes from recycled material from
internal sources (from reground materials within the same manufacturing plant) and external
sources (from reground materials secured from other vendors such as PVC fencing, PVC
window lentils, PVC siding).
2.4 Full-Scale Synthetic Sheet Pile Testing
Vaidya et al. (2005) conducted four-point bend tests on two interlocked “Z”
configuration vinyl sheet piles. Three sets of sheets were loaded to a limit of 1,327 lbs. over a
span of six feet. An average deflection of 0.12” was observed. A finite element model was
constructed mimicking the test setup and executed. The resulting calculated deflection was
0.15”.
Full-scale testing of fiber-reinforced polymer (FRP) sheet pile has been conducted.
Durability, flexural and shear rigidity and deflection creep have all been analyzed based on full-
scale testing of paired “Z” configuration sheets (Shao and Kouadio, 2002, Giroux and Shao,
2003, and Shao and Shanmugam, 2004). Shao and Shanmugam (2004) found that the creep
model determined by Findley (1987) agreed well with sheet data collected after one year of
loading. Fiber-reinforced polymers are different from the PVC sheet pile because of these
polymers are thermoset polymers. Unlike PVC, a thermoplastic polymer, FRP cannot be
reground and recycled for use in another processing. The glass matrix reinforcing the FRP
sheeting provides significantly greater strength than does the PVC.
2.5 Summary
The review of available literature shows that, from a design perspective, many of the
same techniques used for classical steel sheet pile design have been retained for synthetic sheet
pile design. The use of these designs have been adapted for the smaller moments and loads that

14
the synthetics are capable of carrying. However, this industry still lacks a consensus industry
standard design methodology and there is not a general agreement on addressing specific design
issues using polymers. Even though deflection is recognized as a critical design issue in the use
of polymer sheet piles, it is still seen as a secondary concern to allowable moment for design.
PVC as a general material is a well understood material with significant data driven
models available for comparison to future vinyl testing. However, limited full-scale testing data
of structural PVC members is available. Full-scale testing of FRP sheet pile is more readily
available and includes data on durability and rigidity of these members. However, in the author’s
opinion this data is not applicable to vinyl sheeting.

15
3.0 Objectives
The objective of this study is to evaluate the behavior of vinyl sheet pile in a full-scale
application of loading with particular attention on the deflection and creep behavior of the
sheeting as compared to theoretical and previous bench-scale experimental results. To achieve
this end the following items must be addressed:
1.) Determine the deflection of typical vinyl sheet piling under an initial uniform load and after
a period of time of seven days.
2.) Determine the total strain after 100 hours of loading in vinyl sheet piling at discrete points
and compare these experimental values to existing data.
3.) Apply this information to further the needs for a general industry standard design
methodology.
16
4.0 Materials and Methods
4.1 Multiple Sheet Frame Design
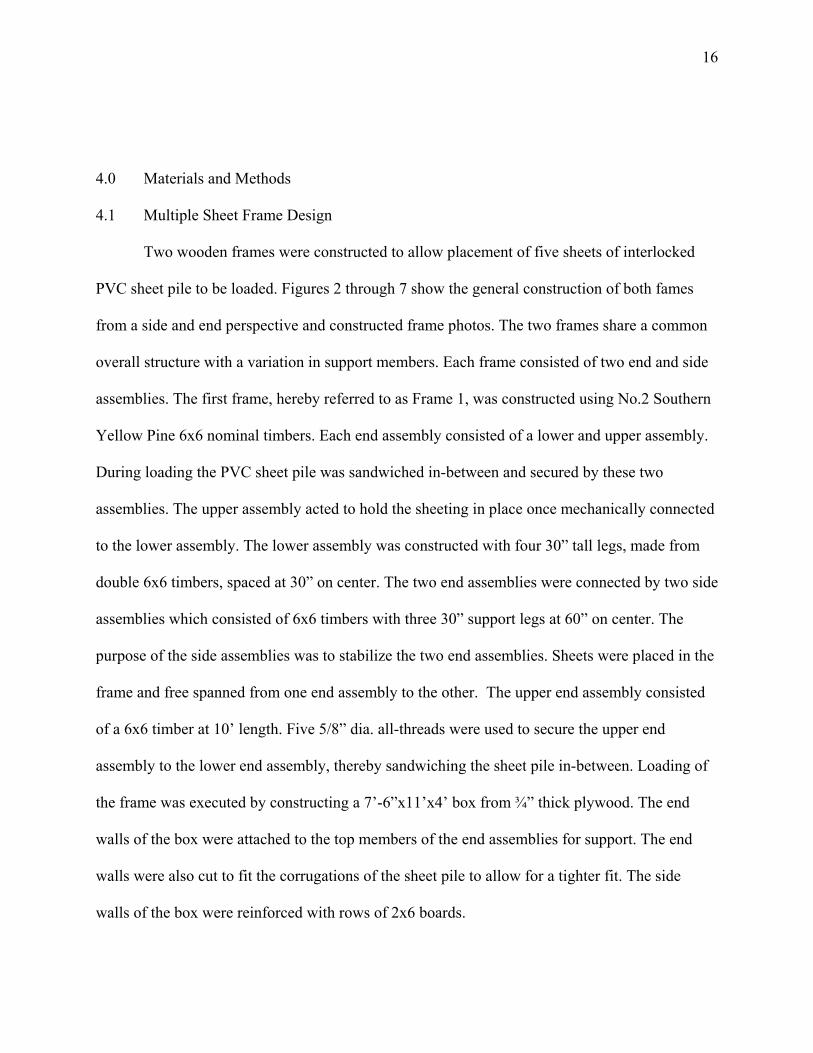
Two wooden frames were constructed to allow placement of five sheets of interlocked
PVC sheet pile to be loaded. Figures 2 through 7 show the general construction of both fames
from a side and end perspective and constructed frame photos. The two frames share a common
overall structure with a variation in support members. Each frame consisted of two end and side
assemblies. The first frame, hereby referred to as Frame 1, was constructed using No.2 Southern
Yellow Pine 6x6 nominal timbers. Each end assembly consisted of a lower and upper assembly.
During loading the PVC sheet pile was sandwiched in-between and secured by these two
assemblies. The upper assembly acted to hold the sheeting in place once mechanically connected
to the lower assembly. The lower assembly was constructed with four 30” tall legs, made from
double 6x6 timbers, spaced at 30” on center. The two end assemblies were connected by two side
assemblies which consisted of 6x6 timbers with three 30” support legs at 60” on center. The
purpose of the side assemblies was to stabilize the two end assemblies. Sheets were placed in the
frame and free spanned from one end assembly to the other. The upper end assembly consisted
of a 6x6 timber at 10’ length. Five 5/8” dia. all-threads were used to secure the upper end
assembly to the lower end assembly, thereby sandwiching the sheet pile in-between. Loading of
the frame was executed by constructing a 7’-6”x11’x4’ box from ¾” thick plywood. The end
walls of the box were attached to the top members of the end assemblies for support. The end
walls were also cut to fit the corrugations of the sheet pile to allow for a tighter fit. The side
walls of the box were reinforced with rows of 2x6 boards.

17
Figure 2. Multi Sheet Testing Frame (Frame 1) – Side Diagram

18
Figure 3. Multi Sheet Testing Frame (Frame 1) – Cross Section Diagram

19
Figure 4. Constructed Frame 1 Photos: (a) Side View and (b) Cross Section View
(b) (a)

20
Figure 5. Multi Sheet Testing Frame (Frame 2) – Side Diagram

21
Figure 6. Multi Sheet Testing Frame (Frame 2) – Cross Section Diagram

22
Figure 7. Constructed Frame 2 Photos: (a) Side View and (b) Cross Section View
(b) (a)

23
The second frame, hereby referred to as Frame 2, was constructed in a similar fashion to
the first frame. For this frame 4x6 nominal timbers were used as the major members. Additional
leg supports were incorporated into the second frame to account for material reduction from the
design of the first frame. The loading box was constructed in a similar manner. However, the
height was only 24”. Both frames clamped the ends of the sheets in a like manner.
Both frames were designed and constructed to hold five sheets to provide an analogous
system to sheet pile installed in the field. Each sheet is connected to the neighboring sheet
through an interlocking system, which acts to brace the neighboring sheet when it experiences
forces trying to move it out of plane. In this test configuration the outer sheets were considered
sacrificial with data collection performed only on the center sheet.
4.2 Single Sheet Frame Design
A single sheet test frame was constructed in a similar manner to that of the multiple sheet
frames. End assemblies were constructed from an upper and lower assembly. The two end
assemblies were connected together by a 2x6 board on each side to act as support. All sections of
the end assemblies were constructed by laminating three sections of No. 2 Southern Yellow Pine
2x6 timbers together. Each end assembly was designed with a base contact area of 30” width and
legs at 24” height. Two ½” dia. all-threads were used to secure the upper end assembly to the
lower end assemblies. The loading box had the outside dimensions of 17”x48”x84” and
constructed from the same plywood as the multi sheet frames. Two rows of 2x6s were applied to
the outside of the box to act as supports. Five 5/8” dia. all-threads were used as through bolts for
each row of 2x6s. Out-of-plane deformation was prevented by using two 2x6s as railing along
the interlocks of the sheets. Figures 8 and 9 are end and side diagrams of the single sheet frame
and Figure 10 is constructed frame photos.

24
Figure 8. Single Sheet Testing Frame – Side Diagram

25
Figure 9. Single Sheet Testing Frame – Cross Section Diagram

26
Figure 10. Constructed Single Sheet Frame Photos: (a) Side View and (b) Cross Section View
(b) (a)
27
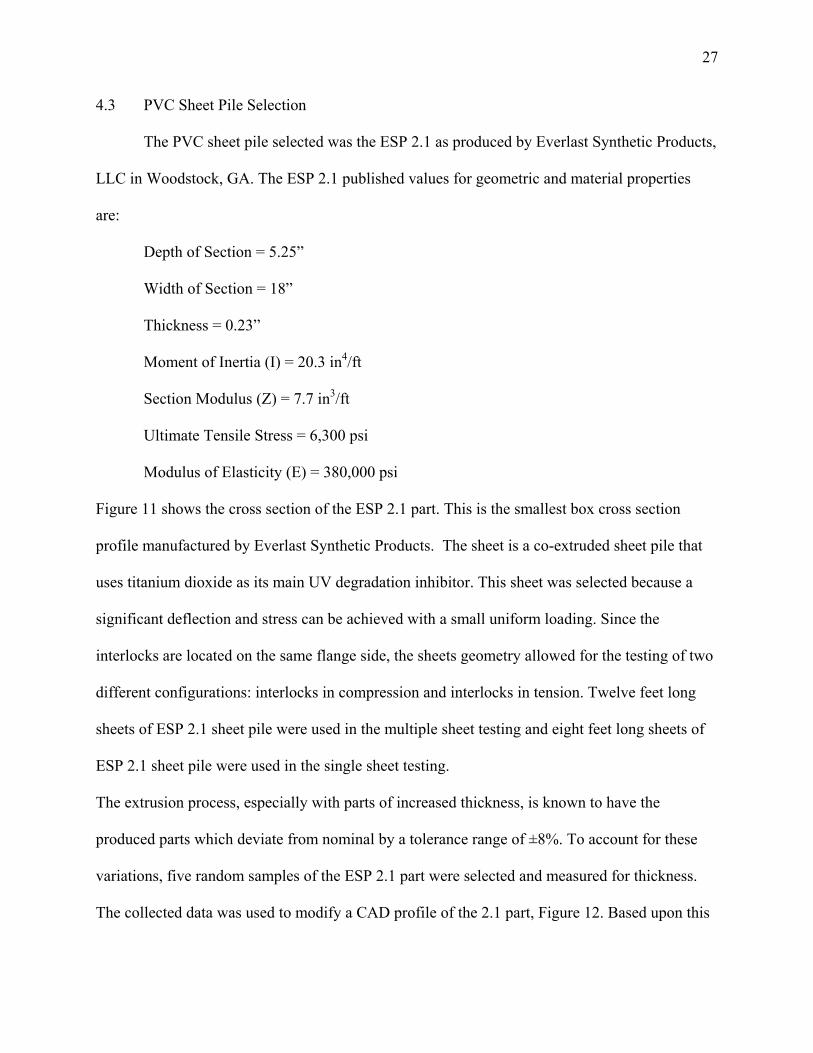
4.3 PVC Sheet Pile Selection
The PVC sheet pile selected was the ESP 2.1 as produced by Everlast Synthetic Products,
LLC in Woodstock, GA. The ESP 2.1 published values for geometric and material properties
are:
Depth of Section = 5.25”
Width of Section = 18”
Thickness = 0.23”
Moment of Inertia (I) = 20.3 in4/ft
Section Modulus (Z) = 7.7 in3/ft
Ultimate Tensile Stress = 6,300 psi
Modulus of Elasticity (E) = 380,000 psi
Figure 11 shows the cross section of the ESP 2.1 part. This is the smallest box cross section
profile manufactured by Everlast Synthetic Products. The sheet is a co-extruded sheet pile that
uses titanium dioxide as its main UV degradation inhibitor. This sheet was selected because a
significant deflection and stress can be achieved with a small uniform loading. Since the
interlocks are located on the same flange side, the sheets geometry allowed for the testing of two
different configurations: interlocks in compression and interlocks in tension. Twelve feet long
sheets of ESP 2.1 sheet pile were used in the multiple sheet testing and eight feet long sheets of
ESP 2.1 sheet pile were used in the single sheet testing.
The extrusion process, especially with parts of increased thickness, is known to have the
produced parts which deviate from nominal by a tolerance range of ±8%. To account for these
variations, five random samples of the ESP 2.1 part were selected and measured for thickness.
The collected data was used to modify a CAD profile of the 2.1 part, Figure 12. Based upon this

28
Figure 11. Everlast ESP 2.1 Vinyl Sheet Pile Part Drawing

29
Figure 12. Everlast ESP 2.1 Vinyl Sheet Pile Modified Part Drawing Based on Measurements from Five
Different Samples

30
CAD drawing, a new moment of inertia of 18.85 in4/ft and section modulus of 7.18 in
3/ft were
calculated and used in all following calculations unless specifically noted.
The sheets used for the 18” and 24” loading tests were produced on July 25, 2010 and
June 13, 2009, respectively. Theoretically there should be no differences between the sheets
manufactured at different times because of quality control procedures.
4.4 Experiment Execution
Three series of tests were performed using the two multi sheet frames. Tests were
conducted at the Bioconversion Research and Education Center, The University of Georgia,
Athens, GA. These tests were separated into overall uniform load and orientation of the interlock
of the sheet pile. Each series of tests consisted of four load on/load off tests. Frame 1 was used
for two series of interlock-in-compression (IIC) tests and Frame 2 was used for one series of
interlock-in-tension (IIT) tests. Loose sand was chosen for the loading medium because of its
ability to conform to the corrugations and it provided a density greater than water. Both Frame 1
and 2 were loaded with sand for seven days in six inch layers up to a depth of 18”. The sand was
loaded and leveled, by hand, to corresponding grade marks. The grade marks were located at six
inch increments on the side of the plywood box. For the 18” IIC and IIT tests, deflection
measurements were made along the sheet immediately after loading ended, then again after
seven days of loading and directly after unloading. Frame 1 was used for a second series of tests
involving the sheeting oriented in a compression configuration and loaded with 24” of sand. For
all three tests the sand was allowed to remain in the loading box for a period of seven days and
then be removed. For the 24” IIC tests, deflection data was collected following each loading, at
100 hrs. load duration, at seven days load duration and directly after unloading at seven days.
Tests were conducted between May and October. Both test fames were located outside under a

31
covered structure. All tests were conducted under warm weather conditions (ambient temperature
> 50ºF). Testing was terminated during the third week of October because of decreasing
temperatures and their possible effects on the sheets’ stiffness. During cold temperatures PVC
looses ductility thereby increasing its brittleness and modulus of elasticity.
It is important to note that the 18” and 24” marks did not designate that the soil depth was
uniform across the panels but was only a grade line to measure against during loading. Based on
the deformation of sheet during loading the actual equivalent load on the sheet pile was a
combined uniform and triangular load (see Figure 13). This increase in load was caused by the
deflections of the sheets during loading of the box.
Sheet deflection was measured at five locations on sheets in Frame 1 (see Figure 14).
These locations were the center point of the center sheet and 11.8” and 23.6” to each side of the
center point along the center sheet’s longitudinal axis. The deflection from Frame 2 was taken at
two lines flanking the central line of the sheet pile on the outer flanges (see Figure 15).
Deflections were measured at the same distance from the center point of the sheets for both the
IIC and IIT tests. Deflections were measured using a Bosch DLR 130 Distance Measurer laser
with an accuracy of ±1/16 in. Strain measurements were taken using a Meda Series 725 6”
electronic caliper. All deflection data was collected as the distance from grade below sheet to a
point on the sheet face. The net distance from the initial distance reading to the next was taken
as the amount of deflection.
Sand was loaded into the plywood box with little to no active compaction. The
compacted bulk density of the sand was determined by placing a steel Winchester bushel known
volume container (AACC Method 55-10.01) at mid-depth of the sand. For tests using 18” of
sand, the container was placed at a depth of approximately nine inches within the sand. When

32
Figure 13. Multi Sheet Frame Loading Diagram

33
Figure 14. Multi Sheet Frame (Frame 1) – Five Sheets of ESP 2.1 Sheet Pile – Interlock-in-Compression –
Data Measurement Points: (a) Cross Section and (b) Side View
(a)
(b)

34
Figure 15. Multi Sheet Frame (Frame 2) – Five Sheets of ESP 2.1 Sheet Pile – Interlock-in-Tension – Data
Measurement Points: (a) Cross Section and (b) Side View
(a)
(b)

35
using 24” of sand, the container was placed as a depth of approximately 12” within the sand. The
Winchester bushel container has a known volume is 2150 in3. The tare weight of the container
was 3.3 lbs. The average compacted bulk density of the sand was determined using this
procedure to be approximately 90 pcf.
In addition to deflection data, strain data was collected on the vinyl sheets when loaded
with 24” of sand for IIC tests. Strains were taken at the centerline of the sheet over gage lengths
of 10”, 20” and 30” lengths. Strain data was collected immediately after loading, at 100 hrs. after
loading and at seven days after loading.
A single sheet test was performed at the residence of the author in Marietta, GA. For this
test a frame was constructed which held only one sheet. The frame was eight feet long and 2.5’
feet wide. A plywood box was once again used to contain sand during loading. The plywood box
containing the sand was 7’ long by 15 inches wide and 4’ tall. The PVC ESP 2.1 sheet pile
(eight feet long and 18” wide) manufactured by Everlast Synthetic Products was again used in
these tests. The sheets were oriented in the frame in a compressive loading configuration (IIC).
The loading box was loaded with a total known weight of 3,780 lb. Based on the dimensions of
the frame and sheet this produced a uniform load of approximately 540 lb/ft on the sheet pile and
a stress of 2667 psi within the sheet. This is the same stress level that Northstar and Everlast
tested “dog-bone” samples of PVC sheet pile in the laboratory and determined total strain values.
Deflection and strain data in the single sheet test was collected using a similar procedure
by measuring the distance from the grade level to the deflected sheet pile. For these tests a
greater density of data points was collected across the face of the sheet. Data was collected at the
locations shown in Figure 16. Five deflection values were collected at each six inch interval from
the center to a distance of 18”. This resulted in a total of 35 data points collected per collection

36
Figure 16. Single Sheet Frame – Interlock-in-Compression – Data Measurement Points: (a) Cross Section
and (b) Side View
(a)
(b)

37
episode. The strain data was taken in groups of three at the center, six inches from center in both
directions and at 12” from center. The strain data was taken over a length determined by two
indentation points at each collection point, over a gauge length of approximately one inch.

38
5.0 Results and Discussion
5.1 Deflection of Multi Sheet Pile Testing
Deflection data from initial loadings were plotted in Figures 17 to 19. It was noted
that with each successive test the deflection increased significantly from the previous test. This
effect was seen in both Frame 1 tests and the Frame 2 test. Incremental deflection samples from a
single series of tests (18” sand) are shown in Figures 20 and 21. The general trend described by
the former figures can also be seen in these individual plots. For each test there was an increase
in deflection over the face of the sheet. This indicates that there is a decline in stiffness of the
sheet after each test. Bending stiffness is the product of modulus of elasticity and moment of
inertia of the bending member. Based upon visual inspection, the general cross sectional
properties of the sheeting appeared to be uncompromised. This would indicate that the decreased
stiffness is a result of a change in the modulus of elasticity of the material with iterative loading.
It is important to note that the sheets returned to within 1/8” of the pre-loading deflection once
the sand was removed and the sheet was allowed to recover over a seven day period.
These patterns of increasing deflection appear to correspond to those predicted by Alfrey et al.
(1948). It is presumed that after the first loading case the sheets experience some engaging of the
amorphous polymer chains of the PVC substrate as described by Alfrey et al. which led to the
initial deflection. Over time it is though that the continuous loading engages the crystalline
structures. The smaller structures would rupture under stress and allow creep deformation to
occur. Once the load is removed the amorphous structure acts to restore the original
conformation of the sheet. The reloading of the sheets (Test J+1) within a relatively short time

39
Figure 17. Incremental Deflection for All Four Multi Sheet Test Series of Vinyl Sheet Pile with Interlock
Placed in Compression - 18" Loading Maximum
0.00
0.50
1.00
1.50
2.00
2.50
3.00
3.50
4.00
4.50
5.00
West 23.6 West 11.8 Center East 11.8 East 23.6
Point of Reading
Deflection (in)
Test 1 Test 2
Test 3 Test 4

40
Figure 18. Incremental Deflection for All Four Multi Sheet Test Series of Vinyl Sheet Pile with Interlock
Placed in Tension - 18" Loading Maximum
0.00
0.50
1.00
1.50
2.00
2.50
3.00
3.50
4.00
4.50
5.00
South 23.6 South 11.8 Center North 11.8 North 23.6
Point of Reading
Deflection (in)
Test 1
Test 2
Test 3
Test 4

41
Figure 19. Incremental Deflection for All Three Multi Sheet Test Series of Vinyl Sheet Pile with
Interlock Placed in Compression - 24" Loading Maximum
0.00
1.00
2.00
3.00
4.00
5.00
6.00
7.00
8.00
West 23.6 West 11.8 Center East 11.8 East 23.6
Point of Reading
Deflection (in)
Test 1 Test 2
Test 3

42
Figure 20. Incremental Deflection for Multi Sheet Test Series - Interlock-in-Compression - 18" Sand Fill
3.00
3.20
3.40
3.60
3.80
4.00
4.20
4.40
4.60
4.80
West 23.6 West 11.8 Center East 11.8 East 23.6
Point of Reading
Deflection (in)
Test 1 Test 3
Test 4

43
Figure 21. Incremental Deflection for Multi Sheet Test Series - Interlock-in-Tension - 18" Sand Fill
2.50
2.70
2.90
3.10
3.30
3.50
3.70
3.90
4.10
4.30
4.50
South 23.6 South 11.8 Center North 11.8 North 23.6
Point of Reading
Deflection (in)
Test 1 Test 2
Test 3 Test 4

44
frame will stress the material beyond the prior deflection (Test J) because of a lack of recovery
time for the crystalline structures.
An exception to this trend of test J+1 providing a larger deflection than test J was
observed during the fourth IIT test in Figure 22 for a 6” loading. In this figure the deflections
measured during test four were less than those measured during test three. A decrease in
deflection of about 10% was observed during test four compared to that of test three. The main
difference between the test three and four of the IIT series was the allotted time of recovery. The
allotted time of recovery is the time between tests in which the sheets are not loaded. Between
IIT tests one, two and three the sheets were allowed to recover for only one week. Because of
scheduling conflicts between tests three and four the sheets were allowed to recover for three
weeks. During recovery, which is believed to be time dependent, it is believed that crystals
which ruptured initially during loading may be reforming. The length of recovery is believed to
have an effect on the amount of reforming which occurs. These results seem to support the idea
that the time between loading (the recovery period) has an effect on the sheet stiffness.
It was also observed that after each test, the sheet piles did not return to their original pre-
test deflection datum but rather retained a no-load deflection of 1/8”. Kim and Gilbert (2004)
proposed that the crystal fraction (10% by volume) has an effect on the structural characteristics
of PVC. Yarahmadi et al. (2003) showed evidence that the PVC crystals are oriented during the
extrusion process. It is believed that during testing we saw evidence of these effects. Much of the
initial recovery is thought to be caused by the release of stress in the amorphous PVC chains.
However, because of possible crystal rupture it is theorized that the sheet cannot return to the
original pre-test deflection.

45
Figure 22. Incremental Deflection for Multi Sheet Test Series - Interlock-in-Tension - 6" Sand Fill
0.40
0.50
0.60
0.70
0.80
0.90
1.00
1.10
1.20
1.30
1.40
South 23.6 South 11.8 Center North 11.8 North 23.6
Point of Reading
Deflection (in)
Test 1 Test 2
Test 3 Test 4

46
It is important to address the shapes of some of the data curves describing deflection for
these tests. In Figures 20 and 21 various tests produced unexpected deflections at the center
points of the curve. For tests two, three and four (Figure 21) the deflection at the center most
point was less than that measured 11.8” from the center. Based on traditional beam theory the
center most point would be the point of maximum deflection. Two major factors have been
identified that affect the measured data points: position of measuring laser on the concrete grade
and rotation of sheet pile in the frame. The base of the laser was rested on the concrete grade to
measure the distance to the sheeting. It was noticed that if the laser was rotated no more than
1/16” a significantly different measurement was observed. The undulations in the concrete grade
which existed could produce such a tilt in the meter if not careful. The sheets themselves were
also capable of slight rotation during loading, thereby resulting in a change in distance from the
concrete floor to the deflected sheet pile. It was observed that during loading a 3/8” vertical
difference was measured between extreme points on the flange of the center sheet pile. Set points
were defined on both the concrete grade and sheet pile to measured deflections of the sheets.
These set points were used during each test and were used to eliminate as much as possible any
variability in measurements caused by user error. Based on the results of these tests, it would be
prudent to advise any future tests be conducted by taking data points across the face of the
sheeting and averaging the numbers to get a more accurate view of how the system is acting
globally. This method was used during the single sheet tests and the results are more indicative
of a traditional beam deflection curve.
It was previously assumed that having the interlock in tension would provide some
benefit in limiting deflection. However, the data does not appear to bear this out. In Figure 23,
are shown the average deflection data from test 1 for both the IIC and IIT series for 6”, 12” and

47
Figure 23. Comparison of Average Deflection of PVC Sheet Pile for Interlock-in-Compression (IIC) and
Interlock-in-Tension (ITT) Test for 6", 12" and 18" Sand Depths
0
0.5
1
1.5
2
2.5
3
3.5
4
4.5
South 23.6 South 11.8 Center
Sand Depth
Deflection (in) Test 1 - IIC Test 2 - IIC
Test 3 - IIC Test 1 - IIT
Test 2 - IIT Test 3 - IIT

48
18” of sand. Each set of deflection curves show little difference between sheets loaded in IIC
versus sheets loaded in IIT.
Current information in the literature indicates that time of exposure to UV radiation
should not affect the material properties of PVC. In Table 2 are shown deflection data for tests in
which a variation in exposure to UV radiation occurred. In Table 2 both of the 18” loading tests
were conducted using PVC manufactured a short time prior to testing while the sheet pile used in
the 24” loading test were manufactured approximately one year prior to testing. During that one
year period the PVC sheet pile was stored outside and exposed to UV radiation. For both the 18”
IIC and IIT tests significantly less deflection was observed during these two tests than those of
the 24” IIC test. During these tests the PVC that had been exposed to UV radiation had, on
average, 30% more deflection than the PVC which had not been exposed to UV radiation. The
only notable differences between these sets of sheets were their production dates and exposure to
UV radiation. Rabinovitch et al. (1993) noted that exposed PVC samples showed little to no
reduction in mechanical properties such as tensile modulus of elasticity. However, this data
appears to show the possibility that UV exposure could have some effects on PVC strength.
Based on this study, too little data exists to make a conclusion about the effects of UV exposure.
For a design methodology to be effective it must accurately predict the behavior of its subject to
within an acceptable range. Figures 24 and 25 compare the average initial deflection to
theoretical calculated deflection curves. Theoretical deflection curves were plotted assuming the
sheets to be simply supported beams with both a uniform load and triangular load, as shown in
Figure 13. The triangular load is caused by the sheets deflecting during loading. The magnitude
of the triangular load was estimated from average deflection in the sheets. Superposition was

49
18" (max.)
Compressive Loading
18" (max.) Tensile
Loading
24" (max.)
Compressive Loading
Produced:
June 13, 2009
6" Loading 0.686 0.678 1.11
12" Loading 1.826 1.946 2.906
18" Loading 3.094 3.544 4.252
Net Deflection (in)
Table 2 - Comparison of Net Deflection for Multi Sheet Testing - Initial Loading
Produced:
July 25, 2010

50
Figure 24. Comparison of Initial Deflection for Interlock-in-Tension Test - 1st Series - to Theoretical
Deflection Using a Modulus of Elasticity of 380,000 psi
0.55
1.05
1.55
2.05
2.55
3.05
3.55
4.05
6" 12" 18"
Point of Reading
Deflection (in)
Test 1
Theoretical
Deflection

51
Figure 25. Comparison of Average Deflection for Interlock-in-Compression Test - 1st Series - to
Theoretical Deflection Using a Modulus of Elasticity of 380,000 psi
0.55
1.05
1.55
2.05
2.55
3.05
3.55
4.05
6" 12" 18"
Point of Reading
Deflection (in)
Test 1
Theoretical
Deflection

52
then used to form an aggregate deflection. The simply supported uniform load deflection
equation is:
D = 5 * w * l4 / 384 * E * I (3)
where w is the magnitude of the uniform load, l is the span length, E is modulus of elasticity and
I is the area moment of inertia. The triangular load deflection equation is:
D = w * l4 / 120 * E * I (4)
where w is the magnitude of triangular load at mid-span, l is the span length, E is modulus of
elasticity and I is the area moment of inertia. An E of 380,000 psi was used for all theoretical
calculations. This value of E is commonly used by the various vinyl sheet pile manufacturers to
predict deflection in these types of wall systems. Both Figures 24 and 25 indicate that the initial
measured deflection was less than the theoretical deflection as predicted by the beam equations.
This would indicate that the actual modulus of elasticity in these sheet piles are greater than
380,000 psi. Under first review, these results support the vinyl sheet pile industry’s use of
380,000 psi as an appropriate initial modulus of elasticity.
Since PVC behaves in a viscoelastic manner it is important to address creep deflection.
This deflection would be caused by the same mechanism that Alfrey et al. (1948) described. To
this end, initial deflection data and deflection after seven days of constant loading from all three
tests on Frame 1 and 2 were compared both graphically and by table. Table 3 shows the
calculated apparent modulus and how it decreases over time. All sheeting showed a significant
reduction in modulus of elasticity over the seven day period with the 24” IIC test having the
lowest modulus of elasticity over time. Van de Kuilen (1999) used laboratory data on C-Loc
PVC sheet piling to develop a reduced modulus of elasticity over time. Based on this data he
indicated a modulus of elasticity of 362,250 psi would be apparent after seven days of loading.

53
Stress in Sheet
(psi)
Initial 7 days Initial 7 days Initial 7 days Initial 4 days
416,000 354,000 355,000 291,000 459,000 352,000 410,000* 324,000
% Change
Modulus Loss per Day
(psi/day)
% Change from 7 day Modulus -
362,250 psi
(Van de Kuilen, 1999)
-10.6
* Assumed from previous full-scale sheet pile compressive testing as to initial modulus of elasticity.
8,857 9,143 15,286 12,286
-2.3 -19.7 -2.8
Calculated Modulus - 1st Test
(psi)
-14.9 -18.0 -23.3
1,515
-21.0
2,780 3,964 2,723
18" Loading - Interlock in
Compression
24" Loading - Interlock in
Compression
18" Loading - Interlock in
Tension
Table 3 - Comparison of Modulus of Elasticity of the Full-Scale PVC Sheet Pile Tests After Initial Loading and Over Time
Single Sheet Loading

54
This modulus of elasticity agrees closely with the modulus of elasticity calculated from the IIC
18” and IIT 18” tests after seven days load duration.
Figures 26 to 28 show the comparison of measured creep deflection from all three multi
sheet tests to the predicted creep deflection calculated by Van de Kuilen’s equation, (2). Using
this equation to determine creep coefficients that modify predicted deflections, the mid-span
deflections after seven days should be 35 to 40 percent larger than the initial deflections. For the
IIC experiments, the seven-day deflections were approximately 20 to 25 percent larger than
initial deflections. For the IIT experiments, Van de Kuilen’s technique would once again predict
a 35 to 40 percent increase in deflection. For the IIT experiments, an increase in deflection of 30
percent was observed over seven days. Van de Kuilen’s creep coefficient is based upon bench
scale lab tests and is not based upon full-scale testing.
5.2 Deflection of Single Sheet Pile Testing
The results of the single-sheet tests were disappointing and seem unreasonable when
compared to either the literature or previous tests. Unlike the multi-sheet tests, the deflections
measured for the single sheets tests were much smaller than expected and act like a wide beam
loaded with a uniform load of 540 lbs/ft. The lack of direct correlation from the load in the
loading box to the predicted deflection of the sheeting was unexpected at the time of initiation of
the test. Based on this data MOE values of almost 800,000 psi were predicted from this data.
These values are almost twice those of values found in the literature and those previously
calculated from the multi-sheet testing. If a MOE value of 410,000 psi is used, which was
calculated in the initial loading in the multi-sheet tests, a uniform load of only 190 lb/ft would
produce the magnitude of deflections measured during these tests. It is believed that during
testing the sand actually behaves in an arch action within the narrow box and instead of loading

55
Figure 26. Initial Deflection and Creep Deflection After Loading as Compared to Standard Theoretical
Deflection and Predicted Creep Deflection - 18" Final Loading with Interlock in Tension
2.40
2.90
3.40
3.90
4.40
4.90
South 23.6 South 11.8 Center North 11.8 North 23.6
Point of Reading
Def
lect
ion (in
)
Initial Deflection
Creep Deflection - 7 Days
Theoretical Deflection -
380,000 psi
Theoretical Deflection - 7
Days (Van de Kuilen, 1999)

56
Figure 27. Initial Deflection and Creep Deflection After Loading as Compared to Standard Theoretical
Deflection and Predicted Creep Deflection - 18" Final Loading with Interlock-in-Compression
3.00
3.50
4.00
4.50
5.00
5.50
West 23.6 West 11.8 Center East 11.8 East 23.6
Point of Reading
Deflection (in)
Initial Deflection
Creep Deflection - 7 Days
Theoretical Deflection -
380,000 psi
Theoretical Deflection - 7
Days (Van de Kuilen, 1999)

57
Figure 28. Initial Deflection and Creep Deflection After Loading as Compared to Standard Theoretical
Deflection and Predicted Creep Deflection - 24" Final Loading with Interlock-in-Compression
4.00
5.00
6.00
7.00
8.00
9.00
10.00
West 23.6 West 11.8 Center East 11.8 East 23.6
Point of Reading
Deflection (in)
Initial Deflection
Creep Deflection - 7 Days
Theoretical Deflection -
380,000 psi
Theoretical Deflection - 7
Days (Van de Kuilen, 1999)

58
the pile the sand is actually loading only the sides of the box. The angularities of the sand
particles allow individual particles to stack against neighboring particles. This results in the
internal angle of friction, the largest angle over which a granular soil can carry a shear load. The
sand particles can only act over a small distance before gravitational forces overcome the friction
force thereby disrupting the internal arch structure. Other than to use this data as a qualitative
instrument for general deflection conformation, all data from this series of tests was excluded
from this thesis.
5.3 Strain Data from Full-Scale Sheet Pile Testing
Experimental strain data, along with bench scale testing on other PVC profiles, are
summarized in Table 4. Full-scale test strains measured after 100 hours of testing and at
approximately 4000 psi stress were compared to those measured by Findley (1987), Northstar
(SGI, 2007a) and Everlast (SGI, 2007b). The strain data from the Northstar and Everlast studies
were based on test results of PVC “dog-bone” samples taken from PVC sheet pile, while Findley
tested strips collected from PVC pipe products. Both the Northstar and Everlast samples were
from PVC sheet pile with thicker profiles than those used in these experiments. The experimental
strain data measured during field testing was larger than that measured by Findley (1987) while
smaller than the strain measured using the sheet pile “dog-bone” samples.
This is possibly explained by the compounding of the individual vinyl substrates. Findley
(1987) used unplasticised PVC in his creep experiments. This would result in a more rigid
compound with less elongation potential. When PVC sheet pile is manufactured, as a general
rule, it is modified by the addition of small faction of plasticizers. These plasticizers act as
impact modifiers to allow a softening of the material which in turn produces a product with
improved handling of impact forces. This could be a plausible reason that the strains from the

59
Table 4 - Total Strain Comparison of Full-Scale PVC Sheet Pile
Testing Versus Bench Testing on Various PVC Samples
Source Stress
(psi)
Total Strain @
100hrs
(%)
3,964 1st
Test 1.42
3,940 2nd
Test 1.24
Experimental Strain
24" Loading
3,999 3rd
Test 1.29
Northstar Vinyl Sheet
(SGI, 2007) 4,000 2.12
Everlast Vinyl Sheet
(SGI, 2007) 4,000 1.89
Findley, 1987 4,000 0.997

60
sheet pile samples are larger. Also, the Northstar product was a mono-extruded product that used
a higher fraction of recycled materials in its construction. Based on Arnold et al. (1996)
impurities can have an effect on product strength and ductility. The differences between the
“dog-bone” samples and the full-sheet piles could also be caused by geometric differences. The
“dog-bone” samples are a sheet while the sheet pile has a “folded” geometry. This geometric
difference is thought to contribute smaller strains.
While strain data was collected during the single sheet tests, these results of these tests
were considered invalid because of the erratic fluctuations in strain measurements.

61
6.0 Conclusions
This project was initiated as a first step to gain better insight into the behavior of
polyvinyl chloride sheet pile as a system and eventually apply these results to develop a design
methodology that would include issues inherent to synthetic materials. The literature was
reviewed to develop an understanding of what design systems were currently being utilized as
well as the material properties of polyvinyl chloride materials. Experiments were conducted to
determine how the sheeting acts under a controlled loading situation and what deflections would
occur over time. The tests centered on the overall deflection of the sheets and the accompanying
strain.
Based on current literature, design methods for synthetic sheet pile are largely borrowed
from steel sheet pile design, but some headway has been made in address issues relevant only to
viscoelastic materials. This is largely accomplished by setting a maximum limit to the allowable
bending design stress to preclude any significant creep effect occurring within the material. It is
also recommended that a minimum stress approach, via cell classification, be used. The cell
classification system provides designers with nominal design values for each stress conditions.
While this approach can be used in material selection it does preclude manufacturers from testing
products and ensuring that this nominal stresses are met. PVC is a well studied material and its
mechanics under varying load and time are significantly documented. Descriptions of the
macromolecular structure of PVC were available as were data on the creep functions of the
material. However, most of the information found on PVC does not involve testing of these
materials when used as a structural shape.

62
The experimental data was shown to agree with conventional theory of PVC mechanics
in relation to creep deflection and recovery. As the time frame between testing was allowed to
increase (increase in recovery time) an increase in the rigidity of the sheet pile was observed.
For these tests the application of a creep deflection coefficient calculated by Van de Kuilen
(1999) predicted larger deflection that those measured during these experiments.
Based on these tests it is not apparent that one orientation of the interlocks should be
preferred over another. Positioning the interlock in compression was not an advantage over
positioning the interlock in tension. It was previously assumed that having the interlock in
tension provided some benefit in limiting deflections. However, the data does not bear this out.
Strains measured during full-sheet testing of the PVC sheet piles were greater than those
previously measured by Findley (1987). Findley’s collected strain data on samples of
unplasticized PVC. The sheets used in these experiments contain small amounts of plasticizers
(<2%). These additives tend to make the sheets more impact resistant which in turn increases the
ductility of the sheets and the ability of the sheets to stretch. Everlast has tested PVC samples,
cut from PVC sheet piles, at a commercial testing lab to determine total strain over time. The
samples used by the test lab were a “dog-bone” shape cut from the pile. The experimental strain
data from these experiments, for tests using the entire sheet pile, were smaller than those
measured by the testing laboratory. While variations in formulation could be once cause for this
difference, geometric differences could also be the cause of these differences. The sheet pile has
a folded geometry and is not one long flat sheet.
In general, this project has provided further data to compare against know values and
equations. These items may be incorporated into a design methodology in future iterations but

63
further testing should be undertaken to gain a more complete data set in relation to various
stresses, conformations of sheeting and longer time duration.

64
7.0 Implications for Future Research
The construction of a design methodology for synthetic sheet pile based on addressing
the viscoelastic nature of polymers will require more extensive research and field verification.
The most direct areas that should be investigated are:
1. Creep deflection at operational stresses and extreme stresses for longer periods of
time (one year and greater)
2. Changes in geometry of sheet under operational and extreme stresses
3. Suitable forensic tools that can be used during after-failure analysis
4. Deflection of synthetic sheet pile in the field for model verification
5. Reception by industry and associated engineering support
The models used for many of these efforts will need to be empirically determined. This will
require significant amounts of data on deflection, creep deflection and apparent modulus of
elasticity be made. The experiments in this study should be repeated for data verification and
further experiments with a variety of synthetic sheeting should be undertaken to develop a
industry-supported consensus design process.
These efforts should be put forth to the synthetic sheet pile industry to gain as much
support as possible. With such a diversity of sheet geometries and company specific PVC
compounds, only an industry wide program has the hopes of establishing national criteria for the
design with synthetic sheet pile.

65
8.0 References
Alfrey, Jr., Turner, Norman Wiederhorn, Richard Stein and Arthur Tobolsky (1948). “Some
Studies of Plasticized Polyvinyl Chloride.” Annual Meeting of the Society of Rheology, New
York: pp. 211-227.
Arnold, J.C., B. Maund and D.H. Isaac. (1996). “The Mechanical Properties of Recycled PVC
Bottle Compounds.” Journal of Material Processing Technology. 56: pp. 475-481.
British Steel. (1997). Piling Handbook. 7th Ed.
Brown, Ben. (2006). “Design Stress for Vinyl Sheet Pile.” Technical White Paper. Crane
Materials International.
Carter, Giles F., and Donald E. Paul. (1991). Materials Science & Engineering. ASM
International.
DiScenza, Paige. (29 October 2010). Personal Interview.
Dutta, Piyush K., and Uday Vaidya. (2003). “A Study of the Long-Term Applications of Vinyl
Sheet Piles.” ERDC/CRREL Letter Report. US Army Corp of Engineers.
Dutta, Piyush K., Leonard J. Zabilansky, Thomas Wade Wright, Charles Brandstetter and John
C. Bivona, Jr. (2005). “General Design Guide: PVC Sheet Pile.” ERDC/CRREL Interim Report.
US Army Corp of Engineers.
Findley, William Nichols. (1987). “26-Year Creep and Recovery of Poly(Vinyl Chloride) and
Polyethylene.” Polymer Engineering and Science. 27(8): pp. 582-585.
Giroux, Cynthia, and Yixin Shao. (2003). “Flexural and Shear Rigidity of Composite Sheet
Pile.” Journal of Composites for Construction. 7(4): pp.348-355.
Guo, Yi-Chong, Chun-Ling Xin, Ming-Shi Song, and Ya-Dong He. (2005). “Study on Short- and
Long-Term Creep Behavior of Plastics Geogrid.” Polymer Testing. 24: pp. 793-798.
Kim, Hwan C., and Marianne Gilbert. (2004). “Characterisation and Properties of Oriented PVC
Fibres.” Polymer. 45: pp. 7293-7301.
Lampo, Richard, Thomas Nosker, Doug Barno, John Busel, Ali Maher, Piyush Dutta, and Robert
Odello. (1998). “Development and Demonstration of FRP Composite Fender, Loadbearing, and
Sheet Piling Systems.” USACERL Technical Report 98/123. US Army Corp of Engineers.

66
Rabinovitch, E.B., J.W. Summers, and W.E. Northcott. (1993). “The Changes in Properties of
Rigid PVC During Weathering.” The Journal of Vinyl Technology. 15(4): pp.126-130.
SGI Testing Services, LLC. (2007). “Everlast Synthetic Products, LLC. Unconfined Tension
Creep (ASTM D 5262).” Testing Report SGI 5043.
SGI Testing Services, LLC. (2007). “Northstar Vinyl Products, LLC. Unconfined Tension Creep
(ASTM D 5262).” Testing Report SGI 3004.
Shao, Yixin, and Serge Kouadio. (2002). “Durability of Fiberglass Composite Sheet Piles in
Water.” Journal of Composites for Construction. 6(4): pp. 280-287.
Shao, Yixin, and Jayasiri Shanmugam. (2004). “Deflection Creep of Pultruded Composite Sheet
Piling.” Journal of Composites for Construction. 8(5): pp. 471-479.
US Steel. (1984). Steel Sheet Piling Design Manual.
US Army Corp of Engineers. (1994). “Design of Sheet Pile Walls.” Engineer Manual EM 1110-
2-2504.
Vaidya, Uday K., Adolfo A. Villalobos, Juan C. Serrano-Perez, and Piyush K. Dutta. (2005).
“Design and Analysis of Polyvinyl Chloride Sheetpiles for Waterfront Construction.” SAMPE
Conference, Long Beach.
Van de Kuilen, W.G. (1999). “Determination of Mechanical Properties of C-Loc Sheet Piles and
Derivation of Design Values.” TNO Report 1999-CON-LBC-R7015.
Yarahmadi, Nazdaneh, Ignacy Jakubowicz, and Thomas Gevert. (2001). “Effects of Repeated
Extrusion on the Properties and Durability of Rigid PVC Scrap.” Polymer Degradation and
Stability. 73: pp. 93-99.
Yarahmadi, Nazdaneh, Ignacy Jakubowicz, and Thomas Hjertberg. (2003). “The Effects of Heat
Treatment and Ageing on the Mechanical Properties of Rigid PVC.” Polymer Degradation and
Stability. 82: pp. 59-72.
Yeats, Michael. (2004). “Deflection of Vinyl Sheet Pile.” Technical White Paper. Crane
Materials International.
Yeats, Michael. (2006). “Using Section Modulus to Select and Compare Vinyl Sheet Piling.”
Technical White Paper. Crane Materials International.