defining and measuring high technology in...
TRANSCRIPT

DEFINING AND MEASURING HIGH TECHNOLOGY IN GEORGIA Susan M. Walcott
FRP Report No. 50 December 2000


Defining and Measuring High Technology in Georgia
1
“Firms that are engaged in the design, development, and introduction of new
products and innovative manufacturing processes, or both, through the
systematic application of scientific and technical knowledge.”
Definition of high technology firms, Congressional Office of Technology
Assessment
Introduction
The purpose of this study is to define and measure technology activity in
Georgia in order assist in the targeting, attracting, and retaining of technology-
intensive jobs for the state. “High technology” jobs generally receive credit for
increasing the number of related jobs due their high pay, high impact multipliers from
purchases of goods and services in non-high tech sectors, propensity to cluster while
attracting related supply chain companies, and counter cyclical innovation push
(Malecki 1998, Walcott 1999). However, there often exists limited understanding of
and no agreement as to either the basis for the high technology label or the types of
jobs encompassed. Exercises in defining “high technology” consistently prove less
than definitive. Georgia’s exploration of the definition and scope of high-tech activity
in the state began with general formulations, such as J. K. Galbraith’s often cited
observations that “technology is the systematic application of scientific or other
organized knowledge to practical tasks.”
Defining the term “high technology” comprised the first and basic step for
this study. The next step applied the resulting definition to a range of industries in
order to identify high technology industries classified according to their Standard
Industrial Classification (SIC) code, as is the generally accepted practice. Although
the North American Industrial Codes (NAIC) provide more detailed divisions of
technology intensive and service category industries, this system is not yet widely
adopted.
The third step involved determining the number of establishments and
employees in the identified high technology industries within the state of Georgia.
Policy applications flow from analyzing the type of jobs involved and their growth
pattern, and targeting job categories reflecting underlying Georgia technology
strengths.
Defining and Measuring High Technology in Georgia
2
Methodology
A multiplicity of definitions currently exists among the various states and
organizations that attempt to describe and apply technology-related measures to job
or industry classifications. This study compiled and cross-referenced many of these
current efforts by communicating with officials in a number of states, reviewing
reports in major journals and government agencies, and documenting efforts from
Europe (OECD) and Japan (MITI). The appendix provides a summary of some of the
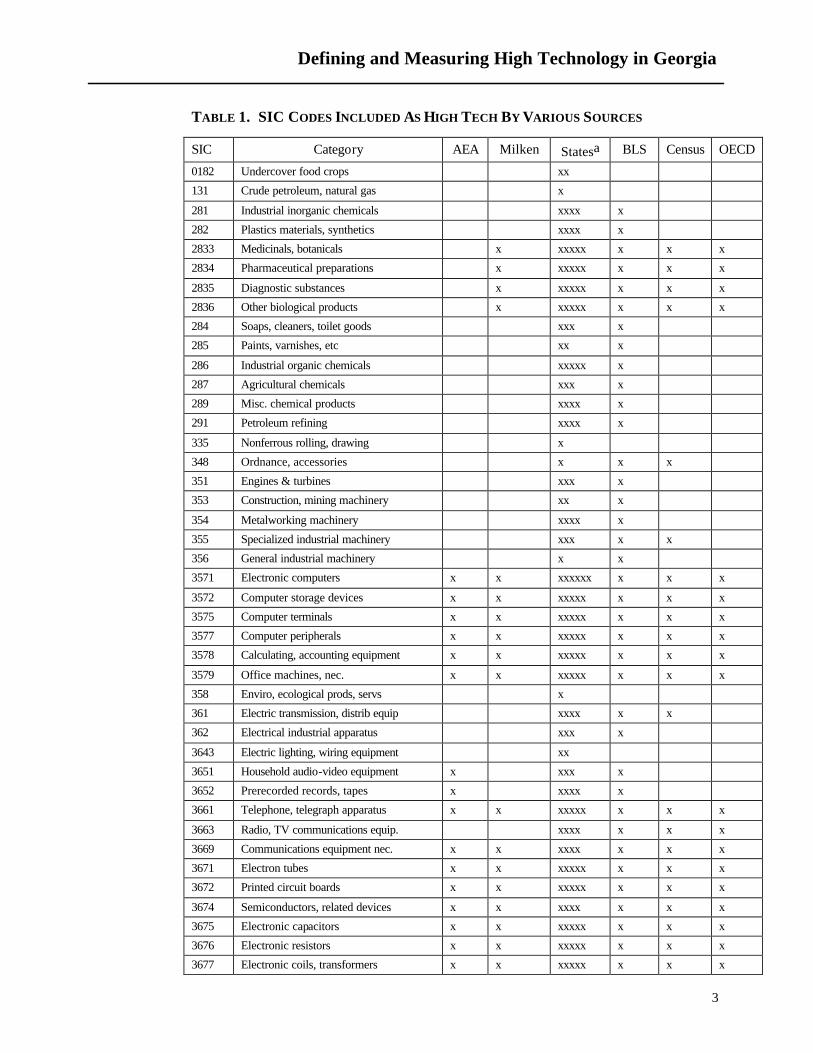
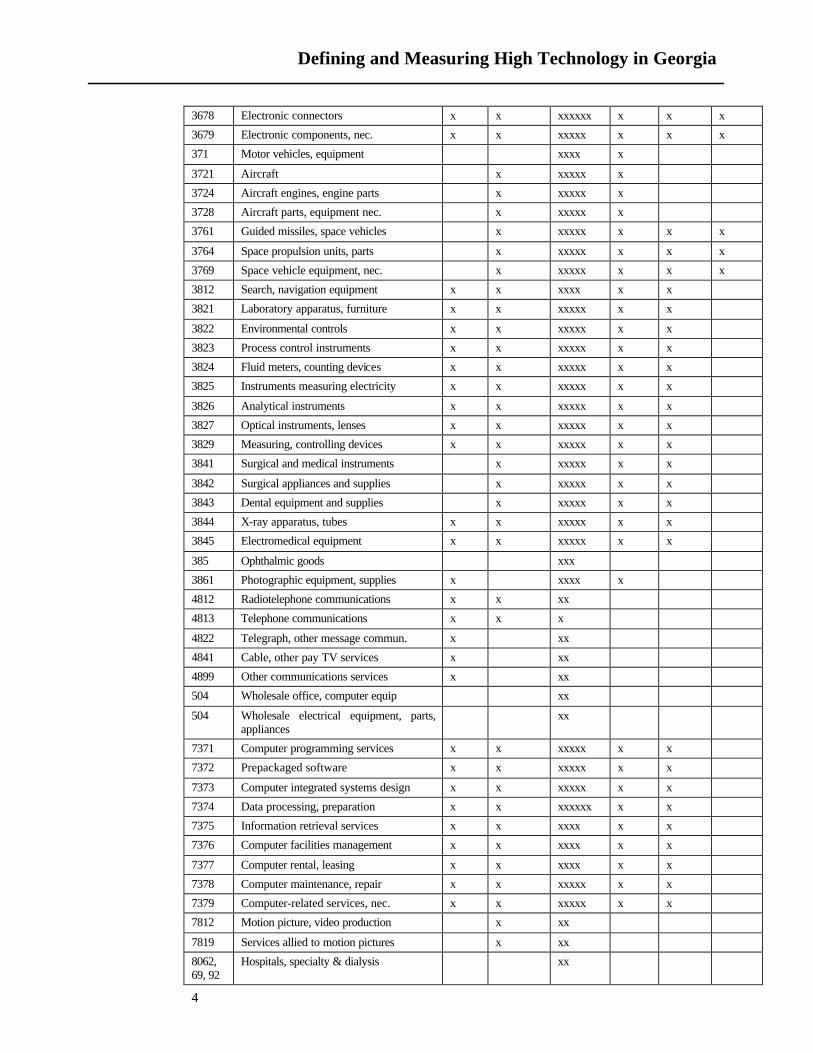
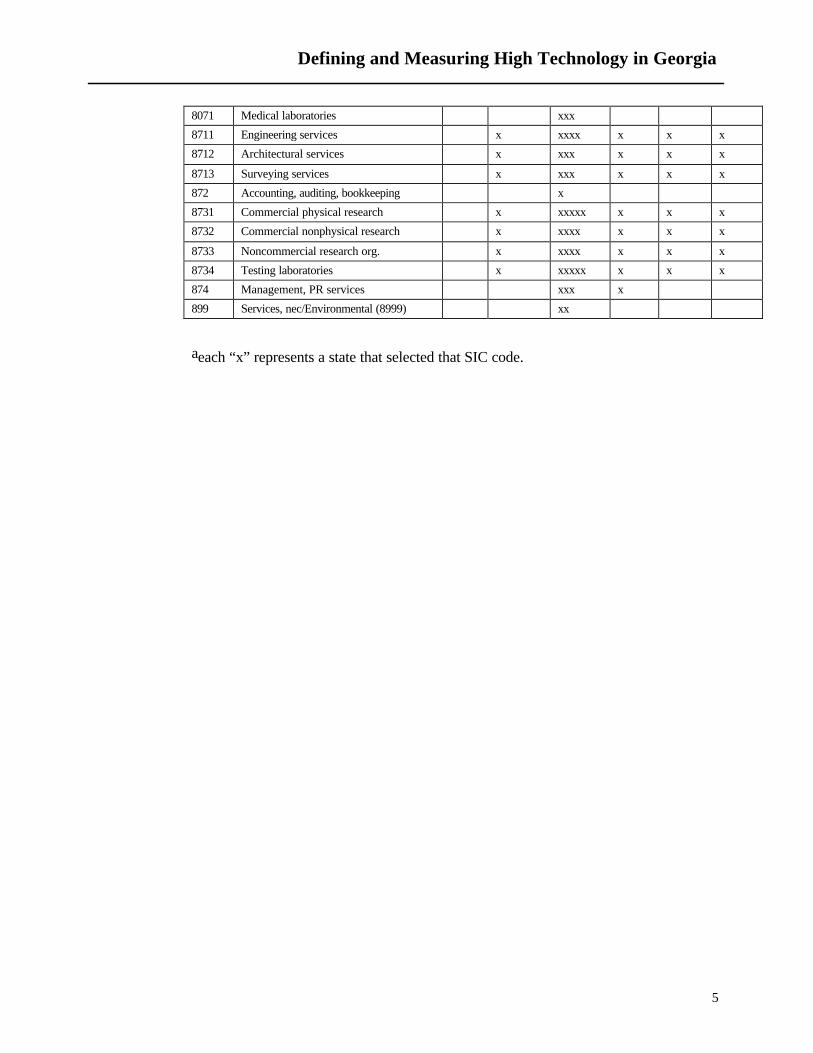
approaches used in these efforts, while Table 1 indicates the SIC codes included as
high technology by the various sources we identified.
Table 1 notes the SIC codes used by the Milken Institute in their study of “High
Tech America” (DeVol 1999), and by the American Electronics Association (2000),
whose often cited SIC code grouping has also received frequent criticism for being
too narrow in scope (particularly in omitting life science related sectors). The Bureau
of Labor Statistics recently recast its definition developed earlier in the decade
(Hadlock, et al. 1991, Lyons and Luker 1996, Hecker 1999). The Bureau of the
Census, another arm of the government involved in compiling statistics, also weighed
in with yet another list of high tech SIC codes, which is smaller than the list
maintained by the Bureau of Labor Statistics. Clearly, an accepted definition at the
federal level remains elusive (Luker and Lyons 1997).
Definitions used by some 15 states were also gathered, and individuals in those
states were asked to supply the rationale for these choices (Appendix). Not
surprisingly, SIC codes captured by the states were much broader in total than any
other organizational list. Justifications for the respective lists of SIC codes largely
reflected process-based explanations, or the frank admission that such activities were
included because they represented a significant proportion of the state labor base.
Examples of the latter include crude petroleum and natural gas operations in Texas
and automobile-related codes in Michigan. Several states composed clusters of
industries, and captured SIC codes involved in each cluster. Examples of states
adopting this approach include Pennsylvania (particularly Pittsburgh, which worked
out six “technology clusters”), New Mexico with nine clusters, and South Carolina
with five clusters.
Defining and Measuring High Technology in Georgia
3
TABLE 1. SIC CODES INCLUDED AS HIGH TECH BY VARIOUS SOURCES
SIC Category AEA Milken Statesa BLS Census OECD
0182 Undercover food crops xx
131 Crude petroleum, natural gas x
281 Industrial inorganic chemicals xxxx x
282 Plastics materials, synthetics xxxx x
2833 Medicinals, botanicals x xxxxx x x x
2834 Pharmaceutical preparations x xxxxx x x x
2835 Diagnostic substances x xxxxx x x x
2836 Other biological products x xxxxx x x x
284 Soaps, cleaners, toilet goods xxx x
285 Paints, varnishes, etc xx x
286 Industrial organic chemicals xxxxx x
287 Agricultural chemicals xxx x
289 Misc. chemical products xxxx x
291 Petroleum refining xxxx x
335 Nonferrous rolling, drawing x
348 Ordnance, accessories x x x
351 Engines & turbines xxx x
353 Construction, mining machinery xx x
354 Metalworking machinery xxxx x
355 Specialized industrial machinery xxx x x
356 General industrial machinery x x
3571 Electronic computers x x xxxxxx x x x
3572 Computer storage devices x x xxxxx x x x
3575 Computer terminals x x xxxxx x x x
3577 Computer peripherals x x xxxxx x x x
3578 Calculating, accounting equipment x x xxxxx x x x
3579 Office machines, nec. x x xxxxx x x x
358 Enviro, ecological prods, servs x
361 Electric transmission, distrib equip xxxx x x
362 Electrical industrial apparatus xxx x
3643 Electric lighting, wiring equipment xx
3651 Household audio-video equipment x xxx x
3652 Prerecorded records, tapes x xxxx x
3661 Telephone, telegraph apparatus x x xxxxx x x x
3663 Radio, TV communications equip. xxxx x x x
3669 Communications equipment nec. x x xxxx x x x
3671 Electron tubes x x xxxxx x x x
3672 Printed circuit boards x x xxxxx x x x
3674 Semiconductors, related devices x x xxxx x x x
3675 Electronic capacitors x x xxxxx x x x
3676 Electronic resistors x x xxxxx x x x
3677 Electronic coils, transformers x x xxxxx x x x
Defining and Measuring High Technology in Georgia
4
3678 Electronic connectors x x xxxxxx x x x
3679 Electronic components, nec. x x xxxxx x x x
371 Motor vehicles, equipment xxxx x
3721 Aircraft x xxxxx x
3724 Aircraft engines, engine parts x xxxxx x
3728 Aircraft parts, equipment nec. x xxxxx x
3761 Guided missiles, space vehicles x xxxxx x x x
3764 Space propulsion units, parts x xxxxx x x x
3769 Space vehicle equipment, nec. x xxxxx x x x
3812 Search, navigation equipment x x xxxx x x
3821 Laboratory apparatus, furniture x x xxxxx x x
3822 Environmental controls x x xxxxx x x
3823 Process control instruments x x xxxxx x x
3824 Fluid meters, counting devices x x xxxxx x x
3825 Instruments measuring electricity x x xxxxx x x
3826 Analytical instruments x x xxxxx x x
3827 Optical instruments, lenses x x xxxxx x x
3829 Measuring, controlling devices x x xxxxx x x
3841 Surgical and medical instruments x xxxxx x x
3842 Surgical appliances and supplies x xxxxx x x
3843 Dental equipment and supplies x xxxxx x x
3844 X-ray apparatus, tubes x x xxxxx x x
3845 Electromedical equipment x x xxxxx x x
385 Ophthalmic goods xxx
3861 Photographic equipment, supplies x xxxx x
4812 Radiotelephone communications x x xx
4813 Telephone communications x x x
4822 Telegraph, other message commun. x xx
4841 Cable, other pay TV services x xx
4899 Other communications services x xx
504 Wholesale office, computer equip xx
504 Wholesale electrical equipment, parts, appliances
xx
7371 Computer programming services x x xxxxx x x
7372 Prepackaged software x x xxxxx x x
7373 Computer integrated systems design x x xxxxx x x
7374 Data processing, preparation x x xxxxxx x x
7375 Information retrieval services x x xxxx x x
7376 Computer facilities management x x xxxx x x
7377 Computer rental, leasing x x xxxx x x
7378 Computer maintenance, repair x x xxxxx x x
7379 Computer-related services, nec. x x xxxxx x x
7812 Motion picture, video production x xx
7819 Services allied to motion pictures x xx
8062, 69, 92
Hospitals, specialty & dialysis xx
Defining and Measuring High Technology in Georgia
5
8071 Medical laboratories xxx
8711 Engineering services x xxxx x x x
8712 Architectural services x xxx x x x
8713 Surveying services x xxx x x x
872 Accounting, auditing, bookkeeping x
8731 Commercial physical research x xxxxx x x x
8732 Commercial nonphysical research x xxxx x x x
8733 Noncommercial research org. x xxxx x x x
8734 Testing laboratories x xxxxx x x x
874 Management, PR services xxx x
899 Services, nec/Environmental (8999) xx
aeach “x” represents a state that selected that SIC code.

Defining and Measuring High Technology in Georgia
6
Several entities favored yet other different approaches, such as the one
adopted by the Bureau of the Census based on ten products or processes considered
“new or leading edge technologies.” North Carolina included a set of SIC codes
identified by the National Science Foundation’s small business office as “fast-
growing” industries, in addition to specifically technology-infused industries.
In addition to reviewing these approaches, we met with an Advisory Panel of
Georgians1 involved in economic development and interested in the issue of
measuring high technology in order to understand the role of technology in Georgia’s
economy and the uses of a good definition for policy application. Several state
agencies are involved in looking at technology employment issues. Applications of
this present study may therefore provide a common definition for all state efforts, and
broaden the scope of participants in arriving at the most useful definition based on
real-world applications.
1The Panel included representatives from the Georgia Research Alliance, the State Office of Planning and Budget, Metro Atlanta Chamber of Commerce, the Economic Development Institute at the Georgia Institute of Technology, Department of Industry, Trade and Tourism, the Yamacraw Project, the Board of Regents of the University System, Technical and Adult Education, the Georgia Economic Developers Association, and the Georgia Department of Labor.
Defining and Measuring High Technology in Georgia
7
Definition
Distinctions applied to “high technology” almost universally use two particular
factors. The first factor relates to the number of technology workers employed, i.e.,
scientists, engineers, etc. The second factor relates to the level of research and
development (R&D) expenditures. The classification of high technology is thus
based on the ratio of technology workers to total employment and the ratio of
research and development expenditures to the size of the firm as measured by sales,
profits or value-added (Hetrick 1996). The specific value of the ratio that determines
when an industry should be classified as high tech is open to debate. Hadlock, et.al.
(1991) classifies an industry as high tech if “an industry’s proportion of R&D
employment is at least equal to the average for all industries (p.26).” A further
distinction employed by the Organization of European Community Development
(OECD 1995) and the U.S. National Science Foundation (NSF 1998) divides
occupations by their technology intensity, calculated by comparing industry research
and development (R&D) expenditures and/or the number of technical people
employed with the total value of an industry’s shipments (value added).
Each of the studies we relied on define high technology in terms of an industry
having a high proportion of its labor force comprised of scientific and engineering
workers, or a high ratio of research and development expenditures relative to firm
size. The various studies used different standards as to what constitutes a “high
proportion” or a “high ratio.” Developing our own measures of the proportion of an
industry’s labor force that is in research and development was not feasible. Thus, we
relied on the selection of technology intensive industries in other studies that used
this methodology.
Several states, such as North Carolina, also divide industries into categories
based on the intensity of technology use. Our study utilizes a similar approach to
distinguish between high-intensive and medium-intensive technology based
industries. High-intensive technology industries are those with a very highly
educated labor force and with a high ratio of research and development to firm size.
Medium-intensive technology industries are those that score high on at least one of
the two factors, or that have a less educated workforce but with a production process
that uses research and development-intensive machinery.

Defining and Measuring High Technology in Georgia
8
To measure the size of the high-intensive technology sector, we selected
those industries that are included as “high technology” by at least two out of the six
non-state sources (American Electronics Association, Milken Report, Bureau of
Labor Statistics, Organization of the European Community Division, and Bureau of
the Census). To measure the size of the medium-intensive technology sector, we
selected industries that are classified as technology intensive by other states and at
least one of the six non-state sources. In addition, members of the Advisory Panel
suggested other industries for inclusion. These industries were investigated to
determine whether they fit the adopted criteria. As a result, two additional industries
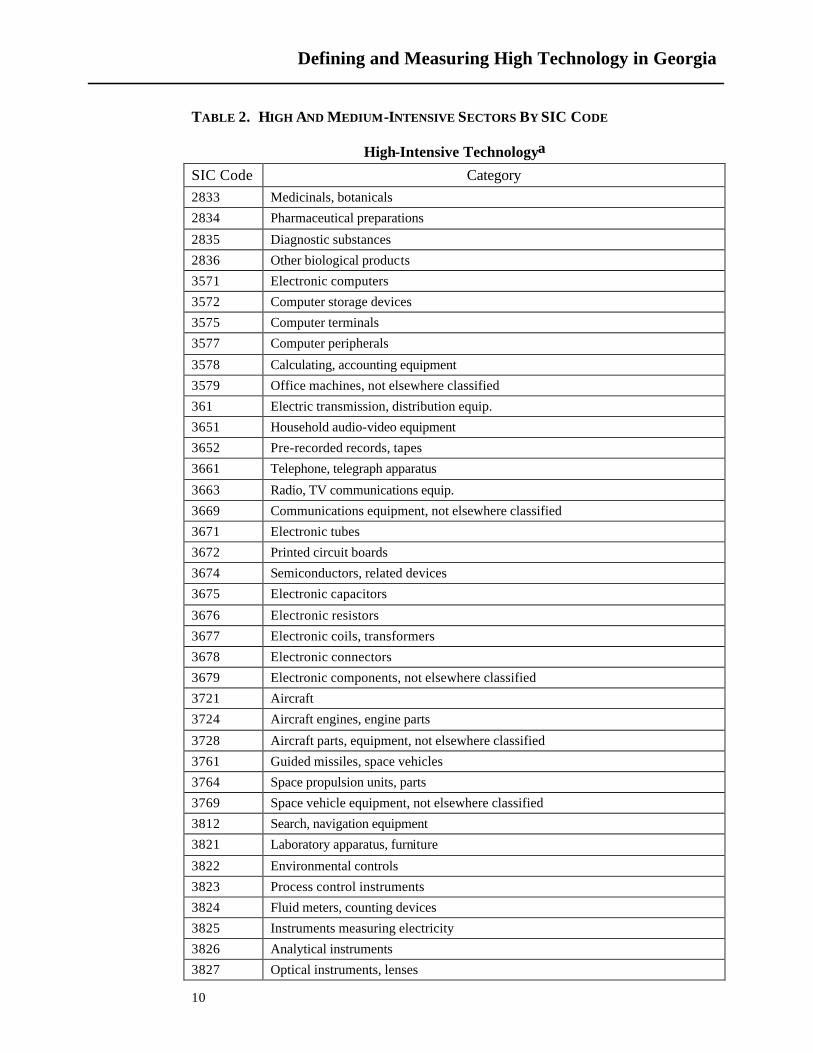
were added to the list of medium-intensive technology industries. Table 2 displays
the resulting SIC codes that we identified using this approach.
For the selected technology-intensive industries, we used data (known as the
ES202 data) from the Georgia Department of Labor to determine the number of
establishments and the number of workers in each of the high technology SIC codes.
Since these SIC codes reflect the 1987 classification, we converted the selected SIC
codes to 1979 equivalent codes; lacking a one-to-one match between the two sets of
codes, the pre-1987 definition of high technology occupations differs somewhat from
the post-1987 definition.2
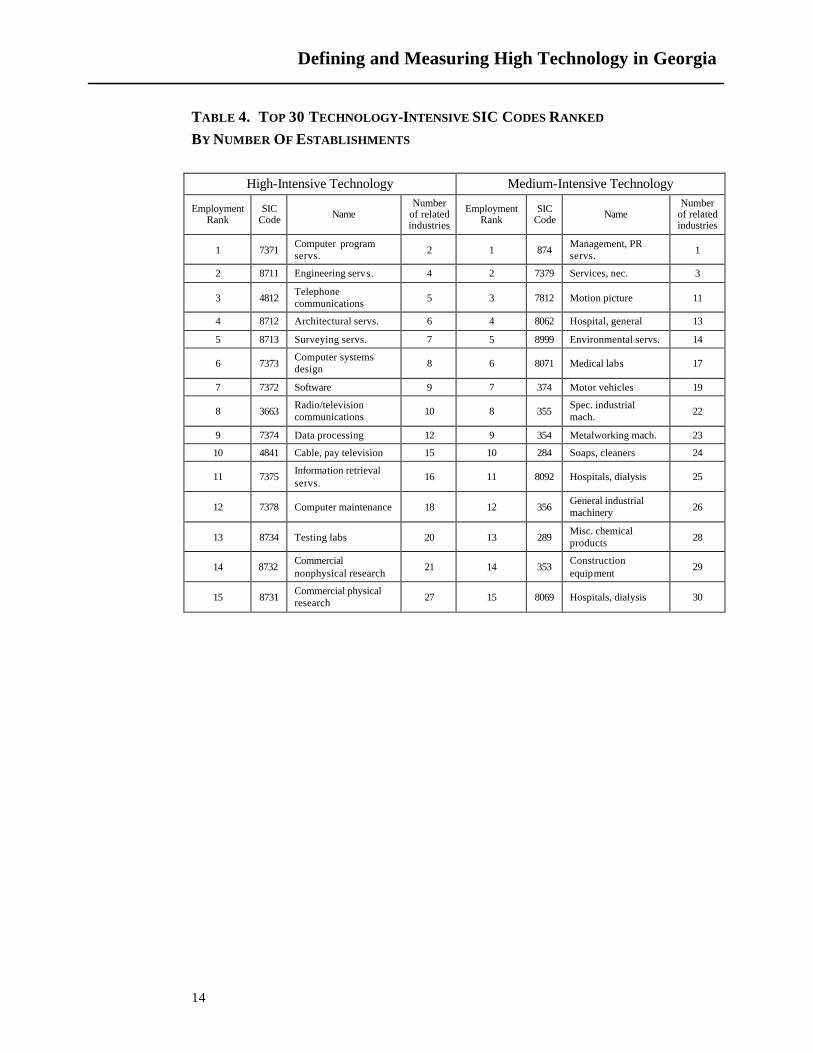
Ranking Georgia’s top thirty SIC codes by employment (Table 3) and number
of establishments (Table 4), separated into high- and medium-intensity technology
categories, indicates some clear areas of strength. Computer program and engineering
services, along with telephone communications, are the top three in terms of the level
of employment. Six computer-related industries appear in the top group in terms of
high-intensive technology jobs, along with three involving aircraft.
Industry ranking of jobs by employment level is shown in Table 5. A clear area
of strength appears from this technique, without resorting to artificial pre-arranging of
clustered categories. While Georgia’s strong and modernizing economy (Akioka
1999, Czetli 2000) permitted an increase in both high- and medium-intensive
technology categories, the proportion of high-intensive technology jobs increased
2The number of establishment is measured by the number of accounts in the ES202 data. Since some establishments have more than one account, our measure overstates the number of actual establishments.

Defining and Measuring High Technology in Georgia
9
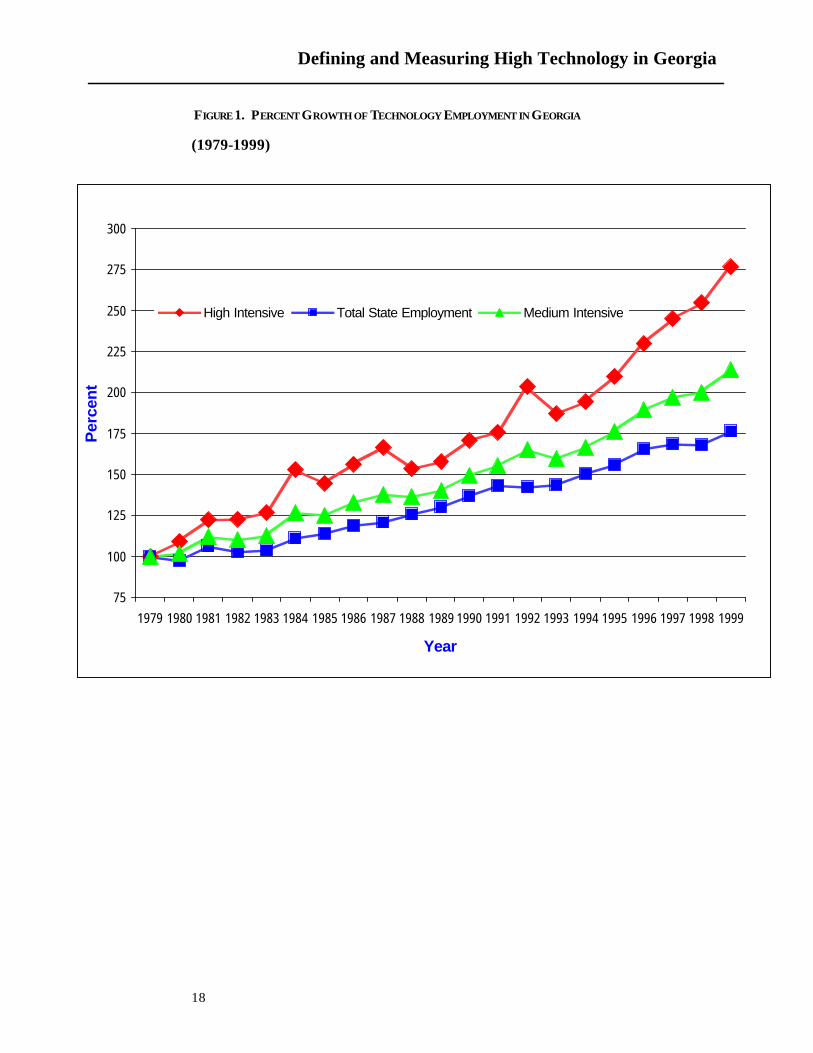
more rapidly than either the growth in total state employment or technology jobs in
general across the period 1979 to 1999 (Figure 1). The proportion of all jobs that are
high-intensive technology jobs increased steadily, along with the increasing
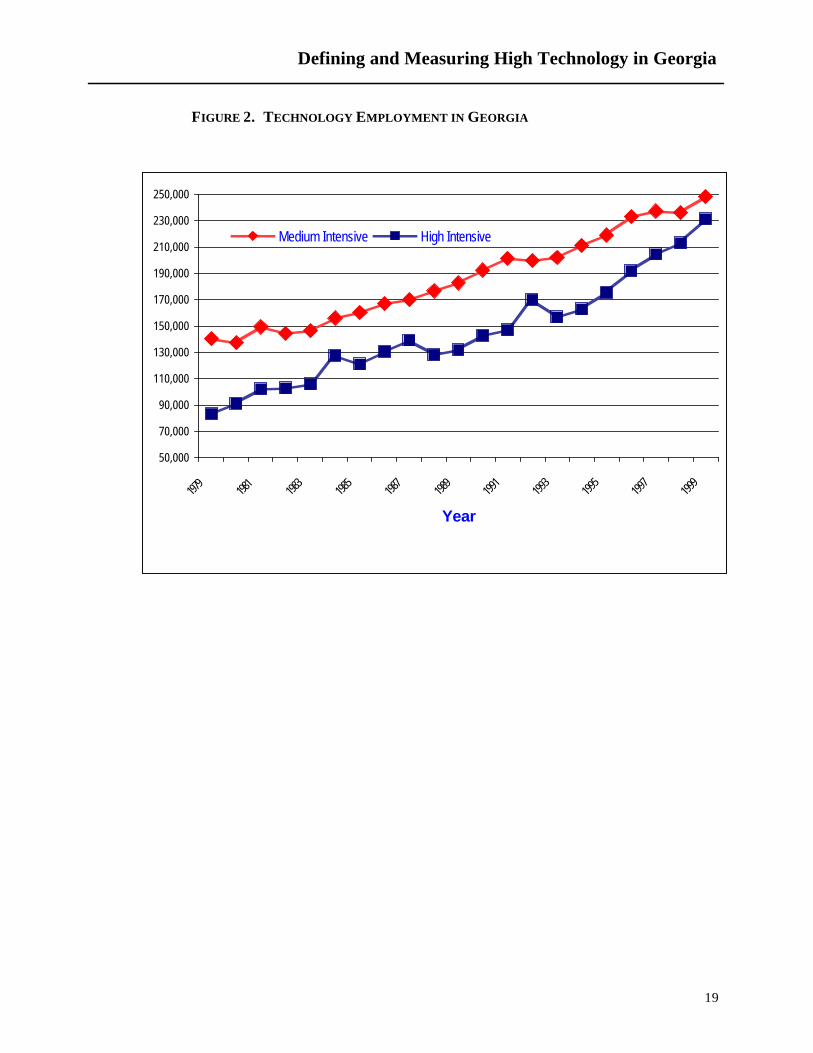
proportion of all high technology jobs in this time period (Figure 2).
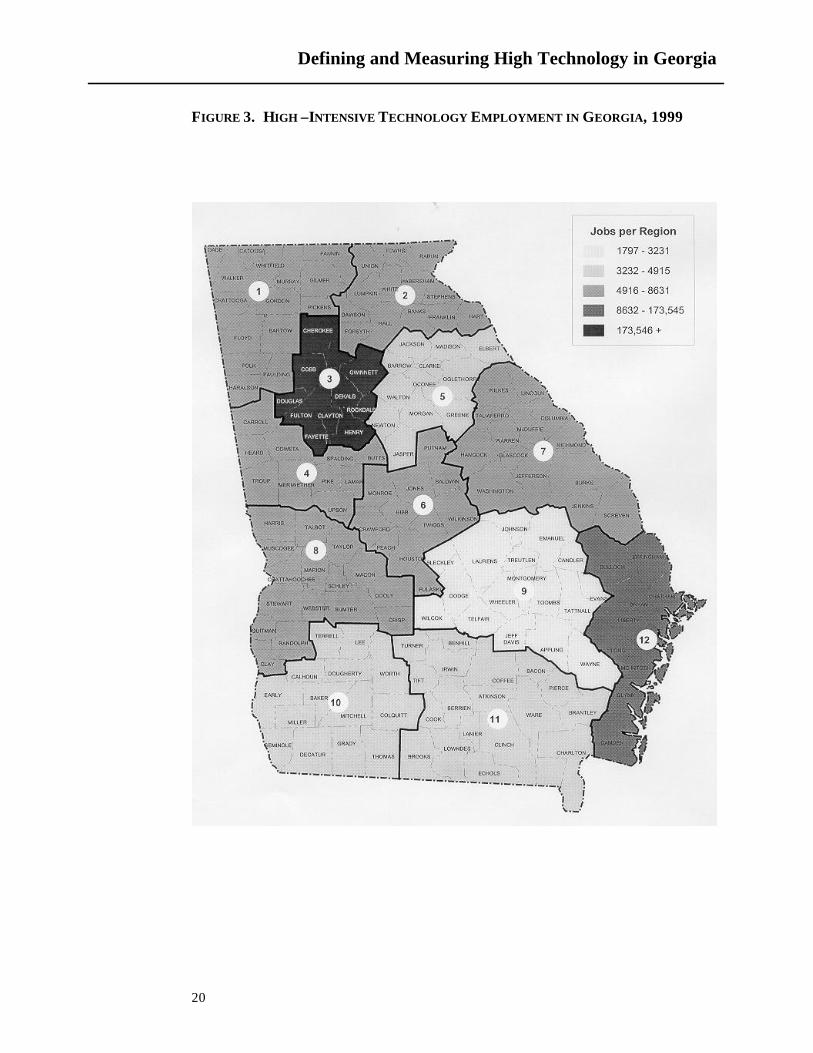
Technology intensive jobs are spatially clustered in the state, with a distinct
majority of high-intensive technology jobs in the state development region containing
metropolitan Atlanta. The coastal counties contain the second highest number of
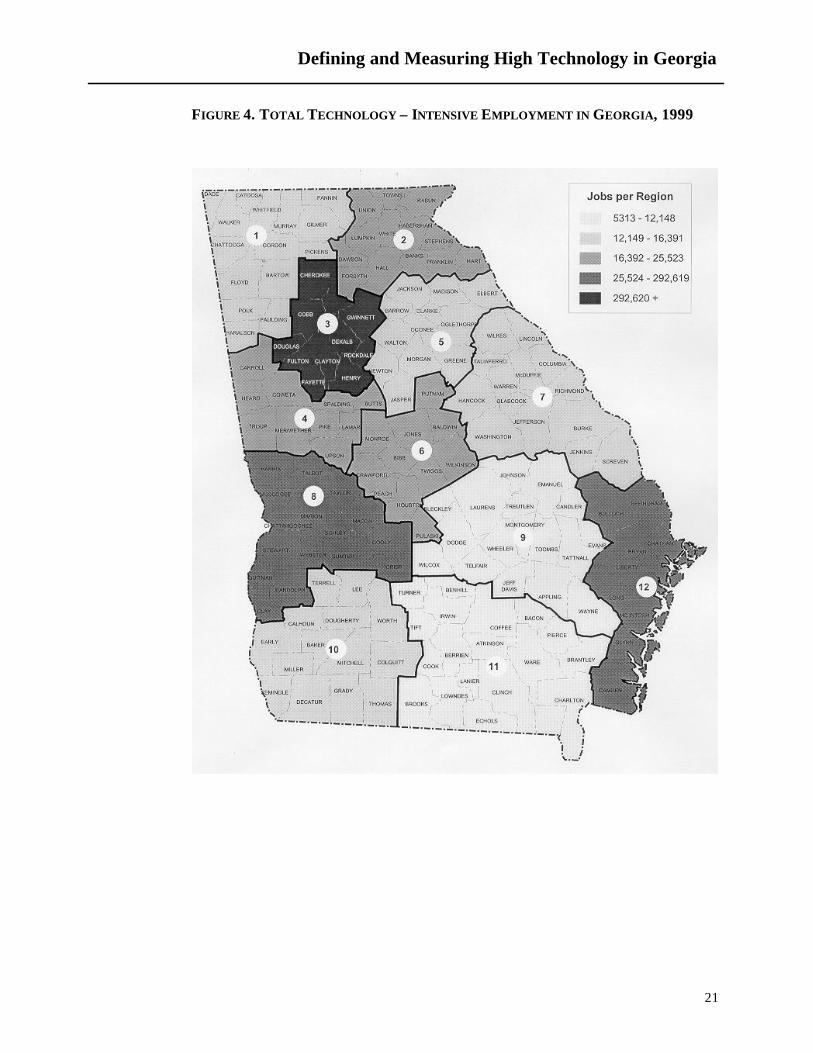
high-intensive technology jobs (Figure 3). The statewide distribution of technology
jobs combining both high- and medium-intensive technology categories, displayed by
economic development regions, reveals a more balanced picture (Figure 4). This
fuller picture of both the breadth and representativeness of “new economy” jobs
confirms the wisdom of utilizing two categories to reflect infusions of advanced
production processes across industries and labor force skill levels. While
metropolitan Atlanta maintains its predominant position, the coastal counties are
joined by Region 8, as well as technology activity in the Columbus and Macon metro
areas.
Defining and Measuring High Technology in Georgia
10
TABLE 2. HIGH AND MEDIUM-INTENSIVE SECTORS BY SIC CODE
High-Intensive Technologya
SIC Code Category 2833 Medicinals, botanicals
2834 Pharmaceutical preparations
2835 Diagnostic substances
2836 Other biological products
3571 Electronic computers
3572 Computer storage devices
3575 Computer terminals
3577 Computer peripherals
3578 Calculating, accounting equipment
3579 Office machines, not elsewhere classified
361 Electric transmission, distribution equip.
3651 Household audio-video equipment
3652 Pre-recorded records, tapes
3661 Telephone, telegraph apparatus
3663 Radio, TV communications equip.
3669 Communications equipment, not elsewhere classified
3671 Electronic tubes
3672 Printed circuit boards
3674 Semiconductors, related devices
3675 Electronic capacitors
3676 Electronic resistors
3677 Electronic coils, transformers
3678 Electronic connectors
3679 Electronic components, not elsewhere classified
3721 Aircraft
3724 Aircraft engines, engine parts
3728 Aircraft parts, equipment, not elsewhere classified
3761 Guided missiles, space vehicles
3764 Space propulsion units, parts
3769 Space vehicle equipment, not elsewhere classified
3812 Search, navigation equipment
3821 Laboratory apparatus, furniture
3822 Environmental controls
3823 Process control instruments
3824 Fluid meters, counting devices
3825 Instruments measuring electricity
3826 Analytical instruments
3827 Optical instruments, lenses

Defining and Measuring High Technology in Georgia
11
3829 Measuring, controlling devices
3841 Surgical and medical instruments
3842 Surgical appliances and supplies
3843 Dental equipment and supplies
3844 X-ray apparatus, tubes
3845 Electromedical equipment
3861 Photographic equipment
4812 Radiotelephone communications
4813 Telephone communications
4822 Telegraph, other message communication
4841 Cable, other pay TV services
4899 Other communications services
7371 Computer programming services
7372 Prepackaged software
7373 Computer integrated systems design
7374 Data processing, preparation
7375 Information retrieval services
7376 Computer facilities management
7377 Computer rental, leasing
7378 Computer maintenance, repair
7379 Computer-related services, not elsewhere classified
8711 Engineering services
8712 Architectural services
8713 Surveying services
8731 Commercial physical research
8732 Commercial nonphysical research
8733 Noncommercial research organization
8734 Testing laboratories a“High Intensive” is defined as those industries requiring a higher than average
proportion of research and development personnel and higher than average percentage of research and development investment. These industries are included as “high technology” by at least 2 out of 6 non-state sources (American Electronics Association, Milken Report, Bureau of Labor Statistics, Organization of the European Community Division, Bureau of the Census, Office of Management and Budget).

Defining and Measuring High Technology in Georgia
12
Medium-Intensive Technologyb
SIC Code Category 0182 Undercover food crops
131 Crude petroleum, natural gas
281 Industrial inorganic chemicals
282 Plastics materials, synthetics
284 Soaps, cleaners, toilet goods
285 Paints, varnishes, etc.
286 Industrial organic chemicals
287 Agricultural chemicals
289 Misc. chemical products
291 Petroleum refining
335 Nonferrous rolling, drawing
348 Ordnance, accessories
351 Engines and turbines
353 Construction, mining machinery
354 Metalworking machinery
355 Specialized industrial machinery
356 General industrial machinery
362 Electrical industrial apparatus
3643 Electric lighting, wiring equipment
371 Motor vehicles, equipment
7812 Motion picture, video production
7819 Services allied to motion pictures
8062, 69, 92 Hospitals, specialty and dialysis
8071 Medical laboratories
874 Management, PR services
8999 Services, not elsewhere classified/Environmental b“Medium Intensive” is defined as those industries that have a high level of scientific
and engineering personnel, an high level of R&D expenditures, or processes that involve R&D intensive machines, but engage a less educated workforce doing more routine tasks. They have been classified as technology intensive by other states and at least one outside classification source.

Defining and Measuring High Technology in Georgia
13
TABLE 3. TOP 30 TECHNOLOGY-INTENSIVE SIC CODES RANKED BY LEVEL OF EMPLOYMENT
High-Intensive Technology Medium-Intensive Technology
Employment Rank
SIC Code Name
Number of related industries
Employment Rank
SIC Code Name
Number of related industries
1 4813 Telephone communications 2 1 8062 Hospital, general 1
2 8711 Engineering services 5 2 874 Management, PR services
3
3 7371 Computer program services 6 3 371
Motor vehicles, equip. 4
4 3721 Aircraft 7 4 335 Nonferrous rolling 13
5 7372 Software 8 5 356 General industrial Machinery 15
6 7374 Data processing 9 6 284 Soaps, cleaners 17
7 4812 Radio/telephone communications 10 7 355
Spec. industrial machinery 18
8 7379 Computer servs., nec. 11 8 282 Plastics, synthetics 20
9 4841 Cable, pay TV servs. 12 9 8071 Medical labs 21
10 7375 Info retrieval servs. 14 10 354 Metalworking mach. 22
11 8712 Architectural servs. 16 11 353 Construction equip. 24
12 7373 Computer systems design 19 12 281
Industrial inorg. chemicals 25
13 3663 Radio/television communications equip. 23
14 7378 Computer maintenance 26
15 3728 Aircraft parts, equipment 27
16 3729 Electric transmission, distribution equipment
28
17 3672 Printed circuit boards 29
18 3724 Aircraft engines, parts 30
Defining and Measuring High Technology in Georgia
14
TABLE 4. TOP 30 TECHNOLOGY-INTENSIVE SIC CODES RANKED BY NUMBER OF ESTABLISHMENTS
High-Intensive Technology Medium-Intensive Technology
Employment Rank
SIC Code Name
Number of related industries
Employment Rank
SIC Code Name
Number of related industries
1 7371 Computer program servs. 2 1 874
Management, PR servs. 1
2 8711 Engineering servs. 4 2 7379 Services, nec. 3
3 4812 Telephone communications 5 3 7812 Motion picture 11
4 8712 Architectural servs. 6 4 8062 Hospital, general 13
5 8713 Surveying servs. 7 5 8999 Environmental servs. 14
6 7373 Computer systems design 8 6 8071 Medical labs 17
7 7372 Software 9 7 374 Motor vehicles 19
8 3663 Radio/television communications 10 8 355
Spec. industrial mach. 22
9 7374 Data processing 12 9 354 Metalworking mach. 23
10 4841 Cable, pay television 15 10 284 Soaps, cleaners 24
11 7375 Information retrieval servs.
16 11 8092 Hospitals, dialysis 25
12 7378 Computer maintenance 18 12 356 General industrial machinery 26
13 8734 Testing labs 20 13 289 Misc. chemical products 28
14 8732 Commercial nonphysical research
21 14 353 Construction equipment
29
15 8731 Commercial physical research 27 15 8069 Hospitals, dialysis 30

Defining and Measuring High Technology in Georgia
15
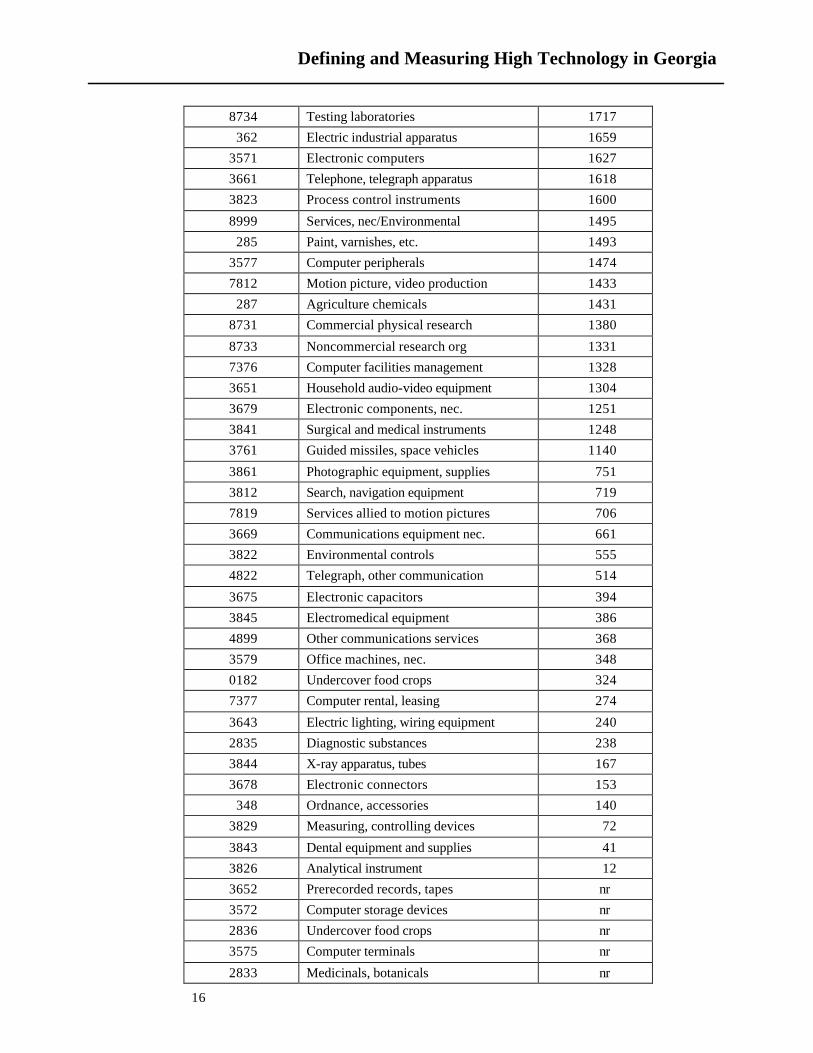
Table 5. Employment in High Technology In Georgia By SIC Code, 1999
SIC Code Name Employment
8062 Hospital, general 126499
4813 Telephone communications 46939
874 Management, PR services 31915
371 Motor vehicles, equipment 20320
8711 Engineering services 20020
7371 Computer program services 17426
3721 Aircraft 16363
7372 Software 13970
7374 Data processing 11554
4812 Radio/telephone communications 9699
7379 Services, nec. 9546
4841 Cable, other pay TV services 9272
335 Nonferrous rolling, drawing 4633
7375 Information retrieval services 7997
356 General industrial machinery 5741
8712 Architecture services 5339
284 Soaps, cleaners, toilet goods 5223
355 Specialized industrial machinery 4633
7373 Software systems design 4023
282 Plastics materials, synthetics 3875
8071 Medical laboratories 3660
354 Metalworking machinery 3316
3663 Radio/telephone equipment 3297
353 Construction/mining machinery 3173
281 Industrial inorganic chemicals 2951
7378 Computer maintenance, repair 2881
3728 Aircraft parts, equipment 2863
361 Electric transmission, distrib equip 2855
3672 Printed circuit boards 2819
3724 Aircraft engines, engine parts 3716
289 Misc. chemical products 3676
8713 Surveying services 2577
351 Engines & turbines 2548
3842 Surgical appliances and supplies 2408
8092 Dialysis equip. services 2243
2834 Pharmaceutical preparations 2187
8732 Commercial nonphysical research 2172
286 Industrial organic chemicals 2024
8069 Hospitals, specialty & dialysis 1900
Defining and Measuring High Technology in Georgia
16
8734 Testing laboratories 1717
362 Electric industrial apparatus 1659
3571 Electronic computers 1627
3661 Telephone, telegraph apparatus 1618
3823 Process control instruments 1600
8999 Services, nec/Environmental 1495
285 Paint, varnishes, etc. 1493
3577 Computer peripherals 1474
7812 Motion picture, video production 1433
287 Agriculture chemicals 1431
8731 Commercial physical research 1380
8733 Noncommercial research org 1331
7376 Computer facilities management 1328
3651 Household audio-video equipment 1304
3679 Electronic components, nec. 1251
3841 Surgical and medical instruments 1248
3761 Guided missiles, space vehicles 1140
3861 Photographic equipment, supplies 751
3812 Search, navigation equipment 719
7819 Services allied to motion pictures 706
3669 Communications equipment nec. 661
3822 Environmental controls 555
4822 Telegraph, other communication 514
3675 Electronic capacitors 394
3845 Electromedical equipment 386
4899 Other communications services 368
3579 Office machines, nec. 348
0182 Undercover food crops 324
7377 Computer rental, leasing 274
3643 Electric lighting, wiring equipment 240
2835 Diagnostic substances 238
3844 X-ray apparatus, tubes 167
3678 Electronic connectors 153
348 Ordnance, accessories 140
3829 Measuring, controlling devices 72
3843 Dental equipment and supplies 41
3826 Analytical instrument 12
3652 Prerecorded records, tapes nr
3572 Computer storage devices nr
2836 Undercover food crops nr
3575 Computer terminals nr
2833 Medicinals, botanicals nr
Defining and Measuring High Technology in Georgia
17
3769 Space vehicle equipment, nec. nr
3674 Semiconductors, related devices nr
291 Petroleum refining nr
3677 Electronic coils, transformers nr
3825 Instruments measuring electricity nr
3824 Fluid meters, counting devices nr
3821 Laboratory apparatus, furniture nr
3578 Calculating, accounting equipment nr
3676 Electronic resistors nr
3827 Optical instruments, lenses nr
131 Crude petroleum, natural gas nr
TOTAL 464,872
nr: not reported for purpose of confidentiality
Defining and Measuring High Technology in Georgia
18
FIGURE 1. PERCENT GROWTH OF TECHNOLOGY EMPLOYMENT IN GEORGIA
(1979-1999)
75
100
125
150
175
200
225
250
275
300
1979 1980 1981 1982 1983 1984 1985 1986 1987 1988 1989 1990 1991 1992 1993 1994 1995 1996 1997 1998 1999
Year
Per
cent
High Intensive Total State Employment Medium Intensive
Defining and Measuring High Technology in Georgia
19
FIGURE 2. TECHNOLOGY EMPLOYMENT IN GEORGIA
50,000
70,000
90,000
110,000
130,000
150,000
170,000
190,000
210,000
230,000
250,000
1979
1981
1983
1985
1987
1989
1991
1993
1995
1997
1999
Year
Medium Intensive High Intensive
Defining and Measuring High Technology in Georgia
20
FIGURE 3. HIGH –INTENSIVE TECHNOLOGY EMPLOYMENT IN GEORGIA, 1999
Defining and Measuring High Technology in Georgia
21
FIGURE 4. TOTAL TECHNOLOGY – INTENSIVE EMPLOYMENT IN GEORGIA, 1999
Defining and Measuring High Technology in Georgia
22
Conclusion
Several general observations regarding cluster affiliation can be made based
on the two lists of high-intensive and medium-intensive technology industries. The
most prominent SIC codes on the high-intensive technology list for Georgia by
number of establishments are affiliated with computer services (SIC 737, at 2,143
companies), followed by engineering services (SIC 871, at 1,322 companies). Based
on employment, the top high-intensive technology industries are associated with
communications (SIC 48, at 47,536 jobs) followed by engineering services (SIC
8711, at 20,452 jobs) and computer program services (SIC 7371, at 17,790 jobs).
Both classifications are highest in service-related occupations, reflecting a mature,
skilled economy.
Our selection of SIC codes to represent technology-intensive industries draws
on previous studies of high technology occupations at the national and state levels, by
both government bureaus and private economic assessment groups, as well as
numerous state-affiliated study groups. Including the insights of Georgia
development professionals permits consideration of the pervasiveness of technology
thorough production machinery and processes as well as personnel. Resulting
measurements of Georgia’s technology strengths following from this definition more
accurately reflect the state of current technology utilization, permit policy
formulations on a sound basis, and indicate areas for future development.
Defining and Measuring High Technology in Georgia
23
References
Akioka, L., ed. 1999. Industries Of The Mind: High Technology In Atlanta. Georgia
Business and Economic Conditions 59:1-8.
American Electronics Association. 3/26/2000. High-tech definition. www.aeanet.org.
Czetli, S. 2000. The Way We Are: New Benchmarking Study Finds Region’s High-
Tech Sector Hot, Growing. Http://www.techncenter-pgh.com/teq/1197/
cvst1197.html. (Pittsburgh, PA).
DeVol, R. 1999. America’s High-Tech Economy. Santa Monica, CA: Milken
Institute.
Hadlock, P., D. Hecker, and J. Gannon. 1991. High Technology Employment:
Another View. Monthly Labor Review: 26-31.
Hecker, D. 1999. High Technology Employment: A Broader View. In Monthly
Labor Review: 18-28. (economist in Office of Employment Projections, BLS)
Hetrick, R. 8/1996. Employment In High-Tech Defense Industries In A Post Cold
War Era. Monthly Labor Review:57-63.
Luker, Jr., W. and Lyons, D. 1997. Employment Shifts In High-Technology
Industries, 1988-96. Monthly Labor Review:12-25
Lyons, D. and Luker, Jr., B. 1996. Employment In Research and Development-
Intensive High-Tech
Industries In Texas. Monthly Labor Review:15-25.
Lyons, D. and Luker, Jr., B. 1998. Explaining The Contemporary Spatial Structure Of
High-Technology Employment In Texas. Urban Geography 19:431-458.
Malecki, E. 1997. Technology and Economic Development: The Dynamics of Local,
Regional and National Competitiveness. England: Addison, Wesley, Longman.
Michigan Economic Development Corporation. 5/26/2000. MEDC Counters
Cyberstates With Own Tech Employment Study. SSTI Weekly National Science
Foundation. 1998. Science and Engineering Indicators. Organization of
European Community Development. 1995.
Prothro, V. 1998. Report of Governor’s Science and Technology Council. Austin,
TX.
Defining and Measuring High Technology in Georgia
24
Quarles, P. and M. Choe. 2000. Index of Innovation and Technology: Washington
State 2000. Washington Technology Center.
Stough, R., R. Kulkarni, and M. Trice. May 2000. Technology in Virginia’s Regions.
Fairfax, VA: Mason Enterprise Center, Institute of Public Policy, George
Mason University. Tennessee Department of Economic & Community
Development. 2000. http://www.state.tn.us/ecd/sicdesc.htm. 6/2000.
Walcott. S. 1999. High Tech In The Deep South: Biomedical Firm Clusters In
Metropolitan Atlanta. Growth and Change 30:48-74.

Defining and Measuring High Technology in Georgia
25
Appendix. Rationale for Choice of SIC Codes
I. American Electronics Association (2000): Used 45 SIC codes principally
related to its constituency, excluding, for example, all services and medically
related occupations (www.aeanet.org).
II. Bureau Of the Census: Ten products or processes considered “new or leading-
edge technologies” (NSF 1998, p.6-12). These are not directly linked to but can
be assigned SIC codes. Major areas are life science and biotechnology, opto-
electronics, computers, telecommunications, electronics, computer-integrated
manufacturing, material design, aerospace, weapon development, and nuclear
technology.
III. Bureau of Labor Statistics: Used variety of expanding and contracting
measures.
IV. OECD (1995): Out of 22 industrial sectors, considers only 4 high-tech:
aerospace (SIC 376), computers and office machinery (SIC 357), electronics-
communications (SIC 366 and SIC 367), and pharmaceuticals (SIC 283).
V. States:
A. Arizona: (www.azcommerce.com/gsped/gsped_clusters.htm) identified 11
“key clusters” in the state; incongruously identified “high technology”
separately from “bioindustry”, “environmental technology”, and “software.”
B. California Office of Economic Research uses BLS’ 1999 definition [see
chart]
C. Georgia: GDITT 1) combined AEA and Milken categories, and 2) identified
8 “Areas of Excellence” as Georgia strengths or concentrations:
Biotechnology and Health Services, Information Processing, Poultry
Production, Pulp & Paper Technologies, Telecommunications,
Aerospace/Aviation, Agribusiness/Agritech, and Carpet manufacturing.
Suggested separating industries by process and product, industry and jobs
within other industries. MACOC/IOM 1) identified jobs as high tech to target
company attraction, and used seven classifications in particular.
Defining and Measuring High Technology in Georgia
26
D. Hawaii combined AEA, BLS (Hecker 1999), and Arizona’s definitions.
Pointed out BLS definition specified SIC included “if proportion of R & D
and technology-oriented occupations exceeded twice the average proportion
for all industries.” Added some agricultural codes that might be useful
precedent for Georgia, involving “crop and animal biotech…diagnostic
substances & organic chemicals”. (www.hawaii.gov/dbedt/he1-
00.measure.html)
E. Kansas: Used the Pittsburgh/Cleveland clusters;
F. Michigan (MEDC 2000) added motor vehicles since they are its strength;
G. New Jersey used both the two standard definitions plus cluster approach to
capture industries that fed others and only one “high-tech”, similar to current
Georgia approach.
H. New Mexico identified “[technology] industry clusters”: advanced instru-
ments, aerospace, biomedical products, biotechnology, microelectronics,
optoelectronics, software, telecommunications equipment, and telecom-
munications services; (www.edd.state.nm.us/FACTBOOK/techstat.htm).
I. North Carolina eliminated SIC codes that it didn’t have, added “fast-
growing” industries; (www.governor.state.us/govoffice/science/projects/
nc2030.html)
J. Pittsburgh identified six “technology clusters”, including information tech,
environmental tech, and biotech;
K. South Carolina chose SIC 7 codes for incentives; most of their tech labor is in
chemicals, plastics, and textile fibers firms. Also machinery, durables and
non-durables, engineering, and info services. Chose five clusters:
manufacturing, information and communications, environment (monitoring
equipment & services, living systems, materials (chemicals, rubber, plastic,
textile).
L. Tennessee (2000) identified SIC list that corresponds to other states plus its
own strengths with employment figures from DOL.
M. Texas (Lyons and Luker 1998, Prothro 1998) added “crude petroleum and
natural gas operations” since they are its strength; used SIC classification of
Defining and Measuring High Technology in Georgia
27
BLS 1991; added several other categories only used by this state, a real
stretch. Texas justifies including oil exploration, chemicals, and agriculture
processing as “industries [that] rely heavily on technology-driven research
and development activities to create new goods and services” (Prothro 1998).
N. Virginia (Stough, et al. 2000) uses AEA’s SIC codes; identified a “technology
sector” which it then used to rate areas in Virginia by the amount and type of
technology firms predominant. Generally defined as firms “that produce
technology, require a high level of dependence on technology… or use
technology to examine complex problems.” Combined a survey of VA tech
firms, ES202 data, Bureau of the Census County Business Patterns, and Dunn
& Bradstreet firm listing. Multipliers used the Minnesota IMPLAN System,
1995.
O. Washington State (Quarles and Choe 2000) used an internally computed list
of industries “which employ the majority of science, engineering, and
technology occupations in the state.” Included “any SIC code having 7% or
more of its employment in the technology occupations listed” accounting for
most tech positions. Eliminated those representing “delivery of routine
services based on a technology.”
Defining and Measuring High Technology in Georgia
28
About The Author
Susan M. Walcott is an Assistant Professor of Geography at Georgia State
University, specializing in urban and regional economic development. She has
published articles on “High Tech in the Deep South,” “The Three Georgias,” and
“Corporate Headquarters in Metropolitan Atlanta, 1960-1997” concerning the effect
of high technology-induced growth in this region.
About The Fiscal Research Program
The Fiscal Research Program provides nonpartisan research, technical
assistance, and education in the evaluation and design of state and local fiscal and
economic policy, including both tax and expenditure issues. The Program’s mission
is to promote development of sound public policy and public understanding of issues
of concern to state and local governments.
The Fiscal Research Program (FRP) was established in 1995 in order to provide
a stronger research foundation for setting fiscal policy for state and local governments
and for better informed decision making. The FRP, one of several prominent policy
research centers and academic departments housed in the School of Policy Studies,
has a full-time staff and affiliated faculty from throughout Georgia State University
and elsewhere who lead the research efforts in many organized projects.
The FRP maintains a position of neutrality on public policy issues in order to
safeguard the academic freedom of authors. Thus, interpretations or conclusions in
FRP publications should be understood to be solely those of the author.
Document Metadata
This document was retrieved from IssueLab - a service of the Foundation Center, http://www.issuelab.org
Date information used to create this page was last modified: 2014-02-15
Date document archived: 2010-08-06
Date this page generated to accompany file download: 2014-04-15
IssueLab Permalink: http://www.issuelab.org/resource/defining_and_measuring_high_technology_in_georgia
Defining and Measuring High Technology in Georgia
Publisher(s): Fiscal Research Center of the Andrew Young School of Policy Studies
Author(s): Susan M. Walcott
Date Published: 2000-12-01
Rights: Copyright 2000 Fiscal Research Center of the Andrew Young School of Policy Studies
Subject(s): Computers and Technology