defensive driver training scott pipicelli hettrick, cyr & associates
TRANSCRIPT
Defensive Driver Training
Scott PipicelliHettrick, Cyr & Associates
Preventable Vehicle AccidentPreventable Vehicle Accident
…..One in which the driver failed to do everything reasonable to avoid the accident
Accident Statistics & Facts
77% of accidents are due to driver errorNearly 6.3 million police-reported motor
vehicle crashes occurred in the U.S. last yearLarge trucks accounted for 9% of the vehicles
in fatal crashesRegardless of crash severity, the majority of
vehicles in single and two-vehicle crashes were going straight prior to the crash
Accident Statistics & Accident Statistics & FactsFacts
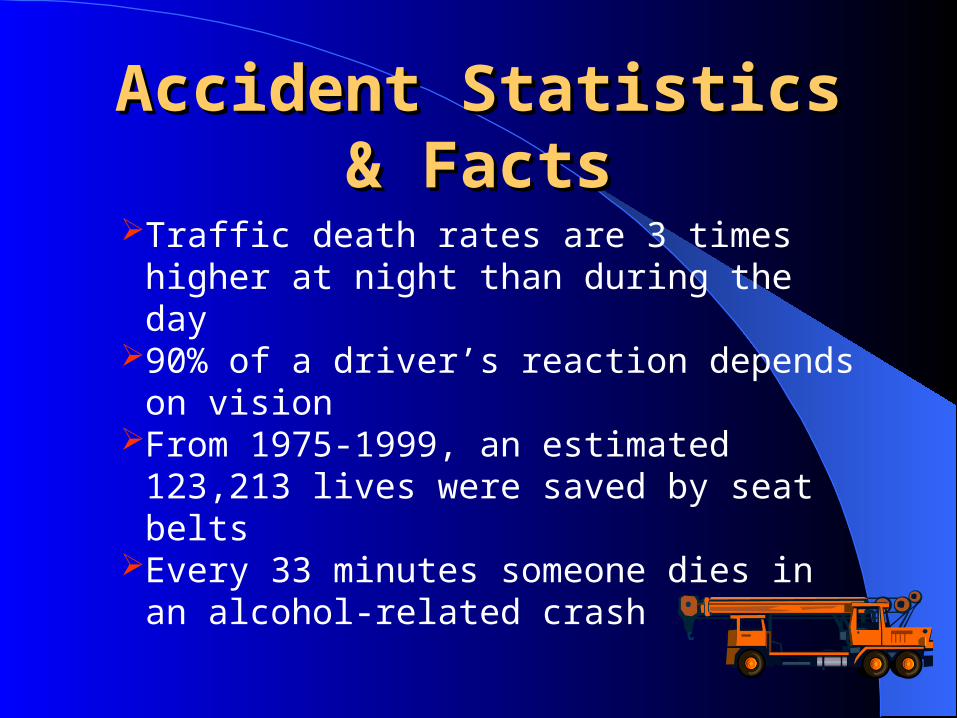
Traffic death rates are 3 times higher at night than during the day
90% of a driver’s reaction depends on vision
From 1975-1999, an estimated 123,213 lives were saved by seat belts
Every 33 minutes someone dies in an alcohol-related crash
Speeding Accidents Statistics & Facts
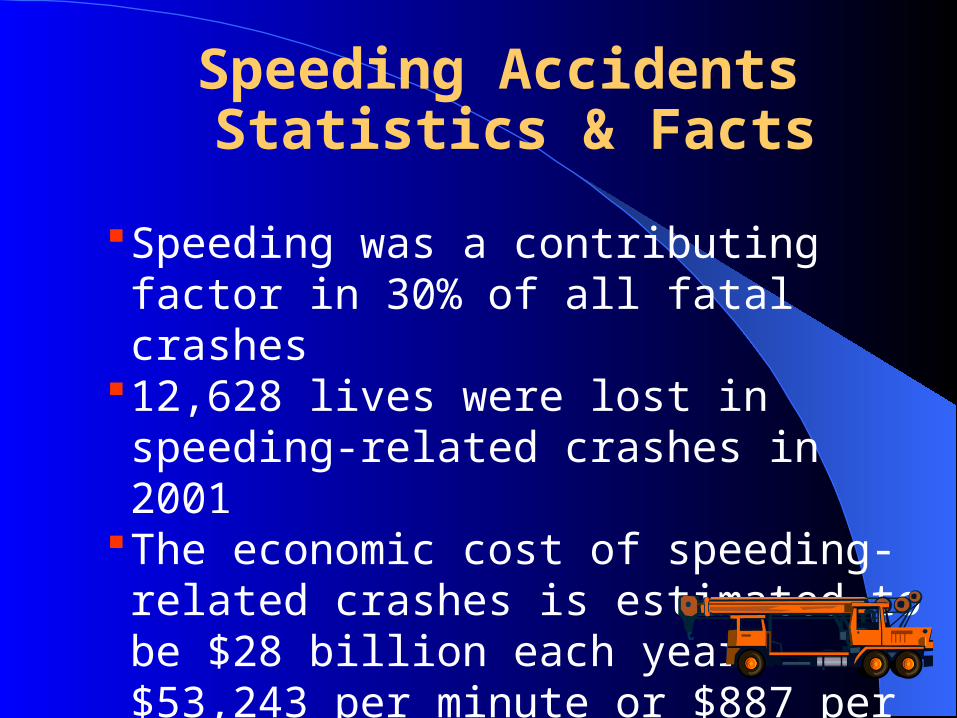
Speeding was a contributing factor in 30% of all fatal crashes
12,628 lives were lost in speeding-related crashes in 2001
The economic cost of speeding-related crashes is estimated to be $28 billion each year-$53,243 per minute or $887 per second
Speeding AccidentsSpeeding Accidents Statistics & Facts Statistics & Facts
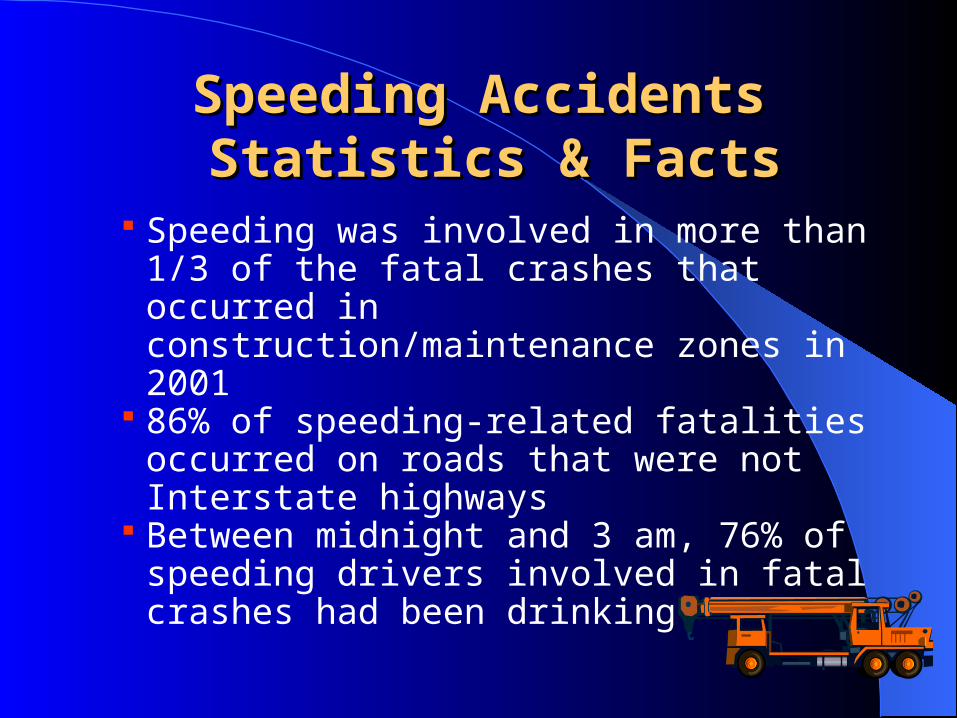
Speeding was involved in more than 1/3 of the fatal crashes that occurred in construction/maintenance zones in 2001
86% of speeding-related fatalities occurred on roads that were not Interstate highways
Between midnight and 3 am, 76% of speeding drivers involved in fatal crashes had been drinking
CDL Driver Coaching SkillsCDL Driver Coaching Skills
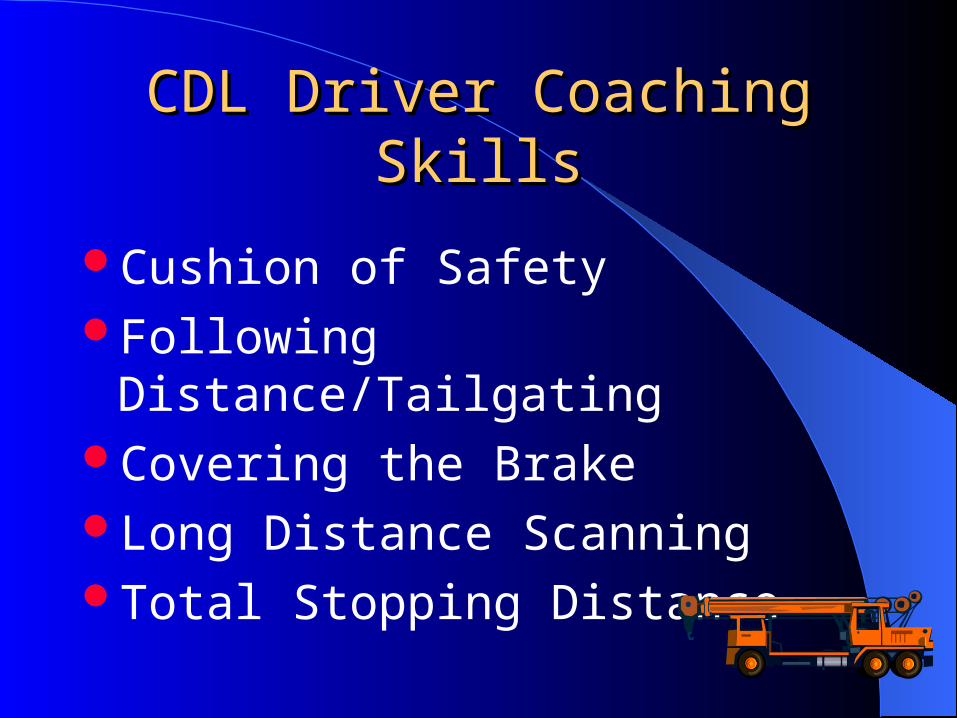
Cushion of SafetyFollowing Distance/TailgatingCovering the BrakeLong Distance ScanningTotal Stopping Distance
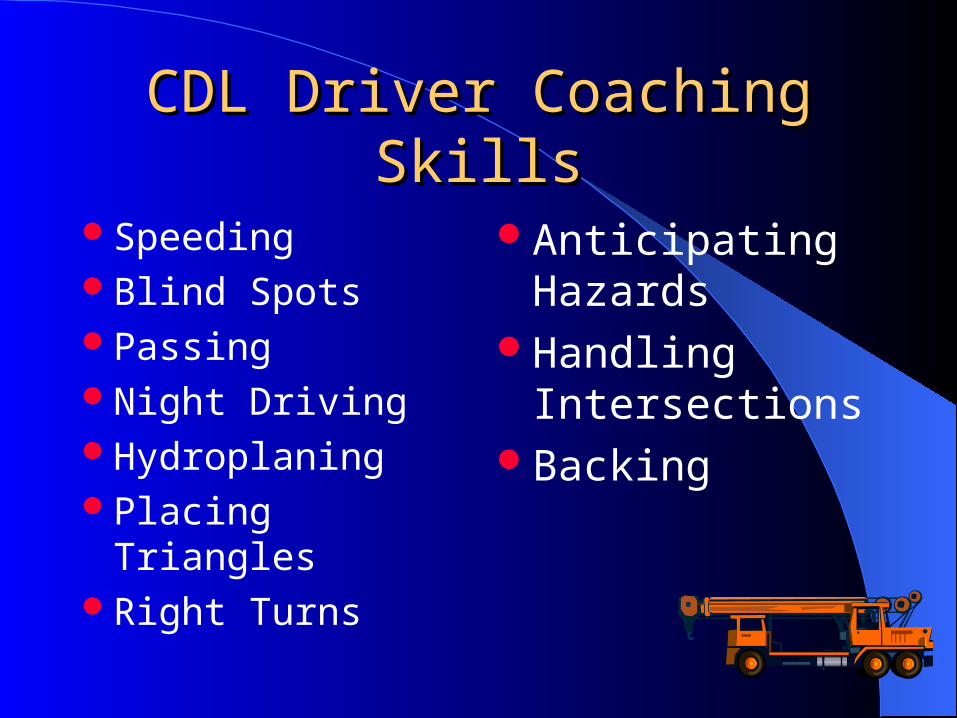
CDL Driver Coaching SkillsCDL Driver Coaching Skills
SpeedingBlind SpotsPassingNight Driving HydroplaningPlacing TrianglesRight Turns
Anticipating Hazards
Handling Intersections
Backing
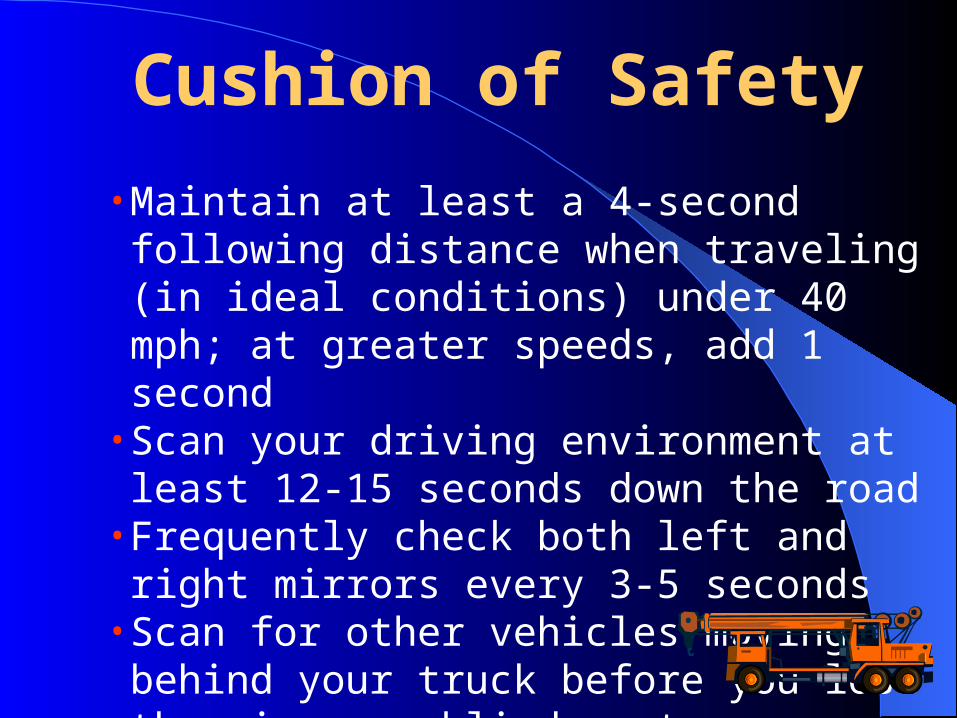
Cushion of Safety
• Maintain at least a 4-second following distance when traveling (in ideal conditions) under 40 mph; at greater speeds, add 1 second
• Scan your driving environment at least 12-15 seconds down the road
• Frequently check both left and right mirrors every 3-5 seconds
• Scan for other vehicles moving behind your truck before you lose them in your blind spot
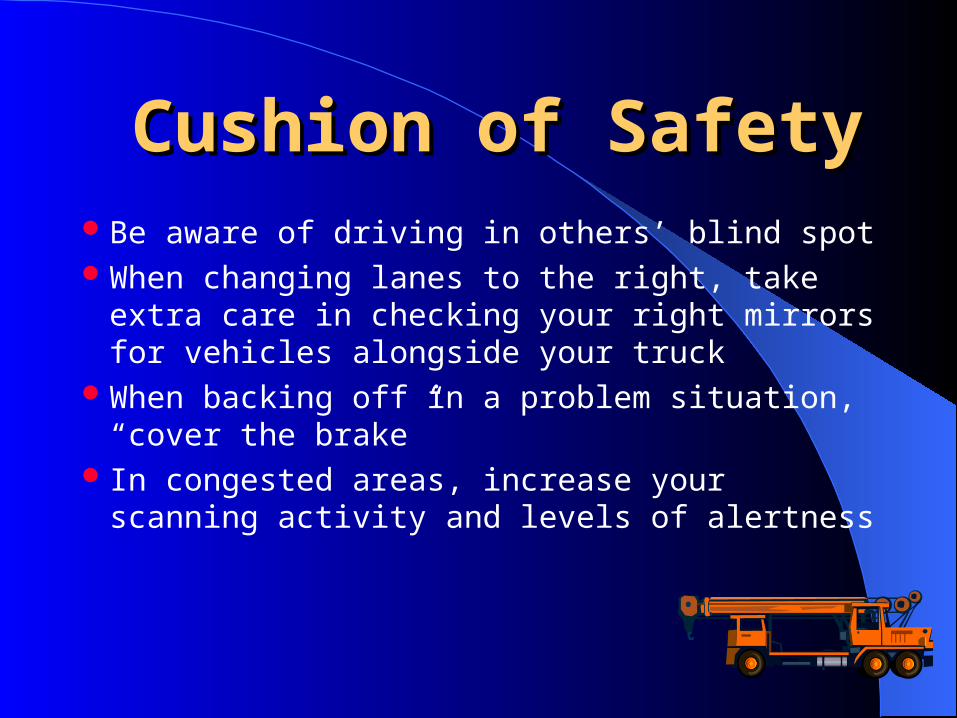
Cushion of SafetyCushion of SafetyBe aware of driving in others’ blind spotWhen changing lanes to the right, take extra
care in checking your right mirrors for vehicles alongside your truck
When backing off in a problem situation, “cover the brake”
In congested areas, increase your scanning activity and levels of alertness
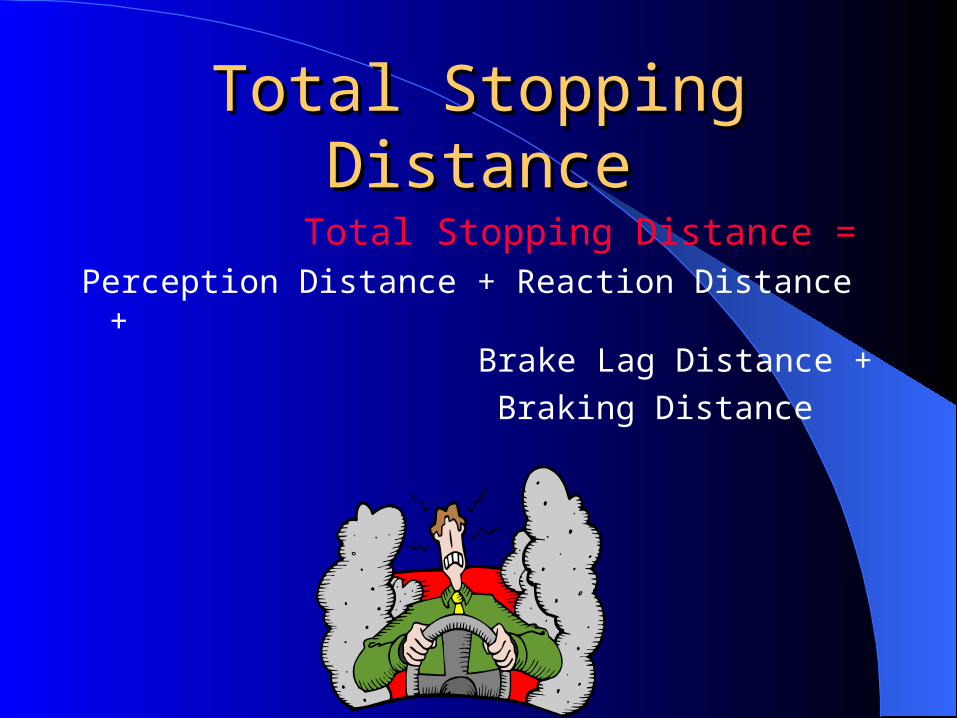
Total Stopping DistanceTotal Stopping Distance
Total Stopping Distance =Perception Distance + Reaction Distance +
Brake Lag Distance +
Braking Distance
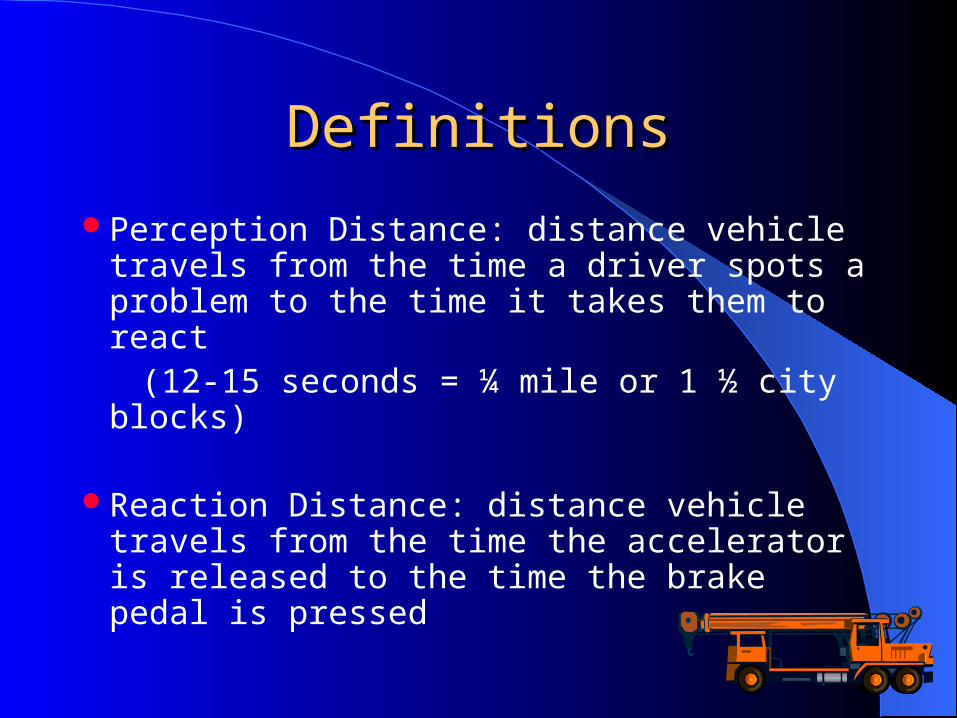
DefinitionsDefinitions
Perception Distance: distance vehicle travels from the time a driver spots a problem to the time it takes them to react
(12-15 seconds = ¼ mile or 1 ½ city blocks)
Reaction Distance: distance vehicle travels from the time the accelerator is released to the time the brake pedal is pressed
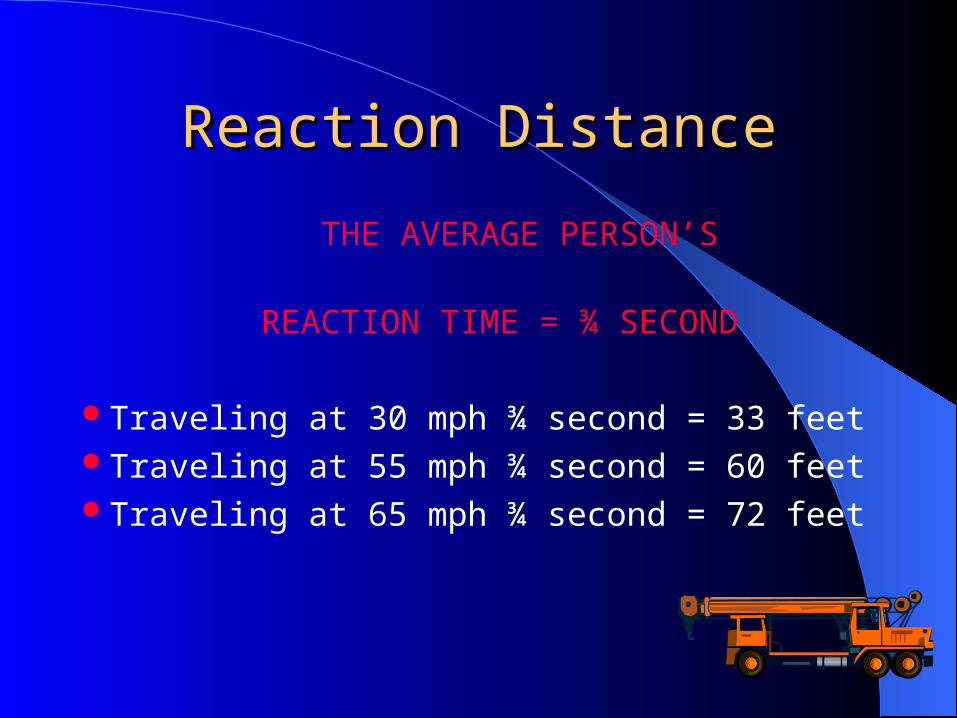
Reaction DistanceReaction Distance
THE AVERAGE PERSON’S
REACTION TIME = ¾ SECOND
Traveling at 30 mph ¾ second = 33 feetTraveling at 55 mph ¾ second = 60 feetTraveling at 65 mph ¾ second = 72 feet
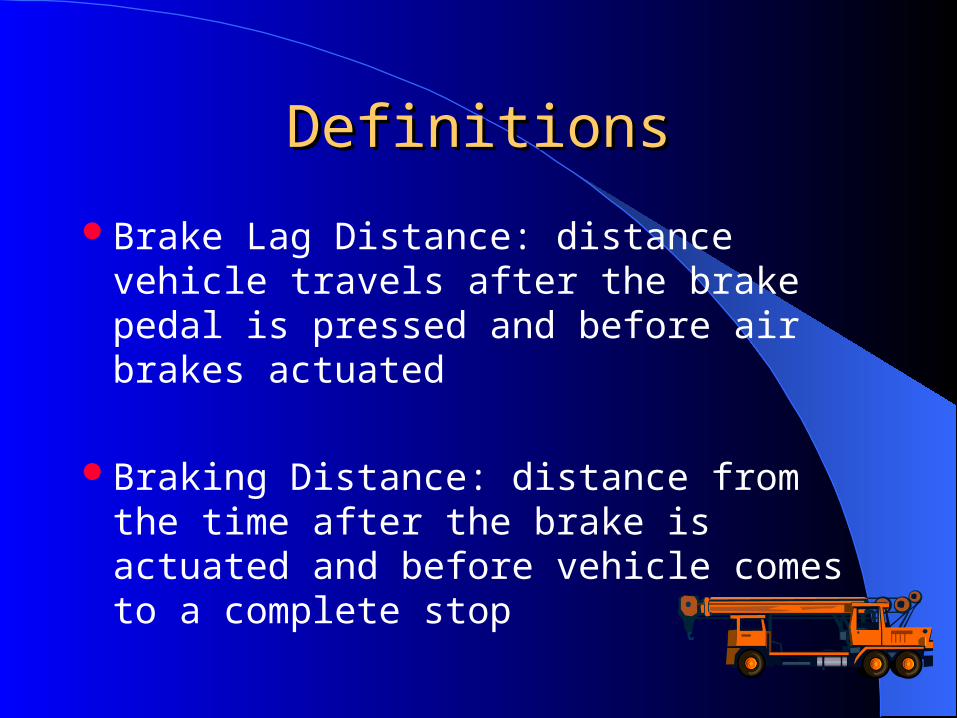
DefinitionsDefinitions
Brake Lag Distance: distance vehicle travels after the brake pedal is pressed and before air brakes actuated
Braking Distance: distance from the time after the brake is actuated and before vehicle comes to a complete stop
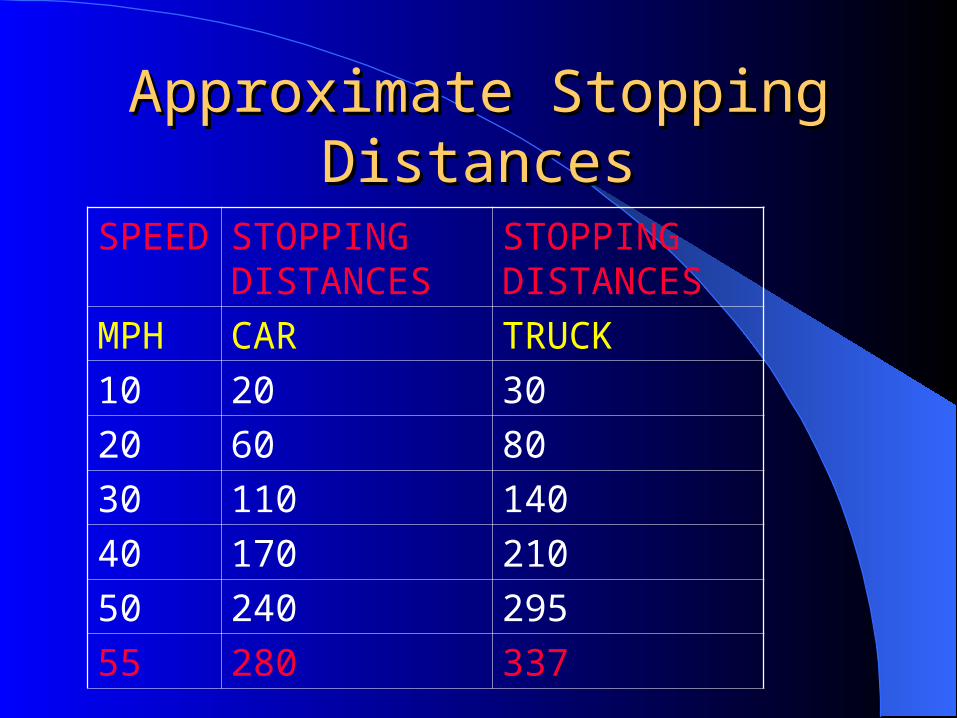
Approximate Stopping Approximate Stopping DistancesDistances
SPEED STOPPING DISTANCES
STOPPING DISTANCES
MPH CAR TRUCK
10 20 30
20 60 80
30 110 140
40 170 210
50 240 295
55 280 337
Factors that Effect Stopping Factors that Effect Stopping DistancesDistances
Tire TreadRoad SurfaceVehicle LoadWeatherRoad InclinationEffects of Alcohol, Drugs & Fatigue
Adverse Weather Conditions Adverse Weather Conditions
Increase your following distance in fog, heavy rain, snow, ice, etc.
Reduce speed to well below the posted speed limit. Braking distances can increase 300% on ice an snow Vehicle weight will not decrease stopping distance Whenever there is a glare on the road, the conditions
are prime for hydroplaning and black ice.
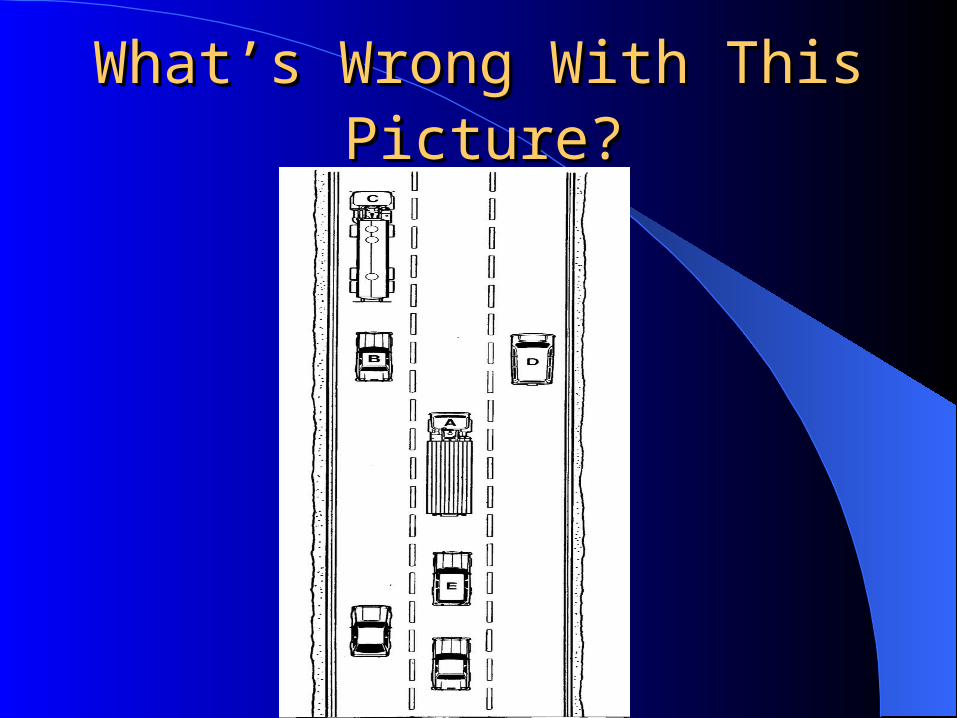
What’s Wrong With ThisWhat’s Wrong With ThisPicture?Picture?
Reading The Traffic SituationReading The Traffic Situation
Driver A should be reading the traffic situation and recognize that if car B or D were to change lanes suddenly, the drivers of B or D might not see truck A in their blind spot
Accident ReportAccident Report
The accident report would say: I (driver A) had no one in front or behind me. Car B pulled right out in front of me. I could not do anything about it.
Preventability Standpoint Preventability Standpoint
The driver could have done something reasonable to avoid the collision, by moving out of these blind spots.