defense manpower requirements report€¦ · • chapter 7 contains narrative manpower request...
TRANSCRIPT

DEFENSE MANPOWER
REQUIREMENTS REPORT
Fiscal Year 2014
Prepared by
Office of the Assistant Secretary of Defense for Readiness & Force Management
Total Force Planning & Requirements Directorate
August 2013

i
TABLE OF CONTENTS
PREFACE ...................................................................................................................... IV
Introduction................................................................................................................................................... iv Organization of the Report ........................................................................................................................... iv Manpower Requirements Overview ............................................................................................................. iv The Total Force ............................................................................................................................................. v
CHAPTER 1: DEPARTMENT OVERVIEW .................................................................... 1
Table 1-1: Department of Defense Manpower Totals .................................................................................. 2 Table 1-2a: Active Military Manpower Totals by Personnel Category ......................................................... 3 Table 1-2b: Selected Reserve Military Manpower Totals by Personnel Category ...................................... 3 Table 1-3: Major Military Force Units ........................................................................................................... 4 Table 1-4: Active Military Manpower in Units and Individuals Account ....................................................... 5
CHAPTER 2: SERVICE AND DEFENSE-LEVEL SUMMARIES ................................... 6
Table 2-1a: Army Military and Civilian Manpower by Force and Infrastructure Category ........................... 7 Table 2-1b: Navy Military and Civilian Manpower by Force and Infrastructure Category............................ 8 Table 2-1c: Marine Corps Military and Civilian Manpower by Force and Infrastructure Category .............. 9 Table 2-1d: Air Force Military and Civilian Manpower by Force and Infrastructure Category ................... 10 Table 2-2: Military Technicians Assigned, Authorized, and Required by Status and Organization ........... 11 Table 2-3: Full-Time Support to the Selected Reserves ............................................................................ 12 Table 2-4: Manpower in Defense-Level Activities and Accounts ............................................................... 13 Table 2-5: Service-Level Manpower Required to be Stationed in Foreign Countries and Ships Afloat .... 16 Table 2-6: Major Headquarters Activities ............................................................................... ………….….17
CHAPTER 3: OFFICER AND ENLISTED FLOW DATA ............................................. 19
Table 3-1a: Army Active Duty Officer Gains and Losses ........................................................................... 20 Table 3-1b: Navy Active Duty Officer Gains and Losses ........................................................................... 23 Table 3-1c: Marine Corps Duty Officer Gains and Losses ........................................................................ 26 Table 3-1d: Air Force Active Duty Officer Gains and Losses .................................................................... 29 Table 3-2a: Army Active Duty Officer Retirements by YOCS .................................................................... 32 Table 3-2b: Navy Active Duty Officer Retirements by YOCS .................................................................... 35 Table 3-2c: Marine Corps Active Duty Officer Retirements by YOCS ....................................................... 38 Table 3-2d: Air Force Active Duty Officer Retirements by YOCS .............................................................. 41 Table 3-3a: Army Active Duty Enlisted Gains and Losses ........................................................................ 44 Table 3-3b: Navy Active Duty Enlisted Gains and Losses ......................................................................... 47 Table 3-3c: Marine Corps Active Duty Enlisted Gains and Losses ........................................................... 50 Table 3-3d: Air Force Active Duty Enlisted Gains and Losses .................................................................. 53 Table 3-4a: Active Duty Army Enlisted Member Retirements by YOS ...................................................... 56 Table 3-4b: Active Duty Navy Enlisted Member Retirements by YOS ...................................................... 59 Table 3-4c: Active Duty Marine Corps Enlisted Member Retirements by YOS ......................................... 62 Table 3-4d: Active Duty Air Force Enlisted Member Retirements by YOS ................................................ 65
CHAPTER 4: DIVERSITY DEMOGRAPHIC DATA ..................................................... 67
Table 4-1a: Army Active Duty Demographic Data ..................................................................................... 69 Table 5-1b: Navy Active Duty Demographic Data ..................................................................................... 70

ii
Table 4-1c: Marine Corps Active Duty Demographic Data ........................................................................ 71 Table 4-1d: Air Force Active Duty Demographic Data ............................................................................... 72 Table 4-1e: DoD Active Duty Demographic Data ...................................................................................... 73 Table 4-2a: Army Selected Reserve Demographic Data ........................................................................... 74 Table 4-2b: Navy Selectede Reserve Demographic Data ......................................................................... 77 Table 4-2c: Marine Corps Selected Reserve Demographic Data .............................................................. 78 Table 4-2d: Air Force Selected Reserve Duty Demographic Data ............................................................ 79 Table 4-2e: DoD Selected Reserve Demographic Data ............................................................................ 82 Table 4-3a: Army Active Duty Promotion Dempgraphics .......................................................................... 83 Table 4-3b: Navy Active Duty Promotion Demographics ........................................................................... 84 Table 4-3c: Marine Corps Active Duty Promotion Demographics ............................................................. 85 Table 4-3e: Air Force Active Duty Promotion Demographics .................................................................... 86 Table 4-4a: Army Selected Reserve Promotion Demographics ................................................................ 87 Table 4-4b: Navy Selected Reserve Promotion Demographics ................................................................ 89 Table 4-4b: Marine Corps Selected Reserve Promotion Demographics ................................................... 90 Table 4-4b: Air Force Selected Reserve Promotion Demographics .......................................................... 91 Table 4-5a: Army Active Duty Reenlistment and Extension Demographics .............................................. 93 Table 4-5b: Navy Active Duty Reenlistment and Extension Demographics .............................................. 93 Table 4-5c: Marine Corps Active Duty Reenlistment and Extension Demographics ................................. 94 Table 4-5d: Air Force Active Duty Reenlistment and Extension Demographics ....................................... 94 Table 4-6a: Army Selected Reserve Reenlistment Demographics ........................................................... 95 Table 4-6b: Navy Selected Reserve Reenlisment Demographics ............................................................. 96 Table 4-6c: Marine Corps Selected Reserve Reenlisment Demographics ............................................... 96 Table 4-6d: Air Force Selected Reserve Reenlisment Demographics ...................................................... 97 Table 4-6e: Army Selected Reserve Extension Demographics ................................................................. 98 Table 4-6f: Navy Selected Reserve Extension Demographics ................................................................. 99 Table 4-6g: Marine Corps Selected Reserve Extension Demographics ................................................... 99 Table 4-6h: Air Force Selected Reserve Extension Demographics ........................................................ 100
CHAPTER 5: MEDICAL MANPOWER REQUIREMENTS ........................................ 101
Table 5-1: DoD Medical Manpower Program ........................................................................................... 102 Table 5-1a: Army Medical Manpower Program ........................................................................................ 102 Table 5-1b: Navy Medical Manpower Program......................................................................................... 103 Table 5-1c: Air Force Medical Manpower Program .................................................................................. 103
CHAPTER 6: INVENTORY OF CONTRACTS FOR SERVICES ............................... 104
Table 6-1: Results of FY2010 Inventory of Contracts for Services ........................................................... 104 Table 6-2: Results of FY2011 Inventory of Contracts for Services ........................................................... 105
CHAPTER 7: MANPOWER REQUEST JUSTIFICATIONS ...................................... 106
Army Manpower Request ......................................................................................... 106
Introduction................................................................................................................................................ 106 Military Manpower ..................................................................................................................................... 107 Civilian Manpower: .................................................................................................................................... 107
Navy Manpower Request .......................................................................................... 109
Introduction................................................................................................................................................ 109 Key Manpower Issues ............................................................................................................................... 109 Conclusion................................................................................................................................................. 111

iii
Marine Corps Manpower Request............................................................................ 112
Introduction................................................................................................................................................ 112 Active Component .................................................................................................................................... 113 Reserve Component ................................................................................................................................ 114 Civilian Manpower ..................................................................................................................................... 115
Air Force Manpower Request ................................................................................... 116
Introduction................................................................................................................................................ 116 Active Component …… ............................................................................................................................. 117 Reserve Component ................................................................................................................................. 117 Civilian Manpower ..................................................................................................................................... 118 Conclusion................................................................................................................................................. 118

iv
Preface
Introduction The Department of Defense hereby provides the Defense Manpower Requirements
Report (DMRR) for fiscal year (FY) 2014 in compliance with Section 115a of Title 10, United States Code (U.S.C.). This report should be used in conjunction with the FY2014 Budget.
Organization of the Report
This report explains the Department of Defense (DoD) manpower requirements incorporated in the President's Budget for FY2014. The report is organized into seven chapters.
• Chapter 1 contains an overview of the total number of Defense-wide personnel both military and civilian. It provides a clear and succinct picture of manpower in the Department and provides the basis for the rest of this report.
• Chapter 2 shows the estimated manpower requirements by force and infrastructure categories for each of the Services along with details on military technicians, numbers that provide full-time support to the Selected Reserves, the manpower in the Defense-level activities and accounts, manpower required to be stationed overseas and afloat, and manpower assigned to major headquarters activities.
• Chapter 3 shows the flow of active duty officer and enlisted personnel through each of the Services for the current and next five FYs. It provides a general summary of the flow, listing beginning and end strength numbers by officer and enlisted grades accounting for retirements, promotions, deaths, etc. It also provides a more detailed look at retirements individually by pay grade and years of service.
• Chapter 4 contains demographic data for FY2012. It provides a general summary of the ethnicity, race and gender by Service. It also provides demographic data on promotions, reenlistments and extensions Service and grade.
• Chapter 5 contains medical manpower requirements and justifications. It displays the number of military medical personnel by corps or designation, for both the active and Reserve component within the DoD.
• Chapter 6 provides Inventory for Contracts for Services data and provides a general summary of the Department’s efforts in this area. This inventory is used to assess the service contracts awarded and estimate the size of the contractor workforce. Data is provided for FY2011 and FY2010.
• Chapter 7 contains narrative manpower request justifications from the Services.
Manpower Requirements Overview Our Armed Services represent the most capable military forces ever assembled –
enabled by a superb All Volunteer Force. Each day, Soldiers, Sailors, Marines, and Airmen serve proudly throughout the world, often in harm’s way. They are supported by thousands of DoD civilians and contractors, many of whom serve alongside them in overseas locations. Operations in Afghanistan and elsewhere have stressed our military forces, requiring increases to active component (AC) end strengths and extensive use of our Reserve component (RC). This clearly demonstrates the flexibility inherent in our All Volunteer Force.
In addition to fielding operating forces, the Department has a substantial commitment to supporting many Defense and non-DoD missions/organizations. Table 2-4 in Chapter 2 provides information on military manpower assigned outside the parent Services.

v
Manpower is not a requirement in itself. Our manpower investments must complement
those in many areas, such as platforms, weapons, maintenance, and training, to deliver capabilities (such as battlespace awareness and logistics). These capabilities are the real requirements. For manpower, we believe it is important that all the Services define their workload requirements such that capabilities can be operationalized in a cost-effective manner. Otherwise, we would fail to have adequate funds to pay for other required capability enablers. In addition to arriving at a fiscally informed Total Force manpower solution(s), we must work with the Services to ensure personnel policies, including compensation, are aligned to help attract, develop, and retain the All Volunteer Force's soldiers, sailors, marines, and airmen.
The Total Force The data within this report are broken down by many of the various components that
make up the Total Force. This section provides a description of all of the components of the Total Force in order to better help the reader understand and interpret the rest of the report.
The structure of our Armed Forces is based on the DoD Total Force Policy that recognizes various components' contributions to national security. Those components include the Active and Reserve components, the civilian work force, DoD contractors, and host nation support. • Active Component (AC) Military. The AC military are those full-time military men and
women who serve in units that engage enemy forces, provide support in the combat theater, provide other support, or who are in special accounts (transients, students, etc.). These men and women are on call 24 hours a day and receive full-time military pay.
• Reserve Component (RC) Military. The RC military is composed of both Reserve and
Guard forces. The Army, Navy, Marine Corps, and Air Force Reserves each consist of three specific categories: Ready Reserve, Standby Reserve, and Retired Reserve. The Army and Air National Guards are composed solely of Ready Reserve personnel.
o Ready Reserve. The Ready Reserve consists of RC units, individual reservists
assigned to AC units, and individuals subject to recall to active duty to augment the active forces in time of war or national emergency. The Ready Reserve consists of three subgroups: the Selected Reserve, the Individual Ready Reserve, and the Inactive National Guard.
Selected Reserve (SELRES). The SELRES is composed of those units and
individuals designated by their respective Services and approved by the Chairman, Joint Chiefs of Staff, as so essential to initial wartime missions that they have priority for training, equipment, and personnel over all other Reserve elements. The SELRES is composed of Reserve unit members, individual mobilization augmentees (IMAs), and Active Guard and Reserve (AGR) members. Reserve unit members are assigned against RC force structure, IMAs are assigned to, and trained for, AC organizations or Selective Service System or Federal Emergency Management Agency billets, and AGRs are full–time Reserve members who support the recruiting, organizing, training, instructing, and administration of the RCs.
Individual Ready Reserve (IRR). The IRR is a manpower pool consisting mainly of
trained individuals who have previously served in AC units or in the SELRES. IRR

vi
members are liable for involuntary active duty for training and fulfillment of mobilization requirements.
Inactive National Guard (ING). The ING consists of Army National Guard personnel
who are in an inactive status (the term does not apply to the Air National Guard). Members of the ING are attached to National Guard units but do not actively participate in training activities. Upon mobilization, they would mobilize with their units. To remain members of the ING, individuals must report annually to their assigned unit.
o Standby Reserve. Personnel assigned to the Standby Reserve have completed all
obligated or required service or have been removed from the Ready Reserve because of civilian employment, temporary hardship, or disability. Standby Reservists maintain military affiliation, but are not required to perform training or to be assigned to a unit.
o Retired Reserve. The category of the Reserve component consisting of those Reserve
component members who have transferred after qualifying for non-regular retirement and not in receipt of retired or retainer pay; or those in receipt of retired or retainer pay for having achieved the requisite years of service, age of entitlement or physical disability.
• Civilian Component. Civilians include U. S. citizens and foreign nationals on DoD’s direct
payroll, as well as foreign nationals hired indirectly through contractual arrangement with overseas host nations. This category does not include those paid through non-appropriated fund (NAF) activities.
• Contracted Services Component. DoD uses service contracts to: a) acquire specialized
knowledge and skills not available in DoD; b) obtain temporary or intermittent services; and c) obtain more cost-effective performance of various commercial-type functions available in the private sector.
• Host Nation Support Component. Host nation military and civilian personnel support, as
identified in international treaties and status of forces agreements, represents a cost-effective alternative to stationing U. S. troops and civilians overseas.

PAGE INTENTIONALY LEFT BLANK
1
Chapter 1: Department Overview
The tables in this chapter provide an overview of Defense-wide manpower, both military and civilian. They give the most succinct picture of manpower in the Department for the previous, current, and next FYs, and provide the basis for the rest of this report. A more specific summary of each table follows.
Table 1-1 gives an overview of total Department manpower for the previous, current, and next FYs broken down by Service, Active/Reserve, and Civilians. Table 1-1 provides a picture of all Defense-wide manpower, which the rest of the tables in this report will expand upon in greater depth.
Table 1-2a shows the active component military manpower totals by personnel category (i.e., officer, enlisted, and cadet/midshipmen) for each Service for the previous, current, and next FYs. Table 1-2b shows the same information for the RCs.
Table 1-3 presents the numbers of major military force units (land, air, naval, mobility, strategic, C4ISR) supported by the overall manpower by type and component, for the previous, current, and next FYs.
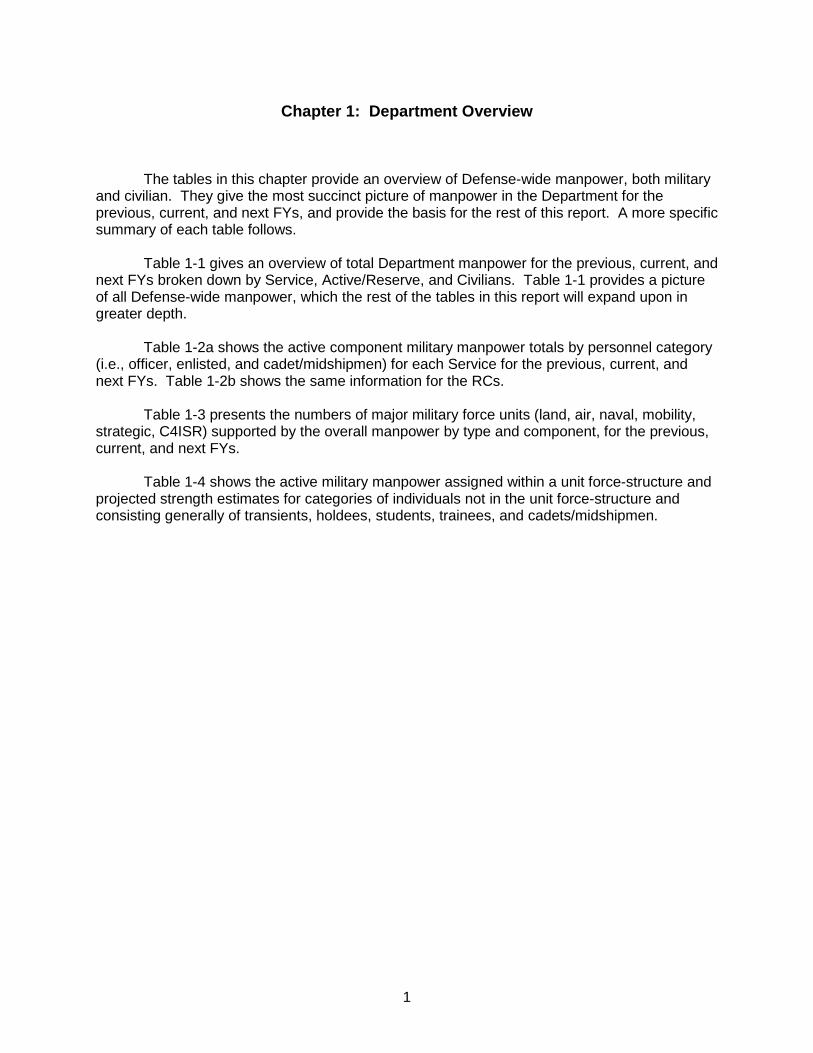
Table 1-4 shows the active military manpower assigned within a unit force-structure and projected strength estimates for categories of individuals not in the unit force-structure and consisting generally of transients, holdees, students, trainees, and cadets/midshipmen.

2
Table 1-1: Department of Defense Manpower Totals Service Category FY12
ActualFY13
EstimateFY14
EstimateActive:
Military/1 550.1 502.4 490.0Civilian 275.0 273.1 264.0Subtotal 825.1 777.1 755.7
Selected Reserve:National Guard 358.1 358.2 354.2Reserve 201.2 205.0 205.0Subtotal 559.3 563.2 559.2
Total, Military 1,109.4 1,065.6 1,049.2Total, Army 1,384.4 1,338.7 1,313.2Active:
Military 318.4 322.7 323.6Civilian 190.2 188.7 190.4Subtotal 511.7 510.4 513.0
Selected Reserve 64.7 62.5 59.1Total, Military 383.1 385.2 382.7Total, Navy 573.3 573.9 573.1Active:
Military/2 198.2 197.3 190.2Civilian 22.3 23.6 24.0Subtotal 220.5 220.9 214.2
Selected Reserve 39.5 39.6 39.6Total, Military 237.7 236.9 229.8Total, Marine Corps 260.0 260.5 253.8Active:
Military 333.0 329.5 327.6Civilian 182.0 188.4 185.4Subtotal 515.0 517.9 513.0
Selected Reserve:National Guard 105.4 105.7 105.4Reserve 71.4 70.9 70.4Subtotal 176.8 176.6 175.8
Total, Military 509.8 506.0 503.4Total, Air Force 691.8 694.4 688.8
MilitaryCivilian 130.2 137.2 136.9
Active:Military 1,399.7 1,351.9 1,331.4Civilian 799.7 811.0 800.7Subtotal 2,199.4 2,162.9 2,132.1
Selected Reserve:National Guard 463.5 463.9 459.6Reserve 376.8 378.0 374.1Subtotal 840.3 841.9 833.7
Total, Military 2,240.0 2,193.7 2,165.1Total, DoD 3,039.7 3,004.8 2,965.8
Total DoD
Included in Service totals
Army
Navy
Marine Corps
Air Force
Defense-Wide
Numbers may not add due to rounding. # in Thousands
1 - Includes OCO end strength for FY12; 2- Includes OCO end strength for FY12-FY14

3
Table 1-2a: Active Military Manpower Totals by Personnel Category Service Category FY12 Actual FY13
EstimateFY14
EstimateCommissioned/Warrant Officers 98.4 84.8 92.8Enlisted Personnel 447.1 413.1 392.8Cadets 4.6 4.5 4.4Total 550.1 502.4 490.0Commissioned/Warrant Officers 52.8 51.3 53.4Enlisted Personnel 261.1 266.9 265.9Midshipmen 4.5 4.5 4.3Total 318.4 322.7 323.6Commissioned/Warrant Officers 21.8 21.2 21.5Enlisted Personnel 176.4 176.1 168.7Cadets 0.0 0.0 0.0Total 198.2 197.3 190.2Commissioned Officers 65.0 65.0 64.7Enlisted Personnel 263.9 260.5 258.9Cadets 4.0 4.0 4.0Total 333.0 329.5 327.6Commissioned/Warrant Officers 238.0 222.3 232.3Enlisted Personnel 1,148.5 1,116.6 1,086.4Cadets/Midshipmen 13.1 13.0 12.7Total 1,425.1 1,419.9 1,401.0
Numbers may not add due to rounding. # in Thousands
Total Active Duty
Army/1
Navy
Marine Corps/2
Air Force
1 - Includes OCO end strength for FY12; 2- Includes OCO end strength for FY12-FY14
Table 1-2b: Selected Reserve Military Manpower Totals by Personnel Category Component Category FY12 Actual FY13
EstimateFY14
EstimateCommissioned/Warrant Officers 44.4 44.4 44.4Enlisted Personnel 313.7 313.8 309.8Total 358.1 358.2 354.2Commissioned/Warrant Officers 35.2 42.0 42.0Enlisted Personnel 166.0 163.0 163.0Total 201.2 205.0 205.0Commissioned/Warrant Officers 14.2 14.9 14.7Enlisted Personnel 50.5 47.6 44.4Total 64.7 62.5 59.1Commissioned/Warrant Officers 3.9 4.0 3.9Enlisted Personnel 35.6 35.6 35.7Total 39.5 39.6 39.6Commissioned Officers 14.3 14.3 14.6Enlisted Personnel 91.1 91.4 90.8Total 105.4 105.7 105.4Commissioned Officers 14.3 15.7 15.7Enlisted Personnel 57.1 55.2 54.7Total 71.4 70.9 70.4Commissioned/Warrant Officers 126.3 135.3 135.3Enlisted Personnel 714.0 702.6 698.4Total 840.3 837.9 833.7
Numbers may not add due to rounding. # in Thousands
Air National Guard
Air Force Reserve
Total Selected Reserve
Army National Guard
Army Reserve
Navy Reserve
Marine Corps Reserve

4
Table 1-3: Major Military Force Units Major Force Program Component FY12
ActualFY13
EstimateFY14
EstimateStrategic Forces
Active 9 9 9Guard/Reserve 0 0 0
Ballistic Missle Submarines (SSBN) Active 14 14 14ICBMs Active 450 450 450
Land ForcesActive 10 10 10Guard/Reserve 8 8 8Active 45 44 40Guard/Reserve 28 28 28Active 3 3 3Guard/Reserve 1 1 1
Air ForcesActive 31 31 31Guard/Reserve 31 31 31Active 76 76 78Guard/Reserve 3 3 3Active 65 65 65Guard/Reserve 9 9 9
Navy ASW and FAD Squadrons Active 35 35 35Guard/Reserve 3 3 3Active 4 4 4Guard/Reserve 5 4 4
Naval ForcesAmphibious Assault Ships Active 30 31 31Attack Submarines Active 54 55 55Guided Missile Submarines (SSGN) Active 4 4 4
Active 24 24 23Guard/Reserve 0 0 0Active 104 99 106Guard/Reserve 7 2 2
C4ISRCounter Drug Support Squadrons Active 0 0 0
Guard/Reserve 0 0 0Active 18 18 19Guard/Reserve 4 4 5Active 33 33 33Guard/Reserve 21 21 21
Mobility ForcesAir Force Airlift Squadrons Active 23 23 21
Guard/Reserve 39 39 39Air Refueling Squadrons Active 14 14 14
Guard/Reserve 26 26 26Naval Fixed Wing Airlift Squadrons Active 2 2 2
Guard/Reserve 12 11 11Active 2 2 2Guard/Reserve 0 0 0Naval Auxiliary Ships 0 0 0Military Sealift Command Ships 174 177 180
Navy Special Mission Squadrons
Marine Squadrons
Army Divisions
Air Offense Squadrons
Carrier Squadrons
Air Force Squadrons
Marine Divisions
Brigade Combat Teams (BCTs)*
Sealift Forces
Space Squadrons
Reconnaissance
Patrol Ships/Mine Warfare Ships
Surface Combatants
* BCTs are counted at EDATE (beginning of activation or conversion), active BCTs take 12 months and ARNG BCTs take 48 months to convert / activate.
Naval Rotary Wing Heavy Lift Squadrons
5
Table 1-4: Active Military Manpower in Units and Individuals Account
Officer Enlisted Total Officer Enlisted Total Officer Enlisted TotalIn Units 82.4 401.0 483.4 72.6 359.6 432.2 76.1 349.9 426.0Individuals:
Transients 0.8 6.0 6.8 1.0 9.9 10.9 1.0 5.4 6.4Trainees/Students 15.2 33.2 48.4 11.1 42.3 53.4 15.5 34.2 49.7Cadets 4.6 0.0 4.6 4.5 0.0 4.5 4.4 0.0 4.4Patients/Prisoners/ Holdees 0.3 3.9 4.2 0.1 1.3 1.4 0.2 3.3 3.5Undistributed Manning 0.0 0.0 0.0 0.0 0.0 0.0 0.0 0.0 0.0
Total End Strength 103.3 444.1 547.4 89.3 413.1 502.4 97.2 392.8 490.0In Units 45.6 230.6 276.2 43.9 233.4 277.3 46.0 232.7 278.7Individuals:
Transients 1.2 7.0 8.2 1.4 7.5 8.9 1.3 7.2 8.5Trainees/Students 6.0 22.0 28.0 6.0 24.0 30.0 6.1 24.0 30.1Midshipmen 4.5 0.0 4.5 4.5 0.0 4.5 4.3 0.0 4.3Patients/Prisoners/ Holdees 0.0 1.5 1.5 0.0 2.0 2.0 0.0 2.0 2.0Undistributed Manning 0.0 0.0 0.0 0.0 0.0 0.0 0.0 0.0 0.0
Total End Strength 57.3 261.1 318.4 55.8 266.9 322.7 57.7 265.9 323.6In Units 18.7 149.3 168.0 17.2 151.9 169.1 17.6 143.7 161.3Individuals:
Transients 1.0 3.9 4.9 0.4 3.4 3.8 0.5 3.5 4.0Trainees/Students 2.0 21.6 23.6 3.5 20.1 23.6 3.4 20.4 23.9Patients/Prisoners/ Holdees 0.0 1.7 1.7 0.0 0.7 0.7 0.0 1.0 1.1Undistributed Manning 0.0 0.0 0.0 0.0 0.0 0.0 0.0 0.0 0.0
Total End Strength 21.8 176.4 198.2 21.2 176.1 197.3 21.5 168.7 190.2In Units 57.3 241.8 299.1 56.8 241.0 297.8 56.9 240.2 297.1Individuals:
Transients 0.0 0.0 0.0 0.8 3.5 4.3 0.8 3.5 4.3Trainees/Students 7.7 22.0 33.6 6.5 15.2 21.7 6.4 15.0 21.4Cadets 4.0 0.0 4.0 4.0 0.0 4.0 4.0 0.0 4.0Patients/Prisoners/ Holdees 0.0 0.2 0.2 0.0 0.2 0.2 0.0 0.2 0.2Undistributed Manning 0.0 0.0 0.0 0.9 0.6 1.5 0.6 0.0 0.6
Total End Strength 69.0 264.0 333.0 69.0 260.5 329.5 68.6 259.0 327.6In Units 204.0 1,022.7 1,226.7 190.5 985.9 1,176.4 196.6 966.5 1,163.1Individuals:
Transients 0.1 16.9 17.0 0.1 24.3 24.4 0.0 19.6 19.6Trainees/Students 8.4 98.8 107.2 37.7 101.6 139.3 4.0 93.6 97.6Cadets/Midshipmen 13.1 1.7 14.8 13.0 0.7 13.7 12.7 1.0 13.7Patients/Prisoners/ Holdees 0.4 5.6 182.4 0.1 3.5 181.2 0.2 5.5 175.0Undistributed Manning 0.0 176.4 176.4 0.9 176.7 177.6 0.6 168.7 169.3
Total End Strength 251.4 1,145.6 1,724.4 235.3 1,116.6 1,712.7 245.1 1,086.4 1,638.4
FY13 Estimate
Army/1
Service
1 - Includes OCO end strength for FY12; 2- Includes OCO end strength for FY12-FY14
Account
Navy
Marine Corps/2
Air Force
Total DoD
# in ThousandsNumbers may not add due to rounding.
FY14 EstimateFY12 Actual

6
Chapter 2: Service and Defense-Level Summaries
The tables in this chapter show the estimated manpower requirements by force and infrastructure categories for each of the Services along with details on military technicians, numbers that provide full-time support to the Reserve, the manpower in the Defense-level activities and accounts, and manpower required to be stationed overseas and afloat. A more specific summary of each table follows.
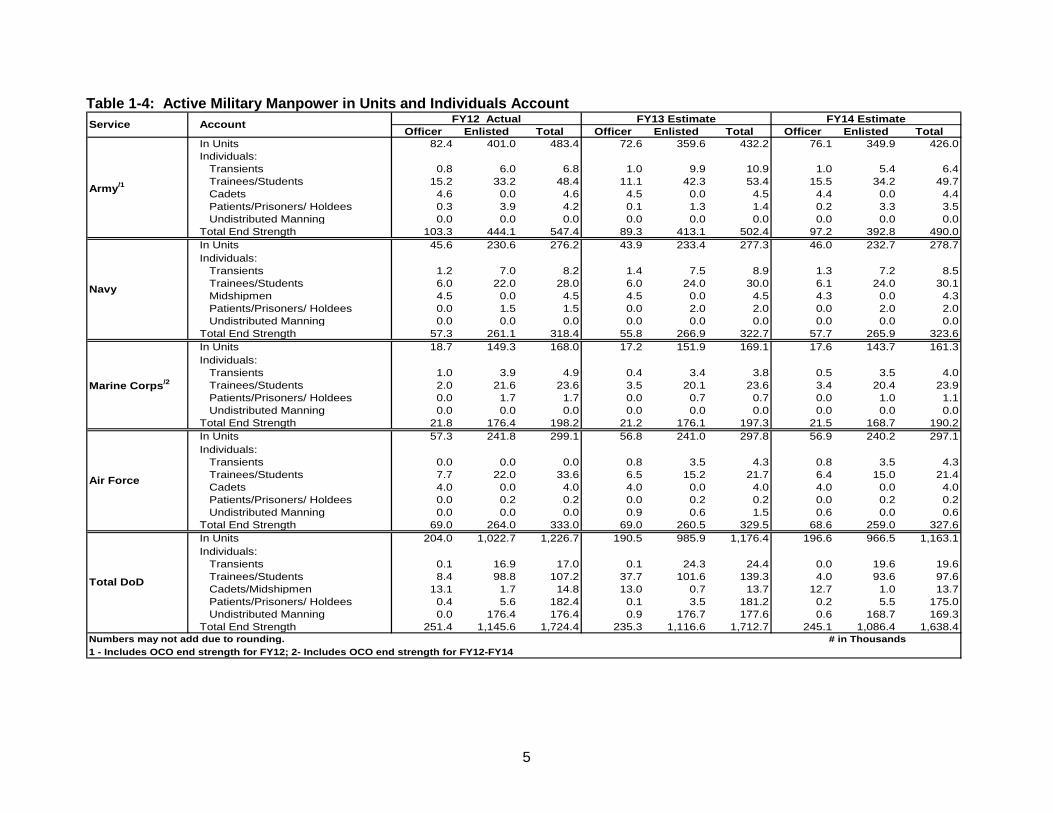
Tables 2-1a through 2-1d give end strength summaries for total military and civilian manpower by force and infrastructure for the previous, current, and next FYs. The table is broken down into two halves. The first half contains force totals and three sub-categories of expeditionary forces, deterrence and protection forces, and other forces. The second half has the infrastructure totals in 11 sub-categories ranging from logistics and communication to training, science and technology. Each table also includes a grand total and the percentage of the total that the infrastructure represents.
Table 2-2 shows the numbers of military technicians assigned, authorized, and required by status and organization for the previous, current, and next FYs for the Army and Air Force. Totals are given in thousands for both high-priority units and other units for dual and non-dual status individuals.
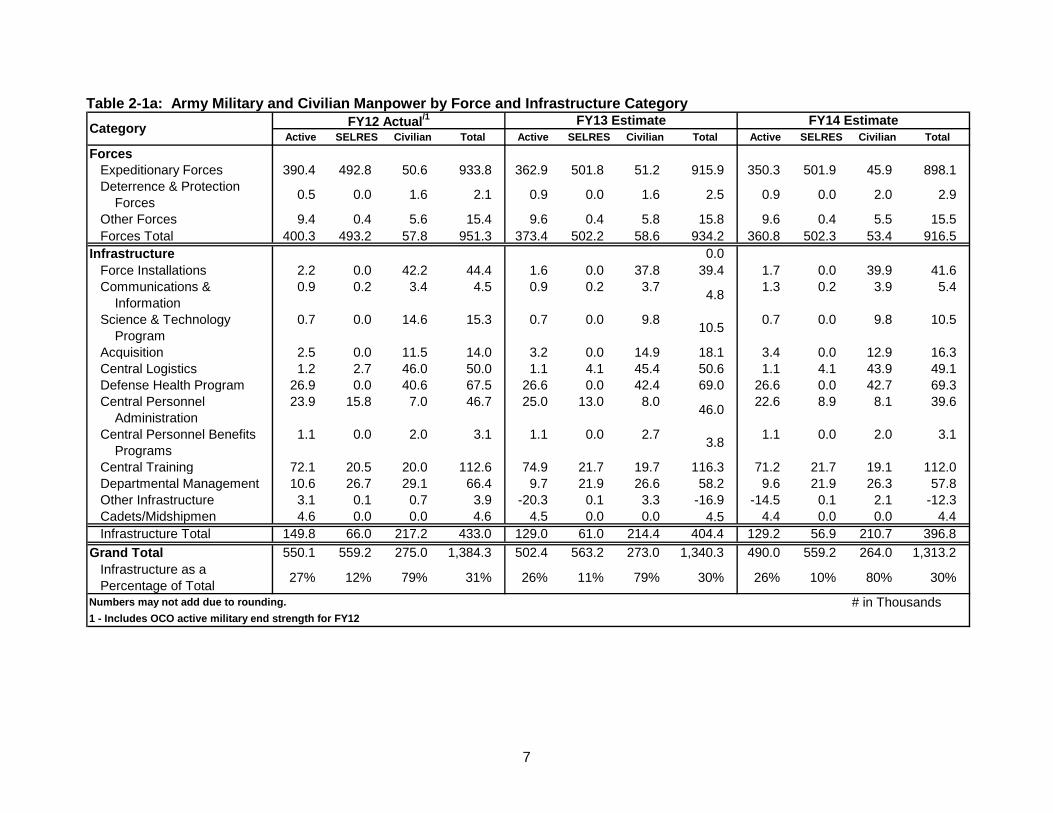
Table 2-3 shows the full-time support to the Selected Reserve for the previous, current, and next FYs. Sub-totals for AGR, technicians, and civilian are given for each RC.
Table 2-4 shows the manpower in Defense-level activities and accounts for the previous, current, and next FYs. Components are organized in sub-categories of Office of the Secretary of Defense (OSD) level, Defense Agencies, Defense Field Activities, Other Defense-Wide Organizations, Joint Staff and Unified/Combined Commands, and Program Manager Manpower.
Table 2-5 shows the Service-level manpower required to be stationed in foreign countries and ships afloat for previous, current, and next FYs.
7
Table 2-1a: Army Military and Civilian Manpower by Force and Infrastructure Category
Active SELRES Civilian Total Active SELRES Civilian Total Active SELRES Civilian TotalForces
Expeditionary Forces 390.4 492.8 50.6 933.8 362.9 501.8 51.2 915.9 350.3 501.9 45.9 898.1Deterrence & Protection Forces 0.5 0.0 1.6 2.1 0.9 0.0 1.6 2.5 0.9 0.0 2.0 2.9
Other Forces 9.4 0.4 5.6 15.4 9.6 0.4 5.8 15.8 9.6 0.4 5.5 15.5Forces Total 400.3 493.2 57.8 951.3 373.4 502.2 58.6 934.2 360.8 502.3 53.4 916.5
Infrastructure 0.0Force Installations 2.2 0.0 42.2 44.4 1.6 0.0 37.8 39.4 1.7 0.0 39.9 41.6Communications & Information
0.9 0.2 3.4 4.5 0.9 0.2 3.7 4.8 1.3 0.2 3.9 5.4
Science & Technology Program
0.7 0.0 14.6 15.3 0.7 0.0 9.8 10.5 0.7 0.0 9.8 10.5
Acquisition 2.5 0.0 11.5 14.0 3.2 0.0 14.9 18.1 3.4 0.0 12.9 16.3Central Logistics 1.2 2.7 46.0 50.0 1.1 4.1 45.4 50.6 1.1 4.1 43.9 49.1Defense Health Program 26.9 0.0 40.6 67.5 26.6 0.0 42.4 69.0 26.6 0.0 42.7 69.3Central Personnel Administration
23.9 15.8 7.0 46.7 25.0 13.0 8.0 46.0 22.6 8.9 8.1 39.6
Central Personnel Benefits Programs
1.1 0.0 2.0 3.1 1.1 0.0 2.7 3.8 1.1 0.0 2.0 3.1
Central Training 72.1 20.5 20.0 112.6 74.9 21.7 19.7 116.3 71.2 21.7 19.1 112.0Departmental Management 10.6 26.7 29.1 66.4 9.7 21.9 26.6 58.2 9.6 21.9 26.3 57.8Other Infrastructure 3.1 0.1 0.7 3.9 -20.3 0.1 3.3 -16.9 -14.5 0.1 2.1 -12.3Cadets/Midshipmen 4.6 0.0 0.0 4.6 4.5 0.0 0.0 4.5 4.4 0.0 0.0 4.4Infrastructure Total 149.8 66.0 217.2 433.0 129.0 61.0 214.4 404.4 129.2 56.9 210.7 396.8
Grand Total 550.1 559.2 275.0 1,384.3 502.4 563.2 273.0 1,340.3 490.0 559.2 264.0 1,313.2 Infrastructure as a Percentage of Total 27% 12% 79% 31% 26% 11% 79% 30% 26% 10% 80% 30%
Numbers may not add due to rounding. # in Thousands1 - Includes OCO active military end strength for FY12
FY12 Actual/1 FY13 Estimate FY14 EstimateCategory

8
Table 2-1b: Navy Military and Civilian Manpower by Force and Infrastructure Category
Active SELRES Civilian Total Active SELRES Civilian Total Active SELRES Civilian TotalForces
Expeditionary Forces 164.2 26.1 45.1 235.4 163.1 23.5 46.0 232.6 160.8 20.8 45.2 226.8Deterrence & Protection Forces 7.1 0.1 4.7 12.0 7.2 0.1 3.1 10.4 7.3 0.1 6.8 14.2
Other Forces 20.1 5.5 3.5 29.1 20.2 5.5 3.6 29.3 20.5 5.5 3.8 29.8Forces Total 191.4 31.7 53.3 276.5 190.5 29.1 52.7 272.3 188.6 26.4 55.8 270.8
InfrastructureForce Installations 17.7 5.8 27.0 50.5 17.2 5.2 26.2 48.6 17.1 5.6 25.3 48.0Communications & Information
3.4 0.6 1.0 5.0 3.6 0.6 1.1 5.3 4.1 0.6 1.4 6.1
Science & Technology Program
0.0 0.0 0.0 0.0 0.0 0.0 0.0 0.0 0.0 0.0 0.0 0.0
Acquisition 3.1 0.5 47.2 50.8 3.1 0.5 47.2 50.8 3.0 0.5 47.3 50.8Central Logistics 6.5 6.9 23.1 36.5 6.5 6.8 23.1 36.4 7.3 6.2 23.0 36.5Defense Health Program 27.7 0.0 12.5 40.2 28.3 0.0 12.4 40.7 28.3 0.0 12.2 40.5Central Personnel Administration
16.8 1.9 1.3 20.0 16.8 1.9 1.3 20.0 16.5 1.9 1.4 19.8
Central Personnel Benefits Programs
1.3 0.2 3.3 4.8 1.3 0.2 3.5 5.0 1.3 0.2 3.4 4.9
Central Training 33.9 2.8 6.8 43.5 39.1 2.8 6.3 48.2 41.8 2.8 6.1 50.7Departmental Management 8.7 9.2 13.1 31.0 8.8 10.3 13.4 32.5 8.7 9.7 12.5 30.9Other Infrastructure 3.4 5.2 1.7 10.3 3.1 5.2 1.6 9.9 2.6 5.2 1.7 9.5Cadets/Midshipmen 4.5 0.0 0.0 4.5 4.5 0.0 0.0 4.5 4.3 0.0 0.0 4.3Infrastructure Total 127.0 33.1 137.0 297.1 132.3 33.5 136.1 301.9 135.0 32.7 134.5 302.2
Grand Total 318.4 64.8 190.3 567.8 322.8 62.6 188.8 574.2 323.6 59.1 190.3 573.0Infrastructure as a Percentage of Total 40% 51% 72% 52% 41% 54% 72% 53% 42% 55% 71% 53%
Numbers may not add due to rounding. # in Thousands
FY12 Actual FY13 Estimate FY14 EstimateCategory

9
Table 2-1c: Marine Corps Military and Civilian Manpower by Force and Infrastructure Category
Active SELRES Civilian Total Active SELRES Civilian Total Active SELRES Civilian TotalForces
Expeditionary Forces 135.4 33.9 0.5 169.8 134.3 32.9 0.6 167.8 128.5 33.5 0.7 162.7Deterrence & Protection Forces 0.0 0.0 0.0 0.0 0.0 0.0 0.0 0.0 0.0 0.0 0.0 0.0
Other Forces 1.1 0.1 0.2 1.4 1.1 0.3 0.3 1.7 1.0 0.3 0.3 1.6Forces Total 136.5 34.0 0.7 171.2 135.4 33.2 0.9 169.5 129.5 33.8 1.0 164.4
InfrastructureForce Installations 19.3 0.7 11.9 31.9 20.2 0.6 12.6 33.4 18.9 0.5 12.0 31.4Communications & Information
0.0 0.0 0.0 0.0 0.0 0.0 0.0 0.0 0.0 0.0 0.1 0.1
Science & Technology Program
0.0 0.0 0.0 0.0 0.0 0.0 0.0 0.0 0.0 0.0 0.0 0.0
Acquisition 0.7 0.0 0.7 1.4 1.1 0.0 2.3 3.4 1.0 0.0 2.8 3.9Central Logistics 7.3 0.1 5.3 12.6 7.3 0.1 3.4 10.8 7.0 0.1 1.5 8.6Defense Health Program 0.0 0.0 0.0 0.0 0.0 0.0 0.0 0.0 0.0 0.0 0.0 0.0Central Personnel Administration
6.3 0.4 0.5 7.1 6.2 0.3 0.8 7.3 6.0 0.3 1.0 7.3
Central Personnel Benefits Programs
1.1 0.0 1.2 2.3 1.0 0.0 1.4 2.5 1.0 0.0 1.2 2.2
Central Training 23.6 3.5 1.5 28.6 23.7 0.5 1.4 25.6 23.9 0.5 1.5 25.9Departmental Management 2.0 0.9 1.5 4.4 1.4 1.1 0.9 3.4 1.9 1.0 0.8 3.7Other Infrastructure 1.0 0.0 0.0 1.0 1.0 3.6 0.0 4.6 1.0 3.3 0.2 4.6Infrastructure Total 61.3 5.6 22.5 89.4 61.9 6.3 22.7 90.9 60.7 5.8 21.2 87.6
Grand Total 198.2 39.5 23.2 260.9 197.3 39.5 23.6 258.5 190.2 39.6 22.2 251.6 Infrastructure as a Percentage of Total 31% 14% 97% 34% 31% 0% 97% 32% 32% 15% 95% 35%
Numbers may not add due to rounding. # in Thousands1 - Includes OCO active military end strength for FY12-FY14
FY12 Actual/1 FY13 Estimate FY14 EstimateCategory

10
Table 2-1d: Air Force Military and Civilian Manpower by Force and Infrastructure Category
Active SELRES Civilian Total Active SELRES Civilian Total Active SELRES Civilian TotalForces
Expeditionary Forces 174.4 117.6 37.2 329.1 171.4 117.3 37.7 326.5 171.5 116.1 36.9 324.5Deterrence & Protection Forces 7.5 0.4 3.3 11.1 7.3 0.5 2.7 10.6 8.2 0.5 2.6 11.4
Other Forces 29.8 9.7 8.8 48.3 28.9 12.6 9.4 50.9 28.8 12.7 9.5 51.0Forces Total 211.7 127.6 49.0 388.4 207.6 130.4 49.9 387.9 208.5 129.3 49.2 387.0
InfrastructureForce Installations 5.0 10.2 30.8 46.1 5.1 10.2 33.8 49.2 3.7 10.0 32.6 46.3Communications & Information
1.4 0.1 5.2 6.7 1.7 0.1 3.9 5.7 2.0 0.1 4.5 6.5
Science & Technology Program
0.7 0.0 4.4 5.1 0.7 0.0 4.4 5.2 0.7 0.0 4.5 5.2
Acquisition 7.5 0.5 11.8 19.8 8.0 1.2 13.9 23.1 8.1 2.4 14.4 24.9Central Logistics 1.6 0.7 38.9 41.2 1.5 0.9 38.3 40.7 1.5 0.8 37.2 39.5Defense Health Program 30.8 0.0 6.5 37.3 31.2 0.0 6.9 38.1 31.2 0.0 6.7 37.9Central Personnel Administration
3.4 2.1 2.2 7.7 7.7 2.2 2.2 12.1 7.7 2.0 2.3 11.9
Central Personnel Benefits Programs
0.9 0.0 4.5 5.4 1.0 0.0 5.0 5.9 1.0 0.0 5.9 6.8
Central Training 45.3 13.9 13.1 72.3 38.4 10.2 13.9 62.5 38.6 10.3 13.7 62.6Departmental Management 13.6 7.5 12.5 33.6 13.4 7.8 13.2 34.4 12.8 7.4 11.5 31.8Other Infrastructure 7.1 14.2 3.1 24.3 9.1 13.6 3.0 25.7 7.9 13.6 3.0 24.4Cadets/Midshipmen 4.0 0.0 0.0 4.0 4.0 0.0 0.0 4.0 4.0 0.0 0.0 4.0Infrastructure Total 121.3 49.2 133.0 303.4 121.8 46.2 138.5 306.5 119.1 46.5 136.2 301.9
Grand Total 333.0 176.8 182.0 691.8 329.5 176.6 188.4 694.4 327.6 175.8 185.4 688.8 Infrastructure as a Percentage of Total 36% 28% 73% 44% 37% 26% 74% 44% 36% 26% 73% 44%
Numbers may not add due to rounding. # in Thousands
FY12 Actual FY13 Estimate FY14 EstimateCategory

11
Table 2-2: Military Technicians Assigned, Authorized, and Required by Status and Organization
Required 23.6 0.0 23.6 3.6 1.6 5.2 27.2 1.6 28.8Estimate 23.6 0.0 23.6 3.6 1.6 5.2 27.2 1.6 28.8Actual 20.8 0.0 20.8 4.6 1.6 6.2 25.4 1.6 27.0Required 6.7 0.4 7.1 1.7 0.2 1.9 8.4 0.6 9.0Estimate 6.7 0.4 7.1 1.7 0.2 1.9 8.4 0.6 9.0Actual 5.2 0.1 5.3 1.4 0.2 1.6 6.6 0.3 6.9Required 22.5 0.4 22.9 0.0 0.0 0.0 22.5 0.4 22.9Estimate 22.5 0.4 22.9 0.0 0.0 0.0 22.5 0.4 22.9Actual 21.9 0.3 22.2 0.0 0.0 0.0 21.9 0.3 22.2Required 10.8 0.1 10.9 0.0 0.0 0.0 10.8 0.1 10.9Estimate 10.8 0.1 10.9 0.0 0.0 0.0 10.8 0.1 10.9Actual 9.2 0.0 9.2 0.0 0.0 0.0 9.2 0.0 9.2
Required 23.8 0.0 23.8 4.6 1.6 6.2 28.4 1.6 30.0Estimate 23.8 0.0 23.8 4.6 1.6 6.2 28.4 1.6 30.0Required 6.8 0.1 6.9 1.7 0.4 2.1 8.5 0.5 9.0Estimate 6.8 0.1 6.9 1.7 0.4 2.1 8.5 0.5 9.0Required 21.1 0.4 21.5 0.0 0.0 0.0 21.1 0.4 21.5Estimate 21.1 0.4 21.5 0.0 0.0 0.0 21.1 0.4 21.5Required 10.4 0.1 10.5 0.0 0.0 0.0 10.4 0.1 10.5Estimate 10.2 0.1 10.3 0.0 0.0 0.0 10.2 0.1 10.3
Required 24.5 0.0 24.5 2.7 1.6 4.3 27.2 1.6 28.8Estimate 24.5 0.0 24.5 2.7 1.6 4.3 27.2 1.6 28.8Required 6.8 0.1 6.9 1.7 0.4 2.1 8.5 0.5 9.0Estimate 6.8 0.2 7.0 1.6 0.4 2.0 8.4 0.6 9.0Required 21.9 0.3 22.2 0.0 0.0 0.0 21.9 0.3 22.2Estimate 21.9 0.3 22.2 0.0 0.0 0.0 21.9 0.3 22.2Required 10.4 0.1 10.5 0.0 0.0 0.0 10.4 0.1 10.5Estimate 10.3 0.1 10.4 0.0 0.0 0.0 10.3 0.1 10.4
Numbers may not add due to rounding. # in Thousands
Air Force Reserve
Air Force Reserve
Army National Guard
Army Reserve
Air National Guard
Air Force Reserve
Army National Guard
Army Reserve
Air National Guard
FY14 Estimate
FY12 Actual
FY13 Estimate
Army National Guard
Army Reserve
Air National Guard
12
Table 2-3: Full-Time Support to the Selected Reserves Component FY12 Actual FY13 Estimate FY14 EstimateArmy National Guard
Active Guard/Reserve 30.4 32.1 32.1Army Guard Technicians:
Dual Status 25.4 28.4 27.2Non-Dual Status 1.6 1.6 1.6
Active Component with Reserve Unit 0.2 0.2 0.1Civilians 1.1 1.1 1.0Subtotal 58.7 63.4 62.0
Army ReserveActive Guard/Reserve 16.3 16.3 16.3Army Reserve Technicians:
Dual Status 6.6 8.5 8.4Non-Dual Status 0.3 0.5 0.6
Active Component with Reserve Unit 0.0 0.0 0.0Civilians 1.4 3.1 3.1Subtotal 24.6 28.4 28.4
Navy ReserveActive Guard/Reserve 10.4 10.1 10.2Active Component with Reserve Units 2.2 2.2 1.8Civilians 0.9 0.9 0.9Subtotal 13.5 13.2 12.9
Marine Corps ReserveActive Guard/Reserve 2.2 2.3 2.3Active Component with Reserve Units 3.8 3.8 3.8Civilians 0.3 0.2 0.2Subtotal 6.3 6.3 6.3
Air National GuardActive Guard/Reserve 14.7 14.3 14.7Air Guard Technicians:
Dual Status 21.9 21.1 21.9Non-Dual Status 0.3 0.4 0.3
Active Component with Reserve Unit 0.3 0.2 0.3Civilians 0.2 0.2 0.2Subtotal 37.4 36.2 37.4
Air Force ReserveActive Guard/Reserve 2.7 2.9 2.9Air Reserve Technicians:
Dual Status 9.2 10.2 10.3Non-Dual Status 0.0 0.1 0.1
Active Component with Reserve Unit 0.5 0.4 0.5Civilians 3.9 4.0 3.9Subtotal 16.3 17.6 17.7
DoD TotalsActive Guard/Reserve 76.7 78.0 78.5Military Technicians 65.3 70.8 70.4Active Component with Reserve Unit 7.0 6.8 6.5Civilians 7.8 9.5 9.3Total 156.8 165.1 164.7
Numbers may not add due to rounding. # in Thousands

13
Table 2-4: Manpower in Defense-Level Activities and Accounts
Active SELRES Civilian Total Active SELRES Civilian Total Active SELRES Civilian TotalOSD-Level
Office of the Inspector General 28 0 1,516 1,544 28 0 1,614 1,642 28 0 1,614 1,642Office of the Secretary of Defense** 547 167 2,047 2,761 401 167 2,121 2,689 401 167 2,084 2,652
Defense AgenciesDefense Advanced Research Projects Agency (DARPA) 12 0 183 162 17 0 182 199 17 0 182 199
Defense Commissary Agency (DeCA) 4 0 14,689 14,693 4 0 14,710 14,714 4 0 14,700 14,704
Defense Contract Audit Agency† (DCAA) 0 0 4,415 4,415 0 0 5,170 4,978 0 0 5,310 5,310
Defense Contract Management Agency (DCMA) 419 41 9,114 9,574 562 41 10,983 11,586 562 41 11,089 11,692
Defense Finance and Accounting Service (DFAS) 25 0 12,019 12,044 29 0 12,294 12,323 29 0 12,183 12,212
Defense Legal Services Agency (DLSA) 158 0 335 493 206 0 345 551 206 0 148 354
Defense Logistics Agency (DLA) 573 754 26,117 27,444 562 752 27,211 28,525 562 753 26,851 28,166
Defense Security Cooperation Agency (DSCA) 126 0 420 609 126 0 483 609 133 0 483 609
Defense Security Service (DSS) 0 0 874 868 6 0 918 848 6 0 879 885
Defense Threat Reduction Agency (DTRA) 679 1 1,200 1,880 767 1 1,270 2,038 765 1 1,276 2,042
Pentagon Force Protection Agency (PFPA) 14 0 1,201 1,215 14 0 1,305 1,319 14 0 1,290 1,304
Missile Defense Agency (MDA) 135 0 2,243 2,378 135 0 2,464 2,599 134 0 2,732 2,866
FY12 Actual* FY13 Estimate* FY14 Estimate*Activity
*Military end strength numbers shown for information only, accounted for in Service manpower totals. **OSD manpower decremented to show Defense Test Resource Management Center as a separate DoD Field Activity.†OCO FTE's included in DCAA total for FY12

14
Table 2-4 (continued): Manpower in Defense-Level Activities and Accounts
Active SELRES Civilian Total Active SELRES Civilian Total Active SELRES Civilian Total
Defense Field ActivitiesDefense Media Activity (DMA) 941 42 756 1,739 941 42 760 1,743 933 42 751 1,726Defense Human Resources Activity (DHRA) 9 1 1,103 1,113 9 1 1,180 1,190 9 1 1,170 1,180Defense Prisoner of War/ Missing Persons Office (DPMO)
32 0 74 106 46 0 81 127 46 0 80 126
Defense Technical Information Center (DTIC) 0 0 282 282 0 0 282 282 0 0 282 282Defense Technology Security Administration (DTSA)
9 38 138 185 9 38 141 188 9 38 138 185
Defense Test Resource Management Center (DTRMC)
3 0 29 32 3 0 29 32 3 0 29 32
DoD Education & MCFP Managed Programs 1 0 12,861 12,862 1 0 12,901 12,902 1 0 12,901 12,902Office of Economic Adjustment (OEA) 3 0 38 41 3 0 38 41 3 0 38 41Tricare Management Activity1 (TMA) 47 0 5,010 5,057 45 0 5,185 5,230 45 0 5,191 5,236Washington Headquarters Services (WHS) 150 0 1,533 1,683 186 0 1,661 1,847 196 0 2,392 2,588
Other Defense-Wide OrganizationsDefense Acquisition University (DAU) 28 0 465 493 52 0 616 668 52 0 640 692National Defense University (NDU) 188 14 564 766 190 14 567 771 190 14 543 747Uniformed Services University of the Health Sciences (USUHS) 827 0 770 1,597 929 0 728 1,657 929 0 738 1,667
United States Court of Appeals for the Armed Services
0 0 59 59 0 0 59 59 0 0 59 59
Communications and Classified Programs† 9,962 822 47,240 58,024 11,203 900 47,946 60,049 14,533 914 48,400 63,847 *Military end strength numbers shown for information only, accounted for in Service manpower totals. †Includes Defense Information Systems Agency (DISA) and classified programs. /1 Includes Civilian FTEs for Joint Task Force Capital Region Medical (JTF CAPMED) beginning FY12. JTF CAPMED Military reflected in DHP (Service) totals.
FY12 Actual* FY13 Estimate* FY14 Estimate*Activity

15
Table 2-4 (continued): Manpower in Defense-Level Activities and Accounts Table 2-4 (continued): Manpower in Defense-Level Activities and Accounts
Active SELRES Civilian Total Active SELRES Civilian Total Active SELRES Civilian TotalJoint Staff & Unified/Combined Commands
Chairman, Joint Chiefs of Staff (CJCS) Controlled Activities
77 0 2 79 148 12 93 253 188 122 303 613
The Joint Chiefs of Staff (TJS)6
1,482 685 1,003 3,170 1,400 452 1,204 3,056 1,400 452 1,162 3,014
North American Aerospace Defense Cmd. (NORAD)
178 35 64 277 256 40 85 381 269 40 109 418
North Atlantic Treaty Organization (NATO)
2,239 6 18 2,263 2,212 6 100 2,318 2,172 6 83 2,261
US African Command (USAFRICOM)
699 331 687 1,717 759 358 831 1,948 777 358 813 1,948
US Central Command (USCENTCOM)
1,564 550 804 2,918 1,542 562 1,138 3,242 1,521 555 1,071 3,147
US European Command (USEUCOM)
1,676 540 970 3,186 1,526 550 1,071 3,147 1,527 550 1,114 3,191
US Northern Command (USNORTHCOM)
698 98 781 1,577 682 115 887 1,684 682 116 855 1,653
US Pacific Command (USPACOM)
2,008 924 1,103 4,035 2,033 978 1,354 4,365 2,096 978 1,403 4,477
US Southern Command (USSOUTHCOM)
828 225 791 1,844 858 240 829 1,927 875 240 828 1,943
US Special Operations Command (USSOCOM)1
2,700 78 1,771 4,549 2,992 78 1,829 4,899 2,988 78 1,792 4,858
US Strategic Command (USSTRATCOM)
1,971 431 1,492 3,894 1,949 497 2,447 4,893 1,946 497 2,413 4,856
US Transportation Command (USTRANSCOM)2
1,137 697 624 2,458 1,185 708 771 2,664 1,185 708 771 2,664
Program Manager ManpowerDefense Health Program (DHP)3 84,568 0 59,645 144,213 85,077 0 61,637 146,714 85,065 0 61,648 146,713Special Operations Forces (SOF)4 50,066 6,890 6,184 63,140 53,223 6,928 6,342 66,493 56,038 6,661 6,506 69,205
Transportation Working Capital Fund (TWCF)5 12,587 0 4,361 16,948 13,310 0 4,412 17,722 13,310 0 4,482 17,792
4Includes Military Department Major Force Program 11 activities only.1Includes USSOCOM joint activities only. 5Includes Military Department TWCF activities only.2Includes USTRANSCOM joint activities only. Excludes MIP civilians 6JFCOM inactivated FY11; FY12 and FY13 estimates consist of MIP and SOF FYDP only
Activity
*Military end strength numbers and civilian FTEs shown for information only, accounted for in Service or Defense-wide manpower totals.
3Less TRICARE Management Activity and Uniformed Service University of the
FY12 Actual* FY13 Estimate* FY14 Estimate*

16
Table 2-5: Service-Level Manpower Required to be Stationed in Foreign Countries and Ships Afloat
FY12 Actual
FY13 Estimate
FY14 Estimate
FY12 Actual
FY13 Estimate
FY14 Estimate
Army Active Duty 57.0 52.9 50.0 0.0 0.0 0.0Guard/Reserve 12.8 15.1 15.9 0.0 0.0 0.0Civilian 35.2 29.5 29.4 0.0 0.0 0.0Total 105.0 97.5 95.3 0.0 0.0 0.0
Navy Active Duty 16.7 16.7 16.9 119.5 118.7 117.9Reserve 4.0 4.0 4.0 4.4 4.0 4.0Civilian 15.1 15.3 15.3 8.1 7.5 7.9Total 35.8 36.0 36.2 132.0 130.2 129.8
Marine Corps Active Duty 32.2 27.0 27.1 2.5 8.1 8.1Reserve 0.0 0.0 0.0 0.0 0.0 0.0Civilian 4.2 4.3 4.3 0.0 0.0 0.0Total 36.4 31.3 31.4 2.5 8.1 8.1
Air Force Active Duty 51.3 51.6 51.0 0.0 0.0 0.0Guard/Reserve 0.0 0.0 0.0 0.0 0.0 0.0Civilian 13.9 13.4 14.6 0.0 0.0 0.0Total 65.2 65.0 65.6 0.0 0.0 0.0
Numbers may not add due to rounding. # in Thousands
Overseas AfloatService Category

17
Table 2-6: Major Headquarters Activities
Departmental HQsMilitary 547 401 401 0 0 0 0 0Civilian 2047 2121 2084 0 0 0 37 0Military 28 28 28 0 0 0 0 0Civilian 1516 1614 1614 0 0 0 98 0Military 6275 5066 5061 0 0 0 0 0Civilian 11893 10613 11481 0 0 0 0 0Military 3161 3153 3164 0 0 0 0 0Civilian 4956 4961 5186 271 0 0 431 0Military 1569 2461 2195 0 0 0 83 0Civilian 1193 696 704 85 0 0 0Military 7543 7316 7726 0 0 0 183 0Civilian 7087 6889 6878 0 0 0 0 0
Joint Staff & Combatant Command HQsMilitary 2299 1887 1880 0 0 0 0 0Civilian 1003 1204 1162 0 0 0 159 0Military 1030 1117 1135 0 0 0 105 0Civilian 687 831 813 0 0 0 126 0Military 2216 2076 2077 0 0 0 0 0Civilian 970 1071 1114 0 0 0 144 0Military 1642 1648 1665 0 0 0 0 0Civilian 545 668 668 0 0 0 123 0Military 796 797 798 0 0 0 0 0Civilian 781 887 855 0 0 0 74 0Military 2932 3011 3074 0 0 0 142 0Civilian 1103 1354 1403 0 0 0 300 0Military 1053 1098 1115 0 0 0 62 0Civilian 791 829 828 0 0 0 37 0Military 2318 2452 2525 0 0 0 207 0Civilian 1615 2093 2446 0 0 0 831 0Military 173 176 176 0 0 0 0 0Civilian 276 310 310 0 0 0 34 0Military 432 437 446 0 0 0 0 0Civilian 465 460 458 0 0 0 0 0
Adjustment for Defense
Acquisition Workforce
Growth
US Southern Command (USSOUTHCOM)
US Strategic Command (USSTRATCOM)
US Transportation Command (USTRANSCOM)
US Special Operations Command (USSOCOM)
US Central Command (USCENTCOM)
Increase as a Result of Other
(non in-sourcing)
DoD Component
Department of the Army
Department of the Navy
U.S. Marine Corps
Department of the Air Force
US Africa Command (USAFRICOM)
The Joint Staff (TJS)
US Pacific Command (USPACOM)
FY12Actual
FY13Estimate
US European Command (USEUCOM)
US Northern Command (USNORTHCOM)
Type
SUMMARY OF INCREASES
FY14Estimate
Office of the Secretary of Defense (OSD)
Office of the Inspector General (OIG)
MHA SUMMARY
Increase as a Result of
In-sourcing Inherently
Governmental Work
Increase as a Result of
In-sourcingExempted
Work
Increase as a Result of
In-sourcing Work for Cost Savings ONLY

18
Table 2-6 (continued): Major Headquarters Activities
Defense-wide Organizational HQsMilitary 0 0 0 0 0 0 0 0Civilian 0 0 0 0 0 0 0 0Military 0 0 0 0 0 0 0 0Civilian 68 77 77 0 0 0 0 0Military 0 0 0 0 0 0 0 0Civilian 0 0 0 0 0 0 0 0Military 0 0 0 0 0 0 0 0Civilian 175 175 175 0 0 0 0 0Military 0 0 0 0 0 0 0 0Civilian 524 520 518 0 0 0 0 0Military 4 4 4 0 0 0 0 0Civilian 147 120 120 0 0 0 0 0Military 1 1 1 0 0 0 0 0Civilian 247 245 245 0 0 0 0 0Military 2 2 2 0 0 0 0 0Civilian 49 48 48 0 0 0 0 0Military 229 229 230 0 0 0 0 0Civilian 1127 1066 1069 0 0 0 0 0Military 1 1 1 0 0 0 0 0Civilian 29 29 29 0 0 0 0 0Military 1 1 1 0 0 0 0 0Civilian 24 24 24 0 0 0 0 0Military 1 1 1 0 0 0 0 0Civilian 12861 12901 12901 0 0 0 0 0Military 46 46 46 0 0 0 0 0Civilian 81 81 80 0 0 0 0 0Military 126 126 133 0 0 0 0 0Civilian 483 483 483 0 0 0 0 0Military 0 6 6 0 0 0 0 0Civilian 868 842 885 0 0 0 17 0Military 0 0 0 0 0 0 0 0Civilian 0 0 0 0 0 0 0 0Military 19 19 18 0 0 0 0 0Civilian 237 233 223 0 0 0 0 0Military 3 3 3 0 0 0 0 0Civilian 29 29 29 0 0 0 0 0Military 0 0 0 0 0 0 0 0Civilian 0 0 0 0 0 0 0 0Military 13 15 14 0 0 0 0 1Civilian 146 147 147 0 0 0 0 1Military 0 0 0 0 0 0 0 0Civilian 0 0 0 0 0 0 0 0Military 3 3 3 0 0 0 0 0Civilian 38 38 38 0 0 0 0 0Military 14 14 14 0 0 0 0 0Civilian 17 17 17 0 0 0 0 0Military 0 0 0 0 0 0 0 0Civilian 105 143 138 0 0 0 0 0Military 0 0 0 0 0 0 0 0Civilian 0 0 0 0 0 0 0 0Military 62 62 62 0 0 0 0 0Civilian 418 424 425 0 0 0 0 7Military 1711 1740 1740 0 0 0 0 0Civilian 7187 7175 7149 0 0 0 76 0
Adjustment for Defense
Acquisition Workforce
Growth
Defense Technology Security Administration (DTSA)
Defense Threat Reduction Agency (DTRA)
DoD Education Activity (DoDEA)
Court of Appeals for the Armed Services (CAAS)
Defense Agency Research Projects Agency (DARPA)
Defense Commissary Agency (DeCA)
Defense Contract Audit Agency (DCAA)
Defense Contract Management Agency (DCMA)
Increase as a Result of Other
(non in-sourcing)
DoD Component Type
DoD Test Resource Management Center (DTRMC)
Defense Legal Services Agency (DLSA)
Defense Media Activity (DMA)
Defense Security Cooperation Agency (DSCA)
Defense Security Service (DSS)
Defense Technical Information Center (DTIC)
Defense Finance and Accounting Service (DFAS)
Defense Prisoner of War/ Missing Persons Office (DPMO)
Defense Logistics Agency (DLA)
Missile Defense Agency (MDA)
Communications and Classified Programs
Uniformed Services University of the Health Sciences (USUHS)
Tricare Management Activity (TMA)
Washington Headquarters Services (WHS)
Office of Economic Adjustment (OEA)
Pentagon Force Protection Agency (PFPA)
National Defense University (NDU)
SUMMARY OF INCREASES
FY14Estimate
Defense Human Resource Activity (DHRA)
Defense Acquisition University (DAU)
MHA SUMMARY
FY12Actual
FY13Estimate
Increase as a Result of
In-sourcing Inherently
Governmental Work
Increase as a Result of
In-sourcingExempted
Work
Increase as a Result of
In-sourcing Work for Cost Savings ONLY
19
Chapter 3: Officer and Enlisted Flow Data
The tables in this chapter illustrate the flow of active duty personnel through the individual Services. For each Service, there will be a series of four tables presented. These tables include officer and enlisted gains and losses for the current and next five FYs and officer and enlisted retirements by years of service for the current and next five FYs. A more specific summary of each table follows.
In tables 3-1a through 3-1d and 3-3a through 3-3d active duty gains and losses are presented for the current and next five FYs for each of the individual Services by officer and enlisted personnel categories, respectively. Each table includes beginning strength and various categories of gains and losses tabulated to determine the end strength at each grade. Since the individual Services use different approaches to tracking flow, direct comparisons between Services may not be possible.
In tables 3-2a through 3-2d officer active duty retirements are presented by grade and years of commissioned service (YOCS) for the current and next five FYs for each of the individual Services. In tables 3-4a through 3-4d enlisted active duty retirements are presented by grade and years of service (YOS) for the current and next five FYs for each of the individual Services. The tables are divided by officer grades (O-1 to O-10) and enlisted grades (E-1 to E-9) and years of service ranging from 1 to 30+.
20
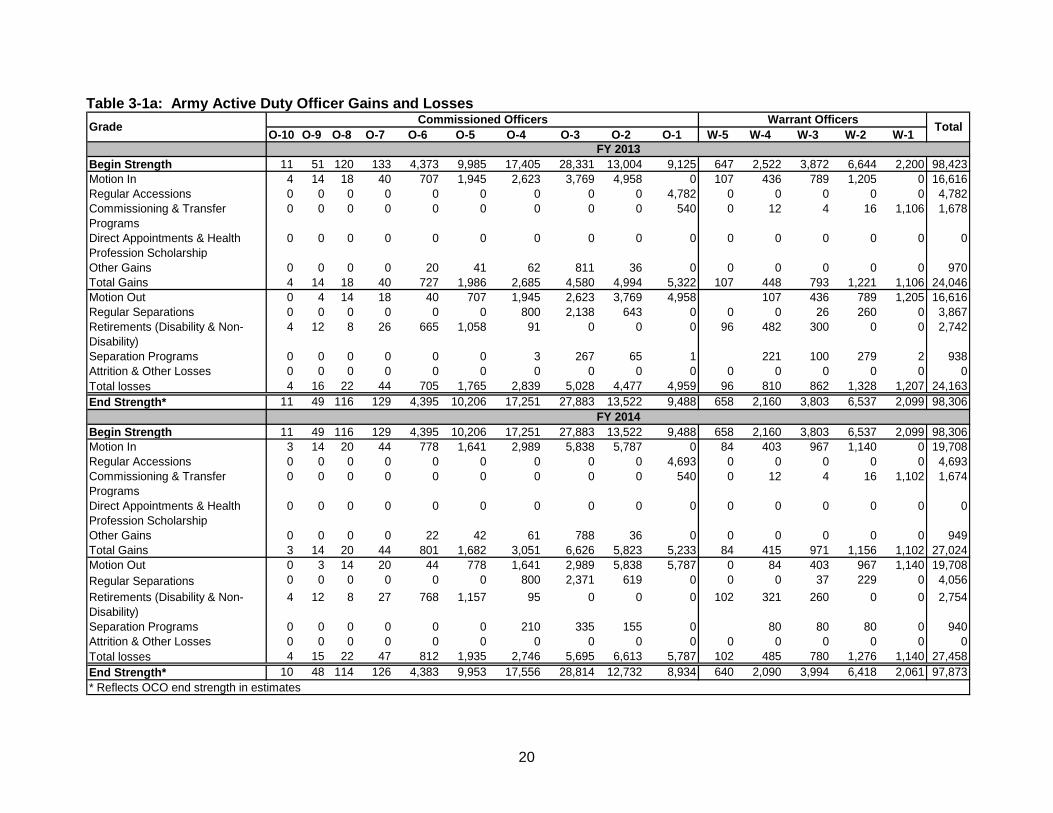
Table 3-1a: Army Active Duty Officer Gains and Losses
O-10 O-9 O-8 O-7 O-6 O-5 O-4 O-3 O-2 O-1 W-5 W-4 W-3 W-2 W-1
Begin Strength 11 51 120 133 4,373 9,985 17,405 28,331 13,004 9,125 647 2,522 3,872 6,644 2,200 98,423Motion In 4 14 18 40 707 1,945 2,623 3,769 4,958 0 107 436 789 1,205 0 16,616Regular Accessions 0 0 0 0 0 0 0 0 0 4,782 0 0 0 0 0 4,782Commissioning & Transfer Programs
0 0 0 0 0 0 0 0 0 540 0 12 4 16 1,106 1,678
Direct Appointments & Health Profession Scholarship
0 0 0 0 0 0 0 0 0 0 0 0 0 0 0 0
Other Gains 0 0 0 0 20 41 62 811 36 0 0 0 0 0 0 970Total Gains 4 14 18 40 727 1,986 2,685 4,580 4,994 5,322 107 448 793 1,221 1,106 24,046Motion Out 0 4 14 18 40 707 1,945 2,623 3,769 4,958 107 436 789 1,205 16,616Regular Separations 0 0 0 0 0 0 800 2,138 643 0 0 0 26 260 0 3,867Retirements (Disability & Non-Disability)
4 12 8 26 665 1,058 91 0 0 0 96 482 300 0 0 2,742
Separation Programs 0 0 0 0 0 0 3 267 65 1 221 100 279 2 938Attrition & Other Losses 0 0 0 0 0 0 0 0 0 0 0 0 0 0 0 0Total losses 4 16 22 44 705 1,765 2,839 5,028 4,477 4,959 96 810 862 1,328 1,207 24,163End Strength* 11 49 116 129 4,395 10,206 17,251 27,883 13,522 9,488 658 2,160 3,803 6,537 2,099 98,306
Begin Strength 11 49 116 129 4,395 10,206 17,251 27,883 13,522 9,488 658 2,160 3,803 6,537 2,099 98,306Motion In 3 14 20 44 778 1,641 2,989 5,838 5,787 0 84 403 967 1,140 0 19,708Regular Accessions 0 0 0 0 0 0 0 0 0 4,693 0 0 0 0 0 4,693Commissioning & Transfer Programs
0 0 0 0 0 0 0 0 0 540 0 12 4 16 1,102 1,674
Direct Appointments & Health Profession Scholarship
0 0 0 0 0 0 0 0 0 0 0 0 0 0 0 0
Other Gains 0 0 0 0 22 42 61 788 36 0 0 0 0 0 0 949Total Gains 3 14 20 44 801 1,682 3,051 6,626 5,823 5,233 84 415 971 1,156 1,102 27,024Motion Out 0 3 14 20 44 778 1,641 2,989 5,838 5,787 0 84 403 967 1,140 19,708Regular Separations 0 0 0 0 0 0 800 2,371 619 0 0 0 37 229 0 4,056Retirements (Disability & Non-Disability)
4 12 8 27 768 1,157 95 0 0 0 102 321 260 0 0 2,754
Separation Programs 0 0 0 0 0 0 210 335 155 0 80 80 80 0 940Attrition & Other Losses 0 0 0 0 0 0 0 0 0 0 0 0 0 0 0 0Total losses 4 15 22 47 812 1,935 2,746 5,695 6,613 5,787 102 485 780 1,276 1,140 27,458End Strength* 10 48 114 126 4,383 9,953 17,556 28,814 12,732 8,934 640 2,090 3,994 6,418 2,061 97,873* Reflects OCO end strength in estimates
Grade
FY 2013
Commissioned Officers Warrant Officers Total
FY 2014
21
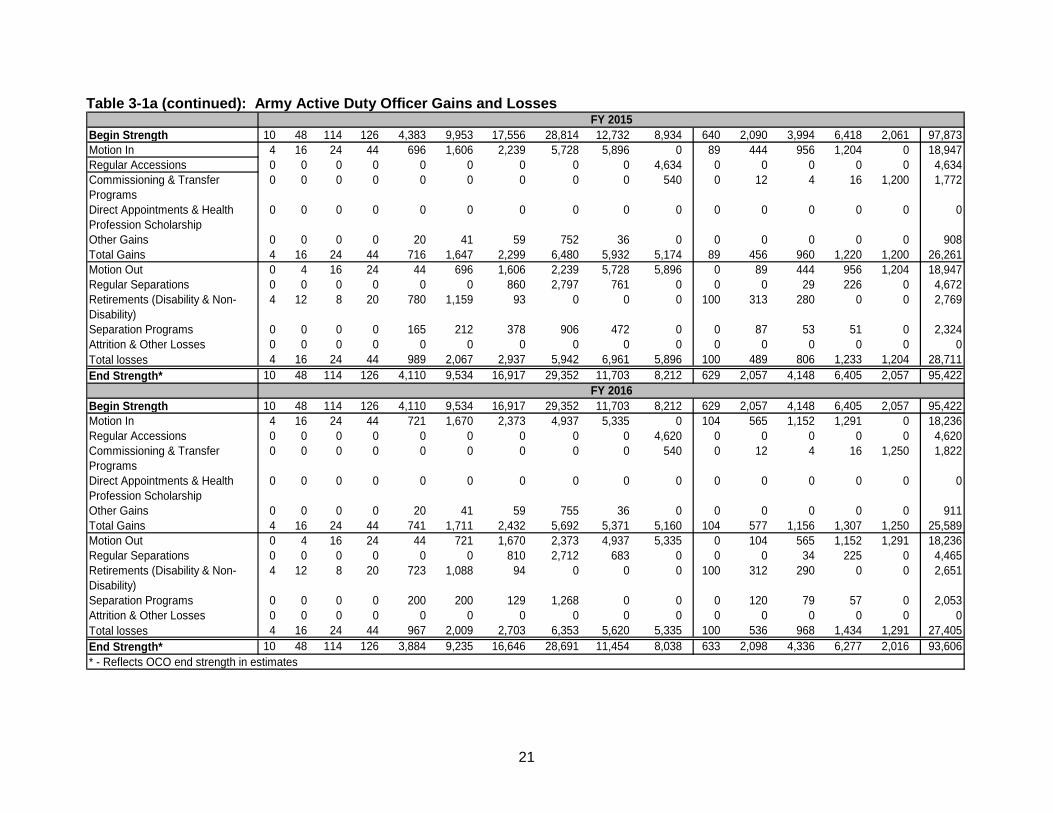
Table 3-1a (continued): Army Active Duty Officer Gains and Losses
Begin Strength 10 48 114 126 4,383 9,953 17,556 28,814 12,732 8,934 640 2,090 3,994 6,418 2,061 97,873Motion In 4 16 24 44 696 1,606 2,239 5,728 5,896 0 89 444 956 1,204 0 18,947Regular Accessions 0 0 0 0 0 0 0 0 0 4,634 0 0 0 0 0 4,634Commissioning & Transfer Programs
0 0 0 0 0 0 0 0 0 540 0 12 4 16 1,200 1,772
Direct Appointments & Health Profession Scholarship
0 0 0 0 0 0 0 0 0 0 0 0 0 0 0 0
Other Gains 0 0 0 0 20 41 59 752 36 0 0 0 0 0 0 908Total Gains 4 16 24 44 716 1,647 2,299 6,480 5,932 5,174 89 456 960 1,220 1,200 26,261Motion Out 0 4 16 24 44 696 1,606 2,239 5,728 5,896 0 89 444 956 1,204 18,947Regular Separations 0 0 0 0 0 0 860 2,797 761 0 0 0 29 226 0 4,672Retirements (Disability & Non-Disability)
4 12 8 20 780 1,159 93 0 0 0 100 313 280 0 0 2,769
Separation Programs 0 0 0 0 165 212 378 906 472 0 0 87 53 51 0 2,324Attrition & Other Losses 0 0 0 0 0 0 0 0 0 0 0 0 0 0 0 0Total losses 4 16 24 44 989 2,067 2,937 5,942 6,961 5,896 100 489 806 1,233 1,204 28,711End Strength* 10 48 114 126 4,110 9,534 16,917 29,352 11,703 8,212 629 2,057 4,148 6,405 2,057 95,422
Begin Strength 10 48 114 126 4,110 9,534 16,917 29,352 11,703 8,212 629 2,057 4,148 6,405 2,057 95,422Motion In 4 16 24 44 721 1,670 2,373 4,937 5,335 0 104 565 1,152 1,291 0 18,236Regular Accessions 0 0 0 0 0 0 0 0 0 4,620 0 0 0 0 0 4,620Commissioning & Transfer Programs
0 0 0 0 0 0 0 0 0 540 0 12 4 16 1,250 1,822
Direct Appointments & Health Profession Scholarship
0 0 0 0 0 0 0 0 0 0 0 0 0 0 0 0
Other Gains 0 0 0 0 20 41 59 755 36 0 0 0 0 0 0 911Total Gains 4 16 24 44 741 1,711 2,432 5,692 5,371 5,160 104 577 1,156 1,307 1,250 25,589Motion Out 0 4 16 24 44 721 1,670 2,373 4,937 5,335 0 104 565 1,152 1,291 18,236Regular Separations 0 0 0 0 0 0 810 2,712 683 0 0 0 34 225 0 4,465Retirements (Disability & Non-Disability)
4 12 8 20 723 1,088 94 0 0 0 100 312 290 0 0 2,651
Separation Programs 0 0 0 0 200 200 129 1,268 0 0 0 120 79 57 0 2,053Attrition & Other Losses 0 0 0 0 0 0 0 0 0 0 0 0 0 0 0 0Total losses 4 16 24 44 967 2,009 2,703 6,353 5,620 5,335 100 536 968 1,434 1,291 27,405End Strength* 10 48 114 126 3,884 9,235 16,646 28,691 11,454 8,038 633 2,098 4,336 6,277 2,016 93,606* - Reflects OCO end strength in estimates
FY 2015
FY 2016

22
Table 3-1a (continued): Army Active Duty Officer Gains and Losses
O-10 O-9 O-8 O-7 O-6 O-5 O-4 O-3 O-2 O-1 W-5 W-4 W-3 W-2 W-1
Begin Strength 10 48 114 126 3,884 9,235 16,646 28,691 11,454 8,038 633 2,098 4,336 6,277 2,016 93,606Motion In 4 16 24 44 661 1,743 2,896 4,966 5,381 0 111 737 1,063 1,310 0 18,955Regular Accessions 0 0 0 0 0 0 0 0 0 4,620 0 0 0 0 0 4,620Commissioning & Transfer Programs
0 0 0 0 0 0 0 0 0 540 0 12 4 16 1,300 1,872
Direct Appointments & Health Profession Scholarship
0 0 0 0 0 0 0 0 0 0 0 0 0 0 0 0
Other Gains 0 0 0 0 20 40 59 746 36 0 0 0 0 0 0 901Total Gains 4 16 24 44 680 1,783 2,954 5,712 5,417 5,160 111 749 1,067 1,326 1,300 26,348Motion Out 0 4 16 24 44 661 1,743 2,896 4,966 5,381 0 111 737 1,063 1,310 18,955Regular Separations 0 0 0 0 0 0 820 2,644 686 0 0 0 37 224 0 4,412Retirements (Disability & Non-Disability)
4 12 8 20 690 1,070 93 0 0 0 101 328 290 0 0 2,617
Separation Programs 0 0 0 0 0 200 244 1,792 79 0 0 140 92 70 0 2,617Attrition & Other Losses 0 0 0 0 0 0 0 0 0 0 0 0 0 0 0 0Total losses 4 16 24 44 734 1,931 2,900 7,332 5,731 5,381 101 579 1,156 1,357 1,310 28,602End Strength 10 48 114 127 3,830 9,087 16,701 27,071 11,139 7,817 643 2,268 4,247 6,246 2,006 91,352
Begin Strength 10 48 114 127 3,830 9,087 16,701 27,071 11,139 7,817 643 2,268 4,247 6,246 2,006 91,352Motion In 4 16 24 44 593 1,645 3,164 4,981 5,383 0 116 537 768 1,238 0 18,514Regular Accessions 0 0 0 0 0 0 0 0 0 4,624 0 0 0 0 0 4,624Commissioning & Transfer Programs
0 0 0 0 0 0 0 0 0 540 0 12 4 16 1,300 1,872
Direct Appointments & Health Profession Scholarship
0 0 0 0 0 0 0 0 0 0 0 0 0 0 0 0
Other Gains 0 0 0 0 20 40 59 751 36 0 0 0 0 0 0 906Total Gains 4 16 24 44 613 1,686 3,223 5,732 5,419 5,164 116 549 772 1,254 1,300 25,916Motion Out 0 4 16 24 44 593 1,645 3,164 4,981 5,383 0 116 537 768 1,238 18,514Regular Separations 0 0 0 0 0 0 810 2,538 671 0 0 0 32 228 0 4,278Retirements (Disability & Non-Disability)
4 12 8 21 681 1,056 95 0 0 0 103 333 280 0 0 2,594
Separation Programs 0 0 0 0 0 0 122 430 78 0 0 213 170 65 0 1,078Attrition & Other Losses 0 0 0 0 0 0 0 0 0 0 0 0 0 0 0 0Total losses 4 16 24 45 726 1,649 2,672 6,132 5,730 5,383 103 662 1,019 1,061 1,238 26,464End Strength 10 48 114 126 3,717 9,124 17,252 26,670 10,828 7,599 655 2,155 4,000 6,439 2,067 90,804
Grade Commissioned Officers Warrant Officers Total
FY 2018
FY 2017

23
Table 3-1b: Navy Active Duty Officer Gains and Losses
O-10 O-9 O-8 O-7 O-6 O-5 O-4 O-3 O-2 O-1 W-5 W-4 W-3 W-2 W-1
Begin Strength 10 39 75 120 3,392 6,775 10,668 17,483 6,833 6,504 64 377 625 514 0 53,479Motion In 2 9 20 23 411 949 1,984 3,277 3,164 0 25 119 168 0 0 10,151Regular Accessions 0 0 0 0 0 0 0 0 50 2,664 0 0 0 0 0 2,714Commissioning & Transfer Programs 0 0 0 0 0 0 0 4 0 375 0 0 3 176 0 558Direct Appointments & Health Profession Scholarship
0 0 0 0 2 5 35 499 125 182 0 0 0 0 0 848
Other Gains 0 0 0 0 4 8 8 10 0 0 0 0 0 0 0 30Total Gains 2 9 20 23 417 962 2,027 3,790 3,339 3,221 25 119 171 176 0 14,301Motion Out 0 9 5 17 23 411 949 1,984 3,277 3,164 0 25 119 168 0 10,151Regular Separations 0 0 0 0 0 8 258 927 66 1 0 1 1 0 0 1,262Retirements (Disability & Non-Disability)
2 2 16 12 488 530 635 442 1 3 30 118 59 5 0 2,343
Separation Programs 0 0 0 0 0 0 0 0 0 0 0 0 0 0 0 0Attrition & Other Losses 0 0 0 0 63 50 1,328 380 497 408 0 0 0 0 0 2,726Total losses 2 11 21 29 574 999 3,170 3,733 3,841 3,576 30 144 179 173 0 16,482End Strength 10 37 74 114 3,235 6,738 9,525 17,540 6,331 6,149 59 352 617 517 0 51,298
Begin Strength 10 37 74 114 3,202 6,628 10,873 17,562 6,514 6,559 49 394 621 491 0 51,298Motion In 3 14 18 24 468 1,076 1,816 3,273 3,385 0 6 128 163 0 0 10,374Regular Accessions 0 0 0 0 0 0 0 6 44 2,798 0 0 0 0 0 2,848Commissioning & Transfer Programs 0 0 0 0 0 0 0 4 3 460 0 0 6 209 0 682Direct Appointments & Health Profession Scholarship
0 0 0 0 0 3 31 489 173 175 0 0 0 0 0 871
Other Gains 0 0 0 0 15 12 9 19 0 0 0 0 0 0 0 55Total Gains 3 14 18 24 483 1,091 1,856 3,791 3,605 3,433 6 128 169 209 0 14,830Motion Out 1 13 7 14 24 468 1,076 1,816 3,273 3,385 0 6 128 163 0 10,374Regular Separations 0 0 0 0 3 40 223 1,066 85 25 0 0 0 6 0 1,448Retirements (Disability & Non-Disability)
3 3 16 9 469 554 591 260 11 8 1 96 59 6 0 2,086
Separation Programs 0 0 0 0 0 0 0 0 0 0 0 0 0 0 0 0Attrition & Other Losses 0 0 0 0 7 8 27 286 115 207 0 0 0 0 0 650Total losses 4 16 23 23 503 1,070 1,917 3,428 3,484 3,625 1 102 187 175 0 14,558End Strength 9 35 69 115 3,182 6,649 10,812 17,925 6,635 6,367 54 420 603 525 0 53,400
Total
FY 2013
FY 2014
Grade Commissioned Officers Warrant Officers

24
Table 3-1b (continued): Navy Active Duty Officer Gains and Losses
O-10 O-9 O-8 O-7 O-6 O-5 O-4 O-3 O-2 O-1 W-5 W-4 W-3 W-2 W-1
Begin Strength 9 35 69 115 3,182 6,649 10,812 17,925 6,635 6,367 54 420 603 525 0 53,400Motion In 3 13 16 32 510 1,059 1,863 3,162 3,390 0 4 126 168 0 0 10,346Regular Accessions 0 0 0 0 0 0 0 6 44 2,159 0 0 0 0 0 2,209Commissioning & Transfer Programs 0 0 0 0 0 0 0 4 3 389 0 0 6 173 0 575Direct Appointments & Health Profession Scholarship
0 0 0 0 3 3 21 488 173 211 0 0 0 0 0 899
Other Gains 0 0 0 0 12 12 9 28 0 0 0 0 0 0 0 61Total Gains 3 13 16 32 525 1,074 1,893 3,688 3,610 2,759 4 126 174 173 0 14,390Motion Out 0 10 10 16 28 510 1,059 1,863 3,162 3,390 0 4 126 168 0 10,346Regular Separations 0 0 0 0 3 41 233 1,022 84 26 0 0 0 4 0 1,413Retirements (Disability & Non-Disability)
3 3 11 15 477 560 622 304 14 8 4 82 67 8 0 2,178
Separation Programs 0 0 0 0 0 0 0 0 0 0 0 0 0 0 0 0Attrition & Other Losses 0 0 0 0 7 8 35 397 210 240 0 0 0 1 0 898Total losses 3 13 21 31 515 1,119 1,949 3,586 3,470 3,664 4 86 193 181 0 14,835End Strength 9 35 64 116 3,192 6,604 10,756 18,027 6,775 5,462 54 460 584 517 0 52,655
Begin Strength 9 35 64 116 3,192 6,604 10,756 18,027 6,775 5,462 54 460 584 517 0 52,655Motion In 3 13 23 32 471 1,036 1,884 3,385 3,433 0 20 124 173 0 0 10,597Regular Accessions 0 0 0 0 0 0 0 6 44 2,161 0 0 0 0 0 2,211Commissioning & Transfer Programs 0 0 0 0 0 0 0 4 3 389 0 0 6 173 0 575Direct Appointments & Health Profession Scholarship
0 0 0 0 3 3 21 497 173 211 0 0 0 0 0 908
Other Gains 0 0 0 0 12 12 9 19 0 0 0 0 0 0 0 52Total Gains 3 13 23 32 486 1,051 1,914 3,911 3,653 2,761 20 124 179 173 0 14,343Motion Out 0 10 13 16 32 471 1,036 1,884 3,385 3,433 0 20 124 173 0 10,597Regular Separations 0 0 0 0 3 42 236 974 85 31 0 0 0 4 0 1,375Retirements (Disability & Non-Disability)
3 3 11 15 482 566 629 297 14 8 6 83 68 8 0 2,193
Separation Programs 0 0 0 0 0 0 0 0 0 0 0 0 0 0 0 0Attrition & Other Losses 0 0 0 0 7 8 35 294 136 209 0 0 0 1 0 690Total losses 3 13 24 31 524 1,087 1,936 3,449 3,620 3,681 6 103 192 186 0 14,855End Strength 9 35 63 117 3,154 6,568 10,734 18,489 6,808 4,542 68 481 571 504 0 52,143
Grade Commissioned Officers Warrant Officers
FY 2016
FY 2015
Total

25
Table 3-1b (continued): Navy Active Duty Officer Gains and Losses
O-10 O-9 O-8 O-7 O-6 O-5 O-4 O-3 O-2 O-1 W-5 W-4 W-3 W-2 W-1
Begin Strength 9 35 63 117 3,154 6,568 10,734 18,489 6,808 4,542 68 481 571 504 0 52,143Motion In 3 13 23 32 482 1,174 1,972 3,390 2,759 0 20 132 160 0 0 10,160Regular Accessions 0 0 0 0 0 0 0 0 44 2,243 0 0 0 0 0 2,287Commissioning & Transfer Programs 0 0 0 0 0 0 0 4 3 389 0 0 6 173 0 575Direct Appointments & Health Profession Scholarship
0 0 0 0 3 3 21 480 173 211 0 0 0 0 0 891
Other Gains 0 0 0 0 12 12 9 19 0 0 0 0 0 0 0 52Total Gains 3 13 23 32 497 1,189 2,002 3,893 2,979 2,843 20 132 166 173 0 13,965Motion Out 0 10 13 16 32 482 1,174 1,972 3,390 2,759 0 20 132 160 0 10,160Regular Separations 0 0 0 0 3 42 237 949 86 31 0 0 0 4 0 1,352Retirements (Disability & Non-Disability)
3 3 11 15 484 569 632 282 14 8 8 83 68 8 0 2,188
Separation Programs 0 0 0 0 0 0 0 0 0 0 0 0 0 0 0 0Attrition & Other Losses 0 0 0 0 7 8 35 260 93 107 0 0 0 1 0 511Total losses 3 13 24 31 526 1,101 2,078 3,463 3,583 2,905 8 103 200 173 0 14,211End Strength 9 35 62 118 3,125 6,656 10,658 18,919 6,204 4,480 80 510 537 504 0 51,897
Begin Strength 9 35 62 118 3,125 6,656 10,658 18,919 6,204 4,480 80 510 537 504 0 51,897Motion In 3 15 28 32 483 1,147 1,979 3,433 2,761 0 20 125 160 0 0 10,186Regular Accessions 0 0 0 0 0 0 0 6 44 2,671 0 0 0 0 0 2,721Commissioning & Transfer Programs 0 0 0 0 0 0 0 4 3 389 0 0 6 173 0 575Direct Appointments & Health Profession Scholarship
0 0 0 0 3 3 27 470 173 211 0 0 0 0 0 887
Other Gains 0 0 0 0 12 12 3 23 0 0 0 0 0 0 0 50Total Gains 3 15 28 32 498 1,162 2,009 3,936 2,981 3,271 20 125 166 173 0 14,419Motion Out 0 10 18 18 32 483 1,147 1,979 3,433 2,761 0 20 125 160 0 10,186Regular Separations 0 0 0 0 3 42 237 943 56 31 0 0 0 4 0 1,316Retirements (Disability & Non-Disability)
3 2 10 17 484 569 632 299 14 8 20 83 68 8 0 2,217
Separation Programs 0 0 0 0 0 0 0 0 0 0 0 0 0 0 0 0Attrition & Other Losses 0 0 0 0 7 8 35 260 93 107 0 0 0 1 0 511Total losses 3 12 28 35 526 1,102 2,051 3,481 3,596 2,907 20 103 193 173 0 14,230End Strength 9 38 62 115 3,097 6,716 10,616 19,374 5,589 4,844 80 532 510 504 0 52,086
Grade Commissioned Officers Warrant Officers Total
FY 2017
FY 2018

26
Table 3-1c: Marine Corps Active Duty Officer Gains and Losses
O-10 O-9 O-8 O-7 O-6 O-5 O-4 O-3 O-2 O-1 W-5 W-4 W-3 W-2 W-1
Begin Strength 4 21 32 34 687 1,923 3,906 6,909 3,657 2,511 100 294 578 919 201 21,776Motion In 2 6 5 10 85 168 391 218 778 0 70 119 167 206 0 2,225Regular Accessions 0 0 0 0 0 0 0 0 0 530 0 0 0 0 0 530Commissioning & Transfer Programs 0 0 0 0 0 0 0 0 0 633 0 0 0 0 237 870Direct Appointments & Health Profession Scholarship 0 0 0 0 0 0 0 0 0 0 0 0 0 0 0 0Other Gains 0 0 0 0 0 0 0 0 0 0 0 0 0 0 0 0Total Gains 2 6 5 10 85 168 391 218 778 1,163 70 119 167 206 237 3,625Motion Out 0 2 6 5 10 85 168 391 218 778 0 70 119 167 206 2,225Regular Separations 0 0 0 0 0 0 0 146 358 0 0 0 0 0 0 504Retirements (Disability & Non-Disability) 2 8 3 2 77 100 271 48 73 56 134 42 0 816Separation Programs 0 0 0 0 0 0 0 98 0 0 0 0 0 0 0 98Attrition & Other Losses 0 0 0 0 0 0 0 199 402 0 0 0 0 0 0 601Total losses 2 10 9 7 87 185 439 882 978 778 73 126 253 209 206 4,244End Strength 4 17 28 37 685 1,906 3,858 6,245 3,457 2,896 97 287 492 916 232 21,157
Begin Strength 4 17 28 37 685 1,906 3,858 6,245 3,457 2,896 97 287 492 916 232 21,157Motion In 0 0 5 5 5 35 300 2,325 1,623 0 9 24 160 175 0 4,666Regular Accessions 0 0 0 0 0 0 0 0 0 570 0 0 0 0 0 570Commissioning & Transfer Programs 0 0 0 0 0 0 0 0 0 851 0 0 0 0 229 1,080Direct Appointments & Health Profession Scholarship 0
0 0 0 0 0 0 0 0 0 0 0 0 0 0 0
Other Gains 0 0 0 0 0 0 0 0 0 0 0 0 0 0 0 0Total Gains 0 0 5 5 5 35 300 2,325 1,623 1,421 9 24 160 175 229 6,316Motion Out 0 0 0 5 5 5 35 300 2,325 1,623 0 9 24 160 175 4,666Regular Separations 0 0 0 0 0 0 0 470 0 0 0 0 0 0 0 470Retirements (Disability & Non-Disability) 0 0 0 5 2 39 295 351 0 0 3 10 100 41 0 846Separation Programs 0 0 0 0 0 0 0 24 0 0 0 0 0 0 0 24Attrition & Other Losses 0 0 0 0 0 0 0 0 0 0 0 0 0 0 0 0Total losses 0 0 0 10 7 44 330 1,145 2,325 1,623 3 19 124 201 175 6,006End Strength 4 17 33 32 683 1,897 3,828 7,425 2,755 2,694 103 292 528 890 286 21,467
Grade Commissioned Officers Warrant Officers Total
FY 2013
FY 2014

27
Table 3-1c (continued): Marine Corps Active Duty Officer Gains and Losses
O-10 O-9 O-8 O-7 O-6 O-5 O-4 O-3 O-2 O-1 W-5 W-4 W-3 W-2 W-1
Begin Strength 4 17 33 32 683 1,897 3,828 7,425 2,755 2,694 103 292 528 890 286 21,467Motion In 0 0 0 2 2 63 232 868 1,384 0 70 90 188 230 0 3,129Regular Accessions 0 0 0 0 0 0 0 0 0 510 0 0 0 0 0 510Commissioning & Transfer Programs 0 0 0 0 0 0 0 0 0 911 0 0 0 0 229 1,140Direct Appointments & Health Profession Scholarship 0 0 0 0 0 0 0 0 0 0 0 0 0 0 0 0Other Gains 0 0 0 0 0 0 0 0 0 0 0 0 0 0 0 0Total Gains 0 0 0 2 2 63 232 868 1,384 1,421 70 90 188 230 229 4,779Motion Out 0 0 0 0 2 2 63 232 868 1,384 0 70 90 188 230 3,129Regular Separations 0 0 0 0 0 0 0 0 470 0 0 0 0 0 0 470Retirements (Disability & Non-Disability) 0 0 0 2 2 71 200 350 0 0 70 20 104 41 0 860Separation Programs 0 0 0 0 0 0 0 98 0 0 0 0 0 0 0 98Attrition & Other Losses 0 0 0 0 0 0 0 200 260 0 0 0 0 0 0 460Total losses 0 0 0 2 4 73 263 880 1,598 1,384 70 90 194 229 230 5,017End Strength 4 17 33 32 681 1,887 3,797 7,413 2,541 2,731 103 292 522 891 285 21,229
Begin Strength 4 17 33 32 681 1,887 3,797 7,413 2,541 2,731 103 292 522 891 285 21,229Motion In 0 0 2 4 4 87 265 837 1,400 0 78 96 192 231 0 3,196Regular Accessions 0 0 0 0 0 0 0 0 0 513 0 0 0 0 0 513Commissioning & Transfer Programs 0 0 0 0 0 0 0 0 0 908 0 0 0 0 229 1,137Direct Appointments & Health Profession Scholarship 0 0 0 0 0 0 0 0 0 0 0 0 0 0 0 0Other Gains 0 0 0 0 0 0 0 0 0 0 0 0 0 0 0 0Total Gains 0 0 2 4 4 87 265 837 1,400 1,421 78 96 192 231 229 4,846Motion Out 0 0 0 2 4 4 87 265 837 1,400 0 78 96 192 231 3,196Regular Separations 0 0 0 0 0 0 0 0 465 0 0 0 0 0 0 465Retirements (Disability & Non-Disability) 0 0 2 2 1 92 205 360 0 0 78 20 104 41 0 905Separation Programs 0 0 0 0 0 0 0 98 0 0 0 0 0 0 0 98Attrition & Other Losses 0 0 0 0 0 0 0 221 223 0 0 0 0 0 0 444Total losses 0 0 2 4 5 96 292 944 1,525 1,400 78 98 200 233 231 5,108End Strength 4 17 33 32 680 1,878 3,770 7,306 2,416 2,752 103 290 514 889 283 20,967
Grade Commissioned Officers Warrant Officers Total
FY 2015
FY 2016

28
Table 3-1c (continued): Marine Corps Active Duty Officer Gains and Losses
O-10 O-9 O-8 O-7 O-6 O-5 O-4 O-3 O-2 O-1 W-5 W-4 W-3 W-2 W-1
Begin Strength 4 17 33 32 680 1,878 3,770 7,306 2,416 2,752 103 290 514 889 283 20,967Motion In 0 0 2 4 5 97 302 977 1,407 0 25 90 188 229 0 3,326Regular Accessions 0 0 0 0 0 0 0 0 0 513 0 0 0 0 0 513Commissioning & Transfer Programs 0 0 0 0 0 0 0 0 0 908 0 0 0 0 229 1,137Direct Appointments & Health Profession Scholarship 0 0 0 0 0 0 0 0 0 0 0 0 0 0 0 0Other Gains 0 0 0 0 0 0 0 0 0 0 0 0 0 0 0 0Total Gains 0 0 2 4 5 97 302 977 1,407 1,421 25 90 188 229 229 4,976Motion Out 0 0 0 2 4 5 97 302 977 1,407 0 25 90 188 229 3,326Regular Separations 0 0 0 0 0 0 0 0 465 0 0 0 0 0 0 465Retirements (Disability & Non-Disability) 0 0 2 2 1 92 205 368 0 0 25 65 104 41 0 905Separation Programs 0 0 0 0 0 0 0 98 0 0 0 0 0 0 0 98Attrition & Other Losses 0 0 0 0 0 0 0 486 260 0 0 0 0 0 0 486Total losses 0 0 2 4 5 97 302 1,254 1,442 1,407 25 90 194 229 229 5,280End Strength 4 17 33 32 680 1,878 3,770 7,029 2,381 2,766 103 290 508 889 283 20,663
Begin Strength 4 17 33 32 680 1,878 3,770 7,029 2,381 2,766 103 290 508 889 283 20,663Motion In 3 15 28 32 2 93 174 926 1,423 0 25 90 188 229 0 3,150Regular Accessions 0 0 0 0 0 0 0 6 44 513 0 0 0 0 0 513Commissioning & Transfer Programs 0 0 0 0 0 0 0 4 3 908 0 0 6 173 229 1,137Direct Appointments & Health Profession Scholarship 0 0 0 0 3 3 27 470 173 211 0 0 0 0 0 0Other Gains 0 0 0 0 12 12 3 23 0 0 0 0 0 0 0 0Total Gains 0 0 0 0 2 93 174 926 1,423 1,421 25 90 188 229 229 4,800Motion Out 0 10 18 18 32 2 93 174 926 1,423 0 25 90 188 229 3,150Regular Separations 0 0 0 0 3 42 237 943 477 31 0 0 0 4 0 477Retirements (Disability & Non-Disability) 3 2 10 17 2 92 85 368 14 8 25 65 104 41 0 782Separation Programs 0 0 0 0 0 0 0 98 0 0 0 0 0 0 0 98Attrition & Other Losses 0 0 0 0 7 8 35 411 93 107 0 0 0 1 0 411Total losses 0 0 0 0 2 94 178 1,051 1,403 1,423 25 90 194 229 229 4,918End Strength 4 17 33 32 680 1,877 3,766 6,904 2,401 2,764 103 290 502 889 283 20,545
Grade Commissioned Officers Warrant Officers Total
FY 2017
FY 2018

29
Table 3-1d: Air Force Active Duty Officer Gains and Losses
O-10 O-9 O-8 O-7 O-6 O-5 O-4 O-3 O-2 O-1
Begin Strength 14 44 99 147 3,580 10,039 14,548 22,170 7,472 6,907 65,020Motion In 2 5 16 27 495 1,504 2,474 3,647 4,262 0 12,432Regular Accessions 0 0 0 0 0 0 0 0 0 2,926 2,926Commissioning & Transfer Programs 0 0 0 0 0 0 0 50 50 1,125 1,125Direct Appointments & Health Profession Scholarship
0 0 0 0 0 5 55 420 0 0 480
Other Gains 0 0 0 0 0 10 20 0 0 160 190Total Gains 2 5 16 27 495 1,519 2,549 4,067 4,262 4,211 17,153Motion Out 0 2 5 16 27 495 1,504 2,474 3,647 4,262 12,432Regular Separations 0 0 0 0 0 585 113 345 608 267 1,918Retirements (Disability & Non-Disability) 5 7 18 11 573 456 740 522 146 10 2,488Separation Programs 0 0 0 0 0 18 67 81 0 0 166Attrition & Other Losses 0 0 0 0 0 2 12 101 23 32 170Total losses 5 9 23 27 600 1,556 2,436 3,523 4,424 4,571 17,174End Strength 11 40 92 147 3,475 10,002 14,661 22,714 7,310 6,547 64,999
Begin Strength 11 40 92 147 3,475 10,002 14,661 22,714 7,310 6,547 64,999Motion In 4 10 21 36 422 1,459 2,422 3,513 3,772 0 11,659Regular Accessions 0 0 0 0 0 0 0 0 0 2,880 2,880Commissioning & Transfer Programs 0 0 0 0 0 0 0 0 0 1,355 1,355Direct Appointments & Health Profession Scholarship
0 0 0 0 0 5 55 440 0 0 500
Other Gains 0 0 0 0 0 10 20 10 0 130 170Total Gains 4 10 21 36 422 1,474 2,497 3,963 3,772 4,365 16,564Motion Out 4 10 21 36 422 1,459 2,422 3,513 3,772 11,659Regular Separations 0 0 0 0 0 277 1,175 680 236 143 2,511Retirements (Disability & Non-Disability) 3 10 11 26 432 802 602 207 7 0 2,100Separation Programs 0 0 0 0 52 157 234 123 0 0 566Attrition & Other Losses 0 0 0 0 0 0 7 30 8 5 50Total losses 3 14 21 47 520 1,658 3,477 3,462 3,764 3,920 16,886End Strength 12 36 92 136 3,377 9,818 13,681 23,215 7,318 6,992 64,677
Grade Commissioned Officers Total
FY 2013
FY 2014

30
Table 3-1d (continued): Air Force Active Duty Officer Gains and Losses
O-10 O-9 O-8 O-7 O-6 O-5 O-4 O-3 O-2 O-1
Begin Strength 12 36 92 136 3,377 9,818 13,681 23,215 7,318 6,992 64,677Motion In 3 10 22 37 409 1,490 2,900 3,626 3,717 0 12,214Regular Accessions 0 0 0 0 0 0 0 0 0 2,781 2,781Commissioning & Transfer Programs 0 0 0 0 0 0 0 50 50 1,105 1,205Direct Appointments & Health Profession Scholarship
0 0 0 0 0 8 55 440 0 0 503
Other Gains 0 0 0 0 0 0 0 0 0 0 0Total Gains 3 10 22 37 409 1,498 2,955 4,116 3,767 3,886 16,703Motion Out 0 3 10 22 37 409 1,490 2,900 3,626 3,717 12,214Regular Separations 0 2 1 7 2 186 770 1,070 146 38 2,220Retirements (Disability & Non-Disability) 3 5 11 8 483 902 606 121 7 2 2,148Separation Programs 0 0 0 0 0 2 24 107 26 20 179Attrition & Other Losses 0 0 0 0 0 0 7 30 8 5 50Total losses 3 10 22 37 520 1,499 2,897 4,228 3,813 3,782 16,811End Strength 12 36 92 136 3,266 9,817 13,739 23,103 7,272 7,096 64,569
Begin Strength 12 36 92 136 3,266 9,817 13,739 23,103 7,272 7,096 64,569Motion In 3 10 23 36 407 1,458 2,879 3,667 3,742 0 12,225Regular Accessions 0 0 0 0 0 0 0 0 0 2,718 2,718Commissioning & Transfer Programs 0 0 0 0 0 0 0 50 50 1,037 1,137Direct Appointments & Health Profession Scholarship
0 0 0 0 0 8 52 440 0 0 500
Other Gains 0 0 0 0 0 0 0 0 0 0 0Total Gains 3 10 23 36 407 1,466 2,931 4,157 3,792 3,755 16,580Motion Out 0 3 10 23 36 407 1,458 2,879 3,667 3,742 12,225Regular Separations 0 2 2 5 11 111 787 946 166 35 2,065Retirements (Disability & Non-Disability) 3 5 11 8 472 882 592 118 7 2 2,100Separation Programs 0 0 0 0 0 2 24 107 26 20 179Attrition & Other Losses 0 0 0 0 0 0 7 30 8 5 50Total losses 3 10 23 36 519 1,402 2,868 4,080 3,874 3,804 16,619End Strength 12 36 92 136 3,154 9,881 13,802 23,180 7,190 7,047 64,530
FY 2015
FY 2016
Commissioned Officers TotalGrade

31
Table 3-1d (continued): Air Force Active Duty Officer Gains and Losses
O-10 O-9 O-8 O-7 O-6 O-5 O-4 O-3 O-2 O-1
Begin Strength 12 36 92 136 3,154 9,881 13,802 23,180 7,190 7,047 64,530Motion In 3 10 23 36 407 1,458 2,879 3,667 3,742 0 12,225Regular Accessions 0 0 0 0 0 0 0 0 0 2,718 2,718Commissioning & Transfer Programs 0 0 0 0 0 0 0 50 50 1,006 1,106Direct Appointments & Health Profession Scholarship
0 0 0 0 0 8 52 440 0 0 500
Other Gains 0 0 0 0 0 0 0 0 0 0 0Total Gains 3 10 23 36 407 1,466 2,931 4,157 3,792 3,724 16,549Motion Out 0 3 10 23 36 407 1,458 2,879 3,667 3,742 12,225Regular Separations 0 2 2 5 11 111 737 926 166 35 1,995Retirements (Disability & Non-Disability) 3 5 11 8 472 882 592 118 7 2 2,100Separation Programs 0 0 0 0 0 2 24 107 26 20 179Attrition & Other Losses 0 0 0 0 0 0 7 30 8 5 50Total losses 3 10 23 36 519 1,402 2,818 4,060 3,874 3,804 16,549End Strength 12 36 92 136 3,042 9,945 13,915 23,277 7,108 6,967 64,530
Begin Strength 12 36 92 136 3,042 9,945 13,915 23,277 7,108 6,967 64,530Motion In 3 10 23 36 407 1,458 2,879 3,667 3,742 0 12,225Regular Accessions 0 0 0 0 0 0 0 0 0 2,718 2,718Commissioning & Transfer Programs 0 0 0 0 0 0 0 50 50 1,006 1,106Direct Appointments & Health Profession Scholarship
0 0 0 0 0 8 52 440 0 0 500
Other Gains 0 0 0 0 0 0 0 0 0 0 0Total Gains 3 10 23 36 407 1,466 2,931 4,157 3,792 3,724 16,549Motion Out 0 3 10 23 36 407 1,458 2,879 3,667 3,742 12,225Regular Separations 0 2 2 5 11 111 711 936 166 35 1,979Retirements (Disability & Non-Disability) 3 5 11 8 472 882 592 118 7 2 2,100Separation Programs 0 0 0 0 0 2 24 107 26 20 179Attrition & Other Losses 0 0 0 0 0 0 7 30 8 5 50Total losses 3 10 23 36 519 1,402 2,792 4,070 3,874 3,804 16,533End Strength 12 36 92 136 2,930 10,009 14,054 23,364 7,026 6,887 64,546
FY 2017
FY 2018
Grade Commissioned Officers Total

32
Table 3-2a: Army Active Duty Officer Retirements by YOCS
YOCS O-10 O-9 O-8 O-7 O-6 O-5 O-4 O-3 O-2 O-1 Total30+ 4 12 7 13 158 11 1 0 0 0 20629 0 0 1 4 64 0 0 0 0 0 6928 0 0 0 7 64 10 0 0 0 0 8027 0 0 0 2 65 16 0 0 0 0 8326 0 0 0 0 114 27 0 0 0 0 14225 0 0 0 0 70 34 0 0 0 0 10524 0 0 0 0 47 48 3 0 0 0 9823 0 0 0 0 33 62 1 0 0 0 9622 0 0 0 0 17 137 1 0 0 0 15521 0 0 0 0 18 156 4 0 0 0 17820 0 0 0 0 17 377 11 0 0 0 40519 0 0 0 0 0 113 4 0 0 0 11818 0 0 0 0 0 43 8 0 0 0 5117 0 0 0 0 0 14 4 0 0 0 1816 0 0 0 0 0 11 7 0 0 0 1715 0 0 0 0 0 0 9 0 0 0 914 0 0 0 0 0 0 7 0 0 0 713 0 0 0 0 0 0 7 0 0 0 712 0 0 0 0 0 0 7 0 0 0 711 0 0 0 0 0 0 7 0 0 0 710 0 0 0 0 0 0 7 0 0 0 79 0 0 0 0 0 0 1 0 0 0 18 0 0 0 0 0 0 0 0 0 0 07 0 0 0 0 0 0 0 0 0 0 06 0 0 0 0 0 0 0 0 0 0 05 0 0 0 0 0 0 0 0 0 0 04 0 0 0 0 0 0 0 0 0 0 03 0 0 0 0 0 0 0 0 0 0 02 0 0 0 0 0 0 0 0 0 0 01 0 0 0 0 0 0 0 0 0 0 00 0 0 0 0 0 0 0 0 0 0 0
Total 4 12 8 26 665 1,058 91 0 0 0 1,864
YOCS O-10 O-9 O-8 O-7 O-6 O-5 O-4 O-3 O-2 O-1 Total30+ 4 12 7 14 182 12 1 0 0 0 23229 0 0 1 5 73 0 0 0 0 0 7928 0 0 0 7 73 11 0 0 0 0 9127 0 0 0 2 75 18 0 0 0 0 9526 0 0 0 0 132 29 0 0 0 0 16225 0 0 0 0 81 37 0 0 0 0 11924 0 0 0 0 54 53 3 0 0 0 11023 0 0 0 0 38 68 1 0 0 0 10722 0 0 0 0 20 150 1 0 0 0 17121 0 0 0 0 21 171 4 0 0 0 19520 0 0 0 0 20 413 11 0 0 0 44319 0 0 0 0 0 124 4 0 0 0 12818 0 0 0 0 0 47 9 0 0 0 5517 0 0 0 0 0 15 4 0 0 0 2016 0 0 0 0 0 12 7 0 0 0 1915 0 0 0 0 0 0 9 0 0 0 914 0 0 0 0 0 0 8 0 0 0 813 0 0 0 0 0 0 7 0 0 0 712 0 0 0 0 0 0 7 0 0 0 711 0 0 0 0 0 0 7 0 0 0 710 0 0 0 0 0 0 7 0 0 0 79 0 0 0 0 0 0 1 0 0 0 18 0 0 0 0 0 0 0 0 0 0 07 0 0 0 0 0 0 0 0 0 0 06 0 0 0 0 0 0 0 0 0 0 05 0 0 0 0 0 0 0 0 0 0 04 0 0 0 0 0 0 0 0 0 0 03 0 0 0 0 0 0 0 0 0 0 02 0 0 0 0 0 0 0 0 0 0 01 0 0 0 0 0 0 0 0 0 0 00 0 0 0 0 0 0 0 0 0 0 0
Total 4 12 8 27 768 1,157 95 0 0 0 2,070
FY 2013
FY 2014

33
Table 3-2a (continued): Army Active Duty Officer Retirements by YOCS
YOCS O-10 O-9 O-8 O-7 O-6 O-5 O-4 O-3 O-2 O-1 Total30+ 4 12 7 10 185 12 1 0 0 0 23129 0 0 1 3 75 0 0 0 0 0 7928 0 0 0 5 75 11 0 0 0 0 9027 0 0 0 2 76 18 0 0 0 0 9526 0 0 0 0 134 29 0 0 0 0 16425 0 0 0 0 82 37 0 0 0 0 12024 0 0 0 0 55 53 3 0 0 0 11123 0 0 0 0 39 68 1 0 0 0 10822 0 0 0 0 20 150 1 0 0 0 17121 0 0 0 0 21 171 4 0 0 0 19620 0 0 0 0 20 413 11 0 0 0 44419 0 0 0 0 0 124 4 0 0 0 12818 0 0 0 0 0 47 9 0 0 0 5517 0 0 0 0 0 15 4 0 0 0 2016 0 0 0 0 0 12 7 0 0 0 1915 0 0 0 0 0 0 9 0 0 0 914 0 0 0 0 0 0 8 0 0 0 813 0 0 0 0 0 0 7 0 0 0 712 0 0 0 0 0 0 7 0 0 0 711 0 0 0 0 0 0 7 0 0 0 710 0 0 0 0 0 0 7 0 0 0 79 0 0 0 0 0 0 1 0 0 0 18 0 0 0 0 0 0 0 0 0 0 07 0 0 0 0 0 0 0 0 0 0 06 0 0 0 0 0 0 0 0 0 0 05 0 0 0 0 0 0 0 0 0 0 04 0 0 0 0 0 0 0 0 0 0 03 0 0 0 0 0 0 0 0 0 0 02 0 0 0 0 0 0 0 0 0 0 01 0 0 0 0 0 0 0 0 0 0 01 0 0 0 0 0 0 0 0 0 0 0
Total 4 12 8 20 780 1,159 93 0 0 0 2,076
YOCS O-10 O-9 O-8 O-7 O-6 O-5 O-4 O-3 O-2 O-1 Total30+ 4 12 7 10 172 11 1 0 0 0 21729 0 0 1 3 69 0 0 0 0 0 7328 0 0 0 5 69 10 0 0 0 0 8427 0 0 0 2 70 16 0 0 0 0 8926 0 0 0 0 124 27 0 0 0 0 15225 0 0 0 0 76 35 0 0 0 0 11224 0 0 0 0 51 49 3 0 0 0 10323 0 0 0 0 36 64 1 0 0 0 10122 0 0 0 0 18 141 1 0 0 0 16021 0 0 0 0 20 160 4 0 0 0 18420 0 0 0 0 18 388 11 0 0 0 41819 0 0 0 0 0 116 4 0 0 0 12118 0 0 0 0 0 44 9 0 0 0 5317 0 0 0 0 0 14 4 0 0 0 1916 0 0 0 0 0 11 7 0 0 0 1815 0 0 0 0 0 0 9 0 0 0 914 0 0 0 0 0 0 8 0 0 0 813 0 0 0 0 0 0 7 0 0 0 712 0 0 0 0 0 0 7 0 0 0 711 0 0 0 0 0 0 7 0 0 0 710 0 0 0 0 0 0 7 0 0 0 79 0 0 0 0 0 0 1 0 0 0 18 0 0 0 0 0 0 0 0 0 0 07 0 0 0 0 0 0 0 0 0 0 06 0 0 0 0 0 0 0 0 0 0 05 0 0 0 0 0 0 0 0 0 0 04 0 0 0 0 0 0 0 0 0 0 03 0 0 0 0 0 0 0 0 0 0 02 0 0 0 0 0 0 0 0 0 0 01 0 0 0 0 0 0 0 0 0 0 00 0 0 0 0 0 0 0 0 0 0 0
Total 4 12 8 20 723 1,088 94 0 0 0 1,949
FY 2015
FY 2016

34
Table 3-2a (continued): Army Active Duty Officer Retirements by YOCS
YOCS O-10 O-9 O-8 O-7 O-6 O-5 O-4 O-3 O-2 O-1 Total30+ 4 12 7 10 164 11 1 0 0 0 20929 0 0 1 3 66 0 0 0 0 0 7028 0 0 0 5 66 10 0 0 0 0 8127 0 0 0 2 67 16 0 0 0 0 8526 0 0 0 0 119 27 0 0 0 0 14625 0 0 0 0 73 35 0 0 0 0 10824 0 0 0 0 48 49 3 0 0 0 10023 0 0 0 0 34 63 1 0 0 0 9822 0 0 0 0 18 138 1 0 0 0 15721 0 0 0 0 19 158 4 0 0 0 18020 0 0 0 0 18 382 11 0 0 0 41019 0 0 0 0 0 115 4 0 0 0 11918 0 0 0 0 0 43 9 0 0 0 5217 0 0 0 0 0 14 4 0 0 0 1816 0 0 0 0 0 11 7 0 0 0 1815 0 0 0 0 0 0 9 0 0 0 914 0 0 0 0 0 0 8 0 0 0 813 0 0 0 0 0 0 7 0 0 0 712 0 0 0 0 0 0 7 0 0 0 711 0 0 0 0 0 0 7 0 0 0 710 0 0 0 0 0 0 7 0 0 0 79 0 0 0 0 0 0 1 0 0 0 18 0 0 0 0 0 0 0 0 0 0 07 0 0 0 0 0 0 0 0 0 0 06 0 0 0 0 0 0 0 0 0 0 05 0 0 0 0 0 0 0 0 0 0 04 0 0 0 0 0 0 0 0 0 0 03 0 0 0 0 0 0 0 0 0 0 02 0 0 0 0 0 0 0 0 0 0 01 0 0 0 0 0 0 0 0 0 0 00 0 0 0 0 0 0 0 0 0 0 0
Total 4 12 8 20 690 1,070 93 0 0 0 1,898
YOCS O-10 O-9 O-8 O-7 O-6 O-5 O-4 O-3 O-2 O-1 Total30+ 4 12 7 11 162 11 1 0 0 0 20729 0 0 1 4 65 0 0 0 0 0 7028 0 0 0 5 65 10 0 0 0 0 8027 0 0 0 2 66 16 0 0 0 0 8426 0 0 0 0 117 27 0 0 0 0 14425 0 0 0 0 72 34 0 0 0 0 10624 0 0 0 0 48 48 3 0 0 0 9923 0 0 0 0 34 62 1 0 0 0 9722 0 0 0 0 17 137 1 0 0 0 15521 0 0 0 0 18 156 4 0 0 0 17820 0 0 0 0 17 377 11 0 0 0 40519 0 0 0 0 0 113 4 0 0 0 11818 0 0 0 0 0 43 9 0 0 0 5117 0 0 0 0 0 14 4 0 0 0 1816 0 0 0 0 0 11 7 0 0 0 1815 0 0 0 0 0 0 9 0 0 0 914 0 0 0 0 0 0 8 0 0 0 813 0 0 0 0 0 0 7 0 0 0 712 0 0 0 0 0 0 7 0 0 0 711 0 0 0 0 0 0 7 0 0 0 710 0 0 0 0 0 0 7 0 0 0 79 0 0 0 0 0 0 1 0 0 0 18 0 0 0 0 0 0 0 0 0 0 07 0 0 0 0 0 0 0 0 0 0 06 0 0 0 0 0 0 0 0 0 0 05 0 0 0 0 0 0 0 0 0 0 04 0 0 0 0 0 0 0 0 0 0 03 0 0 0 0 0 0 0 0 0 0 02 0 0 0 0 0 0 0 0 0 0 01 0 0 0 0 0 0 0 0 0 0 00 0 0 0 0 0 0 0 0 0 0 0
Total 4 12 8 21 681 1,056 95 0 0 0 1,878
FY 2017
FY 2018
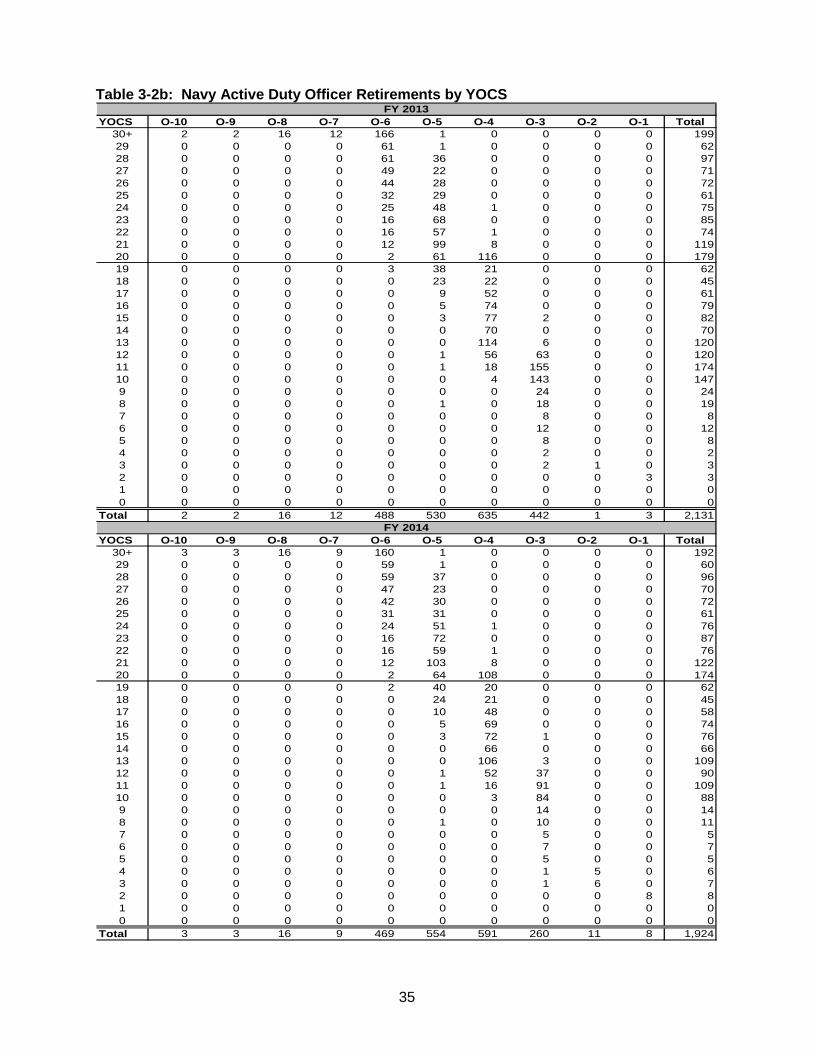
35
Table 3-2b: Navy Active Duty Officer Retirements by YOCS
YOCS O-10 O-9 O-8 O-7 O-6 O-5 O-4 O-3 O-2 O-1 Total30+ 2 2 16 12 166 1 0 0 0 0 19929 0 0 0 0 61 1 0 0 0 0 6228 0 0 0 0 61 36 0 0 0 0 9727 0 0 0 0 49 22 0 0 0 0 7126 0 0 0 0 44 28 0 0 0 0 7225 0 0 0 0 32 29 0 0 0 0 6124 0 0 0 0 25 48 1 0 0 0 7523 0 0 0 0 16 68 0 0 0 0 8522 0 0 0 0 16 57 1 0 0 0 7421 0 0 0 0 12 99 8 0 0 0 11920 0 0 0 0 2 61 116 0 0 0 17919 0 0 0 0 3 38 21 0 0 0 6218 0 0 0 0 0 23 22 0 0 0 4517 0 0 0 0 0 9 52 0 0 0 6116 0 0 0 0 0 5 74 0 0 0 7915 0 0 0 0 0 3 77 2 0 0 8214 0 0 0 0 0 0 70 0 0 0 7013 0 0 0 0 0 0 114 6 0 0 12012 0 0 0 0 0 1 56 63 0 0 12011 0 0 0 0 0 1 18 155 0 0 17410 0 0 0 0 0 0 4 143 0 0 1479 0 0 0 0 0 0 0 24 0 0 248 0 0 0 0 0 1 0 18 0 0 197 0 0 0 0 0 0 0 8 0 0 86 0 0 0 0 0 0 0 12 0 0 125 0 0 0 0 0 0 0 8 0 0 84 0 0 0 0 0 0 0 2 0 0 23 0 0 0 0 0 0 0 2 1 0 32 0 0 0 0 0 0 0 0 0 3 31 0 0 0 0 0 0 0 0 0 0 00 0 0 0 0 0 0 0 0 0 0 0
Total 2 2 16 12 488 530 635 442 1 3 2,131
YOCS O-10 O-9 O-8 O-7 O-6 O-5 O-4 O-3 O-2 O-1 Total30+ 3 3 16 9 160 1 0 0 0 0 19229 0 0 0 0 59 1 0 0 0 0 6028 0 0 0 0 59 37 0 0 0 0 9627 0 0 0 0 47 23 0 0 0 0 7026 0 0 0 0 42 30 0 0 0 0 7225 0 0 0 0 31 31 0 0 0 0 6124 0 0 0 0 24 51 1 0 0 0 7623 0 0 0 0 16 72 0 0 0 0 8722 0 0 0 0 16 59 1 0 0 0 7621 0 0 0 0 12 103 8 0 0 0 12220 0 0 0 0 2 64 108 0 0 0 17419 0 0 0 0 2 40 20 0 0 0 6218 0 0 0 0 0 24 21 0 0 0 4517 0 0 0 0 0 10 48 0 0 0 5816 0 0 0 0 0 5 69 0 0 0 7415 0 0 0 0 0 3 72 1 0 0 7614 0 0 0 0 0 0 66 0 0 0 6613 0 0 0 0 0 0 106 3 0 0 10912 0 0 0 0 0 1 52 37 0 0 9011 0 0 0 0 0 1 16 91 0 0 10910 0 0 0 0 0 0 3 84 0 0 889 0 0 0 0 0 0 0 14 0 0 148 0 0 0 0 0 1 0 10 0 0 117 0 0 0 0 0 0 0 5 0 0 56 0 0 0 0 0 0 0 7 0 0 75 0 0 0 0 0 0 0 5 0 0 54 0 0 0 0 0 0 0 1 5 0 63 0 0 0 0 0 0 0 1 6 0 72 0 0 0 0 0 0 0 0 0 8 81 0 0 0 0 0 0 0 0 0 0 00 0 0 0 0 0 0 0 0 0 0 0
Total 3 3 16 9 469 554 591 260 11 8 1,924
FY 2013
FY 2014

36
Table3-2b (continued): Navy Active Duty Officer Retirements by YOCS
YOCS O-10 O-9 O-8 O-7 O-6 O-5 O-4 O-3 O-2 O-1 Total30+ 3 3 11 15 163 1 0 0 0 0 19629 0 0 0 0 60 1 0 0 0 0 6128 0 0 0 0 60 38 0 0 0 0 9727 0 0 0 0 48 23 0 0 0 0 7126 0 0 0 0 43 30 0 0 0 0 7325 0 0 0 0 31 31 0 0 0 0 6224 0 0 0 0 24 51 1 0 0 0 7723 0 0 0 0 16 72 0 0 0 0 8822 0 0 0 0 16 60 1 0 0 0 7721 0 0 0 0 12 104 8 0 0 0 12420 0 0 0 0 2 65 114 0 0 0 18019 0 0 0 0 3 40 21 0 0 0 6418 0 0 0 0 0 24 22 0 0 0 4617 0 0 0 0 0 10 51 0 0 0 6016 0 0 0 0 0 5 72 0 0 0 7715 0 0 0 0 0 3 76 1 0 0 8014 0 0 0 0 0 0 69 0 0 0 6913 0 0 0 0 0 0 112 4 0 0 11612 0 0 0 0 0 1 55 43 0 0 9911 0 0 0 0 0 1 17 107 0 0 12510 0 0 0 0 0 0 3 99 0 0 1029 0 0 0 0 0 0 0 16 0 0 168 0 0 0 0 0 1 0 12 0 0 137 0 0 0 0 0 0 0 5 0 0 56 0 0 0 0 0 0 0 8 0 0 85 0 0 0 0 0 0 0 5 0 0 54 0 0 0 0 0 0 0 1 6 0 83 0 0 0 0 0 0 0 1 8 0 92 0 0 0 0 0 0 0 0 0 8 81 0 0 0 0 0 0 0 0 0 0 00 0 0 0 0 0 0 0 0 0 0 0
Total 3 3 11 15 477 560 622 304 14 8 2,017
YOCS O-10 O-9 O-8 O-7 O-6 O-5 O-4 O-3 O-2 O-1 Total30+ 3 3 11 15 164 1 0 0 0 0 19729 0 0 0 0 60 1 0 0 0 0 6128 0 0 0 0 60 38 0 0 0 0 9827 0 0 0 0 49 23 0 0 0 0 7226 0 0 0 0 43 30 0 0 0 0 7425 0 0 0 0 32 31 0 0 0 0 6324 0 0 0 0 25 52 1 0 0 0 7723 0 0 0 0 16 73 0 0 0 0 8922 0 0 0 0 16 60 1 0 0 0 7821 0 0 0 0 12 105 8 0 0 0 12520 0 0 0 0 2 65 115 0 0 0 18219 0 0 0 0 3 41 21 0 0 0 6418 0 0 0 0 0 24 22 0 0 0 4617 0 0 0 0 0 10 51 0 0 0 6116 0 0 0 0 0 5 73 0 0 0 7815 0 0 0 0 0 3 77 1 0 0 8114 0 0 0 0 0 0 70 0 0 0 7013 0 0 0 0 0 0 113 4 0 0 11712 0 0 0 0 0 1 56 42 0 0 9911 0 0 0 0 0 1 17 104 0 0 12310 0 0 0 0 0 0 3 96 0 0 1009 0 0 0 0 0 0 0 16 0 0 168 0 0 0 0 0 1 0 12 0 0 137 0 0 0 0 0 0 0 5 0 0 56 0 0 0 0 0 0 0 8 0 0 85 0 0 0 0 0 0 0 5 0 0 54 0 0 0 0 0 0 0 1 6 0 83 0 0 0 0 0 0 0 1 8 0 92 0 0 0 0 0 0 0 0 0 8 81 0 0 0 0 0 0 0 0 0 0 00 0 0 0 0 0 0 0 0 0 0 0
Total 3 3 11 15 482 566 629 297 14 8 2,028
FY 2015
FY 2016

37
Table3-2b (continued): Navy Active Duty Officer Retirements by YOCS
YOCS O-10 O-9 O-8 O-7 O-6 O-5 O-4 O-3 O-2 O-1 Total30+ 3 3 11 15 165 1 0 0 0 0 19829 0 0 0 0 61 1 0 0 0 0 6228 0 0 0 0 61 38 0 0 0 0 9927 0 0 0 0 49 24 0 0 0 0 7226 0 0 0 0 44 30 0 0 0 0 7425 0 0 0 0 32 31 0 0 0 0 6324 0 0 0 0 25 52 1 0 0 0 7823 0 0 0 0 16 73 0 0 0 0 9022 0 0 0 0 16 61 1 0 0 0 7821 0 0 0 0 12 106 8 0 0 0 12620 0 0 0 0 2 66 116 0 0 0 18319 0 0 0 0 3 41 21 0 0 0 6518 0 0 0 0 0 24 22 0 0 0 4717 0 0 0 0 0 10 51 0 0 0 6116 0 0 0 0 0 5 74 0 0 0 7815 0 0 0 0 0 3 77 1 0 0 8114 0 0 0 0 0 0 70 0 0 0 7013 0 0 0 0 0 0 113 4 0 0 11712 0 0 0 0 0 1 56 40 0 0 9711 0 0 0 0 0 1 18 99 0 0 11810 0 0 0 0 0 0 4 91 0 0 959 0 0 0 0 0 0 0 15 0 0 158 0 0 0 0 0 1 0 11 0 0 127 0 0 0 0 0 0 0 5 0 0 56 0 0 0 0 0 0 0 8 0 0 85 0 0 0 0 0 0 0 5 0 0 54 0 0 0 0 0 0 0 1 6 0 73 0 0 0 0 0 0 0 1 8 0 92 0 0 0 0 0 0 0 0 0 8 81 0 0 0 0 0 0 0 0 0 0 00 0 0 0 0 0 0 0 0 0 0 0
Total 3 3 11 15 484 569 632 282 14 8 2,021
YOCS O-10 O-9 O-8 O-7 O-6 O-5 O-4 O-3 O-2 O-1 Total30+ 3 2 10 17 165 1 0 0 0 0 19829 0 0 0 0 61 1 0 0 0 0 6228 0 0 0 0 61 38 0 0 0 0 9927 0 0 0 0 49 24 0 0 0 0 7226 0 0 0 0 44 30 0 0 0 0 7425 0 0 0 0 32 31 0 0 0 0 6324 0 0 0 0 25 52 1 0 0 0 7823 0 0 0 0 16 73 0 0 0 0 9022 0 0 0 0 16 61 1 0 0 0 7821 0 0 0 0 12 106 8 0 0 0 12620 0 0 0 0 2 66 116 0 0 0 18319 0 0 0 0 3 41 21 0 0 0 6518 0 0 0 0 0 24 22 0 0 0 4717 0 0 0 0 0 10 51 0 0 0 6116 0 0 0 0 0 5 74 0 0 0 7815 0 0 0 0 0 3 77 1 0 0 8114 0 0 0 0 0 0 70 0 0 0 7013 0 0 0 0 0 0 113 4 0 0 11712 0 0 0 0 0 1 56 43 0 0 10011 0 0 0 0 0 1 18 105 0 0 12310 0 0 0 0 0 0 4 97 0 0 1019 0 0 0 0 0 0 0 16 0 0 168 0 0 0 0 0 1 0 12 0 0 137 0 0 0 0 0 0 0 5 0 0 56 0 0 0 0 0 0 0 8 0 0 85 0 0 0 0 0 0 0 5 0 0 54 0 0 0 0 0 0 0 1 6 0 83 0 0 0 0 0 0 0 1 8 0 92 0 0 0 0 0 0 0 0 0 8 81 0 0 0 0 0 0 0 0 0 0 00 0 0 0 0 0 0 0 0 0 0 0
Total 3 2 10 17 484 569 632 299 14 8 2,038
FY 2018
FY 2017

38
Table 3-2c: Marine Corps Active Duty Officer Retirements by YOCS
YOCS O-10 O-9 O-8 O-7 O-6 O-5 O-4 O-3 O-2 O-1 Total30+ 2 8 3 2 26 10 3 0 0 0 5429 0 0 0 0 9 4 6 0 0 0 1928 0 0 0 0 10 3 5 4 0 0 2227 0 0 0 0 9 5 2 2 0 0 1826 0 0 0 0 4 3 17 5 0 0 2925 0 0 0 0 6 3 8 0 0 0 1724 0 0 0 0 11 3 6 2 0 0 2223 0 0 0 0 0 8 8 2 0 0 1822 0 0 0 0 0 16 13 4 0 0 3321 0 0 0 0 0 15 26 9 0 0 5020 0 0 0 0 2 30 177 20 0 0 22919 0 0 0 0 0 0 0 0 0 0 018 0 0 0 0 0 0 0 0 0 0 017 0 0 0 0 0 0 0 0 0 0 016 0 0 0 0 0 0 0 0 0 0 015 0 0 0 0 0 0 0 0 0 0 014 0 0 0 0 0 0 0 0 0 0 013 0 0 0 0 0 0 0 0 0 0 012 0 0 0 0 0 0 0 0 0 0 011 0 0 0 0 0 0 0 0 0 0 010 0 0 0 0 0 0 0 0 0 0 09 0 0 0 0 0 0 0 0 0 0 08 0 0 0 0 0 0 0 0 0 0 07 0 0 0 0 0 0 0 0 0 0 06 0 0 0 0 0 0 0 0 0 0 05 0 0 0 0 0 0 0 0 0 0 04 0 0 0 0 0 0 0 0 0 0 03 0 0 0 0 0 0 0 0 0 0 02 0 0 0 0 0 0 0 0 0 0 01 0 0 0 0 0 0 0 0 0 0 00 0 0 0 0 0 0 0 0 0 0 0
Total 2 8 3 2 77 100 271 48 0 0 511
YOCS O-10 O-9 O-8 O-7 O-6 O-5 O-4 O-3 O-2 O-1 Total30+ 0 0 0 5 1 5 1 0 0 0 1229 0 0 0 0 1 0 0 0 0 0 128 0 0 0 0 0 1 1 0 0 0 227 0 0 0 0 0 1 0 2 0 0 326 0 0 0 0 0 1 61 0 0 0 6225 0 0 0 0 0 0 0 0 0 0 024 0 0 0 0 0 2 15 1 0 0 1823 0 0 0 0 0 3 18 23 0 0 4422 0 0 0 0 0 6 16 46 0 0 6821 0 0 0 0 0 9 21 65 0 0 9520 0 0 0 0 0 11 162 214 0 0 38719 0 0 0 0 0 0 0 0 0 0 018 0 0 0 0 0 0 0 0 0 0 017 0 0 0 0 0 0 0 0 0 0 016 0 0 0 0 0 0 0 0 0 0 015 0 0 0 0 0 0 0 0 0 0 014 0 0 0 0 0 0 0 0 0 0 013 0 0 0 0 0 0 0 0 0 0 012 0 0 0 0 0 0 0 0 0 0 011 0 0 0 0 0 0 0 0 0 0 010 0 0 0 0 0 0 0 0 0 0 09 0 0 0 0 0 0 0 0 0 0 08 0 0 0 0 0 0 0 0 0 0 07 0 0 0 0 0 0 0 0 0 0 06 0 0 0 0 0 0 0 0 0 0 05 0 0 0 0 0 0 0 0 0 0 04 0 0 0 0 0 0 0 0 0 0 03 0 0 0 0 0 0 0 0 0 0 02 0 0 0 0 0 0 0 0 0 0 01 0 0 0 0 0 0 0 0 0 0 00 0 0 0 0 0 0 0 0 0 0 0
Total 0 0 0 5 2 39 295 351 0 0 692
FY 2013
FY 2014

39
Table 3-2c (continued): Marine Corps Active Duty Officer Retirements by YOCS
YOCS O-10 O-9 O-8 O-7 O-6 O-5 O-4 O-3 O-2 O-1 Total30+ 0 0 0 2 1 9 1 0 0 0 1329 0 0 0 0 1 0 0 0 0 0 128 0 0 0 0 0 2 1 0 0 0 327 0 0 0 0 0 2 0 2 0 0 426 0 0 0 0 0 2 41 0 0 0 4325 0 0 0 0 0 0 0 0 0 0 024 0 0 0 0 0 4 10 1 0 0 1523 0 0 0 0 0 5 12 23 0 0 4022 0 0 0 0 0 11 11 46 0 0 6821 0 0 0 0 0 16 14 65 0 0 9520 0 0 0 0 0 20 110 213 0 0 34319 0 0 0 0 0 0 0 0 0 0 018 0 0 0 0 0 0 0 0 0 0 017 0 0 0 0 0 0 0 0 0 0 016 0 0 0 0 0 0 0 0 0 0 015 0 0 0 0 0 0 0 0 0 0 014 0 0 0 0 0 0 0 0 0 0 013 0 0 0 0 0 0 0 0 0 0 012 0 0 0 0 0 0 0 0 0 0 011 0 0 0 0 0 0 0 0 0 0 010 0 0 0 0 0 0 0 0 0 0 09 0 0 0 0 0 0 0 0 0 0 08 0 0 0 0 0 0 0 0 0 0 07 0 0 0 0 0 0 0 0 0 0 06 0 0 0 0 0 0 0 0 0 0 05 0 0 0 0 0 0 0 0 0 0 04 0 0 0 0 0 0 0 0 0 0 03 0 0 0 0 0 0 0 0 0 0 02 0 0 0 0 0 0 0 0 0 0 01 0 0 0 0 0 0 0 0 0 0 00 0 0 0 0 0 0 0 0 0 0 0
Total 0 0 0 2 2 71 200 350 0 0 625
YOCS O-10 O-9 O-8 O-7 O-6 O-5 O-4 O-3 O-2 O-1 Total30+ 0 0 2 2 1 12 1 0 0 0 1829 0 0 0 0 0 0 0 0 0 0 028 0 0 0 0 0 3 1 0 0 0 427 0 0 0 0 0 3 0 2 0 0 526 0 0 0 0 0 3 42 0 0 0 4525 0 0 0 0 0 0 0 0 0 0 024 0 0 0 0 0 5 10 1 0 0 1623 0 0 0 0 0 6 12 24 0 0 4222 0 0 0 0 0 14 11 47 0 0 7221 0 0 0 0 0 21 14 67 0 0 10220 0 0 0 0 0 25 114 219 0 0 35819 0 0 0 0 0 0 0 0 0 0 018 0 0 0 0 0 0 0 0 0 0 017 0 0 0 0 0 0 0 0 0 0 016 0 0 0 0 0 0 0 0 0 0 015 0 0 0 0 0 0 0 0 0 0 014 0 0 0 0 0 0 0 0 0 0 013 0 0 0 0 0 0 0 0 0 0 012 0 0 0 0 0 0 0 0 0 0 011 0 0 0 0 0 0 0 0 0 0 010 0 0 0 0 0 0 0 0 0 0 09 0 0 0 0 0 0 0 0 0 0 08 0 0 0 0 0 0 0 0 0 0 07 0 0 0 0 0 0 0 0 0 0 06 0 0 0 0 0 0 0 0 0 0 05 0 0 0 0 0 0 0 0 0 0 04 0 0 0 0 0 0 0 0 0 0 03 0 0 0 0 0 0 0 0 0 0 02 0 0 0 0 0 0 0 0 0 0 01 0 0 0 0 0 0 0 0 0 0 00 0 0 0 0 0 0 0 0 0 0 0
Total 0 0 2 2 1 92 205 360 0 0 662
FY 2015
FY 2016

40
Table 3-2c (continued): Marine Corps Active Duty Officer Retirements by YOCS
YOCS O-10 O-9 O-8 O-7 O-6 O-5 O-4 O-3 O-2 O-1 Total30+ 0 0 2 2 1 12 1 0 0 0 1829 0 0 0 0 0 0 0 0 0 0 028 0 0 0 0 0 3 1 0 0 0 427 0 0 0 0 0 3 0 2 0 0 526 0 0 0 0 0 3 42 0 0 0 4525 0 0 0 0 0 0 0 0 0 0 024 0 0 0 0 0 5 10 1 0 0 1623 0 0 0 0 0 6 12 25 0 0 4322 0 0 0 0 0 14 11 48 0 0 7321 0 0 0 0 0 21 14 68 0 0 10320 0 0 0 0 0 25 114 224 0 0 36319 0 0 0 0 0 0 0 0 0 0 018 0 0 0 0 0 0 0 0 0 0 017 0 0 0 0 0 0 0 0 0 0 016 0 0 0 0 0 0 0 0 0 0 015 0 0 0 0 0 0 0 0 0 0 014 0 0 0 0 0 0 0 0 0 0 013 0 0 0 0 0 0 0 0 0 0 012 0 0 0 0 0 0 0 0 0 0 011 0 0 0 0 0 0 0 0 0 0 010 0 0 0 0 0 0 0 0 0 0 09 0 0 0 0 0 0 0 0 0 0 08 0 0 0 0 0 0 0 0 0 0 07 0 0 0 0 0 0 0 0 0 0 06 0 0 0 0 0 0 0 0 0 0 05 0 0 0 0 0 0 0 0 0 0 04 0 0 0 0 0 0 0 0 0 0 03 0 0 0 0 0 0 0 0 0 0 02 0 0 0 0 0 0 0 0 0 0 01 0 0 0 0 0 0 0 0 0 0 00 0 0 0 0 0 0 0 0 0 0 0
Total 0 0 2 2 1 92 205 368 0 0 670
YOCS O-10 O-9 O-8 O-7 O-6 O-5 O-4 O-3 O-2 O-1 Total30+ 0 0 0 0 2 12 0 0 0 0 1429 0 0 0 0 0 0 0 0 0 0 028 0 0 0 0 0 3 0 0 0 0 327 0 0 0 0 0 3 0 2 0 0 526 0 0 0 0 0 3 17 0 0 0 2025 0 0 0 0 0 0 0 0 0 0 024 0 0 0 0 0 5 4 1 0 0 1023 0 0 0 0 0 6 5 25 0 0 3622 0 0 0 0 0 14 5 48 0 0 6721 0 0 0 0 0 21 6 68 0 0 9520 0 0 0 0 0 25 48 224 0 0 29719 0 0 0 0 0 0 0 0 0 0 018 0 0 0 0 0 0 0 0 0 0 017 0 0 0 0 0 0 0 0 0 0 016 0 0 0 0 0 0 0 0 0 0 015 0 0 0 0 0 0 0 0 0 0 014 0 0 0 0 0 0 0 0 0 0 013 0 0 0 0 0 0 0 0 0 0 012 0 0 0 0 0 0 0 0 0 0 011 0 0 0 0 0 0 0 0 0 0 010 0 0 0 0 0 0 0 0 0 0 09 0 0 0 0 0 0 0 0 0 0 08 0 0 0 0 0 0 0 0 0 0 07 0 0 0 0 0 0 0 0 0 0 06 0 0 0 0 0 0 0 0 0 0 05 0 0 0 0 0 0 0 0 0 0 04 0 0 0 0 0 0 0 0 0 0 03 0 0 0 0 0 0 0 0 0 0 02 0 0 0 0 0 0 0 0 0 0 01 0 0 0 0 0 0 0 0 0 0 00 0 0 0 0 0 0 0 0 0 0 0
Total 0 0 0 0 2 92 85 368 0 0 547
FY 2017
FY 2018

41
Table 3-2d: Air Force Active Duty Officer Retirements by YOCS
YOCS O-10 O-9 O-8 O-7 O-6 O-5 O-4 O-3 O-2 O-1 Total30+ 5 7 18 3 70 0 0 0 0 0 10329 0 0 0 3 39 0 0 0 0 0 4228 0 0 0 3 47 17 0 0 0 0 6727 0 0 0 2 74 10 0 0 0 0 8626 0 0 0 0 89 12 0 0 0 0 10125 0 0 0 0 94 23 0 0 0 0 11724 0 0 0 0 53 33 47 0 0 0 13323 0 0 0 0 34 55 17 0 0 0 10622 0 0 0 0 26 62 22 0 0 0 11021 0 0 0 0 24 160 28 0 0 0 21220 0 0 0 0 21 24 289 13 0 0 34719 0 0 0 0 1 12 80 4 0 0 9718 0 0 0 0 1 13 12 1 0 0 2717 0 0 0 0 0 4 17 1 0 0 2216 0 0 0 0 0 4 36 2 0 0 4215 0 0 0 0 0 9 29 2 0 0 4014 0 0 0 0 0 7 22 1 0 0 3013 0 0 0 0 0 5 28 7 0 0 4012 0 0 0 0 0 4 30 22 0 0 5611 0 0 0 0 0 1 30 42 0 0 7310 0 0 0 0 0 1 40 35 0 0 769 0 0 0 0 0 0 6 49 0 0 558 0 0 0 0 0 0 5 65 1 0 717 0 0 0 0 0 0 0 72 6 0 786 0 0 0 0 0 0 2 143 58 0 2035 0 0 0 0 0 0 0 42 76 0 1184 0 0 0 0 0 0 0 19 5 0 243 0 0 0 0 0 0 0 2 0 1 32 0 0 0 0 0 0 0 0 0 9 91 0 0 0 0 0 0 0 0 0 0 00 0 0 0 0 0 0 0 0 0 0 0
Total 5 7 18 11 573 456 740 522 146 10 2,488
YOCS O-10 O-9 O-8 O-7 O-6 O-5 O-4 O-3 O-2 O-1 Total30+ 3 10 11 6 65 0 0 0 0 0 9529 0 0 0 5 33 0 0 0 0 0 3828 0 0 0 5 42 31 0 0 0 0 7827 0 0 0 5 55 16 0 0 0 0 7626 0 0 0 5 61 29 0 0 0 0 9525 0 0 0 0 59 51 0 0 0 0 11024 0 0 0 0 34 46 37 0 0 0 11723 0 0 0 0 21 51 17 0 0 0 8922 0 0 0 0 20 91 22 0 0 0 13321 0 0 0 0 19 117 28 0 0 0 16420 0 0 0 0 21 259 169 28 0 0 47719 0 0 0 0 1 61 55 9 0 0 12618 0 0 0 0 1 22 12 3 0 0 3817 0 0 0 0 0 9 17 3 0 0 2916 0 0 0 0 0 9 36 6 0 0 5115 0 0 0 0 0 3 32 8 0 0 4314 0 0 0 0 0 3 27 3 0 0 3313 0 0 0 0 0 3 38 4 0 0 4512 0 0 0 0 0 1 34 4 0 0 3911 0 0 0 0 0 0 35 6 0 0 4110 0 0 0 0 0 0 30 36 0 0 669 0 0 0 0 0 0 6 6 0 0 128 0 0 0 0 0 0 5 42 0 0 477 0 0 0 0 0 0 0 18 0 0 186 0 0 0 0 0 0 2 16 0 0 185 0 0 0 0 0 0 0 7 0 0 74 0 0 0 0 0 0 0 5 0 0 53 0 0 0 0 0 0 0 1 2 0 32 0 0 0 0 0 0 0 1 4 0 51 0 0 0 0 0 0 0 1 1 0 20 0 0 0 0 0 0 0 0 0 0 0
Total 3 10 11 26 432 802 602 207 7 0 2,100
FY 2013
FY 2014

42
Table 3-2d (continued): Air Force Active Duty Officer Retirements by YOCS
YOCS O-10 O-9 O-8 O-7 O-6 O-5 O-4 O-3 O-2 O-1 Total30+ 3 5 11 3 67 1 0 0 0 0 9029 0 0 0 3 37 0 0 0 0 0 4028 0 0 0 1 44 31 0 0 0 0 7627 0 0 0 1 55 16 0 0 0 0 7226 0 0 0 0 83 28 0 0 0 0 11125 0 0 0 0 74 48 0 0 0 0 12224 0 0 0 0 40 45 36 0 0 0 12123 0 0 0 0 23 60 13 0 0 0 9622 0 0 0 0 20 109 16 0 0 0 14521 0 0 0 0 17 125 22 0 0 0 16420 0 0 0 0 21 332 222 18 0 0 59319 0 0 0 0 1 61 61 4 0 0 12718 0 0 0 0 1 21 9 1 0 0 3217 0 0 0 0 0 10 13 1 0 0 2416 0 0 0 0 0 10 28 2 0 0 4015 0 0 0 0 0 2 25 3 0 0 3014 0 0 0 0 0 1 22 1 0 0 2413 0 0 0 0 0 1 29 3 0 0 3312 0 0 0 0 0 1 31 3 0 0 3511 0 0 0 0 0 0 31 6 0 0 3710 0 0 0 0 0 0 39 25 0 0 649 0 0 0 0 0 0 4 6 0 0 108 0 0 0 0 0 0 3 20 0 0 237 0 0 0 0 0 0 0 7 0 0 76 0 0 0 0 0 0 1 7 0 0 85 0 0 0 0 0 0 0 6 0 0 64 0 0 0 0 0 0 0 5 0 0 53 0 0 0 0 0 0 1 1 2 0 42 0 0 0 0 0 0 0 1 4 0 51 0 0 0 0 0 0 0 1 1 1 30 0 0 0 0 0 0 0 0 0 1 1
Total 3 5 11 8 483 902 606 121 7 2 2,148
YOCS O-10 O-9 O-8 O-7 O-6 O-5 O-4 O-3 O-2 O-1 Total30+ 3 5 11 3 67 1 0 0 0 0 9029 0 0 0 3 37 0 0 0 0 0 4028 0 0 0 1 44 31 0 0 0 0 7627 0 0 0 1 55 16 0 0 0 0 7226 0 0 0 0 77 28 0 0 0 0 10525 0 0 0 0 69 48 0 0 0 0 11724 0 0 0 0 40 45 36 0 0 0 12123 0 0 0 0 23 60 13 0 0 0 9622 0 0 0 0 20 109 16 0 0 0 14521 0 0 0 0 17 125 22 0 0 0 16420 0 0 0 0 21 312 208 15 0 0 55619 0 0 0 0 1 61 61 4 0 0 12718 0 0 0 0 1 21 9 1 0 0 3217 0 0 0 0 0 10 13 1 0 0 2416 0 0 0 0 0 10 28 2 0 0 4015 0 0 0 0 0 2 25 3 0 0 3014 0 0 0 0 0 1 22 1 0 0 2413 0 0 0 0 0 1 29 3 0 0 3312 0 0 0 0 0 1 31 3 0 0 3511 0 0 0 0 0 0 31 6 0 0 3710 0 0 0 0 0 0 39 25 0 0 649 0 0 0 0 0 0 4 6 0 0 108 0 0 0 0 0 0 3 20 0 0 237 0 0 0 0 0 0 0 7 0 0 76 0 0 0 0 0 0 1 7 0 0 85 0 0 0 0 0 0 0 6 0 0 64 0 0 0 0 0 0 0 5 0 0 53 0 0 0 0 0 0 1 1 2 0 42 0 0 0 0 0 0 0 1 4 0 51 0 0 0 0 0 0 0 1 1 1 30 0 0 0 0 0 0 0 0 0 1 1
Total 3 5 11 8 472 882 592 118 7 2 2,100
FY 2015
FY 2016

43
Table 3-2d (continued): Air Force Active Duty Officer Retirements by YOCS YOCS O-10 O-9 O-8 O-7 O-6 O-5 O-4 O-3 O-2 O-1 Total
30+ 3 5 11 3 65 1 0 0 0 0 8829 0 0 0 3 36 0 0 0 0 0 3928 0 0 0 1 43 30 0 0 0 0 7427 0 0 0 1 54 16 0 0 0 0 7126 0 0 0 0 81 27 0 0 0 0 10825 0 0 0 0 73 47 0 0 0 0 12024 0 0 0 0 39 44 35 0 0 0 11823 0 0 0 0 22 59 13 0 0 0 9422 0 0 0 0 20 106 16 0 0 0 14221 0 0 0 0 17 122 21 0 0 0 16020 0 0 0 0 20 325 217 17 0 0 57919 0 0 0 0 1 59 60 4 0 0 12418 0 0 0 0 1 21 9 1 0 0 3217 0 0 0 0 0 10 13 1 0 0 2416 0 0 0 0 0 10 27 2 0 0 3915 0 0 0 0 0 2 24 3 0 0 2914 0 0 0 0 0 1 21 1 0 0 2313 0 0 0 0 0 1 28 3 0 0 3212 0 0 0 0 0 1 30 3 0 0 3411 0 0 0 0 0 0 30 6 0 0 3610 0 0 0 0 0 0 38 24 0 0 629 0 0 0 0 0 0 4 6 0 0 108 0 0 0 0 0 0 3 19 0 0 227 0 0 0 0 0 0 0 7 0 0 76 0 0 0 0 0 0 1 7 0 0 85 0 0 0 0 0 0 0 6 0 0 64 0 0 0 0 0 0 0 5 0 0 53 0 0 0 0 0 0 1 1 2 0 42 0 0 0 0 0 0 1 1 4 0 61 0 0 0 0 0 0 0 1 1 1 30 0 0 0 0 0 0 0 0 0 1 1
Total 3 5 11 8 472 882 592 118 7 2 2,100
YOCS O-10 O-9 O-8 O-7 O-6 O-5 O-4 O-3 O-2 O-1 Total30+ 3 5 11 3 65 1 0 0 0 0 8829 0 0 0 3 36 0 0 0 0 0 3928 0 0 0 1 43 30 0 0 0 0 7427 0 0 0 1 54 16 0 0 0 0 7126 0 0 0 0 81 27 0 0 0 0 10825 0 0 0 0 73 47 0 0 0 0 12024 0 0 0 0 39 44 35 0 0 0 11823 0 0 0 0 22 59 13 0 0 0 9422 0 0 0 0 20 106 16 0 0 0 14221 0 0 0 0 17 122 21 0 0 0 16020 0 0 0 0 20 325 217 17 0 0 57919 0 0 0 0 1 59 60 4 0 0 12418 0 0 0 0 1 21 9 1 0 0 3217 0 0 0 0 0 10 13 1 0 0 2416 0 0 0 0 0 10 27 2 0 0 3915 0 0 0 0 0 2 24 3 0 0 2914 0 0 0 0 0 1 21 1 0 0 2313 0 0 0 0 0 1 28 3 0 0 3212 0 0 0 0 0 1 30 3 0 0 3411 0 0 0 0 0 0 30 6 0 0 3610 0 0 0 0 0 0 38 24 0 0 629 0 0 0 0 0 0 4 6 0 0 108 0 0 0 0 0 0 3 19 0 0 227 0 0 0 0 0 0 0 7 0 0 76 0 0 0 0 0 0 1 7 0 0 85 0 0 0 0 0 0 0 6 0 0 64 0 0 0 0 0 0 0 5 0 0 53 0 0 0 0 0 0 1 1 2 0 42 0 0 0 0 0 0 1 1 4 0 61 0 0 0 0 0 0 0 1 1 1 30 0 0 0 0 0 0 0 0 0 1 1
Total 3 5 11 8 472 882 592 118 7 2 2,100
FY 2017
FY 2018

44
Table 3-3a: Army Active Duty Enlisted Gains and Losses Table 3-3a: Army Active Duty Enlisted Gains and Losses
E-9 E-8 E-7 E-6 E-5 E-4 E-3 E-2 E-1
Beginning Strength 3,671 12,292 40,876 63,569 83,109 143,090 62,272 25,176 13,020 447,075Motion In 633 2,571 6,975 12,614 29,023 40,897 30,306 19,135 0 142,154Regular Accessions 0 0 12 61 122 5,820 18,238 19,367 25,381 69,000Special Gains 0 0 0 0 0 0 0 0 0 0Other Gains 1 1 15 42 125 383 808 0 0 1,375Total Gains 634 2,572 7,002 12,717 29,270 47,100 49,353 38,502 25,381 212,529Motion Out 0 633 2,571 6,975 12,614 29,023 40,897 30,306 19,135 142,154Regular Separations 10 21 240 1,988 9,220 23,039 1,068 0 0 35,586Retirements (Disability and Non-Disability) 589 1,703 3,090 1,401 353 0 0 0 0 7,136Separation Programs 36 103 2 10 13 0 0 0 164Attrition & Other Losses 20 120 1,171 2,507 8,503 15,283 7,164 7,164 7,168 49,100Total Losses 656 2,580 7,072 12,873 30,700 67,358 49,128 37,470 26,303 234,141End Strength* 3,649 12,284 40,806 63,413 81,679 122,831 62,496 26,208 12,098 425,464
Beginning Strength 3,649 12,284 40,806 63,413 81,679 122,831 62,496 26,208 12,098 425,464Motion In 529 2,117 5,582 9,607 22,452 39,802 31,676 19,582 0 131,347Regular Accessions 0 0 13 65 130 6,234 19,536 20,745 27,187 73,911Special Gains 0 0 0 0 0 0 0 0 0 0Other Gains 1 1 15 43 127 388 819 0 0 1,393Total Gains 530 2,118 5,610 9,715 22,709 46,424 52,031 40,327 27,187 206,651Motion Out 0 529 2,117 5,582 9,607 22,452 39,802 31,676 19,582 131,347Regular Separations 8 18 200 1,660 7,697 19,233 891 0 0 29,708Retirements (Disability and Non-Disability) 570 1,648 2,991 1,356 342 0 0 0 0 6,907Separation Programs 9 81 163 300 0 0 0 0 0 553Attrition & Other Losses 19 112 1,097 2,348 7,964 14,314 6,710 6,710 6,710 45,983Total Losses 607 2,388 6,568 11,246 25,610 56,000 47,403 38,386 26,292 214,498End Strength* 3,572 12,013 39,849 61,882 78,778 113,255 67,124 28,149 12,993 417,616* - Relects OCO end strength in estimates
Grade Total
FY 2013
Enlisted
FY 2014

45
Table 3-3a (continued): Army Active Duty Enlisted Gains and Losses
E-9 E-8 E-7 E-6 E-5 E-4 E-3 E-2 E-1
Beginning Strength 3,572 12,013 39,849 61,882 78,778 113,255 67,124 28,149 12,993 417,616Motion In 559 2,199 5,473 9,290 21,337 43,767 32,017 19,091 0 133,733Regular Accessions 0 0 12 62 125 5,916 18,535 19,680 25,792 70,123Special Gains 0 0 0 0 0 0 0 0 0 0Other Gains 1 1 15 42 126 376 818 0 0 1,379Total Gains 560 2,200 5,501 9,395 21,588 50,059 51,370 38,771 25,792 205,235Motion Out 0 559 2,199 5,473 9,290 21,337 43,767 32,017 19,091 133,733Regular Separations 7 19 186 1,386 7,055 14,208 712 0 0 23,574Retirements (Disability and Non-Disability) 569 1,649 2,653 1,337 373 0 0 0 0 6,582Separation Programs 65 211 717 1,105 0 0 0 0 0 2,098Attrition & Other Losses 19 108 1,061 2,290 7,549 13,002 6,656 6,656 6,656 43,999Total Losses 659 2,547 6,815 11,591 24,268 48,548 51,136 38,673 25,747 209,985End Strength 3,472 11,666 38,534 59,686 76,098 114,767 67,359 28,247 13,037 412,866
Beginning Strength 3,472 11,666 38,534 59,686 76,098 114,767 67,359 28,247 13,037 412,866Motion In 516 1,963 4,631 8,628 19,289 45,937 30,762 17,543 0 129,269Regular Accessions 0 0 12 58 116 5,299 16,563 17,579 23,038 62,664Special Gains 0 0 0 0 0 0 0 0 0 0Other Gains 1 1 14 41 122 383 802 0 0 1,364Total Gains 517 1,964 4,657 8,727 19,527 51,619 48,126 35,122 23,038 193,297Motion Out 0 516 1,963 4,631 8,628 19,289 45,937 30,762 17,543 129,269Regular Separations 8 18 182 1,291 6,787 14,459 749 0 0 23,494Retirements (Disability and Non-Disability) 552 1,580 2,460 1,522 481 0 0 0 0 6,595Separation Programs 34 109 372 573 0 0 0 0 0 1,088Attrition & Other Losses 18 104 1,000 2,157 6,710 12,339 6,468 6,468 6,468 41,734Total Losses 612 2,326 5,978 10,175 22,606 46,087 53,154 37,230 24,011 202,180End Strength 3,377 11,303 37,214 58,238 73,019 120,299 62,331 26,138 12,064 403,983* - Relects OCO end strength in estimates
Grade Total
FY 2015
Enlisted
FY 2016

46
Table 3-3a (continued): Army Active Duty Enlisted Gains and Losses
E-9 E-8 E-7 E-6 E-5 E-4 E-3 E-2 E-1
Beginning Strength 3,377 11,303 37,214 58,238 73,019 120,299 62,331 26,138 12,064 403,983Motion In 601 2,340 6,110 11,449 23,453 43,024 29,610 17,127 0 133,714Regular Accessions 0 0 11 56 113 5,230 16,360 17,367 22,760 61,898Special Gains 0 0 0 0 0 0 0 0 0 0Other Gains 0 1 14 40 116 382 765 0 0 1,318Total Gains 601 2,341 6,135 11,545 23,682 48,636 46,735 34,494 22,760 196,930Motion Out 0 601 2,340 6,110 11,449 23,453 43,024 29,610 17,127 133,714Regular Separations 12 16 174 1,211 6,627 15,307 753 0 0 24,100Retirements (Disability and Non-Disability) 536 1,525 2,349 1,698 510 0 0 0 0 6,618Separation Programs 61 196 666 1,027 0 0 0 0 0 1,950Attrition & Other Losses 17 99 951 2,031 6,288 12,190 6,272 6,272 6,272 40,393Total Losses 626 2,436 6,480 12,078 24,874 50,951 50,049 35,882 23,399 206,776End Strength 3,352 11,208 36,869 57,706 71,828 117,984 59,017 24,749 11,424 394,137
Beginning Strength 3,352 11,208 36,869 57,706 71,828 117,984 59,017 24,749 11,424 394,137Motion In 557 2,138 5,379 10,410 23,541 38,632 30,278 18,608 0 129,543Regular Accessions 0 0 12 61 122 5,887 18,462 19,606 25,694 69,844Special Gains 0 0 0 0 0 0 0 0 0 0Other Gains 0 1 14 39 113 364 767 0 0 1,298Total Gains 557 2,139 5,405 10,510 23,776 44,883 49,507 38,214 25,694 200,685Motion Out 0 557 2,138 5,379 10,410 23,541 38,632 30,278 18,608 129,543Regular Separations 18 18 185 1,277 6,806 14,887 754 0 0 23,945Retirements (Disability and Non-Disability) 523 1,465 2,098 1,847 430 0 0 0 0 6,363Separation Programs 0 0 0 0 0 0 0 0 0 0Attrition & Other Losses 18 98 984 2,008 6,119 11,985 6,358 6,358 6,358 40,286Total Losses 558 2,138 5,405 10,511 23,765 50,413 45,745 36,636 24,966 200,138End Strength 3,351 11,209 36,868 57,705 71,839 112,454 62,779 26,327 12,152 394,684
Grade Total
FY 2017
Enlisted
FY 2018

47
Table 3-3b: Navy Active Duty Enlisted Gains and Losses
E-9 E-8 E-7 E-6 E-5 E-4 E-3 E-2 E-1
Beginning Strength 2,435 5,592 20,185 43,512 59,354 59,832 46,994 16,804 10,113 264,821Motion In 411 1,557 3,614 10,251 18,791 28,878 23,776 22,213 1,822 111,313Regular Accessions 4 0 6 46 52 16 9,243 3,049 21,584 34,000Special Gains 0 0 0 0 3 1 7 2 27 40Other Gains 10 14 90 76 185 204 304 147 317 1,347Total Gains 425 1,571 3,710 10,373 19,031 29,099 33,330 25,411 23,750 146,700Motion Out 2 441 1,640 4,165 11,631 20,928 31,605 23,168 20,191 113,771Regular Separations 0 0 70 971 4,718 4,444 1,379 67 14 11,663Retirements (Disability and Non-Disability) 435 935 2,143 2,503 598 192 122 7 4 6,939Separation Programs 5 56 280 269 201 74 32 8 262 1,187Attrition & Other Losses 4 5 47 307 898 1,640 3,181 1,894 3,073 11,049Total Losses 446 1,437 4,180 8,215 18,046 27,278 36,319 25,144 23,544 144,609End Strength* 2,414 5,726 19,715 45,670 60,339 61,653 44,005 17,071 10,319 266,912
Beginning Strength* 2,517 6,161 20,784 46,019 62,420 57,135 41,618 17,548 12,059 266,261Motion In 520 1761 4544 10073 22664 25863 24729 20816 1358 112,328Regular Accessions 5 9 36 131 150 54 10,159 3,151 22,005 35,700Special Gains 0 0 0 2 3 0 13 5 27 50Other Gains 18 17 40 -54 232 179 167 132 417 1,148Total Gains 543 1,787 4,620 10,152 23,049 26,096 35,068 24,104 23,807 149,226Motion Out 2 527 1786 4932 11010 23988 26822 23476 19785 112,328Regular Separations 0 0 46 1088 5786 6033 2887 110 12 15,962Retirements (Disability and Non-Disability) 433 846 1975 2549 792 295 166 10 7 7,073Separation Programs 5 48 144 174 121 40 146 68 528 1,274Attrition & Other Losses 5 4 80 467 1357 1989 3107 2181 3782 12,972Total Losses 445 1,425 4,031 9,210 19,066 32,345 33,128 25,845 24,114 149,609End Strength 2,615 6,523 21,373 46,961 66,403 50,886 43,558 15,807 11,752 265,878
FY 2013
* Reflects FY2014 BES Estimates (FY13 PB) and therefore is inconsistent with FY14 Begin Strength
Grade Enlisted Total
FY 2014
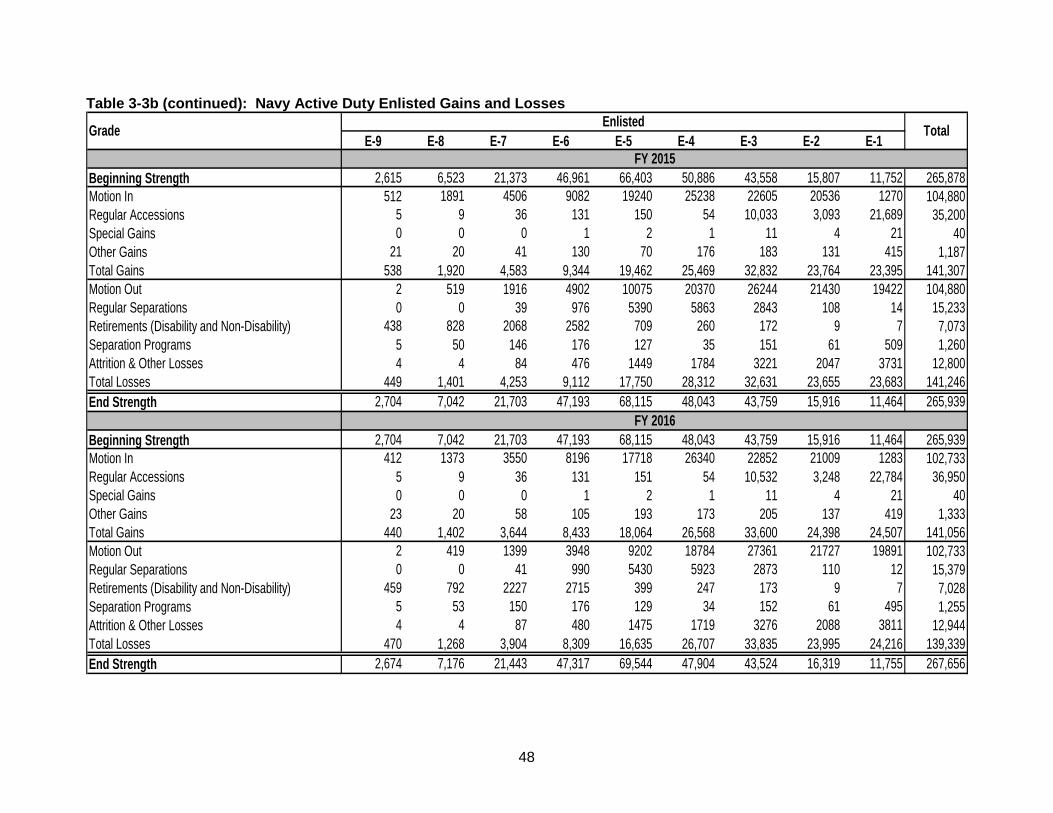
48
Table 3-3b (continued): Navy Active Duty Enlisted Gains and Losses
E-9 E-8 E-7 E-6 E-5 E-4 E-3 E-2 E-1
Beginning Strength 2,615 6,523 21,373 46,961 66,403 50,886 43,558 15,807 11,752 265,878Motion In 512 1891 4506 9082 19240 25238 22605 20536 1270 104,880Regular Accessions 5 9 36 131 150 54 10,033 3,093 21,689 35,200Special Gains 0 0 0 1 2 1 11 4 21 40Other Gains 21 20 41 130 70 176 183 131 415 1,187Total Gains 538 1,920 4,583 9,344 19,462 25,469 32,832 23,764 23,395 141,307Motion Out 2 519 1916 4902 10075 20370 26244 21430 19422 104,880Regular Separations 0 0 39 976 5390 5863 2843 108 14 15,233Retirements (Disability and Non-Disability) 438 828 2068 2582 709 260 172 9 7 7,073Separation Programs 5 50 146 176 127 35 151 61 509 1,260Attrition & Other Losses 4 4 84 476 1449 1784 3221 2047 3731 12,800Total Losses 449 1,401 4,253 9,112 17,750 28,312 32,631 23,655 23,683 141,246End Strength 2,704 7,042 21,703 47,193 68,115 48,043 43,759 15,916 11,464 265,939
Beginning Strength 2,704 7,042 21,703 47,193 68,115 48,043 43,759 15,916 11,464 265,939Motion In 412 1373 3550 8196 17718 26340 22852 21009 1283 102,733Regular Accessions 5 9 36 131 151 54 10,532 3,248 22,784 36,950Special Gains 0 0 0 1 2 1 11 4 21 40Other Gains 23 20 58 105 193 173 205 137 419 1,333Total Gains 440 1,402 3,644 8,433 18,064 26,568 33,600 24,398 24,507 141,056Motion Out 2 419 1399 3948 9202 18784 27361 21727 19891 102,733Regular Separations 0 0 41 990 5430 5923 2873 110 12 15,379Retirements (Disability and Non-Disability) 459 792 2227 2715 399 247 173 9 7 7,028Separation Programs 5 53 150 176 129 34 152 61 495 1,255Attrition & Other Losses 4 4 87 480 1475 1719 3276 2088 3811 12,944Total Losses 470 1,268 3,904 8,309 16,635 26,707 33,835 23,995 24,216 139,339End Strength 2,674 7,176 21,443 47,317 69,544 47,904 43,524 16,319 11,755 267,656
FY 2015
FY 2016
Grade Enlisted Total

49
Table 3-3b (continued): Navy Active Duty Enlisted Gains and Losses
E-9 E-8 E-7 E-6 E-5 E-4 E-3 E-2 E-1
Beginning Strength 2,674 7,176 21,443 47,317 69,544 47,904 43,524 16,319 11,755 267,656Motion In 329 1332 3546 8407 17236 26737 23336 21317 1308 103,548Regular Accessions 5 9 37 134 156 56 10,658 3,287 23,058 37,400Special Gains 0 0 0 3 6 2 29 0 0 40Other Gains 23 21 61 121 188 175 198 141 427 1,355Total Gains 357 1,362 3,644 8,665 17,586 26,970 34,221 24,745 24,793 142,343Motion Out 2 336 1357 3945 9437 18297 27727 22228 20219 103,548Regular Separations 0 0 44 1031 5734 6254 3013 117 12 16,205Retirements (Disability and Non-Disability) 406 802 2069 2654 716 249 157 8 6 7,067Separation Programs 5 53 146 174 130 33 147 62 500 1,250Attrition & Other Losses 4 4 82 450 1411 1625 3178 2109 3862 12,725Total Losses 417 1,195 3,698 8,254 17,428 26,458 34,222 24,524 24,599 140,795End Strength 2,614 7,343 21,389 47,728 69,702 48,416 43,523 16,540 11,949 269,204
Beginning Strength 2,614 7,343 21,389 47,728 69,702 48,416 43,523 16,540 11,949 269,204Motion In 397 1252 3381 9216 21229 26254 23486 21138 1315 107,668Regular Accessions 5 9 36 131 151 54 10,432 3,217 22,565 36,600Special Gains 0 0 0 1 2 1 11 4 21 40Other Gains 21 21 60 111 225 173 200 143 434 1,388Total Gains 423 1,282 3,477 9,459 21,607 26,482 34,129 24,502 24,335 145,696Motion Out 2 405 1277 3782 10262 22278 27212 22403 20047 107,668Regular Separations 0 0 45 1063 5872 6353 3049 118 13 16,513Retirements (Disability and Non-Disability) 400 826 2073 2685 711 247 153 8 6 7,109Separation Programs 4 54 146 176 131 33 150 63 510 1,267Attrition & Other Losses 4 4 81 442 1387 1612 3136 2110 3852 12,628Total Losses 410 1,289 3,622 8,148 18,363 30,523 33,700 24,702 24,428 145,185End Strength 2,627 7,336 21,244 49,039 72,946 44,375 43,952 16,340 11,856 269,715
FY 2018
FY 2017
Grade Enlisted Total
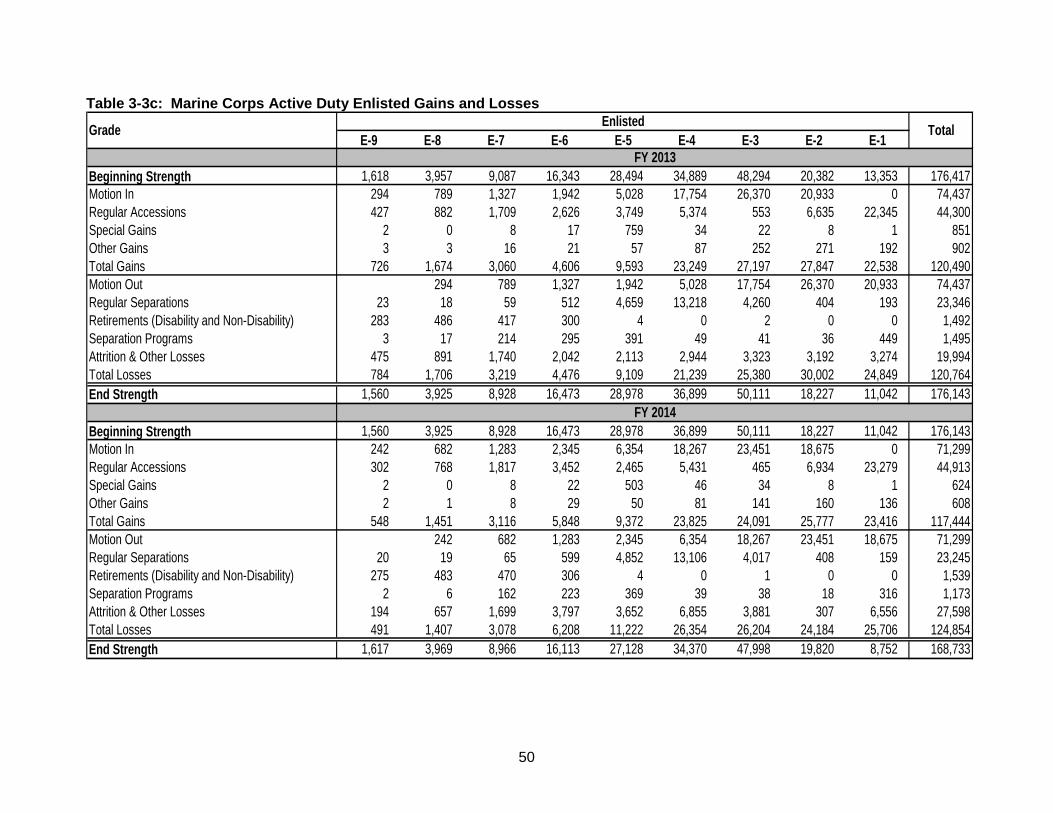
50
Table 3-3c: Marine Corps Active Duty Enlisted Gains and Losses
E-9 E-8 E-7 E-6 E-5 E-4 E-3 E-2 E-1
Beginning Strength 1,618 3,957 9,087 16,343 28,494 34,889 48,294 20,382 13,353 176,417Motion In 294 789 1,327 1,942 5,028 17,754 26,370 20,933 0 74,437Regular Accessions 427 882 1,709 2,626 3,749 5,374 553 6,635 22,345 44,300Special Gains 2 0 8 17 759 34 22 8 1 851Other Gains 3 3 16 21 57 87 252 271 192 902Total Gains 726 1,674 3,060 4,606 9,593 23,249 27,197 27,847 22,538 120,490Motion Out 294 789 1,327 1,942 5,028 17,754 26,370 20,933 74,437Regular Separations 23 18 59 512 4,659 13,218 4,260 404 193 23,346Retirements (Disability and Non-Disability) 283 486 417 300 4 0 2 0 0 1,492Separation Programs 3 17 214 295 391 49 41 36 449 1,495Attrition & Other Losses 475 891 1,740 2,042 2,113 2,944 3,323 3,192 3,274 19,994Total Losses 784 1,706 3,219 4,476 9,109 21,239 25,380 30,002 24,849 120,764End Strength 1,560 3,925 8,928 16,473 28,978 36,899 50,111 18,227 11,042 176,143
Beginning Strength 1,560 3,925 8,928 16,473 28,978 36,899 50,111 18,227 11,042 176,143Motion In 242 682 1,283 2,345 6,354 18,267 23,451 18,675 0 71,299Regular Accessions 302 768 1,817 3,452 2,465 5,431 465 6,934 23,279 44,913Special Gains 2 0 8 22 503 46 34 8 1 624Other Gains 2 1 8 29 50 81 141 160 136 608Total Gains 548 1,451 3,116 5,848 9,372 23,825 24,091 25,777 23,416 117,444Motion Out 242 682 1,283 2,345 6,354 18,267 23,451 18,675 71,299Regular Separations 20 19 65 599 4,852 13,106 4,017 408 159 23,245Retirements (Disability and Non-Disability) 275 483 470 306 4 0 1 0 0 1,539Separation Programs 2 6 162 223 369 39 38 18 316 1,173Attrition & Other Losses 194 657 1,699 3,797 3,652 6,855 3,881 307 6,556 27,598Total Losses 491 1,407 3,078 6,208 11,222 26,354 26,204 24,184 25,706 124,854End Strength 1,617 3,969 8,966 16,113 27,128 34,370 47,998 19,820 8,752 168,733
Grade Enlisted Total
FY 2013
FY 2014

51
Table 3-3.c (continued): Marine Corps Active Duty Enlisted Gains and Losses
E-9 E-8 E-7 E-6 E-5 E-4 E-3 E-2 E-1
Beginning Strength 1,617 3,969 8,966 16,113 27,128 34,370 47,998 19,820 8,752 168,733Motion In 254 713 1,365 2,621 7,819 21,334 24,632 19,199 0 77,937Regular Accessions 290 740 1,755 3,330 2,378 5,243 450 6,580 22,037 42,803Special Gains 2 0 4 21 503 44 34 8 1 617Other Gains 2 1 8 29 50 81 141 160 136 608Total Gains 548 1,454 3,132 6,001 10,750 26,702 25,257 25,947 22,174 121,965Motion Out 254 713 1,365 2,621 7,819 21,334 24,632 19,199 77,937Regular Separations 15 14 53 583 4,704 12,707 3,898 395 147 22,516Retirements (Disability and Non-Disability) 275 483 470 306 4 0 1 0 0 1,539Separation Programs 2 6 162 223 367 37 38 23 316 1,174Attrition & Other Losses 252 687 1,710 3,481 2,982 6,048 2,269 1,918 3,214 22,561Total Losses 544 1,444 3,108 5,958 10,678 26,611 27,540 26,968 22,876 125,727End Strength 1,621 3,979 8,990 16,156 27,200 34,461 45,715 18,799 8,050 164,971
Beginning Strength 1,621 3,979 8,990 16,156 27,200 34,461 45,715 18,799 8,050 164,971Motion In 260 739 1,438 2,791 8,242 22,195 24,775 19,427 0 79,867Regular Accessions 294 749 1,770 3,361 2,400 5,288 453 6,598 22,101 43,014Special Gains 2 0 4 21 503 44 34 8 1 617Other Gains 2 1 8 29 50 81 141 160 136 608Total Gains 558 1,489 3,220 6,202 11,195 27,608 25,403 26,193 22,238 124,106Motion Out 260 739 1,438 2,791 8,242 22,195 24,775 19,427 79,867Regular Separations 15 14 53 587 4,789 12,934 3,967 396 147 22,902Retirements (Disability and Non-Disability) 275 483 470 306 4 0 1 0 0 1,539Separation Programs 2 6 162 223 367 37 38 22 316 1,173Attrition & Other Losses 251 689 1,713 3,499 2,992 6,076 2,230 1,875 3,138 22,463Total Losses 543 1,452 3,137 6,053 10,943 27,289 28,431 27,068 23,028 127,944End Strength 1,636 4,016 9,073 16,305 27,452 34,780 42,687 17,924 7,260 161,133
FY 2015
FY 2016
Grade Enlisted Total

52
Table 3-3c (continued): Marine Corps Active Duty Enlisted Gains and Losses
E-9 E-8 E-7 E-6 E-5 E-4 E-3 E-2 E-1
Beginning Strength 1,636 4,016 9,073 16,305 27,452 34,780 42,687 17,924 7,260 161,133Motion In 243 678 1,292 2,494 7,684 21,307 26,897 21,521 0 82,116Regular Accessions 294 749 1,770 3,361 2,400 5,288 453 7,482 25,259 47,056Special Gains 2 0 4 21 503 44 34 8 1 617Other Gains 2 1 8 29 50 81 141 160 136 608Total Gains 541 1,428 3,074 5,905 10,637 26,720 27,525 29,171 25,396 130,397Motion Out 243 678 1,292 2,494 7,684 21,307 26,897 21,521 82,116Regular Separations 15 14 53 587 4,789 12,934 3,967 396 147 22,902Retirements (Disability and Non-Disability) 275 483 470 306 4 0 1 0 0 1,539Separation Programs 2 6 162 223 367 37 38 25 316 1,176Attrition & Other Losses 249 682 1,711 3,497 2,983 6,065 2,212 1,853 3,108 22,360Total Losses 541 1,428 3,074 5,905 10,637 26,720 27,525 29,171 25,092 130,093End Strength 1,636 4,016 9,073 16,305 27,452 34,780 42,687 17,924 7,564 161,437
Beginning Strength 1,636 4,016 9,073 16,305 27,452 34,780 42,687 17,924 7,564 161,437Motion In 243 678 1,292 2,494 7,692 21,328 26,923 21,605 0 82,255Regular Accessions 294 744 1,768 3,355 2,394 5,278 453 7,449 25,145 46,880Special Gains 2 0 4 21 503 44 34 8 1 617Other Gains 2 1 8 29 50 81 141 160 136 608Total Gains 541 1,423 3,072 5,899 10,639 26,731 27,551 29,222 25,282 130,360Motion Out 243 678 1,292 2,494 7,692 21,328 26,923 21,605 82,255Regular Separations 15 14 53 587 4,795 12,947 3,971 396 147 22,925Retirements (Disability and Non-Disability) 275 483 470 306 4 0 1 0 0 1,539Separation Programs 2 6 162 223 367 37 38 28 316 1,179Attrition & Other Losses 249 677 1,709 3,491 2,979 6,055 2,213 1,857 3,114 22,344Total Losses 541 1,423 3,072 5,899 10,639 26,731 27,551 29,204 25,182 130,242End Strength 1,636 4,016 9,073 16,305 27,452 34,780 42,687 17,942 7,664 161,555
Grade Enlisted Total
FY 2017
FY 2018

53
Table 3-3d: Air Force Active Duty Enlisted Gains and Losses
E-9 E-8 E-7 E-6 E-5 E-4 E-3 E-2 E-1
Beginning Strength 2,632 5,047 26,437 41,767 67,718 55,503 50,827 4,269 9,717 263,917Motion In 520 1,372 5,940 7,920 13,605 14,521 8,164 12,836 0 64,878Regular Accessions 0 0 0 0 0 1,026 5,098 3,624 16,378 26,126Special Gains 0 0 0 0 430 0 0 0 0 430Other Gains 0 0 0 0 0 0 0 0 0 0Total Gains 520 1,372 5,940 7,920 14,035 15,547 13,262 16,460 16,378 91,434Motion Out 0 520 1,372 5,940 7,920 13,605 14,521 8,164 12,836 64,878Regular Separations 2 6 45 174 2,109 4,442 1,957 1,658 1,940 12,333Retirements (Disability and Non-Disability) 541 785 4,865 1,670 60 9 0 1 1 7,932Separation Programs 0 0 1 6 54 64 24 10 38 197Attrition & Other Losses 2 5 39 356 1,375 3,586 1,440 926 1,821 9,550Total Losses 545 1,316 6,322 8,146 11,518 21,706 17,942 10,759 16,636 94,890End Strength 2,607 5,103 26,055 41,541 70,235 49,344 46,147 9,970 9,459 260,461
Beginning Strength 2,607 5,103 26,055 41,541 70,235 49,344 46,147 9,970 9,459 260,461Motion In 503 1,358 5,762 8,511 14,875 22,901 20,845 18,386 0 93,141Regular Accessions 0 0 0 0 0 1,210 5,021 3,769 16,835 26,835Special Gains 0 0 0 0 430 60 30 0 0 520Other Gains 0 0 0 0 0 0 0 0 0 0Total Gains 503 1,358 5,762 8,511 15,305 24,171 25,896 22,155 16,835 120,496Motion Out 0 503 1,358 5,762 8,511 14,875 22,901 20,845 18,386 93,141Regular Separations 2 5 42 294 3,533 3,787 1,558 628 780 10,629Retirements (Disability and Non-Disability) 513 773 4,499 2,208 205 9 0 1 1 8,209Separation Programs 0 0 1 6 55 63 24 10 38 197Attrition & Other Losses 2 5 39 359 3,301 3,008 1,455 487 1,202 9,858Total Losses 517 1,286 5,939 8,629 15,605 21,742 25,938 21,971 20,407 122,034End Strength 2,593 5,175 25,878 41,423 69,935 51,773 46,105 10,154 5,887 258,923
Grade
FY 2013
Enlisted Total
FY 2014

54
Table 3-3d (continued): Air Force Active Duty Enlisted Gains and Losses
E-9 E-8 E-7 E-6 E-5 E-4 E-3 E-2 E-1
Beginning Strength 2,593 5,175 25,878 41,423 69,935 51,773 46,105 10,154 5,887 258,923Motion In 510 1,277 5,939 8,097 14,904 17,650 18,028 13,898 0 80,303Regular Accessions 0 0 0 0 0 1,131 3,186 3,624 18,894 26,835Special Gains 0 0 0 0 430 0 0 0 0 430Other Gains 0 0 0 0 0 0 0 0 0 0Total Gains 510 1,277 5,939 8,097 15,334 18,781 21,214 17,522 18,894 107,568Motion Out 0 520 1,277 5,939 8,097 14,904 17,650 18,028 13,898 80,313Regular Separations 2 6 45 374 4,628 4,232 1,550 282 60 11,179Retirements (Disability and Non-Disability) 503 833 4,453 1,452 60 9 0 1 1 7,312Separation Programs 0 0 1 6 54 64 24 10 38 197Attrition & Other Losses 2 5 39 252 2,504 2,356 1,325 1,126 1,150 8,759Total Losses 507 1,364 5,815 8,023 15,343 21,565 20,549 19,447 15,147 107,760End Strength 2,596 5,088 26,002 41,497 69,926 48,989 46,770 8,229 9,634 258,731
Beginning Strength 2,596 5,088 26,002 41,497 69,926 48,989 46,770 8,229 9,634 258,731Motion In 506 1,403 5,762 7,981 14,393 21,996 20,783 18,289 0 91,113Regular Accessions 0 0 0 0 0 0 4,447 3,624 21,378 29,449Special Gains 0 0 0 0 430 0 0 0 0 430Other Gains 0 0 0 0 0 0 0 0 0 0Total Gains 506 1,403 5,762 7,981 14,823 21,996 25,230 21,913 21,378 120,992Motion Out 0 506 1,403 5,762 7,981 14,393 21,996 20,783 18,289 91,113Regular Separations 2 5 17 294 3,533 4,546 1,558 527 773 11,255Retirements (Disability and Non-Disability) 506 829 4,422 1,625 246 9 0 1 1 7,639Separation Programs 0 0 1 6 55 63 24 10 38 197Attrition & Other Losses 2 5 39 359 3,301 3,531 1,455 587 2,270 11,549Total Losses 510 1,345 5,882 8,046 15,116 22,542 25,033 21,908 21,371 121,753End Strength 2,592 5,146 25,882 41,432 69,633 48,443 46,967 8,234 9,641 257,970
FY 2016
Grade
FY 2015
Enlisted Total
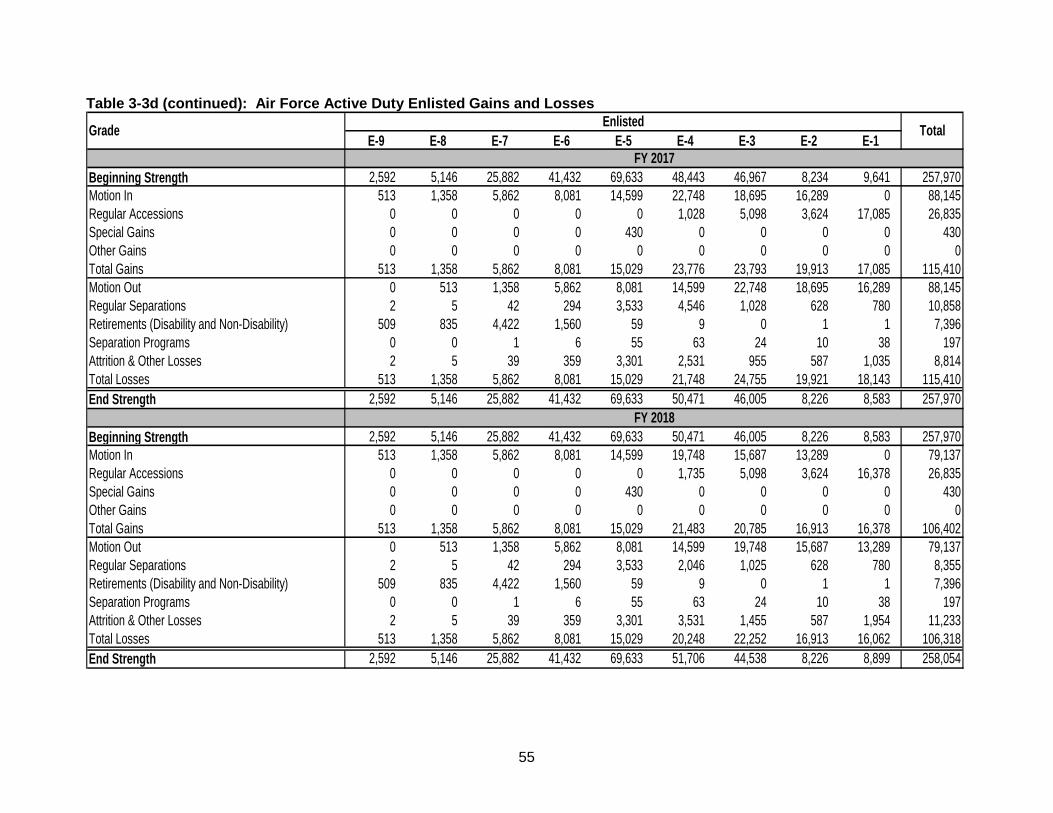
55
Table 3-3d (continued): Air Force Active Duty Enlisted Gains and Losses
E-9 E-8 E-7 E-6 E-5 E-4 E-3 E-2 E-1
Beginning Strength 2,592 5,146 25,882 41,432 69,633 48,443 46,967 8,234 9,641 257,970Motion In 513 1,358 5,862 8,081 14,599 22,748 18,695 16,289 0 88,145Regular Accessions 0 0 0 0 0 1,028 5,098 3,624 17,085 26,835Special Gains 0 0 0 0 430 0 0 0 0 430Other Gains 0 0 0 0 0 0 0 0 0 0Total Gains 513 1,358 5,862 8,081 15,029 23,776 23,793 19,913 17,085 115,410Motion Out 0 513 1,358 5,862 8,081 14,599 22,748 18,695 16,289 88,145Regular Separations 2 5 42 294 3,533 4,546 1,028 628 780 10,858Retirements (Disability and Non-Disability) 509 835 4,422 1,560 59 9 0 1 1 7,396Separation Programs 0 0 1 6 55 63 24 10 38 197Attrition & Other Losses 2 5 39 359 3,301 2,531 955 587 1,035 8,814Total Losses 513 1,358 5,862 8,081 15,029 21,748 24,755 19,921 18,143 115,410End Strength 2,592 5,146 25,882 41,432 69,633 50,471 46,005 8,226 8,583 257,970
Beginning Strength 2,592 5,146 25,882 41,432 69,633 50,471 46,005 8,226 8,583 257,970Motion In 513 1,358 5,862 8,081 14,599 19,748 15,687 13,289 0 79,137Regular Accessions 0 0 0 0 0 1,735 5,098 3,624 16,378 26,835Special Gains 0 0 0 0 430 0 0 0 0 430Other Gains 0 0 0 0 0 0 0 0 0 0Total Gains 513 1,358 5,862 8,081 15,029 21,483 20,785 16,913 16,378 106,402Motion Out 0 513 1,358 5,862 8,081 14,599 19,748 15,687 13,289 79,137Regular Separations 2 5 42 294 3,533 2,046 1,025 628 780 8,355Retirements (Disability and Non-Disability) 509 835 4,422 1,560 59 9 0 1 1 7,396Separation Programs 0 0 1 6 55 63 24 10 38 197Attrition & Other Losses 2 5 39 359 3,301 3,531 1,455 587 1,954 11,233Total Losses 513 1,358 5,862 8,081 15,029 20,248 22,252 16,913 16,062 106,318End Strength 2,592 5,146 25,882 41,432 69,633 51,706 44,538 8,226 8,899 258,054
Grade
FY 2017
Enlisted Total
FY 2018

56
Table 3-4a: Active Duty Army Enlisted Member Retirements by YOS YOS E-9 E-8 E-7 E-6 E-5 E-4 E-3 E-2 E-1 Total
30+ 243 10 1 0 0 0 0 0 0 25429 41 88 1 0 0 0 0 0 0 13028 42 53 1 0 0 0 0 0 0 9527 45 91 6 0 0 0 0 0 0 14226 56 164 215 0 0 0 0 0 0 43425 45 151 188 1 0 0 0 0 0 38524 43 184 384 10 0 0 0 0 0 62123 28 159 279 173 0 0 0 0 0 63922 22 193 356 210 0 0 0 0 0 78121 14 219 487 260 12 0 0 0 0 99220 12 391 1,171 746 341 0 0 0 0 2,66219 0 0 0 0 0 0 0 0 0 018 0 0 0 0 0 0 0 0 0 017 0 0 0 0 0 0 0 0 0 016 0 0 0 0 0 0 0 0 0 015 0 0 0 0 0 0 0 0 0 014 0 0 0 0 0 0 0 0 0 013 0 0 0 0 0 0 0 0 0 012 0 0 0 0 0 0 0 0 0 011 0 0 0 0 0 0 0 0 0 010 0 0 0 0 0 0 0 0 0 09 0 0 0 0 0 0 0 0 0 08 0 0 0 0 0 0 0 0 0 07 0 0 0 0 0 0 0 0 0 06 0 0 0 0 0 0 0 0 0 05 0 0 0 0 0 0 0 0 0 04 0 0 0 0 0 0 0 0 0 03 0 0 0 0 0 0 0 0 0 02 0 0 0 0 0 0 0 0 0 01 0 0 0 0 0 0 0 0 0 00 0 0 0 0 0 0 0 0 0 0
Total 589 1,703 3,090 1,401 353 0 0 0 0 7,136
YOS E-9 E-8 E-7 E-6 E-5 E-4 E-3 E-2 E-1 Total30+ 235 10 1 0 0 0 0 0 0 24629 39 86 1 0 0 0 0 0 0 12628 40 51 1 0 0 0 0 0 0 9227 43 88 6 0 0 0 0 0 0 13826 54 158 208 0 0 0 0 0 0 42125 43 146 182 1 0 0 0 0 0 37224 41 178 372 10 0 0 0 0 0 60123 27 154 270 168 0 0 0 0 0 61822 21 187 344 204 0 0 0 0 0 75621 13 212 471 252 12 0 0 0 0 96120 12 379 1,134 722 330 0 0 0 0 2,57619 0 0 0 0 0 0 0 0 0 018 0 0 0 0 0 0 0 0 0 017 0 0 0 0 0 0 0 0 0 016 0 0 0 0 0 0 0 0 0 015 0 0 0 0 0 0 0 0 0 014 0 0 0 0 0 0 0 0 0 013 0 0 0 0 0 0 0 0 0 012 0 0 0 0 0 0 0 0 0 011 0 0 0 0 0 0 0 0 0 010 0 0 0 0 0 0 0 0 0 09 0 0 0 0 0 0 0 0 0 08 0 0 0 0 0 0 0 0 0 07 0 0 0 0 0 0 0 0 0 06 0 0 0 0 0 0 0 0 0 05 0 0 0 0 0 0 0 0 0 04 0 0 0 0 0 0 0 0 0 03 0 0 0 0 0 0 0 0 0 02 0 0 0 0 0 0 0 0 0 01 0 0 0 0 0 0 0 0 0 00 0 0 0 0 0 0 0 0 0 0
Total 570 1,648 2,991 1,356 342 0 0 0 0 6,907
FY 2013
FY 2014

57
Table 3-4a (continued): Active Duty Army Enlisted Member Retirements by YOS YOS E-9 E-8 E-7 E-6 E-5 E-4 E-3 E-2 E-1 Total
30+ 236 14 1 0 0 0 0 0 0 25129 38 118 1 0 0 0 0 0 0 15728 38 56 2 0 0 0 0 0 0 9627 48 75 7 0 0 0 0 0 0 13026 53 178 219 1 0 0 0 0 0 45125 41 139 165 1 0 0 0 0 0 34724 42 151 312 13 0 0 0 0 0 51823 25 134 225 155 0 0 0 0 0 53922 21 197 320 235 0 0 0 0 0 77321 14 205 375 253 19 0 0 0 0 86620 12 383 1,027 679 354 0 0 0 0 2,45419 0 0 0 0 0 0 0 0 0 018 0 0 0 0 0 0 0 0 0 017 0 0 0 0 0 0 0 0 0 016 0 0 0 0 0 0 0 0 0 015 0 0 0 0 0 0 0 0 0 014 0 0 0 0 0 0 0 0 0 013 0 0 0 0 0 0 0 0 0 012 0 0 0 0 0 0 0 0 0 011 0 0 0 0 0 0 0 0 0 010 0 0 0 0 0 0 0 0 0 09 0 0 0 0 0 0 0 0 0 08 0 0 0 0 0 0 0 0 0 07 0 0 0 0 0 0 0 0 0 06 0 0 0 0 0 0 0 0 0 05 0 0 0 0 0 0 0 0 0 04 0 0 0 0 0 0 0 0 0 03 0 0 0 0 0 0 0 0 0 02 0 0 0 0 0 0 0 0 0 01 0 0 0 0 0 0 0 0 0 00 0 0 0 0 0 0 0 0 0 0
Total 569 1,649 2,653 1,337 373 0 0 0 0 6,581
YOS E-9 E-8 E-7 E-6 E-5 E-4 E-3 E-2 E-1 Total30+ 236 20 1 0 0 0 0 0 0 25729 34 118 2 0 0 0 0 0 0 15328 37 48 2 0 0 0 0 0 0 8727 45 76 6 0 0 0 0 0 0 12726 47 159 185 1 0 0 0 0 0 39325 42 118 133 3 0 0 0 0 0 29524 40 127 274 12 0 0 0 0 0 45323 25 137 198 175 0 0 0 0 0 53522 20 185 229 224 1 0 0 0 0 65921 14 193 288 225 20 0 0 0 0 73920 12 399 1,144 882 460 0 0 0 0 2,89719 0 0 0 0 0 0 0 0 0 018 0 0 0 0 0 0 0 0 0 017 0 0 0 0 0 0 0 0 0 016 0 0 0 0 0 0 0 0 0 015 0 0 0 0 0 0 0 0 0 014 0 0 0 0 0 0 0 0 0 013 0 0 0 0 0 0 0 0 0 012 0 0 0 0 0 0 0 0 0 011 0 0 0 0 0 0 0 0 0 010 0 0 0 0 0 0 0 0 0 09 0 0 0 0 0 0 0 0 0 08 0 0 0 0 0 0 0 0 0 07 0 0 0 0 0 0 0 0 0 06 0 0 0 0 0 0 0 0 0 05 0 0 0 0 0 0 0 0 0 04 0 0 0 0 0 0 0 0 0 03 0 0 0 0 0 0 0 0 0 02 0 0 0 0 0 0 0 0 0 01 0 0 0 0 0 0 0 0 0 00 0 0 0 0 0 0 0 0 0 0
Total 552 1,580 2,460 1,522 481 0 0 0 0 6,595
FY 2015
FY 2016
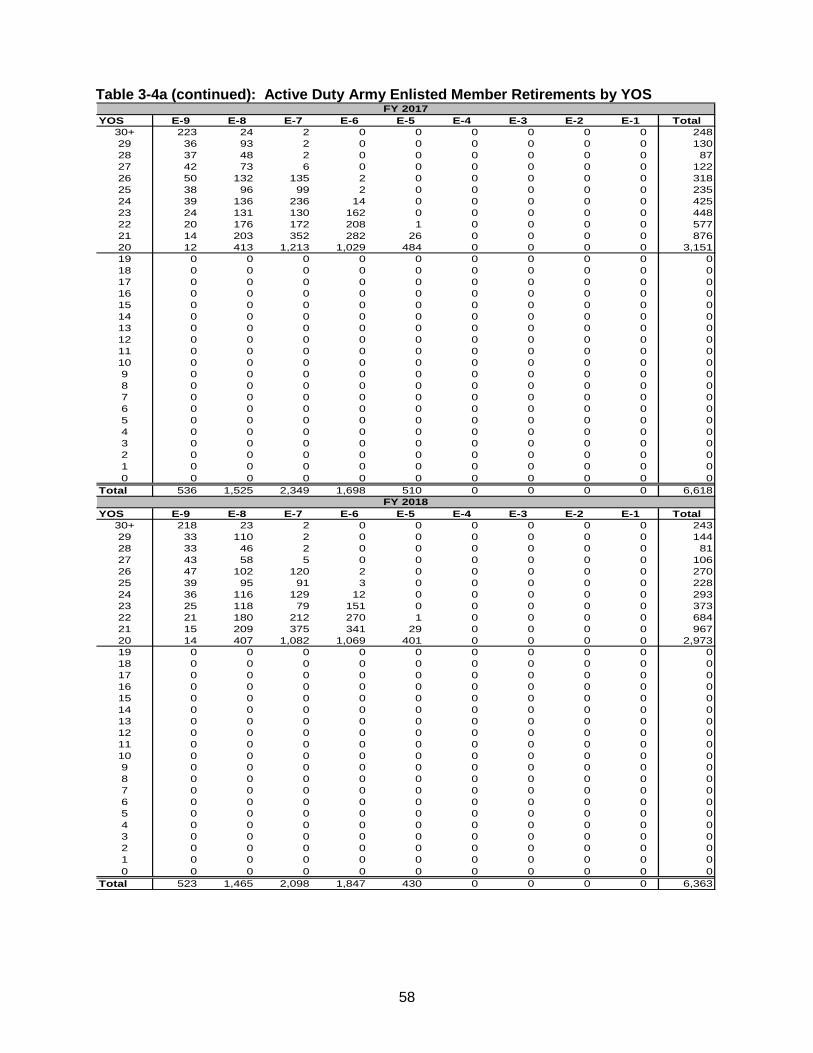
58
Table 3-4a (continued): Active Duty Army Enlisted Member Retirements by YOS YOS E-9 E-8 E-7 E-6 E-5 E-4 E-3 E-2 E-1 Total
30+ 223 24 2 0 0 0 0 0 0 24829 36 93 2 0 0 0 0 0 0 13028 37 48 2 0 0 0 0 0 0 8727 42 73 6 0 0 0 0 0 0 12226 50 132 135 2 0 0 0 0 0 31825 38 96 99 2 0 0 0 0 0 23524 39 136 236 14 0 0 0 0 0 42523 24 131 130 162 0 0 0 0 0 44822 20 176 172 208 1 0 0 0 0 57721 14 203 352 282 26 0 0 0 0 87620 12 413 1,213 1,029 484 0 0 0 0 3,15119 0 0 0 0 0 0 0 0 0 018 0 0 0 0 0 0 0 0 0 017 0 0 0 0 0 0 0 0 0 016 0 0 0 0 0 0 0 0 0 015 0 0 0 0 0 0 0 0 0 014 0 0 0 0 0 0 0 0 0 013 0 0 0 0 0 0 0 0 0 012 0 0 0 0 0 0 0 0 0 011 0 0 0 0 0 0 0 0 0 010 0 0 0 0 0 0 0 0 0 09 0 0 0 0 0 0 0 0 0 08 0 0 0 0 0 0 0 0 0 07 0 0 0 0 0 0 0 0 0 06 0 0 0 0 0 0 0 0 0 05 0 0 0 0 0 0 0 0 0 04 0 0 0 0 0 0 0 0 0 03 0 0 0 0 0 0 0 0 0 02 0 0 0 0 0 0 0 0 0 01 0 0 0 0 0 0 0 0 0 00 0 0 0 0 0 0 0 0 0 0
Total 536 1,525 2,349 1,698 510 0 0 0 0 6,618
YOS E-9 E-8 E-7 E-6 E-5 E-4 E-3 E-2 E-1 Total30+ 218 23 2 0 0 0 0 0 0 24329 33 110 2 0 0 0 0 0 0 14428 33 46 2 0 0 0 0 0 0 8127 43 58 5 0 0 0 0 0 0 10626 47 102 120 2 0 0 0 0 0 27025 39 95 91 3 0 0 0 0 0 22824 36 116 129 12 0 0 0 0 0 29323 25 118 79 151 0 0 0 0 0 37322 21 180 212 270 1 0 0 0 0 68421 15 209 375 341 29 0 0 0 0 96720 14 407 1,082 1,069 401 0 0 0 0 2,97319 0 0 0 0 0 0 0 0 0 018 0 0 0 0 0 0 0 0 0 017 0 0 0 0 0 0 0 0 0 016 0 0 0 0 0 0 0 0 0 015 0 0 0 0 0 0 0 0 0 014 0 0 0 0 0 0 0 0 0 013 0 0 0 0 0 0 0 0 0 012 0 0 0 0 0 0 0 0 0 011 0 0 0 0 0 0 0 0 0 010 0 0 0 0 0 0 0 0 0 09 0 0 0 0 0 0 0 0 0 08 0 0 0 0 0 0 0 0 0 07 0 0 0 0 0 0 0 0 0 06 0 0 0 0 0 0 0 0 0 05 0 0 0 0 0 0 0 0 0 04 0 0 0 0 0 0 0 0 0 03 0 0 0 0 0 0 0 0 0 02 0 0 0 0 0 0 0 0 0 01 0 0 0 0 0 0 0 0 0 00 0 0 0 0 0 0 0 0 0 0
Total 523 1,465 2,098 1,847 430 0 0 0 0 6,363
FY 2017
FY 2018

59
Table 3-4b: Active Duty Navy Enlisted Member Retirements by YOS
YOS E-9 E-8 E-7 E-6 E-5 E-4 E-3 E-2 E-1 Total30+ 238 1 0 0 0 0 0 0 0 23929 36 3 0 0 0 0 0 0 0 3928 32 7 1 0 0 0 0 0 0 4027 21 50 2 0 0 0 0 0 0 7326 27 375 21 2 0 0 0 0 0 42525 23 91 73 0 0 0 0 0 0 18724 25 93 721 0 0 0 0 0 0 83923 7 82 226 5 0 0 0 0 0 32022 7 79 291 15 1 0 0 0 0 39321 15 93 396 205 40 0 0 0 0 74920 4 61 382 1,942 337 7 0 0 0 2,73319 0 0 1 3 2 0 0 0 0 618 0 0 1 4 3 0 0 0 0 817 0 0 4 8 0 0 0 0 0 1216 0 0 12 205 13 1 0 0 0 23115 0 0 6 40 17 1 0 0 0 6414 0 0 4 13 10 1 0 0 0 2813 0 0 1 14 15 1 0 0 0 3112 0 0 0 16 12 0 0 0 0 2811 0 0 0 5 26 1 0 0 0 3210 0 0 0 11 20 1 0 0 0 329 0 0 1 9 15 10 1 0 0 368 0 0 0 2 20 10 1 0 0 337 0 0 0 3 20 23 0 0 0 466 0 0 0 1 25 34 5 0 0 655 0 0 0 0 15 41 21 0 0 774 0 0 0 0 7 44 40 5 0 963 0 0 0 0 0 16 42 0 0 582 0 0 0 0 0 1 11 2 1 151 0 0 0 0 0 0 1 0 3 40 0 0 0 0 0 0 0 0 0 0
Total 435 935 2,143 2,503 598 192 122 7 4 6,939
YOS E-9 E-8 E-7 E-6 E-5 E-4 E-3 E-2 E-1 Total30+ 236 1 0 0 0 0 0 0 0 23729 36 3 0 0 0 0 0 0 0 3928 32 6 1 0 0 0 0 0 0 3927 21 45 2 0 0 0 0 0 0 6826 27 337 19 2 0 0 0 0 0 38525 23 83 68 0 0 0 0 0 0 17424 25 85 660 0 0 0 0 0 0 77023 7 74 208 4 0 0 0 0 0 29322 7 72 267 14 1 0 0 0 0 36121 15 85 362 205 46 0 0 0 0 71320 4 55 349 1,921 378 5 0 0 0 2,71219 0 0 1 6 3 0 0 0 0 1018 0 0 2 7 6 0 0 0 0 1517 0 0 6 13 0 0 0 0 0 1916 0 0 13 208 14 1 0 0 0 23615 0 0 7 46 28 2 0 0 0 8314 0 0 7 22 17 1 0 0 0 4713 0 0 2 23 25 2 0 0 0 5212 0 0 0 26 20 0 0 0 0 4611 0 0 0 9 45 2 0 0 0 5610 0 0 0 18 34 2 0 0 0 549 0 0 1 16 26 16 2 0 0 618 0 0 0 3 34 15 1 0 0 537 0 0 0 4 34 36 0 0 0 746 0 0 0 2 43 57 7 0 0 1095 0 0 0 0 26 61 27 0 0 1144 0 0 0 0 12 68 56 7 0 1433 0 0 0 0 0 25 57 0 0 822 0 0 0 0 0 2 15 3 1 211 0 0 0 0 0 0 1 0 6 70 0 0 0 0 0 0 0 0 0 0
Total 433 846 1,975 2,549 792 295 166 10 7 7,073
FY 2013
FY 2014
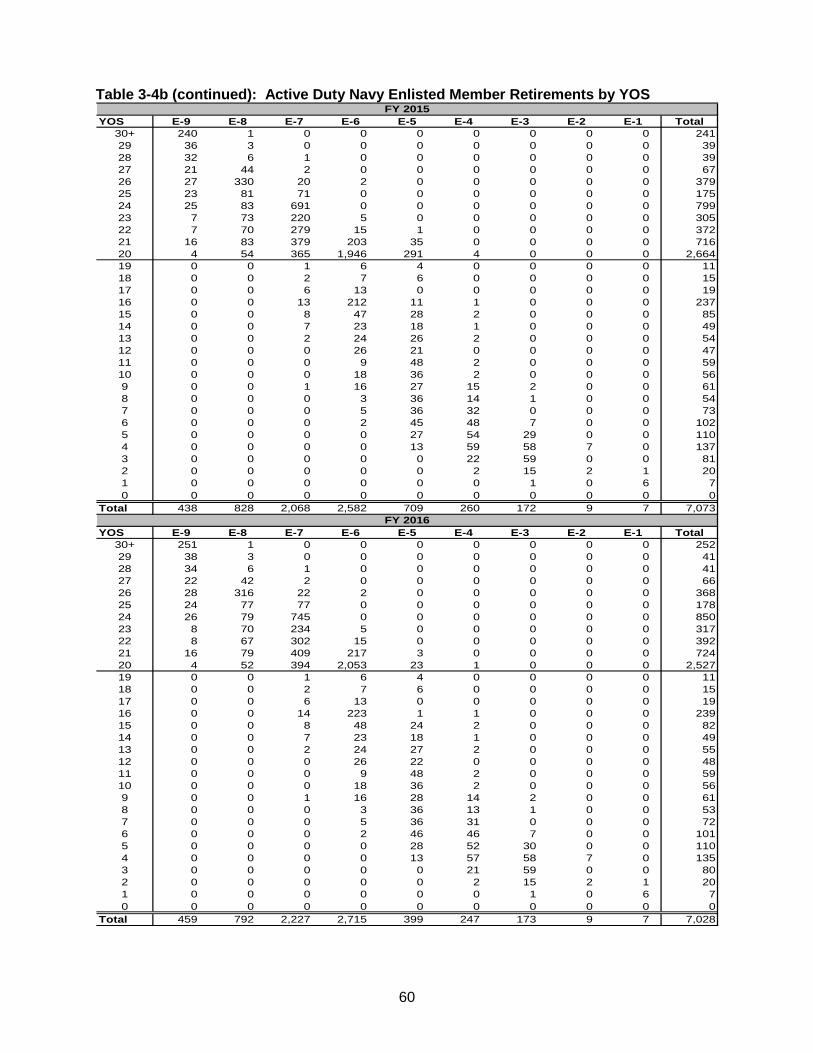
60
Table 3-4b (continued): Active Duty Navy Enlisted Member Retirements by YOS YOS E-9 E-8 E-7 E-6 E-5 E-4 E-3 E-2 E-1 Total
30+ 240 1 0 0 0 0 0 0 0 24129 36 3 0 0 0 0 0 0 0 3928 32 6 1 0 0 0 0 0 0 3927 21 44 2 0 0 0 0 0 0 6726 27 330 20 2 0 0 0 0 0 37925 23 81 71 0 0 0 0 0 0 17524 25 83 691 0 0 0 0 0 0 79923 7 73 220 5 0 0 0 0 0 30522 7 70 279 15 1 0 0 0 0 37221 16 83 379 203 35 0 0 0 0 71620 4 54 365 1,946 291 4 0 0 0 2,66419 0 0 1 6 4 0 0 0 0 1118 0 0 2 7 6 0 0 0 0 1517 0 0 6 13 0 0 0 0 0 1916 0 0 13 212 11 1 0 0 0 23715 0 0 8 47 28 2 0 0 0 8514 0 0 7 23 18 1 0 0 0 4913 0 0 2 24 26 2 0 0 0 5412 0 0 0 26 21 0 0 0 0 4711 0 0 0 9 48 2 0 0 0 5910 0 0 0 18 36 2 0 0 0 569 0 0 1 16 27 15 2 0 0 618 0 0 0 3 36 14 1 0 0 547 0 0 0 5 36 32 0 0 0 736 0 0 0 2 45 48 7 0 0 1025 0 0 0 0 27 54 29 0 0 1104 0 0 0 0 13 59 58 7 0 1373 0 0 0 0 0 22 59 0 0 812 0 0 0 0 0 2 15 2 1 201 0 0 0 0 0 0 1 0 6 70 0 0 0 0 0 0 0 0 0 0
Total 438 828 2,068 2,582 709 260 172 9 7 7,073
YOS E-9 E-8 E-7 E-6 E-5 E-4 E-3 E-2 E-1 Total30+ 251 1 0 0 0 0 0 0 0 25229 38 3 0 0 0 0 0 0 0 4128 34 6 1 0 0 0 0 0 0 4127 22 42 2 0 0 0 0 0 0 6626 28 316 22 2 0 0 0 0 0 36825 24 77 77 0 0 0 0 0 0 17824 26 79 745 0 0 0 0 0 0 85023 8 70 234 5 0 0 0 0 0 31722 8 67 302 15 0 0 0 0 0 39221 16 79 409 217 3 0 0 0 0 72420 4 52 394 2,053 23 1 0 0 0 2,52719 0 0 1 6 4 0 0 0 0 1118 0 0 2 7 6 0 0 0 0 1517 0 0 6 13 0 0 0 0 0 1916 0 0 14 223 1 1 0 0 0 23915 0 0 8 48 24 2 0 0 0 8214 0 0 7 23 18 1 0 0 0 4913 0 0 2 24 27 2 0 0 0 5512 0 0 0 26 22 0 0 0 0 4811 0 0 0 9 48 2 0 0 0 5910 0 0 0 18 36 2 0 0 0 569 0 0 1 16 28 14 2 0 0 618 0 0 0 3 36 13 1 0 0 537 0 0 0 5 36 31 0 0 0 726 0 0 0 2 46 46 7 0 0 1015 0 0 0 0 28 52 30 0 0 1104 0 0 0 0 13 57 58 7 0 1353 0 0 0 0 0 21 59 0 0 802 0 0 0 0 0 2 15 2 1 201 0 0 0 0 0 0 1 0 6 70 0 0 0 0 0 0 0 0 0 0
Total 459 792 2,227 2,715 399 247 173 9 7 7,028
FY 2015
FY 2016
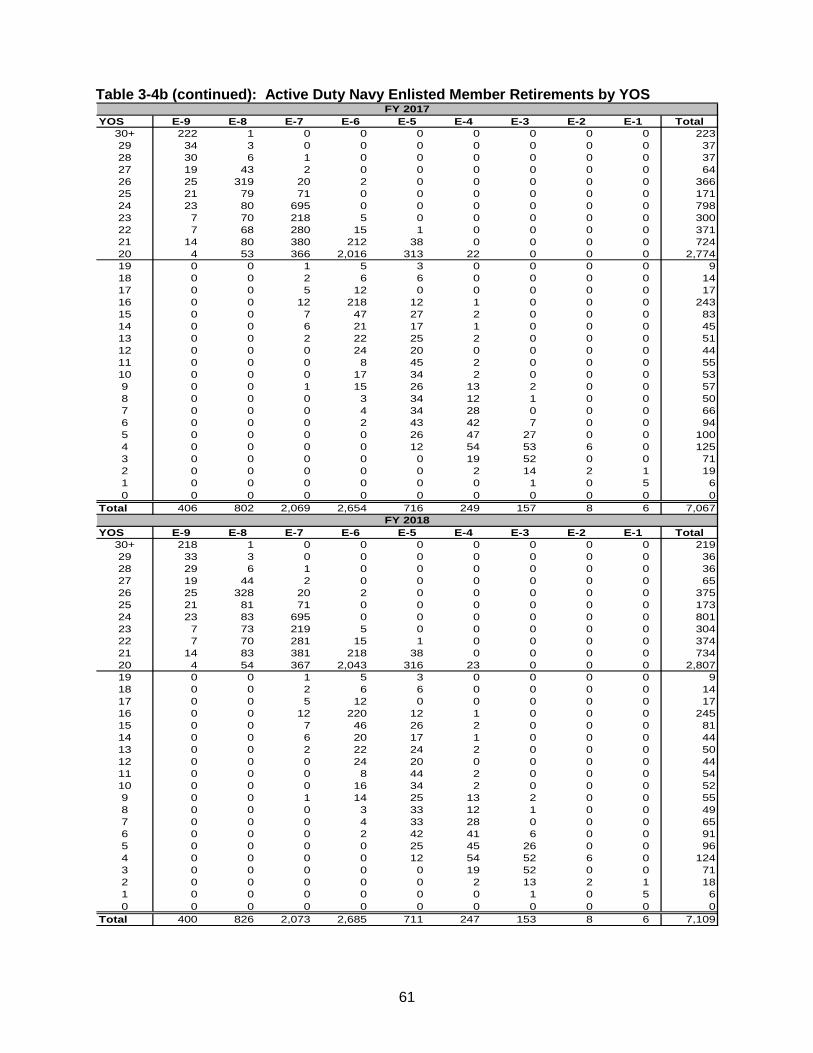
61
Table 3-4b (continued): Active Duty Navy Enlisted Member Retirements by YOS YOS E-9 E-8 E-7 E-6 E-5 E-4 E-3 E-2 E-1 Total
30+ 222 1 0 0 0 0 0 0 0 22329 34 3 0 0 0 0 0 0 0 3728 30 6 1 0 0 0 0 0 0 3727 19 43 2 0 0 0 0 0 0 6426 25 319 20 2 0 0 0 0 0 36625 21 79 71 0 0 0 0 0 0 17124 23 80 695 0 0 0 0 0 0 79823 7 70 218 5 0 0 0 0 0 30022 7 68 280 15 1 0 0 0 0 37121 14 80 380 212 38 0 0 0 0 72420 4 53 366 2,016 313 22 0 0 0 2,77419 0 0 1 5 3 0 0 0 0 918 0 0 2 6 6 0 0 0 0 1417 0 0 5 12 0 0 0 0 0 1716 0 0 12 218 12 1 0 0 0 24315 0 0 7 47 27 2 0 0 0 8314 0 0 6 21 17 1 0 0 0 4513 0 0 2 22 25 2 0 0 0 5112 0 0 0 24 20 0 0 0 0 4411 0 0 0 8 45 2 0 0 0 5510 0 0 0 17 34 2 0 0 0 539 0 0 1 15 26 13 2 0 0 578 0 0 0 3 34 12 1 0 0 507 0 0 0 4 34 28 0 0 0 666 0 0 0 2 43 42 7 0 0 945 0 0 0 0 26 47 27 0 0 1004 0 0 0 0 12 54 53 6 0 1253 0 0 0 0 0 19 52 0 0 712 0 0 0 0 0 2 14 2 1 191 0 0 0 0 0 0 1 0 5 60 0 0 0 0 0 0 0 0 0 0
Total 406 802 2,069 2,654 716 249 157 8 6 7,067
YOS E-9 E-8 E-7 E-6 E-5 E-4 E-3 E-2 E-1 Total30+ 218 1 0 0 0 0 0 0 0 21929 33 3 0 0 0 0 0 0 0 3628 29 6 1 0 0 0 0 0 0 3627 19 44 2 0 0 0 0 0 0 6526 25 328 20 2 0 0 0 0 0 37525 21 81 71 0 0 0 0 0 0 17324 23 83 695 0 0 0 0 0 0 80123 7 73 219 5 0 0 0 0 0 30422 7 70 281 15 1 0 0 0 0 37421 14 83 381 218 38 0 0 0 0 73420 4 54 367 2,043 316 23 0 0 0 2,80719 0 0 1 5 3 0 0 0 0 918 0 0 2 6 6 0 0 0 0 1417 0 0 5 12 0 0 0 0 0 1716 0 0 12 220 12 1 0 0 0 24515 0 0 7 46 26 2 0 0 0 8114 0 0 6 20 17 1 0 0 0 4413 0 0 2 22 24 2 0 0 0 5012 0 0 0 24 20 0 0 0 0 4411 0 0 0 8 44 2 0 0 0 5410 0 0 0 16 34 2 0 0 0 529 0 0 1 14 25 13 2 0 0 558 0 0 0 3 33 12 1 0 0 497 0 0 0 4 33 28 0 0 0 656 0 0 0 2 42 41 6 0 0 915 0 0 0 0 25 45 26 0 0 964 0 0 0 0 12 54 52 6 0 1243 0 0 0 0 0 19 52 0 0 712 0 0 0 0 0 2 13 2 1 181 0 0 0 0 0 0 1 0 5 60 0 0 0 0 0 0 0 0 0 0
Total 400 826 2,073 2,685 711 247 153 8 6 7,109
FY 2017
FY 2018

62
Table 3-4c: Active Duty Marine Corps Enlisted Member Retirements by YOS
YOS E-9 E-8 E-7 E-6 E-5 E-4 E-3 E-2 E-1 Total30+ 136 1 0 0 0 0 0 0 0 13729 24 0 0 0 0 0 0 0 0 2428 28 0 0 0 0 0 0 0 0 2827 21 13 0 0 0 0 0 0 0 3426 19 10 1 0 1 0 0 0 0 3125 13 16 0 0 0 0 0 0 0 2924 13 48 2 0 0 0 0 0 0 6323 5 46 3 0 0 0 0 0 0 5422 12 69 59 0 0 0 0 0 0 14021 7 83 59 8 0 0 0 0 0 15720 5 200 293 292 3 0 2 0 0 79519 0 0 6 10 0 0 0 0 0 018 0 0 4 20 0 0 0 0 0 017 0 0 5 24 0 0 0 0 0 016 0 0 4 16 3 0 0 0 0 015 0 0 0 24 1 0 0 0 0 014 0 0 1 19 3 0 0 0 0 013 0 0 0 32 6 0 0 0 0 012 0 0 0 16 1 0 0 0 0 011 0 0 0 15 0 0 0 0 0 010 0 0 0 9 0 0 0 0 0 09 0 0 0 2 0 0 0 0 0 08 0 0 0 0 0 0 0 0 0 07 0 0 0 0 0 0 0 0 0 06 0 0 0 0 0 0 0 0 0 05 0 0 0 0 0 3 0 0 0 04 0 0 0 0 0 2 0 0 0 03 0 0 0 0 0 1 0 0 0 02 0 0 0 0 0 0 0 1 0 01 0 0 0 0 0 0 0 0 1 00 0 0 0 0 0 0 0 0 0 0
Total 283 486 417 300 4 0 2 0 0 1,492
YOS E-9 E-8 E-7 E-6 E-5 E-4 E-3 E-2 E-1 Total30+ 132 1 0 0 0 0 0 0 0 13329 23 0 0 0 0 0 0 0 0 2328 27 0 0 0 0 0 0 0 0 2727 20 13 0 0 0 0 0 0 0 3326 18 10 1 0 1 0 0 0 0 3025 13 16 0 0 0 0 0 0 0 2924 13 48 2 0 0 0 0 0 0 6323 5 46 3 0 0 0 0 0 0 5422 12 69 66 0 0 0 0 0 0 14721 7 82 66 8 0 0 0 0 0 16320 5 198 332 298 3 0 1 0 0 83719 0 0 7 10 0 0 0 0 0 018 0 0 5 20 0 0 0 0 0 017 0 0 6 23 0 0 0 0 0 016 0 0 4 16 0 0 0 0 0 015 0 0 0 23 0 0 0 0 0 014 0 0 1 19 0 0 0 0 0 013 0 0 0 31 1 0 0 0 0 012 0 0 0 16 2 0 0 0 0 011 0 0 0 15 4 0 0 0 0 010 0 0 0 9 4 0 0 0 0 09 0 0 0 2 5 0 0 0 0 08 0 0 0 0 6 0 0 0 0 07 0 0 0 0 4 0 0 0 0 06 0 0 0 0 5 0 0 0 0 05 0 0 0 0 2 3 0 0 0 04 0 0 0 0 0 2 0 0 0 03 0 0 0 0 0 1 0 0 0 02 0 0 0 0 0 0 0 1 0 01 0 0 0 0 0 0 0 0 1 00 0 0 0 0 0 0 0 0 0 0
Total 275 483 470 306 4 0 1 0 0 1,539
FY 2013
FY 2014

63
Table 3-4c (continued): Active Duty Marine Corps Enlisted Member Retirements by YOS YOS E-9 E-8 E-7 E-6 E-5 E-4 E-3 E-2 E-1 Total
30+ 132 1 0 0 0 0 0 0 0 13329 23 0 0 0 0 0 0 0 0 2328 27 0 0 0 0 0 0 0 0 2727 20 13 0 0 0 0 0 0 0 3326 18 10 1 0 1 0 0 0 0 3025 13 16 0 0 0 0 0 0 0 2924 13 48 2 0 0 0 0 0 0 6323 5 46 3 0 0 0 0 0 0 5422 12 69 66 0 0 0 0 0 0 14721 7 82 66 8 0 0 0 0 0 16320 5 198 332 298 3 0 1 0 0 83719 0 0 6 10 0 0 0 0 0 018 0 0 4 20 0 0 0 0 0 017 0 0 5 24 0 0 0 0 0 016 0 0 4 16 3 0 0 0 0 015 0 0 0 24 1 0 0 0 0 014 0 0 1 19 3 0 0 0 0 013 0 0 0 32 6 0 0 0 0 012 0 0 0 16 1 0 0 0 0 011 0 0 0 15 0 0 0 0 0 010 0 0 0 9 0 0 0 0 0 09 0 0 0 2 0 0 0 0 0 08 0 0 0 0 0 0 0 0 0 07 0 0 0 0 0 0 0 0 0 06 0 0 0 0 0 0 0 0 0 05 0 0 0 0 0 3 0 0 0 04 0 0 0 0 0 2 0 0 0 03 0 0 0 0 0 1 0 0 0 02 0 0 0 0 0 0 0 1 0 01 0 0 0 0 0 0 0 0 1 00 0 0 0 0 0 0 0 0 0 0
Total 275 483 470 306 4 0 1 0 0 1,539
YOS E-9 E-8 E-7 E-6 E-5 E-4 E-3 E-2 E-1 Total30+ 132 1 0 0 0 0 0 0 0 13329 23 0 0 0 0 0 0 0 0 2328 27 0 0 0 0 0 0 0 0 2727 20 13 0 0 0 0 0 0 0 3326 18 10 1 0 1 0 0 0 0 3025 13 16 0 0 0 0 0 0 0 2924 13 48 2 0 0 0 0 0 0 6323 5 46 3 0 0 0 0 0 0 5422 12 69 66 0 0 0 0 0 0 14721 7 82 66 8 0 0 0 0 0 16320 5 198 332 298 3 0 1 0 0 83719 0 0 7 10 0 0 0 0 0 018 0 0 5 20 0 0 0 0 0 017 0 0 6 23 0 0 0 0 0 016 0 0 4 16 0 0 0 0 0 015 0 0 0 23 0 0 0 0 0 014 0 0 1 19 0 0 0 0 0 013 0 0 0 31 1 0 0 0 0 012 0 0 0 16 2 0 0 0 0 011 0 0 0 15 4 0 0 0 0 010 0 0 0 9 4 0 0 0 0 09 0 0 0 2 5 0 0 0 0 08 0 0 0 0 6 0 0 0 0 07 0 0 0 0 4 0 0 0 0 06 0 0 0 0 5 0 0 0 0 05 0 0 0 0 2 3 0 0 0 04 0 0 0 0 0 2 0 0 0 03 0 0 0 0 0 1 0 0 0 02 0 0 0 0 0 0 0 1 0 01 0 0 0 0 0 0 0 0 1 00 0 0 0 0 0 0 0 0 0 0
Total 275 483 470 306 4 0 1 0 0 1,539
FY 2015
FY 2016

64
Table 3-4c (continued): Active Duty Marine Corps Enlisted Member Retirements by YOS YOS E-9 E-8 E-7 E-6 E-5 E-4 E-3 E-2 E-1 Total
30+ 132 1 0 0 0 0 0 0 0 13329 23 0 0 0 0 0 0 0 0 2328 27 0 0 0 0 0 0 0 0 2727 20 13 0 0 0 0 0 0 0 3326 18 10 1 0 1 0 0 0 0 3025 13 16 0 0 0 0 0 0 0 2924 13 48 2 0 0 0 0 0 0 6323 5 46 3 0 0 0 0 0 0 5422 12 69 66 0 0 0 0 0 0 14721 7 82 66 8 0 0 0 0 0 16320 5 198 332 298 3 0 1 0 0 83719 0 0 6 10 0 0 0 0 0 018 0 0 4 20 0 0 0 0 0 017 0 0 5 24 0 0 0 0 0 016 0 0 4 16 3 0 0 0 0 015 0 0 0 24 1 0 0 0 0 014 0 0 1 19 3 0 0 0 0 013 0 0 0 32 6 0 0 0 0 012 0 0 0 16 1 0 0 0 0 011 0 0 0 15 0 0 0 0 0 010 0 0 0 9 0 0 0 0 0 09 0 0 0 2 0 0 0 0 0 08 0 0 0 0 0 0 0 0 0 07 0 0 0 0 0 0 0 0 0 06 0 0 0 0 0 0 0 0 0 05 0 0 0 0 0 3 0 0 0 04 0 0 0 0 0 2 0 0 0 03 0 0 0 0 0 1 0 0 0 02 0 0 0 0 0 0 0 1 0 01 0 0 0 0 0 0 0 0 1 00 0 0 0 0 0 0 0 0 0 0
Total 275 483 470 306 4 0 1 0 0 1,539
YOS E-9 E-8 E-7 E-6 E-5 E-4 E-3 E-2 E-1 Total30+ 132 1 0 0 0 0 0 0 0 13329 23 0 0 0 0 0 0 0 0 2328 27 0 0 0 0 0 0 0 0 2727 20 13 0 0 0 0 0 0 0 3326 18 10 1 0 1 0 0 0 0 3025 13 16 0 0 0 0 0 0 0 2924 13 48 2 0 0 0 0 0 0 6323 5 46 3 0 0 0 0 0 0 5422 12 69 66 0 0 0 0 0 0 14721 7 82 66 8 0 0 0 0 0 16320 5 198 332 298 3 0 1 0 0 83719 0 0 7 10 0 0 0 0 0 018 0 0 5 20 0 0 0 0 0 017 0 0 6 23 0 0 0 0 0 016 0 0 4 16 0 0 0 0 0 015 0 0 0 23 0 0 0 0 0 014 0 0 1 19 0 0 0 0 0 013 0 0 0 31 1 0 0 0 0 012 0 0 0 16 2 0 0 0 0 011 0 0 0 15 4 0 0 0 0 010 0 0 0 9 4 0 0 0 0 09 0 0 0 2 5 0 0 0 0 08 0 0 0 0 6 0 0 0 0 07 0 0 0 0 4 0 0 0 0 06 0 0 0 0 5 0 0 0 0 05 0 0 0 0 2 3 0 0 0 04 0 0 0 0 0 2 0 0 0 03 0 0 0 0 0 1 0 0 0 02 0 0 0 0 0 0 0 1 0 01 0 0 0 0 0 0 0 0 1 00 0 0 0 0 0 0 0 0 0 0
Total 275 483 470 306 4 0 1 0 0 1,539
FY 2017
FY 2018

65
Table 3-4d: Active Duty Air Force Enlisted Member Retirements by YOS
YOS E-9 E-8 E-7 E-6 E-5 E-4 E-3 E-2 E-1 Total30+ 225 0 0 0 0 0 0 0 0 22529 89 6 0 0 0 0 0 0 0 9528 61 11 0 0 0 0 0 0 0 7227 57 28 4 0 0 0 0 0 0 8526 47 325 3 0 0 0 0 0 0 37525 36 102 35 7 5 3 0 0 0 17324 14 72 1,271 115 0 0 0 0 0 1,35723 6 66 658 5 0 0 0 0 0 73522 6 64 622 180 0 0 0 0 0 87221 1 45 630 171 0 0 0 0 0 84620 2 64 1,574 926 10 0 0 0 0 2,57419 0 2 10 24 0 0 0 0 0 3618 0 0 15 29 0 0 0 0 0 4417 0 0 20 35 1 0 0 0 0 5616 0 0 10 51 1 0 0 0 0 6215 0 0 8 48 2 0 0 0 0 5814 0 0 3 56 2 0 0 0 0 6113 0 0 3 43 2 0 0 0 0 4812 0 0 3 35 4 0 0 0 0 4211 0 0 0 43 3 0 0 0 0 4610 0 0 0 11 8 0 0 0 0 199 0 0 0 5 6 0 0 0 0 118 0 0 0 8 8 0 0 0 0 167 0 0 0 0 4 0 0 0 0 46 0 0 0 0 6 2 0 0 0 85 0 0 0 0 3 1 0 0 0 44 0 0 0 0 2 1 1 43 0 0 0 0 0 3 0 0 0 32 0 0 0 0 0 1 0 1 0 11 0 0 0 0 0 0 0 0 1 00 0 0 0 0 0 0 0 0 0 0
Total 541 785 4,865 1,670 60 9 0 1 1 7,932
YOS E-9 E-8 E-7 E-6 E-5 E-4 E-3 E-2 E-1 Total30+ 213 0 0 0 0 0 0 0 0 21329 84 6 0 0 0 0 0 0 0 9028 58 10 0 0 0 0 0 0 0 6827 54 27 5 0 0 0 0 0 0 8126 45 321 2 0 0 0 0 0 0 36825 34 101 33 4 6 3 0 0 0 17224 13 71 1,174 0 0 0 0 0 0 1,25823 6 65 608 7 0 0 0 0 0 68622 6 63 576 236 0 0 0 0 0 88121 1 44 585 226 1 0 0 0 0 85620 2 63 1,455 1,224 35 0 0 0 0 2,77719 0 2 9 32 0 0 0 0 0 4318 0 0 14 39 0 0 0 0 0 5317 0 0 19 46 2 0 0 0 0 6716 0 0 9 67 2 0 0 0 0 7815 0 0 7 63 7 0 0 0 0 7714 0 0 2 74 6 0 0 0 0 8213 0 0 2 56 6 0 0 0 0 6412 0 0 2 46 14 0 0 0 0 6211 0 0 2 56 11 0 0 0 0 6910 0 0 0 14 26 0 0 0 0 409 0 0 0 7 22 0 0 0 0 298 0 0 0 11 26 0 0 0 0 377 0 0 0 0 14 0 0 0 0 146 0 0 0 0 22 1 0 0 0 235 0 0 0 0 10 2 0 0 0 124 0 0 0 0 1 2 0 1 0 43 0 0 0 0 0 3 0 0 1 42 0 0 0 0 0 1 0 1 0 11 0 0 0 0 0 0 0 0 1 00 0 0 0 0 0 0 0 0 0 0
Total 513 773 4,499 2,208 205 9 0 1 1 8,209
FY 2013
FY 2014
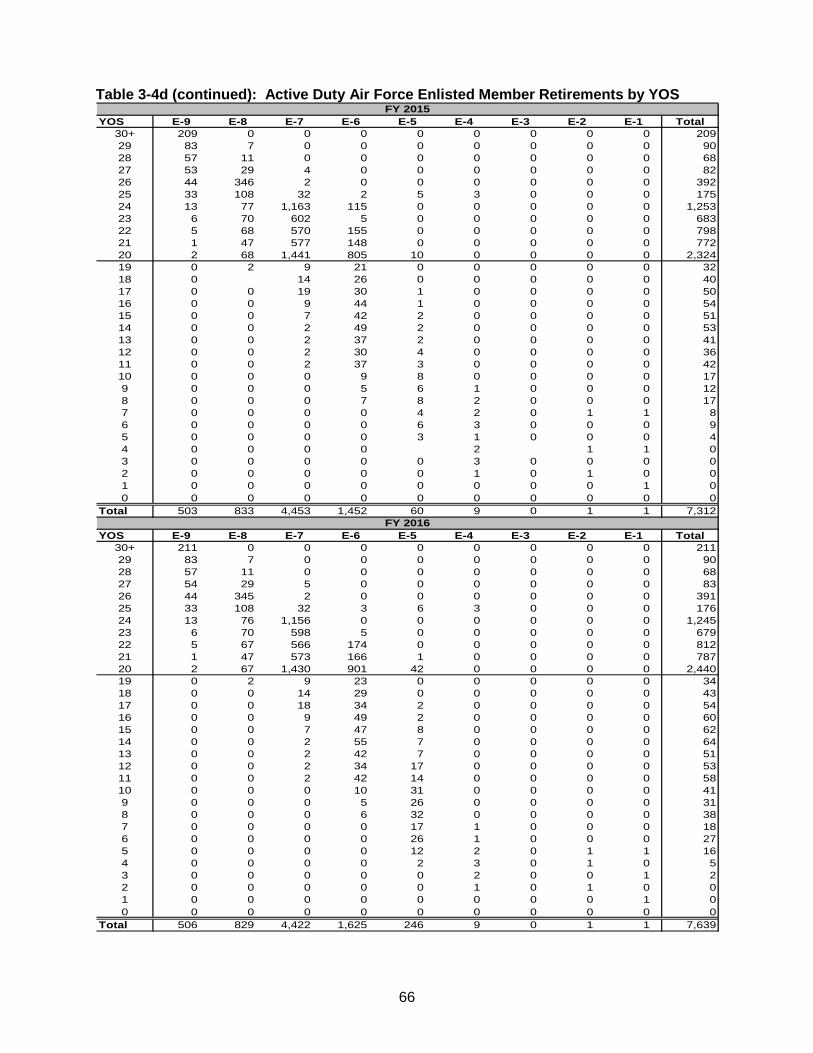
66
Table 3-4d (continued): Active Duty Air Force Enlisted Member Retirements by YOS
YOS E-9 E-8 E-7 E-6 E-5 E-4 E-3 E-2 E-1 Total30+ 209 0 0 0 0 0 0 0 0 20929 83 7 0 0 0 0 0 0 0 9028 57 11 0 0 0 0 0 0 0 6827 53 29 4 0 0 0 0 0 0 8226 44 346 2 0 0 0 0 0 0 39225 33 108 32 2 5 3 0 0 0 17524 13 77 1,163 115 0 0 0 0 0 1,25323 6 70 602 5 0 0 0 0 0 68322 5 68 570 155 0 0 0 0 0 79821 1 47 577 148 0 0 0 0 0 77220 2 68 1,441 805 10 0 0 0 0 2,32419 0 2 9 21 0 0 0 0 0 3218 0 14 26 0 0 0 0 0 4017 0 0 19 30 1 0 0 0 0 5016 0 0 9 44 1 0 0 0 0 5415 0 0 7 42 2 0 0 0 0 5114 0 0 2 49 2 0 0 0 0 5313 0 0 2 37 2 0 0 0 0 4112 0 0 2 30 4 0 0 0 0 3611 0 0 2 37 3 0 0 0 0 4210 0 0 0 9 8 0 0 0 0 179 0 0 0 5 6 1 0 0 0 128 0 0 0 7 8 2 0 0 0 177 0 0 0 0 4 2 0 1 1 86 0 0 0 0 6 3 0 0 0 95 0 0 0 0 3 1 0 0 0 44 0 0 0 0 2 1 1 03 0 0 0 0 0 3 0 0 0 02 0 0 0 0 0 1 0 1 0 01 0 0 0 0 0 0 0 0 1 00 0 0 0 0 0 0 0 0 0 0
Total 503 833 4,453 1,452 60 9 0 1 1 7,312
YOS E-9 E-8 E-7 E-6 E-5 E-4 E-3 E-2 E-1 Total30+ 211 0 0 0 0 0 0 0 0 21129 83 7 0 0 0 0 0 0 0 9028 57 11 0 0 0 0 0 0 0 6827 54 29 5 0 0 0 0 0 0 8326 44 345 2 0 0 0 0 0 0 39125 33 108 32 3 6 3 0 0 0 17624 13 76 1,156 0 0 0 0 0 0 1,24523 6 70 598 5 0 0 0 0 0 67922 5 67 566 174 0 0 0 0 0 81221 1 47 573 166 1 0 0 0 0 78720 2 67 1,430 901 42 0 0 0 0 2,44019 0 2 9 23 0 0 0 0 0 3418 0 0 14 29 0 0 0 0 0 4317 0 0 18 34 2 0 0 0 0 5416 0 0 9 49 2 0 0 0 0 6015 0 0 7 47 8 0 0 0 0 6214 0 0 2 55 7 0 0 0 0 6413 0 0 2 42 7 0 0 0 0 5112 0 0 2 34 17 0 0 0 0 5311 0 0 2 42 14 0 0 0 0 5810 0 0 0 10 31 0 0 0 0 419 0 0 0 5 26 0 0 0 0 318 0 0 0 6 32 0 0 0 0 387 0 0 0 0 17 1 0 0 0 186 0 0 0 0 26 1 0 0 0 275 0 0 0 0 12 2 0 1 1 164 0 0 0 0 2 3 0 1 0 53 0 0 0 0 0 2 0 0 1 22 0 0 0 0 0 1 0 1 0 01 0 0 0 0 0 0 0 0 1 00 0 0 0 0 0 0 0 0 0 0
Total 506 829 4,422 1,625 246 9 0 1 1 7,639
FY 2015
FY 2016

67
Table 3-4d (continued): Active Duty Air Force Enlisted Member Retirements by YOS
YOS E-9 E-8 E-7 E-6 E-5 E-4 E-3 E-2 E-1 Total30+ 210 0 0 0 0 0 0 0 0 21029 84 7 0 0 0 0 0 0 0 9128 58 11 0 0 0 0 0 0 0 6927 54 29 4 0 0 0 0 0 0 8326 45 346 2 0 0 0 0 0 0 39325 33 109 32 2 5 3 0 0 0 17624 13 77 1,156 115 0 0 0 0 0 1,24623 6 70 598 5 0 0 0 0 0 67922 6 68 566 167 0 0 0 0 0 80721 1 48 573 162 0 0 0 0 0 78320 2 68 1,430 865 10 0 0 0 0 2,37319 0 2 9 22 0 0 0 0 0 3318 0 14 27 0 0 0 0 0 4117 0 0 18 32 1 0 0 0 0 5016 0 0 9 47 1 0 0 0 0 5715 0 0 7 45 2 0 0 0 0 5414 0 0 2 52 2 0 0 0 0 5613 0 0 2 40 2 0 0 0 0 4412 0 0 2 32 4 0 0 0 0 3811 0 0 2 40 3 0 0 0 0 4510 0 0 0 10 7 0 0 0 0 179 0 0 0 5 6 1 0 0 0 118 0 0 0 7 8 2 0 0 0 157 0 0 0 0 4 1 0 1 1 56 0 0 0 0 6 1 0 1 0 85 0 0 0 0 3 1 0 0 1 54 0 0 0 0 1 2 1 1 33 0 0 0 0 0 3 0 0 0 32 0 0 0 0 0 1 0 1 0 11 0 0 0 0 0 0 0 0 1 00 0 0 0 0 0 0 0 0 0 0
Total 509 835 4,422 1,560 59 9 0 1 1 7,396
YOS E-9 E-8 E-7 E-6 E-5 E-4 E-3 E-2 E-1 Total30+ 212 0 0 0 0 0 0 0 0 21229 84 7 0 0 0 0 0 0 0 9128 58 11 0 0 0 0 0 0 0 6927 54 29 5 0 0 0 0 0 0 8326 45 346 2 0 0 0 0 0 0 39325 33 109 32 3 6 3 0 0 0 17424 13 77 1,156 0 0 0 0 0 0 1,24623 6 70 598 5 0 0 0 0 0 67922 4 68 566 172 0 0 0 0 0 81021 1 48 573 159 1 0 0 0 0 78020 2 68 1,430 865 10 0 0 0 0 2,37319 0 2 9 22 1 0 0 0 0 3418 0 0 14 27 1 0 0 0 0 4217 0 0 18 32 1 0 0 0 0 5116 0 0 9 47 2 0 0 0 0 5815 0 0 7 45 2 0 0 0 0 5414 0 0 2 52 2 0 0 0 0 5613 0 0 2 40 4 0 0 0 0 4612 0 0 2 32 3 0 0 0 0 3711 0 0 2 40 7 0 0 0 0 4910 0 0 0 10 6 0 0 0 0 169 0 0 0 5 8 0 0 0 0 138 0 0 0 7 4 1 0 1 0 137 0 0 0 0 6 1 0 0 0 76 0 0 0 0 2 1 0 0 0 35 0 0 0 0 12 2 0 1 1 34 0 0 0 0 2 3 0 1 0 33 0 0 0 0 0 1 0 0 1 12 0 0 0 0 0 1 0 1 0 01 0 0 0 0 0 0 0 0 1 00 0 0 0 0 0 0 0 0 0 0
Total 509 835 4,422 1,560 59 9 0 1 1 7,396
FY 2017
FY 2018

68
Chapter 4: Diversity Demographic Data
The tables in this chapter illustrate military personnel diversity data for each of the individual Services to include the reserve component. For each Service, there will be a series of tables presented that provide information on demographics, promotions, reenlistment, and extension. A more specific summary of each table follows. Data was provided by the Defense Manpower Data Center.
Table 4-1a-e provides active duty ethnicity, race and gender by Service as of 30 September 2012 along with a DoD summary. Each table is broken down by grade (officer and enlisted by rank). Table 4-2a-e provides the same data for the reserve component and a DoD summary.
In tables 4-3a-d and 4-4a-d, diversity personnel demographics are provided on promotions by active and reserve component by Service and grade. Tables 5-5a-d and 5-6a-d provide reenlistment and extension data by active and reserve component by Service and grade.

69
Table 4-1a: Army Active Duty Ethnicity, Race, and GenderTotal White Black Asian AMI/AL PI Multi Unknown Male Female
Hispanic 5,184 1,879 142 28 12 0 0 3,123 4,177 1,007Non Hispanic 73,093 56,721 9,572 4,129 394 412 0 1,865 61,068 12,025Unknown 4,261 3,108 604 209 10 0 0 330 2,776 1,485
9,125 7,016 778 566 52 50 0 663 7,321 1,80413,004 9,713 1,547 795 69 71 0 809 10,549 2,45528,331 20,369 3,836 1,647 134 145 0 2,200 22,627 5,70417,405 12,783 2,443 874 95 93 0 1,117 14,636 2,769
9,985 7,896 1,223 387 50 38 0 391 8,707 1,2784,373 3,659 458 92 14 14 0 136 3,886 487
133 114 16 2 0 1 0 0 125 8120 103 11 3 1 0 0 2 113 7
51 47 3 0 1 0 0 0 46 511 8 3 0 0 0 0 0 11 0
82,538 61,708 10,318 4,366 416 412 0 5,318 68,021 14,517Hispanic 1,385 321 29 3 1 0 0 1,031 1,219 166Non Hispanic 13,932 9,977 2,947 379 92 92 0 445 12,644 1,288Unknown 568 94 17 4 0 0 0 453 538 30
2,200 1,482 416 77 10 15 0 200 2,010 1906,644 4,138 1,336 141 29 44 0 956 5,925 7193,872 2,541 667 104 28 17 0 515 3,522 3502,522 1,734 479 52 22 11 0 224 2,336 186
647 497 95 12 4 5 0 34 608 3915,885 10,392 2,993 386 93 92 0 1,929 14,401 1,484
Hispanic 57,473 39,988 2,076 66 82 0 0 15,261 49,454 8,019Non Hispanic 389,466 264,920 96,707 15,132 3,705 4,705 0 4,297 340,079 49,387Unknown 135 31 19 11 0 0 0 74 113 22
13,020 9,489 2,931 329 119 87 0 65 11,546 1,47425,176 18,349 5,555 758 231 225 0 58 22,028 3,14862,272 45,806 12,851 2,255 528 561 0 271 53,191 9,081
143,090 104,225 28,168 5,638 1,222 1,478 0 2,359 122,584 20,50683,109 57,661 17,135 2,807 706 989 0 3,811 72,984 10,12563,569 39,137 15,373 2,011 490 846 0 5,712 56,641 6,92840,875 21,876 11,748 1,066 377 410 0 5,398 36,222 4,65312,292 6,449 3,798 289 95 80 0 1,581 11,042 1,250
3,671 1,947 1,243 56 19 29 0 377 3,408 263447,074 304,939 98,802 15,209 3,787 4,705 0 19,632 389,646 57,428
64,042 42,188 2,247 97 95 0 0 19,415 54,850 9,192476,491 331,618 109,226 19,640 4,191 5,209 0 6,607 413,791 62,700
4,964 3,233 640 224 10 0 0 857 3,427 1,537545,497 377,039 112,113 19,961 4,296 5,209 0 26,879 472,068 73,429
O-3O-4O-5O-6O-7O-8
Army
Enlisted
Commissioned Officer
Warrant Officer
O-1O-2
W-4W-5Total Warrant Officer
E-1E-2E-3
O-9O-10Total Officer
W-1W-2W-3
E-4E-5E-6E-7E-8E-9Total EnlistedHispanicNon HispanicUnknownTOTAL
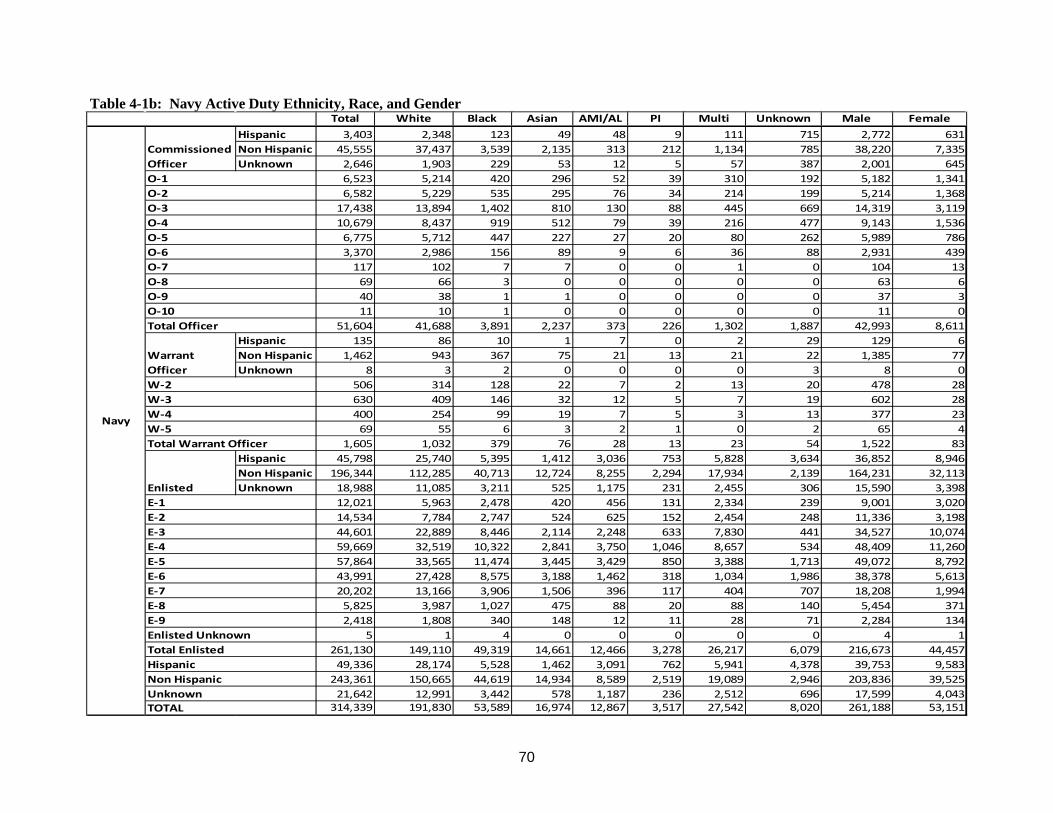
70
Table 4-1b: Navy Active Duty Ethnicity, Race, and GenderTotal White Black Asian AMI/AL PI Multi Unknown Male Female
Hispanic 3,403 2,348 123 49 48 9 111 715 2,772 631Non Hispanic 45,555 37,437 3,539 2,135 313 212 1,134 785 38,220 7,335Unknown 2,646 1,903 229 53 12 5 57 387 2,001 645
6,523 5,214 420 296 52 39 310 192 5,182 1,3416,582 5,229 535 295 76 34 214 199 5,214 1,368
17,438 13,894 1,402 810 130 88 445 669 14,319 3,11910,679 8,437 919 512 79 39 216 477 9,143 1,536
6,775 5,712 447 227 27 20 80 262 5,989 7863,370 2,986 156 89 9 6 36 88 2,931 439
117 102 7 7 0 0 1 0 104 1369 66 3 0 0 0 0 0 63 640 38 1 1 0 0 0 0 37 311 10 1 0 0 0 0 0 11 0
51,604 41,688 3,891 2,237 373 226 1,302 1,887 42,993 8,611Hispanic 135 86 10 1 7 0 2 29 129 6Non Hispanic 1,462 943 367 75 21 13 21 22 1,385 77Unknown 8 3 2 0 0 0 0 3 8 0
506 314 128 22 7 2 13 20 478 28630 409 146 32 12 5 7 19 602 28400 254 99 19 7 5 3 13 377 23
69 55 6 3 2 1 0 2 65 41,605 1,032 379 76 28 13 23 54 1,522 83
Hispanic 45,798 25,740 5,395 1,412 3,036 753 5,828 3,634 36,852 8,946Non Hispanic 196,344 112,285 40,713 12,724 8,255 2,294 17,934 2,139 164,231 32,113Unknown 18,988 11,085 3,211 525 1,175 231 2,455 306 15,590 3,398
12,021 5,963 2,478 420 456 131 2,334 239 9,001 3,02014,534 7,784 2,747 524 625 152 2,454 248 11,336 3,19844,601 22,889 8,446 2,114 2,248 633 7,830 441 34,527 10,07459,669 32,519 10,322 2,841 3,750 1,046 8,657 534 48,409 11,26057,864 33,565 11,474 3,445 3,429 850 3,388 1,713 49,072 8,79243,991 27,428 8,575 3,188 1,462 318 1,034 1,986 38,378 5,61320,202 13,166 3,906 1,506 396 117 404 707 18,208 1,994
5,825 3,987 1,027 475 88 20 88 140 5,454 3712,418 1,808 340 148 12 11 28 71 2,284 134
5 1 4 0 0 0 0 0 4 1261,130 149,110 49,319 14,661 12,466 3,278 26,217 6,079 216,673 44,457
49,336 28,174 5,528 1,462 3,091 762 5,941 4,378 39,753 9,583243,361 150,665 44,619 14,934 8,589 2,519 19,089 2,946 203,836 39,525
21,642 12,991 3,442 578 1,187 236 2,512 696 17,599 4,043314,339 191,830 53,589 16,974 12,867 3,517 27,542 8,020 261,188 53,151
Navy
Enlisted
Commissioned Officer
Warrant Officer
O-1O-2O-3O-4O-5O-6O-7
W-4W-5Total Warrant Officer
E-1E-2E-3
O-8O-9O-10Total Officer
W-2W-3
Enlisted UnknownTotal EnlistedHispanicNon HispanicUnknownTOTAL
E-4E-5E-6E-7E-8E-9

71
Table 4-1c: Marine Corps Active Duty Ethnicity, Race, and Gender
Total White Black Asian AMI/AL PI Multi Unknown Male Female Hispanic 1,355 887 31 5 17 6 16 393 1,237 118 Non Hispanic 18,434 15,235 923 526 124 74 253 1,299 17,304 1,130
2,519 2,101 123 77 18 13 25 162 2,266 253 3,806 2,934 129 115 32 19 54 523 3,526 280 6,863 5,590 281 200 43 27 104 618 6,419 444 3,909 3,146 292 104 34 13 58 262 3,707 202 1,917 1,646 100 29 12 7 24 99 1,868 49
686 627 23 5 2 1 4 24 667 19 32 27 3 1 0 0 0 1 32 0 33 29 1 0 0 0 0 3 32 1 20 18 2 0 0 0 0 0 20 0
4 4 0 0 0 0 0 0 4 0 19,789 16,122 954 531 141 80 269 1,692 18,541 1,248
Hispanic 277 163 3 1 2 1 1 106 253 24 Non Hispanic 1,825 1,389 246 55 20 12 17 86 1,739 86
201 143 23 9 2 1 1 22 185 16 922 670 105 32 10 5 9 91 878 44 580 433 70 9 6 5 4 53 549 31 298 229 37 5 3 2 4 18 284 14 101 77 14 1 1 0 0 8 96 5
2,102 1,552 249 56 22 13 18 192 1,992 110 Hispanic 27,488 21,144 695 77 266 119 153 5,034 24,866 2,622 Non Hispanic 149,441 118,523 18,638 4,062 1,660 1,700 1,731 3,127 139,430 10,011
13,381 11,353 1,365 334 148 136 18 27 12,570 811 20,584 17,241 2,129 518 216 187 175 118 18,858 1,726 48,273 40,534 4,214 1,191 467 470 569 828 44,688 3,585 35,022 28,338 3,376 820 391 429 369 1,299 32,294 2,728 28,570 21,499 3,128 618 319 314 359 2,333 26,591 1,979 16,353 11,156 2,388 354 202 156 232 1,865 15,358 995
9,098 5,955 1,517 203 122 74 107 1,120 8,559 539 4,001 2,563 798 78 50 34 37 441 3,797 204 1,647 1,028 418 23 11 19 18 130 1,581 66
176,929 139,667 19,333 4,139 1,926 1,819 1,884 8,161 164,296 12,633 29,120 22,194 729 83 285 126 170 5,533 26,356 2,764
169,700 135,147 19,807 4,643 1,804 1,786 2,001 4,512 158,473 11,227 198,820 157,341 20,536 4,726 2,089 1,912 2,171 10,045 184,829 13,991
Total Officer
W-1
E-8 E-9 Total Enlisted Hispanic Non Hispanic TOTAL*
E-2 E-3 E-4 E-5 E-6 E-7
Marine Corps
Enlisted
Commissioned Officer
Warrant Officer
O-1 O-2 O-3 O-4 O-5 O-6
W-2 W-3 W-4 W-5 Total Warrant Officer
E-1
O-7 O-8 O-9 O-10
* USMC Actuals for FY12 were 198,193
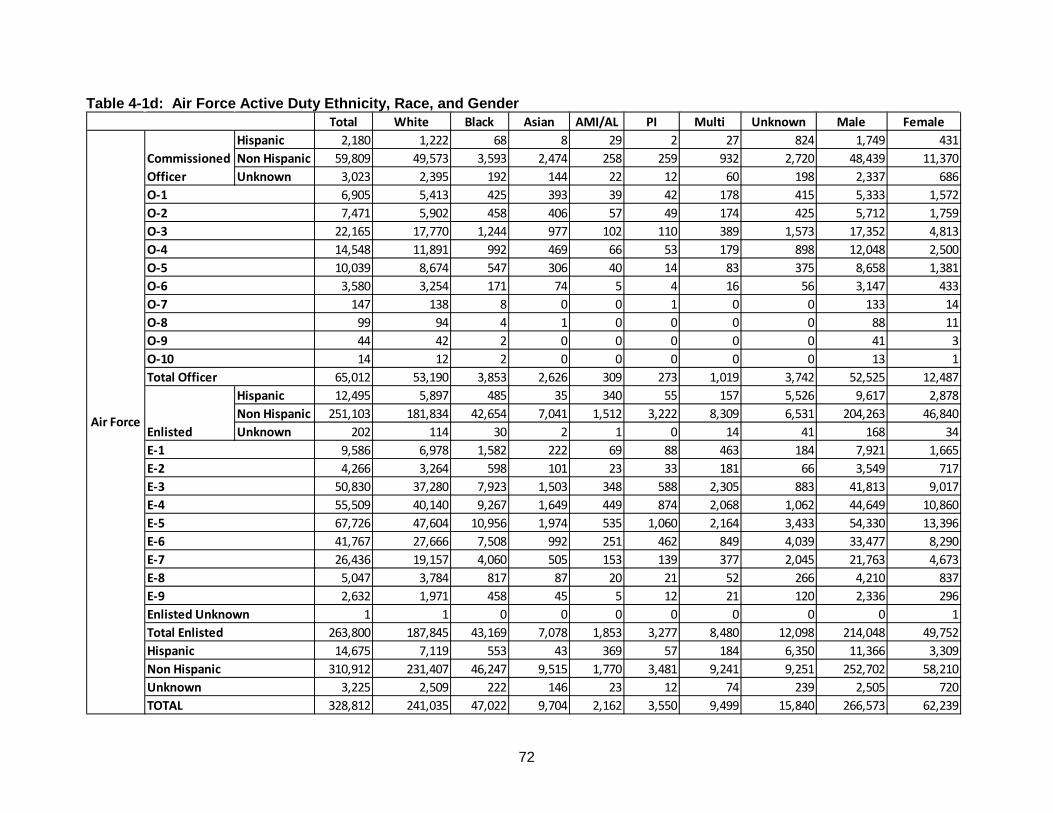
72
Table 4-1d: Air Force Active Duty Ethnicity, Race, and Gender Total White Black Asian AMI/AL PI Multi Unknown Male Female
Hispanic 2,180 1,222 68 8 29 2 27 824 1,749 431Non Hispanic 59,809 49,573 3,593 2,474 258 259 932 2,720 48,439 11,370Unknown 3,023 2,395 192 144 22 12 60 198 2,337 686
6,905 5,413 425 393 39 42 178 415 5,333 1,5727,471 5,902 458 406 57 49 174 425 5,712 1,759
22,165 17,770 1,244 977 102 110 389 1,573 17,352 4,81314,548 11,891 992 469 66 53 179 898 12,048 2,50010,039 8,674 547 306 40 14 83 375 8,658 1,381
3,580 3,254 171 74 5 4 16 56 3,147 433147 138 8 0 0 1 0 0 133 14
99 94 4 1 0 0 0 0 88 1144 42 2 0 0 0 0 0 41 314 12 2 0 0 0 0 0 13 1
65,012 53,190 3,853 2,626 309 273 1,019 3,742 52,525 12,487Hispanic 12,495 5,897 485 35 340 55 157 5,526 9,617 2,878Non Hispanic 251,103 181,834 42,654 7,041 1,512 3,222 8,309 6,531 204,263 46,840Unknown 202 114 30 2 1 0 14 41 168 34
9,586 6,978 1,582 222 69 88 463 184 7,921 1,6654,266 3,264 598 101 23 33 181 66 3,549 717
50,830 37,280 7,923 1,503 348 588 2,305 883 41,813 9,01755,509 40,140 9,267 1,649 449 874 2,068 1,062 44,649 10,86067,726 47,604 10,956 1,974 535 1,060 2,164 3,433 54,330 13,39641,767 27,666 7,508 992 251 462 849 4,039 33,477 8,29026,436 19,157 4,060 505 153 139 377 2,045 21,763 4,673
5,047 3,784 817 87 20 21 52 266 4,210 8372,632 1,971 458 45 5 12 21 120 2,336 296
1 1 0 0 0 0 0 0 0 1263,800 187,845 43,169 7,078 1,853 3,277 8,480 12,098 214,048 49,752
14,675 7,119 553 43 369 57 184 6,350 11,366 3,309310,912 231,407 46,247 9,515 1,770 3,481 9,241 9,251 252,702 58,210
3,225 2,509 222 146 23 12 74 239 2,505 720328,812 241,035 47,022 9,704 2,162 3,550 9,499 15,840 266,573 62,239
Air ForceEnlisted
Commissioned OfficerO-1O-2O-3O-4O-5O-6O-7
E-9Enlisted UnknownTotal EnlistedHispanicNon HispanicUnknown
E-3E-4
O-8O-9O-10Total Officer
E-1E-2
E-5E-6E-7E-8
TOTAL

73
Table 4-1e: DoD Active Duty Ethnicity, Race, and Gender
Total White Black AsianAMI/AL
N PI Multi Unknown Male FemaleHispanic 12,122 6,336 364 90 106 17 154 5,055 9,935 2,187Non Hispanic 196,891 158,966 17,627 9,264 1,089 957 2,319 6,669 165,031 31,860Unknown 9,930 7,406 1,025 406 44 17 117 915 7,114 2,816
25,072 19,744 1,746 1,332 161 144 513 1,432 20,102 4,97030,863 23,778 2,669 1,611 234 173 442 1,956 25,001 5,86274,797 57,623 6,763 3,634 409 370 938 5,060 60,717 14,08046,541 36,257 4,646 1,959 274 198 453 2,754 39,534 7,00728,716 23,928 2,317 949 129 79 187 1,127 25,222 3,49412,009 10,526 808 260 30 25 56 304 10,631 1,378
429 381 34 10 0 2 1 1 394 35321 292 19 4 1 0 0 5 296 25155 145 8 1 1 0 0 0 144 11
40 34 6 0 0 0 0 0 39 1218,943 172,708 19,016 9,760 1,239 991 2,590 12,639 182,080 36,863
Hispanic 1,797 570 42 5 10 1 3 1,166 1,601 196Non Hispanic 17,219 12,309 3,560 509 133 117 38 553 15,768 1,451Unknown 576 97 19 4 0 0 0 456 546 30
2,401 1,625 439 86 12 16 1 222 2,195 2068,072 5,122 1,569 195 46 51 22 1,067 7,281 7915,082 3,383 883 145 46 27 11 587 4,673 4093,220 2,217 615 76 32 18 7 255 2,997 223
817 629 115 16 7 6 0 44 769 4819,592 12,976 3,621 518 143 118 41 2,175 17,915 1,677
Hispanic 143,254 92,769 8,651 1,590 3,724 927 6,138 29,455 120,789 22,465Non Hispanic 986,354 677,562 198,712 38,959 15,132 11,921 27,974 16,094 848,003 138,351Unknown 19,325 11,230 3,260 538 1,176 231 2,469 421 15,871 3,454
48,008 33,783 8,356 1,305 792 442 2,815 515 41,038 6,97064,560 46,638 11,029 1,901 1,095 597 2,810 490 55,771 8,789
205,976 146,509 33,434 7,063 3,591 2,252 10,704 2,423 174,219 31,757293,290 205,222 51,133 10,948 5,812 3,827 11,094 5,254 247,936 45,354237,269 160,329 42,693 8,844 4,989 3,213 5,911 11,290 202,977 34,292165,680 105,387 33,844 6,545 2,405 1,782 2,115 13,602 143,854 21,826
96,611 60,154 21,231 3,280 1,048 740 888 9,270 84,752 11,85927,165 16,783 6,440 929 253 155 177 2,428 24,503 2,66210,368 6,754 2,459 272 47 71 67 698 9,609 759
6 2 4 0 0 0 0 0 4 21,148,933 781,561 210,623 41,087 20,032 13,079 36,581 45,970 984,663 164,270
157,173 99,675 9,057 1,685 3,840 945 6,295 35,676 132,325 24,8481,200,464 848,837 219,899 48,732 16,354 12,995 30,331 23,316 1,028,802 171,662
29,831 18,733 4,304 948 1,220 248 2,586 1,792 23,531 6,3001,387,468 967,245 233,260 51,365 21,414 14,188 39,212 60,784 1,184,658 202,810
Non HispanicUnknownTOTAL
O-6O-7O-8O-9O-10
E-6
W-1W-2W-3W-4W-5Total Warrant Officer
Hispanic
Total Officer
DoD Total
Enlisted
Commissioned Officer
Warrant Officer
O-1O-2O-3O-4O-5
E-1E-2E-3E-4E-5
E-7E-8E-9Enlisted UnknownTotal Enlisted

74
Table 4-2a: Army Selected Reserve Ethnicity, Race, and GenderTotal White Black Asian AMI/ALN PI Multi Unknown Male Female Unknown
Hispanic 1,898 1,158 27 16 2 0 0 695 1,576 322 0Non Hispanic 34,185 29,250 2,916 1,072 158 0 0 789 29,681 4,504 0Unknown 9 3 0 0 1 0 0 5 4 0 5
5,606 4,527 553 234 26 0 0 266 4,724 882 08,212 6,725 748 293 40 0 0 406 7,020 1,190 2
10,439 8,702 854 336 50 0 0 497 8,975 1,464 06,324 5,516 438 140 21 0 0 209 5,589 733 23,824 3,407 263 61 17 0 0 76 3,418 406 01,463 1,336 69 23 7 0 0 28 1,330 133 0
160 141 15 1 0 0 0 3 144 15 162 55 3 0 0 0 0 4 59 3 0
1 1 0 0 0 0 0 0 1 0 01 1 0 0 0 0 0 0 1 0 00 0 0 0 0 0 0 0 0 0 0
36,092 30,411 2,943 1,088 161 0 0 1,489 31,261 4,826 5Hispanic 369 227 7 2 0 0 0 133 310 59 0Non Hispanic 7,941 7,158 449 128 56 0 0 150 7,173 768 0Unknown 2 0 0 0 0 0 0 2 0 1 1
1,337 1,169 69 33 10 0 0 56 1,222 115 03,499 3,044 222 57 26 0 0 150 3,099 400 01,731 1,543 105 30 8 0 0 45 1,535 195 11,366 1,268 52 9 10 0 0 27 1,272 94 0
379 361 8 1 2 0 0 7 355 24 00 0 0 0 0 0 0 0 0 0 0
8,312 7,385 456 130 56 0 0 285 7,483 828 1Hispanic 29,452 23,382 1,078 76 49 0 0 4,867 24,363 5,089 0Non Hispanic 284,187 225,588 44,205 8,451 2,483 0 0 3,460 241,330 42,857 0Unknown 35 23 2 1 0 0 0 9 21 5 9
15,376 11,838 2,762 501 161 0 0 114 12,444 2,932 018,803 14,561 3,349 578 181 0 0 134 15,437 3,366 041,803 32,523 7,177 1,318 400 0 0 385 33,551 8,251 1
100,592 79,851 14,065 3,002 850 0 0 2,824 84,380 16,210 264,374 51,406 8,704 1,710 489 0 0 2,065 55,198 9,172 440,340 32,453 5,142 905 265 0 0 1,575 35,557 4,783 022,536 18,160 2,974 389 136 0 0 877 20,176 2,360 0
7,757 6,405 920 105 41 0 0 286 7,039 717 12,093 1,796 192 20 9 0 0 76 1,932 160 1
0 0 0 0 0 0 0 0 0 0 00 0 0 0 0 0 0 0 0 0 0
313,674 248,993 45,285 8,528 2,532 0 0 8,336 265,714 47,951 931,719 24,767 1,112 94 51 0 0 5,695 26,249 5,470 0
326,313 261,996 47,570 9,651 2,697 0 0 4,399 278,184 48,129 046 26 2 1 1 0 0 16 25 6 15
358,078 286,789 48,684 9,746 2,749 0 0 10,110 304,458 53,605 15
E-7E-8E-9E-10Enlisted UnknownTotal Enlisted
Total
W-5Warrant Officer UnknownTotal Warrant Officer
E-1E-2E-3E-4E-5E-6
ARNG
Enlisted
Commissioned Officer
Warrant Officer
HispanicNon HispanicUnknown
O-1O-2O-3O-4O-5O-6O-7O-8O-9O-10Officer UnknownTotal Officer
W-1W-2W-3W-4

75
Table 4-2a (continued): Army Selected Reserve Ethnicity, Race, and Gender Total White Black Asian AMI/ALN PI Multi Unknown Male Female Unknown
Hispanic 2,276 1,252 74 7 6 0 0 937 1,707 569 0Non Hispanic 29,480 21,274 5,488 1,522 160 227 0 809 21,983 7,497 0Unknown 179 86 32 7 1 0 0 53 110 69 0
2,711 1,731 494 204 20 30 0 232 1,958 753 04,942 3,154 1,043 338 26 30 0 351 3,150 1,792 0
10,261 7,097 1,828 542 46 80 0 668 7,515 2,746 06,365 4,659 1,056 239 41 47 0 323 4,951 1,414 05,836 4,434 997 161 32 28 0 184 4,728 1,108 01,716 1,447 165 51 2 11 0 40 1,409 307 0
68 59 7 1 0 1 0 0 57 11 036 31 4 0 0 0 0 1 32 4 0
0 0 0 0 0 0 0 0 0 0 00 0 0 0 0 0 0 0 0 0 00 0 0 0 0 0 0 0 0 0 0
31,935 22,612 5,594 1,536 167 227 0 1,799 23,800 8,135 0Hispanic 312 172 11 0 2 0 0 127 262 50 0Non Hispanic 2,926 2,215 542 87 22 19 0 41 2,491 435 0Unknown 2 1 1 0 0 0 0 0 2 0 0
502 358 80 25 3 5 0 31 420 82 01,481 1,034 304 41 13 9 0 80 1,250 231 0
543 408 96 6 3 2 0 28 460 83 0626 512 67 13 5 3 0 26 548 78 0
88 76 7 2 0 0 0 3 77 11 00 0 0 0 0 0 0 0 0 0 0
3,240 2,388 554 87 24 19 0 168 2,755 485 0Hispanic 24,914 18,768 885 35 46 0 0 5,180 19,390 5,524 0Non Hispanic 140,883 92,303 37,763 6,279 1,055 1,982 0 1,501 109,010 31,873 0Unknown 194 123 64 0 0 0 0 7 168 26 0
6,475 4,794 1,199 270 46 72 0 94 4,963 1,512 07,271 5,135 1,644 294 58 68 0 72 5,589 1,682 0
21,169 14,420 4,919 942 151 306 0 431 15,788 5,381 059,346 41,653 12,548 2,502 424 768 0 1,451 45,175 14,171 027,502 18,615 5,837 1,129 190 328 0 1,403 21,901 5,601 020,880 13,208 5,185 667 116 236 0 1,468 16,587 4,293 015,589 8,763 5,027 341 77 140 0 1,241 12,351 3,238 0
6,281 3,664 1,945 136 32 56 0 448 4,990 1,291 01,478 942 408 33 7 8 0 80 1,224 254 0
0 0 0 0 0 0 0 0 0 0 00 0 0 0 0 0 0 0 0 0 0
165,991 111,194 38,712 6,314 1,101 1,982 0 6,688 128,568 37,423 027,502 20,192 970 42 54 0 0 6,244 21,359 6,143 0
173,289 115,792 43,793 7,888 1,237 2,228 0 2,351 133,484 39,805 0375 210 97 7 1 0 0 60 280 95 0
201,166 136,194 44,860 7,937 1,292 2,228 0 8,655 155,123 46,043 0
E-10Enlisted UnknownTotal Enlisted
Total
E-1E-2E-3E-4E-5E-6E-7E-8E-9
Officer UnknownTotal Officer
W-1W-2W-3W-4W-5Warrant Officer UnknownTotal Warrant Officer
USAR
Enlisted
Commissioned Officer
Warrant Officer
HispanicNon HispanicUnknown
O-1O-2O-3O-4O-5O-6O-7O-8O-9O-10
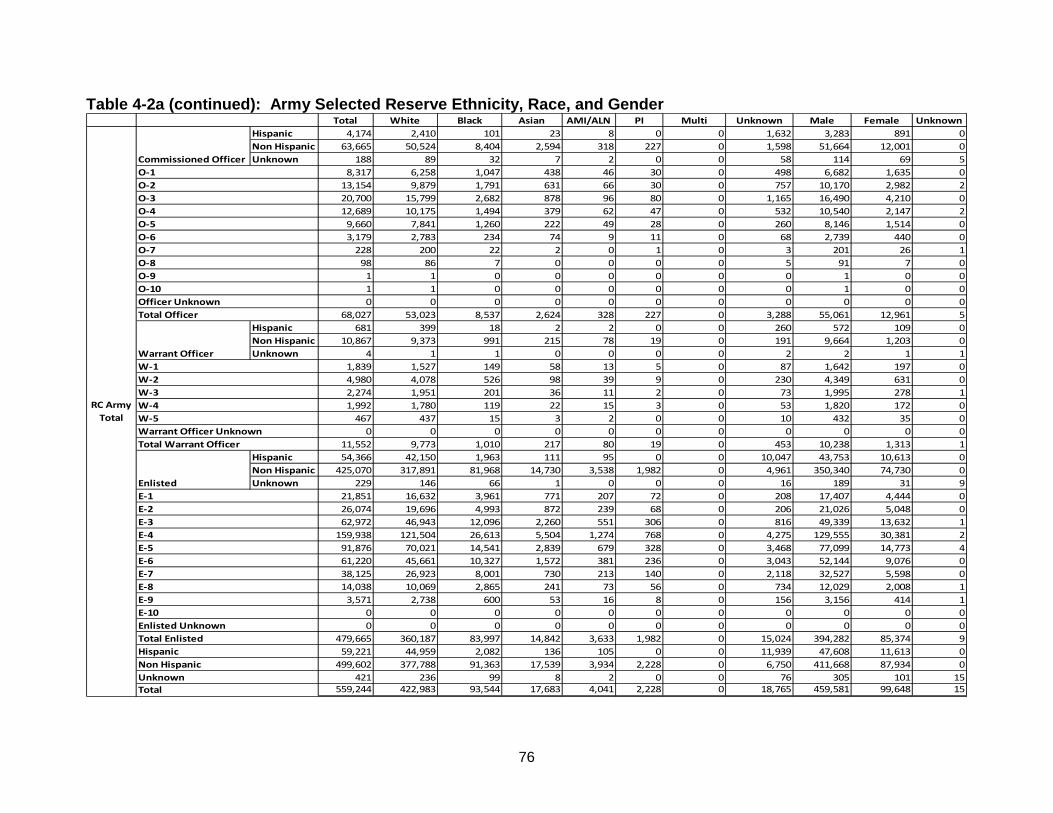
76
Table 4-2a (continued): Army Selected Reserve Ethnicity, Race, and Gender Total White Black Asian AMI/ALN PI Multi Unknown Male Female Unknown
Hispanic 4,174 2,410 101 23 8 0 0 1,632 3,283 891 0Non Hispanic 63,665 50,524 8,404 2,594 318 227 0 1,598 51,664 12,001 0Unknown 188 89 32 7 2 0 0 58 114 69 5
8,317 6,258 1,047 438 46 30 0 498 6,682 1,635 013,154 9,879 1,791 631 66 30 0 757 10,170 2,982 220,700 15,799 2,682 878 96 80 0 1,165 16,490 4,210 012,689 10,175 1,494 379 62 47 0 532 10,540 2,147 2
9,660 7,841 1,260 222 49 28 0 260 8,146 1,514 03,179 2,783 234 74 9 11 0 68 2,739 440 0
228 200 22 2 0 1 0 3 201 26 198 86 7 0 0 0 0 5 91 7 0
1 1 0 0 0 0 0 0 1 0 01 1 0 0 0 0 0 0 1 0 00 0 0 0 0 0 0 0 0 0 0
68,027 53,023 8,537 2,624 328 227 0 3,288 55,061 12,961 5Hispanic 681 399 18 2 2 0 0 260 572 109 0Non Hispanic 10,867 9,373 991 215 78 19 0 191 9,664 1,203 0Unknown 4 1 1 0 0 0 0 2 2 1 1
1,839 1,527 149 58 13 5 0 87 1,642 197 04,980 4,078 526 98 39 9 0 230 4,349 631 02,274 1,951 201 36 11 2 0 73 1,995 278 11,992 1,780 119 22 15 3 0 53 1,820 172 0
467 437 15 3 2 0 0 10 432 35 00 0 0 0 0 0 0 0 0 0 0
11,552 9,773 1,010 217 80 19 0 453 10,238 1,313 1Hispanic 54,366 42,150 1,963 111 95 0 0 10,047 43,753 10,613 0Non Hispanic 425,070 317,891 81,968 14,730 3,538 1,982 0 4,961 350,340 74,730 0Unknown 229 146 66 1 0 0 0 16 189 31 9
21,851 16,632 3,961 771 207 72 0 208 17,407 4,444 026,074 19,696 4,993 872 239 68 0 206 21,026 5,048 062,972 46,943 12,096 2,260 551 306 0 816 49,339 13,632 1
159,938 121,504 26,613 5,504 1,274 768 0 4,275 129,555 30,381 291,876 70,021 14,541 2,839 679 328 0 3,468 77,099 14,773 461,220 45,661 10,327 1,572 381 236 0 3,043 52,144 9,076 038,125 26,923 8,001 730 213 140 0 2,118 32,527 5,598 014,038 10,069 2,865 241 73 56 0 734 12,029 2,008 1
3,571 2,738 600 53 16 8 0 156 3,156 414 10 0 0 0 0 0 0 0 0 0 00 0 0 0 0 0 0 0 0 0 0
479,665 360,187 83,997 14,842 3,633 1,982 0 15,024 394,282 85,374 959,221 44,959 2,082 136 105 0 0 11,939 47,608 11,613 0
499,602 377,788 91,363 17,539 3,934 2,228 0 6,750 411,668 87,934 0421 236 99 8 2 0 0 76 305 101 15
559,244 422,983 93,544 17,683 4,041 2,228 0 18,765 459,581 99,648 15Total
E-4E-5E-6E-7E-8E-9E-10Enlisted UnknownTotal Enlisted
W-2W-3W-4W-5Warrant Officer UnknownTotal Warrant Officer
E-1E-2E-3
RC Army Total
Enlisted
Commissioned Officer
Warrant Officer
HispanicNon HispanicUnknown
O-1O-2O-3O-4O-5O-6O-7O-8O-9O-10Officer UnknownTotal Officer
W-1

77
Table 4-2b: Navy Selected Reserve Ethnicity, Race, and Gender Total White Black Asian AMI/ALN PI Multi Unknown Male Female Unknown
Hispanic 926 672 27 6 8 2 35 176 747 179 0Non Hispanic 11,619 9,577 764 581 78 49 335 235 9,592 2,027 0Unknown 1,592 977 92 6 3 1 22 491 1,327 265 0
764 566 71 46 5 5 47 24 581 183 0935 683 107 56 10 10 47 22 692 243 0
3,473 2,741 247 163 30 16 130 146 2,737 736 04,228 3,285 301 185 22 11 94 330 3,550 678 03,287 2,697 128 108 16 8 56 274 2,869 418 01,394 1,212 26 33 6 2 18 97 1,191 203 0
37 27 3 2 0 0 0 5 29 8 018 14 0 0 0 0 0 4 17 1 0
1 1 0 0 0 0 0 0 0 1 00 0 0 0 0 0 0 0 0 0 00 0 0 0 0 0 0 0 0 0 0
14,137 11,226 883 593 89 52 392 902 11,666 2,471 0Hispanic 7 7 0 0 0 0 0 0 6 1 0Non Hispanic 72 62 7 2 1 0 0 0 68 4 0Unknown 16 9 2 0 1 0 1 3 16 0 0
0 0 0 0 0 0 0 0 0 0 043 35 6 1 0 0 0 1 42 1 033 28 3 1 1 0 0 0 31 2 019 15 0 0 1 0 1 2 17 2 0
0 0 0 0 0 0 0 0 0 0 00 0 0 0 0 0 0 0 0 0 0
95 78 9 2 2 0 1 3 90 5 0Hispanic 8,726 5,414 828 191 388 103 639 1,163 6,650 2,076 0Non Hispanic 35,494 21,404 7,733 2,340 1,105 341 2,037 534 27,991 7,503 0Unknown 6,263 3,644 1,195 184 215 52 537 436 4,929 1,334 0
1,035 518 223 40 42 10 186 16 804 231 01,453 762 331 72 63 17 183 25 1,152 301 04,731 2,280 1,089 299 199 67 717 80 3,580 1,151 09,134 4,802 2,157 530 443 131 848 223 6,995 2,139 0
16,757 9,936 3,393 1,040 628 188 759 813 12,971 3,786 012,101 8,190 1,896 571 270 65 386 723 9,755 2,346 0
3,900 2,869 537 130 50 14 101 199 3,143 757 0991 794 95 22 13 4 19 44 836 155 0381 311 35 11 0 0 14 10 334 47 0
0 0 0 0 0 0 0 0 0 0 00 0 0 0 0 0 0 0 0 0 0
50,483 30,462 9,756 2,715 1,708 496 3,213 2,133 39,570 10,913 09,659 6,093 855 197 396 105 674 1,339 7,403 2,256 0
47,185 31,043 8,504 2,923 1,184 390 2,372 769 37,651 9,534 07,871 4,630 1,289 190 219 53 560 930 6,272 1,599 0
64,715 41,766 10,648 3,310 1,799 548 3,606 3,038 51,326 13,389 0
E-7E-8E-9E-10Enlisted UnknownTotal Enlisted
Total
W-5Warrant Officer UnknownTotal Warrant Officer
E-1E-2E-3E-4E-5E-6
USNR
Enlisted
Commissioned Officer
Warrant Officer
HispanicNon HispanicUnknown
O-1O-2O-3O-4O-5O-6O-7O-8O-9O-10Officer UnknownTotal Officer
W-1W-2W-3W-4

78
Table 4-2c: Marine Corps Selected Reserve Ethnicity, Race, and Gender Total White Black Asian AMI/ALN PI Multi Unknown Male Female Unknown
Hispanic 258 155 7 0 3 2 5 86 236 22 0Non Hispanic 3,355 2,811 158 98 39 14 36 199 3,114 241 0Unknown 0 0 0 0 0 0 0 0 0 0 0
241 192 10 12 3 1 5 18 236 5 0181 141 8 9 4 0 2 17 174 7 0828 644 41 24 10 7 10 92 740 88 0
1,083 877 59 32 15 3 11 86 988 95 0955 820 42 16 7 3 11 56 899 56 0313 280 5 5 3 2 2 16 303 10 0
7 7 0 0 0 0 0 0 6 1 05 5 0 0 0 0 0 0 4 1 00 0 0 0 0 0 0 0 0 0 00 0 0 0 0 0 0 0 0 0 00 0 0 0 0 0 0 0 0 0 0
3,613 2,966 165 98 42 16 41 285 3,350 263 0Hispanic 30 12 1 0 1 0 2 14 27 3 0Non Hispanic 267 197 33 7 1 0 1 28 249 18 0Unknown 0 0 0 0 0 0 0 0 0 0 0
18 15 0 0 0 0 0 3 18 0 0136 91 16 6 1 0 2 20 126 10 0
90 65 13 1 1 0 0 10 85 5 040 29 3 0 0 0 1 7 36 4 013 9 2 0 0 0 0 2 11 2 0
0 0 0 0 0 0 0 0 0 0 0297 209 34 7 2 0 3 42 276 21 0
Hispanic 5,638 4,377 107 17 32 17 28 1,060 5,305 333 0Non Hispanic 29,995 24,023 3,169 1,252 206 259 291 795 28,830 1,165 0Unknown 1 0 0 0 0 0 1 0 1 0 0
1,707 1,456 168 58 9 11 2 3 1,684 23 03,423 2,807 375 136 30 25 31 19 3,320 103 0
15,486 12,857 1,398 555 93 126 133 324 14,992 494 06,275 5,001 499 268 30 52 44 381 5,995 280 05,077 3,830 399 165 33 38 71 541 4,726 351 01,896 1,286 216 54 21 10 25 284 1,752 144 01,153 733 141 23 16 10 9 221 1,080 73 0
435 299 53 7 5 4 5 62 414 21 0182 131 27 3 1 0 0 20 173 9 0
0 0 0 0 0 0 0 0 0 0 00 0 0 0 0 0 0 0 0 0 0
35,634 28,400 3,276 1,269 238 276 320 1,855 34,136 1,498 05,926 4,544 115 17 36 19 35 1,160 5,568 358 0
33,617 27,031 3,360 1,357 246 273 328 1,022 32,193 1,424 01 0 0 0 0 0 1 0 1 0 0
39,544 31,575 3,475 1,374 282 292 364 2,182 37,762 1,782 0
E-10Enlisted UnknownTotal Enlisted
Total
E-1E-2E-3E-4E-5E-6E-7E-8E-9
Officer UnknownTotal Officer
W-1W-2W-3W-4W-5Warrant Officer UnknownTotal Warrant Officer
USMCR
Enlisted
Commissioned Officer
Warrant Officer
HispanicNon HispanicUnknown
O-1O-2O-3O-4O-5O-6O-7O-8O-9O-10

79
Table 4-2d: Air Force Selected Reserve Ethnicity, Race, and Gender Total White Black Asian AMI/ALN PI Multi Unknown Male Female Unknown
Hispanic 585 396 8 6 6 1 6 162 464 121 0Non Hispanic 14,004 12,396 694 343 70 71 133 297 11,512 2,492 0Unknown 9 6 1 0 0 0 1 1 7 2 0
1,063 904 62 32 2 8 18 37 807 256 01,044 895 58 33 6 9 10 33 779 265 03,238 2,758 161 94 15 19 49 142 2,500 738 03,982 3,452 208 98 22 21 30 151 3,294 688 04,148 3,751 183 70 21 11 27 85 3,585 563 0
973 904 25 18 8 4 4 10 877 96 0117 105 5 3 1 0 1 2 109 8 0
28 24 1 1 1 0 1 0 27 1 04 4 0 0 0 0 0 0 4 0 01 1 0 0 0 0 0 0 1 0 00 0 0 0 0 0 0 0 0 0 0
14,598 12,798 703 349 76 72 140 460 11,983 2,615 0Hispanic 0 0 0 0 0 0 0 0 0 0 0Non Hispanic 0 0 0 0 0 0 0 0 0 0 0Unknown 0 0 0 0 0 0 0 0 0 0 0
0 0 0 0 0 0 0 0 0 0 00 0 0 0 0 0 0 0 0 0 00 0 0 0 0 0 0 0 0 0 00 0 0 0 0 0 0 0 0 0 00 0 0 0 0 0 0 0 0 0 00 0 0 0 0 0 0 0 0 0 00 0 0 0 0 0 0 0 0 0 0
Hispanic 4,716 2,922 117 12 74 18 65 1,508 3,806 910 0Non Hispanic 86,044 71,129 8,088 2,365 574 941 1,481 1,466 69,795 16,249 0Unknown 31 22 1 0 0 0 3 5 26 5 0
1,023 803 150 22 9 9 29 1 709 314 0383 288 71 8 3 3 8 2 269 114 0
12,774 10,249 1,488 350 75 158 335 119 9,912 2,862 014,030 11,229 1,395 440 92 231 317 326 11,200 2,830 020,402 16,282 1,890 626 129 293 414 768 16,877 3,525 019,630 16,022 1,620 497 158 134 248 951 16,050 3,580 015,878 13,350 1,202 325 135 99 156 611 12,920 2,958 0
4,699 4,114 280 75 29 21 31 149 3,979 720 01,971 1,735 110 34 18 11 11 52 1,710 261 0
0 0 0 0 0 0 0 0 0 0 01 1 0 0 0 0 0 0 1 0 0
90,791 74,073 8,206 2,377 648 959 1,549 2,979 73,627 17,164 05,301 3,318 125 18 80 19 71 1,670 4,270 1,031 0
100,048 83,525 8,782 2,708 644 1,012 1,614 1,763 81,307 18,741 040 28 2 0 0 0 4 6 33 7 0
105,389 86,871 8,909 2,726 724 1,031 1,689 3,439 85,610 19,779 0
ANG
Enlisted
Commissioned Officer
Warrant Officer
HispanicNon HispanicUnknown
O-1O-2O-3O-4O-5O-6O-7O-8O-9O-10Officer UnknownTotal Officer
W-1W-2W-3W-4W-5Warrant Officer UnknownTotal Warrant Officer
E-1E-2E-3E-4E-5E-6E-7E-8E-9E-10Enlisted UnknownTotal Enlisted
Total

80
Table 4-2d (continued): Air Force Selected Reserve Ethnicity, Race, and Gender Total White Black Asian AMI/ALN PI Multi Unknown Male Female Unknown
Hispanic 636 404 17 2 6 0 2 205 451 185 0Non Hispanic 13,664 11,436 959 424 44 53 189 559 10,075 3,589 0Unknown 3 2 0 1 0 0 0 0 3 0 0
355 289 24 19 0 2 6 15 251 104 0526 402 52 15 0 2 11 44 354 172 0
3,145 2,354 313 130 15 18 63 252 2,109 1,036 04,717 3,849 347 146 15 22 71 267 3,434 1,283 04,327 3,815 203 102 14 7 29 157 3,426 901 01,150 1,054 36 13 6 2 10 29 887 263 0
55 53 1 0 0 0 1 0 43 12 027 26 0 1 0 0 0 0 25 2 0
0 0 0 0 0 0 0 0 0 0 00 0 0 0 0 0 0 0 0 0 01 0 0 1 0 0 0 0 0 1 0
14,303 11,842 976 427 50 53 191 764 10,529 3,774 0Hispanic 0 0 0 0 0 0 0 0 0 0 0Non Hispanic 0 0 0 0 0 0 0 0 0 0 0Unknown 0 0 0 0 0 0 0 0 0 0 0
0 0 0 0 0 0 0 0 0 0 00 0 0 0 0 0 0 0 0 0 00 0 0 0 0 0 0 0 0 0 00 0 0 0 0 0 0 0 0 0 00 0 0 0 0 0 0 0 0 0 00 0 0 0 0 0 0 0 0 0 00 0 0 0 0 0 0 0 0 0 0
Hispanic 4,154 2,616 143 13 64 16 55 1,247 3,078 1,076 0Non Hispanic 52,942 36,828 10,966 1,556 294 694 1,098 1,506 39,371 13,571 0Unknown 29 18 5 0 0 0 1 5 20 9 0
1,678 1,015 509 51 9 33 52 9 1,136 542 01,319 760 444 39 7 16 43 10 900 419 04,566 2,785 1,343 162 36 69 131 40 3,103 1,463 0
13,252 8,762 2,957 440 88 194 313 498 9,537 3,715 010,502 7,324 1,773 325 65 133 260 622 7,962 2,540 012,749 9,015 2,094 315 79 157 223 866 9,772 2,977 0
8,893 6,545 1,414 173 46 85 103 527 6,830 2,063 03,148 2,431 459 51 23 19 20 145 2,403 745 01,018 825 121 13 5 4 9 41 826 192 0
0 0 0 0 0 0 0 0 0 0 00 0 0 0 0 0 0 0 0 0 0
57,125 39,462 11,114 1,569 358 710 1,154 2,758 42,469 14,656 04,790 3,020 160 15 70 16 57 1,452 3,529 1,261 0
66,606 48,264 11,925 1,980 338 747 1,287 2,065 49,446 17,160 032 20 5 1 0 0 1 5 23 9 0
71,428 51,304 12,090 1,996 408 763 1,345 3,522 52,998 18,430 0
USAFR
Enlisted
Commissioned Officer
Warrant Officer
HispanicNon HispanicUnknown
O-1O-2O-3O-4O-5O-6O-7O-8O-9O-10Officer UnknownTotal Officer
W-1W-2W-3W-4W-5Warrant Officer UnknownTotal Warrant Officer
E-1E-2E-3E-4E-5E-6E-7E-8E-9E-10Enlisted UnknownTotal Enlisted
Total

81
Table 4-2d (continued): Air Force Selected Reserve Ethnicity, Race, and Gender Total White Black Asian AMI/ALN PI Multi Unknown Male Female Unknown
Hispanic 1,221 800 25 8 12 1 8 367 915 306 0Non Hispanic 27,668 23,832 1,653 767 114 124 322 856 21,587 6,081 0Unknown 12 8 1 1 0 0 1 1 10 2 0
1,418 1,193 86 51 2 10 24 52 1,058 360 01,570 1,297 110 48 6 11 21 77 1,133 437 06,383 5,112 474 224 30 37 112 394 4,609 1,774 08,699 7,301 555 244 37 43 101 418 6,728 1,971 08,475 7,566 386 172 35 18 56 242 7,011 1,464 02,123 1,958 61 31 14 6 14 39 1,764 359 0
172 158 6 3 1 0 2 2 152 20 055 50 1 2 1 0 1 0 52 3 0
4 4 0 0 0 0 0 0 4 0 01 1 0 0 0 0 0 0 1 0 01 0 0 1 0 0 0 0 0 1 0
28,901 24,640 1,679 776 126 125 331 1,224 22,512 6,389 0Hispanic 0 0 0 0 0 0 0 0 0 0 0Non Hispanic 0 0 0 0 0 0 0 0 0 0 0Unknown 0 0 0 0 0 0 0 0 0 0 0
0 0 0 0 0 0 0 0 0 0 00 0 0 0 0 0 0 0 0 0 00 0 0 0 0 0 0 0 0 0 00 0 0 0 0 0 0 0 0 0 00 0 0 0 0 0 0 0 0 0 00 0 0 0 0 0 0 0 0 0 00 0 0 0 0 0 0 0 0 0 0
Hispanic 8,870 5,538 260 25 138 34 120 2,755 6,884 1,986 0Non Hispanic 138,986 107,957 19,054 3,921 868 1,635 2,579 2,972 109,166 29,820 0Unknown 60 40 6 0 0 0 4 10 46 14 0
2,701 1,818 659 73 18 42 81 10 1,845 856 01,702 1,048 515 47 10 19 51 12 1,169 533 0
17,340 13,034 2,831 512 111 227 466 159 13,015 4,325 027,282 19,991 4,352 880 180 425 630 824 20,737 6,545 030,904 23,606 3,663 951 194 426 674 1,390 24,839 6,065 032,379 25,037 3,714 812 237 291 471 1,817 25,822 6,557 024,771 19,895 2,616 498 181 184 259 1,138 19,750 5,021 0
7,847 6,545 739 126 52 40 51 294 6,382 1,465 02,989 2,560 231 47 23 15 20 93 2,536 453 0
0 0 0 0 0 0 0 0 0 0 01 1 0 0 0 0 0 0 1 0 0
147,916 113,535 19,320 3,946 1,006 1,669 2,703 5,737 116,096 31,820 010,091 6,338 285 33 150 35 128 3,122 7,799 2,292 0
166,654 131,789 20,707 4,688 982 1,759 2,901 3,828 130,753 35,901 072 48 7 1 0 0 5 11 56 16 0
176,817 138,175 20,999 4,722 1,132 1,794 3,034 6,961 138,608 38,209 0
E-10Enlisted UnknownTotal Enlisted
Total
E-1E-2E-3E-4E-5E-6E-7E-8E-9
Officer UnknownTotal Officer
W-1W-2W-3W-4W-5Warrant Officer UnknownTotal Warrant Officer
RC Air Force Total
Enlisted
Commissioned Officer
Warrant Officer
HispanicNon HispanicUnknown
O-1O-2O-3O-4O-5O-6O-7O-8O-9O-10

82
Table 4-2e (continued): DoD Selected Reserve Ethnicity, Race, and Gender Total White Black Asian AMI/ALN PI Multi Unknown Male Female Unknown
Hispanic 6,579 4,037 160 37 31 5 48 2,261 5,181 1,398 0Non Hispanic 106,307 86,744 10,979 4,040 549 414 693 2,888 85,957 20,350 0Unknown 1,792 1,074 125 14 5 1 23 550 1,451 336 5
10,740 8,209 1,214 547 56 46 76 592 8,557 2,183 015,840 12,000 2,016 744 86 51 70 873 12,169 3,669 231,384 24,296 3,444 1,289 166 140 252 1,797 24,576 6,808 026,699 21,638 2,409 840 136 104 206 1,366 21,806 4,891 222,377 18,924 1,816 518 107 57 123 832 18,925 3,452 0
7,009 6,233 326 143 32 21 34 220 5,997 1,012 0444 392 31 7 1 1 2 10 388 55 1176 155 8 2 1 0 1 9 164 12 0
6 6 0 0 0 0 0 0 5 1 02 2 0 0 0 0 0 0 2 0 01 0 0 1 0 0 0 0 0 1 0
114,678 91,855 11,264 4,091 585 420 764 5,699 92,589 22,084 5Hispanic 718 418 19 2 3 0 2 274 605 113 0Non Hispanic 11,206 9,632 1,031 224 80 19 1 219 9,981 1,225 0Unknown 20 10 3 0 1 0 1 5 18 1 1
1,857 1,542 149 58 13 5 0 90 1,660 197 05,159 4,204 548 105 40 9 2 251 4,517 642 02,397 2,044 217 38 13 2 0 83 2,111 285 12,051 1,824 122 22 16 3 2 62 1,873 178 0
480 446 17 3 2 0 0 12 443 37 00 0 0 0 0 0 0 0 0 0 0
11,944 10,060 1,053 226 84 19 4 498 10,604 1,339 1Hispanic 77,600 57,479 3,158 344 653 154 787 15,025 62,592 15,008 0Non Hispanic 629,545 471,275 111,924 22,243 5,717 4,217 4,907 9,262 516,327 113,218 0Unknown 6,553 3,830 1,267 185 215 52 542 462 5,165 1,379 9
27,294 20,424 5,011 942 276 135 269 237 21,740 5,554 032,652 24,313 6,214 1,127 342 129 265 262 26,667 5,985 0
100,529 75,114 17,414 3,626 954 726 1,316 1,379 80,926 19,602 1202,629 151,298 33,621 7,182 1,927 1,376 1,522 5,703 163,282 39,345 2144,614 107,393 21,996 4,995 1,534 980 1,504 6,212 119,635 24,975 4107,596 80,174 16,153 3,009 909 602 882 5,867 89,473 18,123 0
67,949 50,420 11,295 1,381 460 348 369 3,676 56,500 11,449 023,311 17,707 3,752 396 143 104 75 1,134 19,661 3,649 1
7,123 5,740 893 114 40 23 34 279 6,199 923 10 0 0 0 0 0 0 0 0 0 01 1 0 0 0 0 0 0 1 0 0
713,698 532,584 116,349 22,772 6,585 4,423 6,236 24,749 584,084 129,605 984,897 61,934 3,337 383 687 159 837 17,560 68,378 16,519 0
747,058 567,651 123,934 26,507 6,346 4,650 5,601 12,369 612,265 134,793 08,365 4,914 1,395 199 221 53 566 1,017 6,634 1,716 15
840,320 634,499 128,666 27,089 7,254 4,862 7,004 30,946 687,277 153,028 15
DoD Total
Enlisted
Commissioned Officer
Warrant Officer
HispanicNon HispanicUnknown
O-1O-2O-3O-4O-5O-6O-7O-8O-9O-10Officer UnknownTotal Officer
W-1W-2W-3W-4W-5Warrant Officer UnknownTotal Warrant Officer
E-1
Enlisted UnknownTotal Enlisted
Total
E-2E-3E-4E-5E-6E-7E-8E-9E-10

83
Table 4-3a: Army Active Duty Promotion Demographics Total White Black Asian AMI/ALN PI Multi Unknown Male Female
Hispanic 860 355 25 3 3 0 0 474 702 158Non Hispanic 11,419 8,846 1,431 697 66 79 0 300 9,509 1,910Unknown 748 510 124 41 1 0 0 72 439 309
6,042 4,656 616 387 24 34 0 325 5,002 1,0402,174 1,473 376 126 15 13 0 171 1,649 5252,507 1,697 351 152 15 21 0 271 1,991 5161,565 1,253 177 59 12 9 0 55 1,346 219
630 539 48 15 4 2 0 22 564 6643 37 5 1 0 0 0 0 40 347 38 6 1 0 0 0 2 42 518 18 0 0 0 0 0 0 15 3
1 0 1 0 0 0 0 0 1 013,027 9,711 1,580 741 70 79 0 846 10,650 2,377
Hispanic 278 53 7 0 0 0 0 218 237 41Non Hispanic 2,602 1,808 599 67 17 17 0 94 2,337 265Unknown 98 17 6 1 0 0 0 74 96 2
1,204 761 267 27 4 11 0 134 1,054 1501,112 643 232 29 6 3 0 199 1,004 108
533 388 84 11 6 2 0 42 491 42129 86 29 1 1 1 0 11 121 8
2,978 1,878 612 68 17 17 0 386 2,670 308Hispanic 15,583 12,328 593 13 18 0 0 2,631 13,447 2,136Non Hispanic 104,832 75,021 23,174 3,962 979 1,125 0 571 91,993 12,839Unknown 11 4 0 2 0 0 0 5 10 1
956 692 212 25 14 10 0 3 811 14524,899 18,386 5,176 772 236 212 0 117 21,696 3,20348,992 36,600 9,448 1,710 389 411 0 434 42,341 6,65124,088 18,019 4,104 810 197 226 0 732 21,420 2,66811,732 8,156 2,271 371 85 163 0 686 10,545 1,187
6,839 3,923 1,698 219 57 80 0 862 6,030 8092,325 1,236 678 63 15 18 0 315 2,051 274
595 341 180 7 4 5 0 58 556 39120,426 87,353 23,767 3,977 997 1,125 0 3,207 105,450 14,976
16,721 12,736 625 16 21 0 0 3,323 14,386 2,335118,853 85,675 25,204 4,726 1,062 1,221 0 965 103,839 15,014
857 531 130 44 1 0 0 151 545 312136,431 98,942 25,959 4,786 1,084 1,221 0 4,439 118,770 17,661
UnknownTOTAL
HispanicNon Hispanic
Total Warrant Officer
E-2E-3E-4E-5E-6
Army
Enlisted
Commissioned Officer
Warrant Officer
O-2O-3
O-10Total Officer
W-2W-3W-4W-5
O-4O-5O-6O-7O-8O-9
E-7E-8E-9Total Enlisted

84
Table 4-3b: Navy Active Duty Promotion DemographicsTotal White Black Asian AMI/ALN PI Multi Unknown Male Female
Hispanic 628 436 27 10 11 4 20 120 489 139Non Hispanic 7,931 6,406 703 368 69 40 214 131 6,553 1,378Unknown 463 354 21 3 3 0 9 73 327 136
3,083 2,454 255 135 36 14 99 90 2,455 6283,051 2,424 242 135 34 28 57 131 2,463 5881,547 1,173 157 65 6 2 81 63 1,265 282
791 664 64 31 5 0 2 25 701 90479 417 28 13 2 0 4 15 422 57
31 28 1 2 0 0 0 0 27 424 22 2 0 0 0 0 0 22 213 12 1 0 0 0 0 0 11 2
3 2 1 0 0 0 0 0 3 09,022 7,196 751 381 83 44 243 324 7,369 1,653
Hispanic 24 16 2 0 3 0 0 3 24 0Non Hispanic 242 159 62 7 3 2 4 5 234 8Unknown 2 0 1 0 0 0 0 1 2 0
161 107 40 4 5 1 3 1 159 280 49 20 2 1 0 1 7 76 427 19 5 1 0 1 0 1 25 2
268 175 65 7 6 2 4 9 260 8Hispanic 15,032 7,917 2,021 467 1,166 283 2,481 697 11,903 3,129Non Hispanic 52,789 29,332 10,201 3,064 2,550 672 6,588 382 43,337 9,452Unknown 8,237 4,586 1,485 246 562 103 1,204 51 6,686 1,551
4,827 2,450 1,041 198 233 51 777 77 3,611 1,21614,382 7,322 2,679 549 778 185 2,781 88 11,098 3,28429,277 15,380 5,158 1,320 1,778 468 4,964 209 23,295 5,98215,056 8,667 2,592 871 1,021 252 1,432 221 12,745 2,311
7,335 4,610 1,258 501 345 71 222 328 6,505 8303,474 2,178 708 232 98 25 69 164 3,069 4051,315 932 217 81 24 5 22 34 1,233 82
392 296 54 25 1 1 6 9 370 2276,058 41,835 13,707 3,777 4,278 1,058 10,273 1,130 61,926 14,13215,684 8,369 2,050 477 1,180 287 2,501 820 12,416 3,26860,962 35,897 10,966 3,439 2,622 714 6,806 518 50,124 10,838
8,702 4,940 1,507 249 565 103 1,213 125 7,015 1,68785,348 49,206 14,523 4,165 4,367 1,104 10,520 1,463 69,555 15,793
W-5Total Warrant Officer
E-2E-3
Total EnlistedHispanicNon HispanicUnknownTOTAL
O-7O-8O-9O-10Total Officer
Navy
Enlisted
Commissioned Officer
Warrant Officer
O-2O-3O-4O-5
E-4E-5E-6E-7E-8E-9
W-3W-4
O-6

85
Table 4-3c: Marine Corps Active Duty Promotion DemographicsTotal White Black Asian AMI/ALN PI Multi Unknown Male Female
Hispanic 243 158 5 2 3 0 3 72 217 26Non Hispanic 3,587 2,790 130 113 24 18 59 453 3,350 237
1,620 1,156 42 50 11 10 20 331 1,501 1191,335 1,074 48 37 11 6 28 131 1,236 99
507 407 24 20 3 2 8 43 475 32259 213 16 6 2 0 6 16 247 12
92 84 4 1 0 0 0 3 91 18 5 1 1 0 0 0 1 8 06 6 0 0 0 0 0 0 6 03 3 0 0 0 0 0 0 3 0
3,830 2,948 135 115 27 18 62 525 3,567 263Hispanic 70 41 0 0 1 0 0 28 64 6Non Hispanic 474 359 58 18 4 6 5 24 458 16
245 174 26 16 2 3 2 22 236 9205 155 21 1 1 3 2 22 198 7
74 56 9 1 2 0 1 5 68 620 15 2 0 0 0 0 3 20 0
544 400 58 18 5 6 5 52 522 22Hispanic 8,785 7,280 236 27 88 35 55 1,064 7,847 938Non Hispanic 47,536 38,444 5,412 1,300 511 556 593 720 44,164 3,372
4,692 3,918 488 96 56 36 66 32 4,435 25723,881 20,023 2,192 567 246 241 294 318 22,041 1,84017,000 13,854 1,639 419 196 199 172 521 15,533 1,467
6,075 4,745 647 147 53 79 65 339 5,639 4362,233 1,586 277 47 23 17 28 255 2,072 1611,369 887 225 30 18 10 15 184 1,273 96
766 513 116 19 5 6 5 102 730 36305 198 64 2 2 3 3 33 288 17
56,321 45,724 5,648 1,327 599 591 648 1,784 52,011 4,3109,098 7,479 241 29 92 35 58 1,164 8,128 970
51,597 41,593 5,600 1,431 539 580 657 1,197 47,972 3,62560,695 49,072 5,841 1,460 631 615 715 2,361 56,100 4,595
Total Warrant Officer
E-2E-3E-4E-5E-6
Marine Corps
Enlisted
Commissioned Officer
Warrant Officer
O-2
O-9Total Officer
W-2W-3W-4W-5
O-3
HispanicNon HispanicTOTAL
O-4O-5O-6O-7O-8
E-7E-8E-9Total Enlisted

86
Table 4-3d: Air Force Active Duty Promotion DemographicsTotal White Black Asian AMI/ALN PI Multi Unknown Male Female
Hispanic 404 211 17 1 6 1 8 160 306 98Non Hispanic 11,998 9,849 747 520 67 59 199 557 9,581 2,417Unknown 48 30 7 5 0 0 2 4 38 10
3,474 2,698 223 207 34 19 89 204 2,619 8553,269 2,676 170 150 18 18 60 177 2,513 7563,155 2,548 214 101 10 17 36 229 2,620 5351,749 1,453 117 54 9 3 16 97 1,458 291
712 635 37 14 2 2 8 14 628 8436 30 5 0 0 1 0 0 34 236 34 2 0 0 0 0 0 36 016 14 2 0 0 0 0 0 15 1
3 2 1 0 0 0 0 0 2 112,450 10,090 771 526 73 60 209 721 9,925 2,525
Hispanic 2,632 1,298 106 9 62 12 39 1,106 2,033 599Non Hispanic 63,880 47,173 10,044 1,819 422 856 2,198 1,368 52,111 11,769Unknown 54 36 6 0 0 0 5 7 42 12
828 662 101 12 4 4 31 14 692 13611,484 8,433 1,781 265 95 118 529 263 9,591 1,89323,522 17,636 3,447 731 165 334 901 308 19,149 4,37312,476 9,164 1,814 371 99 227 426 375 10,025 2,451
9,231 6,145 1,617 270 62 120 221 796 7,384 1,8476,660 4,681 1,034 135 48 57 110 595 5,370 1,2901,834 1,392 271 34 10 6 17 104 1,505 329
531 394 91 10 1 2 7 26 470 6166,566 48,507 10,156 1,828 484 868 2,242 2,481 54,186 12,380
3,036 1,509 123 10 68 13 47 1,266 2,339 69775,878 57,022 10,791 2,339 489 915 2,397 1,925 61,692 14,186
102 66 13 5 0 0 7 11 80 2279,016 58,597 10,927 2,354 557 928 2,451 3,202 64,111 14,905
E-4E-5E-6E-7E-8E-9Total EnlistedHispanicNon HispanicUnknownTOTAL
Air ForceEnlisted
Commissioned OfficerO-2O-3O-4O-5O-6O-7O-8O-9O-10Total Officer
E-2E-3

87
Table 4-4a: Army Selected Reserve Promotion DemographicsTotal White Black Asian AMI/ALN PI Multi Unknown Male Female
Hispanic 306 183 7 3 1 0 0 112 247 59Non Hispanic 5,987 5,094 512 208 15 0 0 158 5,154 833Unknown 0 0 0 0 0 0 0 0 0 0
0 0 0 0 0 0 0 0 0 02,566 2,070 251 100 6 0 0 139 2,176 3901,892 1,580 155 68 5 0 0 84 1,604 288
965 850 54 26 4 0 0 31 837 128526 465 39 11 0 0 0 11 474 52289 261 17 6 1 0 0 4 264 25
38 34 3 0 0 0 0 1 32 615 15 0 0 0 0 0 0 12 3
1 1 0 0 0 0 0 0 1 01 1 0 0 0 0 0 0 1 00 0 0 0 0 0 0 0 0 0
6,293 5,277 519 211 16 0 0 270 5,401 892Hispanic 60 34 1 0 0 0 0 25 48 12Non Hispanic 1,354 1,215 83 23 10 0 0 23 1,199 155Unknown 0 0 0 0 0 0 0 0 0 0
0 0 0 0 0 0 0 0 0 0783 671 57 16 5 0 0 34 696 87350 314 16 7 2 0 0 11 292 58194 181 9 0 2 0 0 2 176 18
87 83 2 0 1 0 0 1 83 40 0 0 0 0 0 0 0 0 0
1,414 1,249 84 23 10 0 0 48 1,247 167Hispanic 6,419 5,417 285 15 6 0 0 696 5,269 1,150Non Hispanic 62,756 50,137 9,475 1,960 508 0 0 676 53,044 9,712Unknown 1 0 0 1 0 0 0 0 0 0
0 0 0 0 0 0 0 0 0 03,790 2,911 670 129 44 0 0 36 3,151 639
14,434 11,428 2,297 408 149 0 0 152 11,873 2,56022,565 18,157 3,298 677 154 0 0 279 18,896 3,66915,048 12,233 1,873 465 96 0 0 381 12,649 2,399
8,049 6,497 986 209 40 0 0 317 6,984 1,0653,670 2,984 467 64 16 0 0 139 3,281 3891,341 1,118 136 21 13 0 0 53 1,231 110
279 226 33 3 2 0 0 15 248 310 0 0 0 0 0 0 0 0 0
69,176 55,554 9,760 1,976 514 0 0 1,372 58,313 10,8626,785 5,634 293 18 7 0 0 833 5,564 1,221
70,097 56,446 10,070 2,191 533 0 0 857 59,397 10,7001 0 0 1 0 0 0 0 0 0
76,883 62,080 10,363 2,210 540 0 0 1,690 64,961 11,921
ARNG
Enlisted
Commissioned Officer
Warrant Officer
HispanicNon HispanicUnknown
O-1O-2O-3O-4O-5O-6O-7O-8O-9O-10Officer UnknownTotal Officer
W-1W-2W-3W-4W-5Warrant Officer UnknownTotal Warrant Officer
E-1E-2E-3E-4E-5E-6E-7E-8E-9Enlisted UnknownTotal Enlisted
Total

88
Table 4-4a (continued): Army Selected Reserve Promotion DemographicsTotal White Black Asian AMI/ALN PI Multi Unknown Male Female
Hispanic 4,093 3,337 143 2 10 0 0 601 3,071 1,022Non Hispanic 22,521 15,134 5,743 1,140 131 247 0 126 17,372 5,149Unknown 19 14 5 0 0 0 0 0 17 2Hispanic 383 220 11 3 1 0 0 148 300 83Non Hispanic 4,555 3,224 859 282 24 34 0 132 3,480 1,075Unknown 13 5 4 0 0 0 0 4 7 6Hispanic 43 22 2 0 0 0 0 19 33 10Non Hispanic 422 322 82 10 2 3 0 3 356 66Unknown 0 0 0 0 0 0 0 0 0 0
4,519 3,579 156 5 11 0 0 768 3,404 1,11527,498 18,680 6,684 1,432 157 284 0 261 21,208 6,290
32 19 9 0 0 0 0 4 24 80 0 0 0 0 0 0 0 0 0
1,508 930 326 121 7 7 0 117 1,078 4301,309 897 229 78 7 13 0 85 997 312
713 520 117 35 5 6 0 30 556 1571,040 770 174 42 5 7 0 42 850 190
359 313 26 8 1 1 0 10 291 6811 9 1 1 0 0 0 0 7 411 10 1 0 0 0 0 0 8 3
0 0 0 0 0 0 0 0 0 00 0 0 0 0 0 0 0 0 00 0 0 0 0 0 0 0 0 0
4,951 3,449 874 285 25 34 0 284 3,787 1,1640 0 0 0 0 0 0 0 0 0
256 184 51 6 1 2 0 12 210 4694 70 17 0 0 0 0 7 80 1498 76 13 4 1 1 0 3 84 1417 14 3 0 0 0 0 0 15 2
0 0 0 0 0 0 0 0 0 0465 344 84 10 2 3 0 22 389 76
0 0 0 0 0 0 0 0 0 01,277 893 301 59 13 8 0 3 1,006 2716,611 4,662 1,511 292 26 57 0 63 5,156 1,4558,733 6,214 1,853 400 43 101 0 122 6,533 2,2003,753 2,773 648 175 24 24 0 109 2,880 8732,720 1,843 579 106 19 29 0 144 2,135 5852,439 1,457 669 81 12 23 0 197 1,885 554
907 518 278 25 2 5 0 79 701 206193 125 52 4 2 0 0 10 164 29
0 0 0 0 0 0 0 0 0 026,633 18,485 5,891 1,142 141 247 0 727 20,460 6,17332,049 22,278 6,849 1,437 168 284 0 1,033 24,636 7,413
Enlisted UnknownTotal EnlistedTotal
E-2E-3E-4E-5E-6E-7E-8E-9
Total OfficerW-1W-2W-3W-4W-5Warrant Officer UnknownTotal Warrant OfficerE-1
USAR
Enlisted
Commissioned Officer
Warrant OfficerHispanicNon HispanicUnknownO-1O-2O-3O-4O-5O-6O-7O-8O-9O-10Officer Unknown

89
Table 4-4b: Navy Selected Reserve Promotion DemographicsTotal White Black Asian AMI/ALN PI Multi Unknown Male Female
Hispanic 143 100 5 0 1 1 2 34 102 41Non Hispanic 1,530 1,207 141 90 11 9 49 23 1,213 317Unknown 166 88 18 2 0 0 0 58 130 36
0 0 0 0 0 0 0 0 0 0444 322 58 29 4 6 16 9 310 134485 364 52 20 6 3 20 20 373 112446 338 32 23 1 0 7 45 362 84326 248 21 17 1 1 8 30 283 43135 121 0 3 0 0 0 11 114 21
2 1 1 0 0 0 0 0 2 01 1 0 0 0 0 0 0 1 00 0 0 0 0 0 0 0 0 00 0 0 0 0 0 0 0 0 00 0 0 0 0 0 0 0 0 0
1,839 1,395 164 92 12 10 51 115 1,445 394Hispanic 0 0 0 0 0 0 0 0 0 0Non Hispanic 7 5 2 0 0 0 0 0 7 0Unknown 0 0 0 0 0 0 0 0 0 0
0 0 0 0 0 0 0 0 0 00 0 0 0 0 0 0 0 0 05 3 2 0 0 0 0 0 5 02 2 0 0 0 0 0 0 2 00 0 0 0 0 0 0 0 0 00 0 0 0 0 0 0 0 0 07 5 2 0 0 0 0 0 7 0
Hispanic 1,766 978 219 49 122 33 220 145 1,336 430Non Hispanic 6,601 3,692 1,471 417 274 55 611 81 5,125 1,476Unknown 1,590 863 332 64 71 13 190 57 1,219 371
0 0 0 0 0 0 0 0 0 0567 283 146 28 26 7 72 5 449 118
1,538 716 318 71 79 16 323 15 1,203 3352,458 1,204 550 129 149 35 375 16 1,875 5832,302 1,288 490 154 118 28 166 58 1,737 5651,862 1,163 338 102 76 14 64 105 1,453 409
901 619 145 37 15 0 19 66 683 218250 191 31 6 4 1 2 15 209 41
79 69 4 3 0 0 0 3 71 80 0 0 0 0 0 0 0 0 0
9,957 5,533 2,022 530 467 101 1,021 283 7,680 2,2771,909 1,078 224 49 123 34 222 179 1,438 4718,138 4,904 1,614 507 285 64 660 104 6,345 1,7931,756 951 350 66 71 13 190 115 1,349 407
11,803 6,933 2,188 622 479 111 1,072 398 9,132 2,671
USNR
Enlisted
Commissioned Officer
Warrant Officer
HispanicNon HispanicUnknown
O-1O-2O-3O-4O-5O-6O-7O-8O-9O-10Officer UnknownTotal Officer
W-1W-2W-3W-4W-5Warrant Officer UnknownTotal Warrant Officer
E-1E-2E-3E-4E-5E-6E-7E-8E-9Enlisted UnknownTotal Enlisted
Total
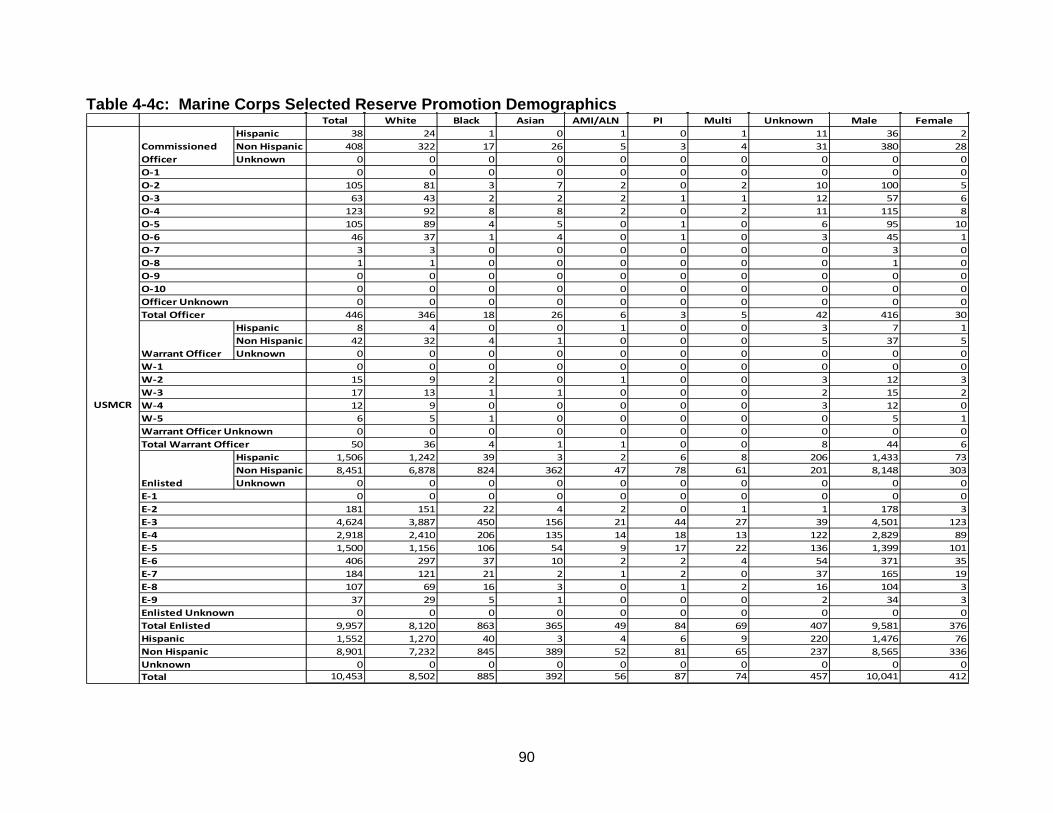
90
Table 4-4c: Marine Corps Selected Reserve Promotion DemographicsTotal White Black Asian AMI/ALN PI Multi Unknown Male Female
Hispanic 38 24 1 0 1 0 1 11 36 2Non Hispanic 408 322 17 26 5 3 4 31 380 28Unknown 0 0 0 0 0 0 0 0 0 0
0 0 0 0 0 0 0 0 0 0105 81 3 7 2 0 2 10 100 5
63 43 2 2 2 1 1 12 57 6123 92 8 8 2 0 2 11 115 8105 89 4 5 0 1 0 6 95 10
46 37 1 4 0 1 0 3 45 13 3 0 0 0 0 0 0 3 01 1 0 0 0 0 0 0 1 00 0 0 0 0 0 0 0 0 00 0 0 0 0 0 0 0 0 00 0 0 0 0 0 0 0 0 0
446 346 18 26 6 3 5 42 416 30Hispanic 8 4 0 0 1 0 0 3 7 1Non Hispanic 42 32 4 1 0 0 0 5 37 5Unknown 0 0 0 0 0 0 0 0 0 0
0 0 0 0 0 0 0 0 0 015 9 2 0 1 0 0 3 12 317 13 1 1 0 0 0 2 15 212 9 0 0 0 0 0 3 12 0
6 5 1 0 0 0 0 0 5 10 0 0 0 0 0 0 0 0 0
50 36 4 1 1 0 0 8 44 6Hispanic 1,506 1,242 39 3 2 6 8 206 1,433 73Non Hispanic 8,451 6,878 824 362 47 78 61 201 8,148 303Unknown 0 0 0 0 0 0 0 0 0 0
0 0 0 0 0 0 0 0 0 0181 151 22 4 2 0 1 1 178 3
4,624 3,887 450 156 21 44 27 39 4,501 1232,918 2,410 206 135 14 18 13 122 2,829 891,500 1,156 106 54 9 17 22 136 1,399 101
406 297 37 10 2 2 4 54 371 35184 121 21 2 1 2 0 37 165 19107 69 16 3 0 1 2 16 104 3
37 29 5 1 0 0 0 2 34 30 0 0 0 0 0 0 0 0 0
9,957 8,120 863 365 49 84 69 407 9,581 3761,552 1,270 40 3 4 6 9 220 1,476 768,901 7,232 845 389 52 81 65 237 8,565 336
0 0 0 0 0 0 0 0 0 010,453 8,502 885 392 56 87 74 457 10,041 412
Total Enlisted
Total
E-3E-4E-5E-6E-7E-8E-9Enlisted Unknown
W-1W-2W-3W-4W-5Warrant Officer UnknownTotal Warrant Officer
E-1E-2
USMCR
Enlisted
Commissioned Officer
Warrant Officer
HispanicNon HispanicUnknown
O-1O-2O-3O-4O-5O-6O-7O-8O-9O-10Officer UnknownTotal Officer

91
Table 4-4d: Air Force Selected Reserve Promotion DemographicsTotal White Black Asian AMI/ALN PI Multi Unknown Male Female
Hispanic 109 75 3 0 0 0 2 29 86 23Non Hispanic 2,248 1,979 108 61 19 15 21 45 1,808 440Unknown 0 0 0 0 0 0 0 0 0 0
0 0 0 0 0 0 0 0 0 0449 393 19 14 2 4 2 15 346 103490 415 30 13 5 3 6 18 379 111671 574 34 18 5 5 9 26 533 138563 503 23 12 5 2 5 13 474 89145 134 4 3 1 1 1 1 126 19
33 30 1 1 0 0 0 1 31 24 3 0 0 1 0 0 0 3 12 2 0 0 0 0 0 0 2 00 0 0 0 0 0 0 0 0 00 0 0 0 0 0 0 0 0 0
2,357 2,054 111 61 19 15 23 74 1,894 463Hispanic 0 0 0 0 0 0 0 0 0 0Non Hispanic 0 0 0 0 0 0 0 0 0 0Unknown 0 0 0 0 0 0 0 0 0 0
0 0 0 0 0 0 0 0 0 00 0 0 0 0 0 0 0 0 00 0 0 0 0 0 0 0 0 00 0 0 0 0 0 0 0 0 00 0 0 0 0 0 0 0 0 00 0 0 0 0 0 0 0 0 00 0 0 0 0 0 0 0 0 0
Hispanic 586 340 13 2 8 3 3 217 458 128Non Hispanic 12,279 10,427 960 288 69 139 195 201 9,841 2,438Unknown 1 1 0 0 0 0 0 0 1 0
0 0 0 0 0 0 0 0 0 091 65 19 3 1 1 2 0 59 32
323 259 43 4 4 6 6 1 213 1103,648 3,000 310 99 22 73 78 66 2,885 7632,019 1,645 179 59 9 25 34 68 1,520 4993,374 2,860 211 74 17 23 44 145 2,753 6212,360 2,022 145 35 20 10 27 101 1,983 377
746 656 46 10 3 2 6 23 625 121305 261 20 6 1 2 1 14 262 43
0 0 0 0 0 0 0 0 0 012,866 10,768 973 290 77 142 198 418 10,300 2,566
695 415 16 2 8 3 5 246 544 15114,527 12,406 1,068 349 88 154 216 246 11,649 2,878
1 1 0 0 0 0 0 0 1 015,223 12,822 1,084 351 96 157 221 492 12,194 3,029
ANG
Enlisted
Commissioned Officer
Warrant Officer
HispanicNon HispanicUnknown
O-1O-2O-3O-4O-5O-6O-7O-8O-9O-10Officer UnknownTotal Officer
W-1W-2W-3W-4W-5Warrant Officer UnknownTotal Warrant Officer
E-1E-2E-3E-4E-5E-6E-7E-8E-9Enlisted UnknownTotal Enlisted
Total

92
Table 4-4d (continued): Air Force Selected Reserve Promotion DemographicsTotal White Black Asian AMI/ALN PI Multi Unknown Male Female
Hispanic 89 54 1 0 1 0 1 32 51 38Non Hispanic 1,790 1,484 127 59 4 5 30 81 1,261 529Unknown 1 0 1 0 0 0 0 0 1 0
1 1 0 0 0 0 0 0 1 0185 143 18 7 0 0 3 14 113 72194 150 21 2 1 0 5 15 131 63657 506 59 24 1 4 14 49 438 219579 493 23 24 3 0 7 29 427 152239 221 8 1 0 1 2 6 180 59
17 17 0 0 0 0 0 0 15 28 7 0 1 0 0 0 0 8 00 0 0 0 0 0 0 0 0 00 0 0 0 0 0 0 0 0 00 0 0 0 0 0 0 0 0 0
1,880 1,538 129 59 5 5 31 113 1,313 567Hispanic 0 0 0 0 0 0 0 0 0 0Non Hispanic 0 0 0 0 0 0 0 0 0 0Unknown 0 0 0 0 0 0 0 0 0 0
0 0 0 0 0 0 0 0 0 00 0 0 0 0 0 0 0 0 00 0 0 0 0 0 0 0 0 00 0 0 0 0 0 0 0 0 00 0 0 0 0 0 0 0 0 00 0 0 0 0 0 0 0 0 00 0 0 0 0 0 0 0 0 0
Hispanic 564 353 21 2 4 5 11 168 410 154Non Hispanic 9,405 6,470 2,056 278 46 136 203 216 6,784 2,621Unknown 19 12 3 2 0 0 1 1 14 5
0 0 0 0 0 0 0 0 0 0557 345 163 21 1 9 18 0 390 167
1,258 798 367 31 5 20 31 6 869 3892,938 1,911 745 101 19 40 70 52 2,092 8461,057 713 211 32 5 15 21 60 717 3402,129 1,531 315 49 11 39 47 137 1,582 5471,375 1,014 194 35 4 14 18 96 1,043 332
499 381 71 10 3 3 7 24 370 129175 142 14 3 2 1 3 10 145 30
0 0 0 0 0 0 0 0 0 09,988 6,835 2,080 282 50 141 215 385 7,208 2,780
653 407 22 2 5 5 12 200 461 19211,195 7,954 2,183 337 50 141 233 297 8,045 3,150
20 12 4 2 0 0 1 1 15 511,868 8,373 2,209 341 55 146 246 498 8,521 3,347
Enlisted UnknownTotal Enlisted
Total
E-1E-2E-3E-4E-5E-6E-7E-8E-9
Officer UnknownTotal Officer
W-1W-2W-3W-4W-5Warrant Officer UnknownTotal Warrant Officer
USAFR
Enlisted
Commissioned Officer
Warrant Officer
HispanicNon HispanicUnknown
O-1O-2O-3O-4O-5O-6O-7O-8O-9O-10

93
Table 4-5a: Army Active Duty Reenlistment and Extension DemographicsTotal White Black Asian AMI/ALN PI Multi Unknown Male Female
Hispanic 13,072 8,949 478 17 17 0 0 3,611 11,019 2,053Non Hispanic 81,431 54,931 20,569 3,693 796 262 0 1,180 70,279 11,152Unknown 19 3 2 2 0 0 0 12 16 3
789 578 176 14 10 3 0 8 731 58769 578 155 22 6 2 0 6 683 86
2,213 1,651 435 83 18 6 0 20 1,892 32140,603 28,337 9,161 1,656 380 131 0 938 34,272 6,33127,074 18,493 5,780 1,100 221 53 0 1,427 23,404 3,67017,588 11,055 3,994 699 123 53 0 1,664 15,500 2,088
4,755 2,795 1,120 126 49 13 0 652 4,172 583561 305 171 11 4 1 0 69 499 62170 91 57 1 2 0 0 19 161 9
94,522 63,883 21,049 3,712 813 262 0 4,803 81,314 13,20813,072 8,949 478 17 17 0 0 3,611 11,019 2,05381,431 54,931 20,569 3,693 796 262 0 1,180 70,279 11,152
19 3 2 2 0 0 0 12 16 394,522 63,883 21,049 3,712 813 262 0 4,803 81,314 13,208
Total Enlisted
Army
EnlistedE-1E-2E-3E-4E-5E-6E-7E-8E-9
HispanicNon HispanicUnknownTOTAL
Table 4-5a: Navy Active Duty Reenlistment and Extension DemographicsTotal White Black Asian AMI/ALN PI Multi Unknown Male Female
Hispanic 10,830 6,333 1,278 397 679 185 907 1,051 8,929 1,901Non Hispanic 44,101 25,533 10,476 3,522 1,723 525 1,826 496 38,144 5,957Unknown 6,298 3,742 1,189 187 420 94 579 87 5,260 1,038
17 12 4 0 0 1 0 0 17 081 36 27 2 7 2 7 0 70 11
4,072 2,013 1,093 213 243 75 392 43 3,238 83416,428 8,938 3,472 900 1,067 341 1,534 176 13,557 2,87117,849 10,291 3,606 1,187 995 239 971 560 15,111 2,73812,943 7,848 2,817 1,018 365 91 243 561 11,288 1,655
6,621 4,233 1,352 545 113 43 119 216 6,039 5822,279 1,536 436 192 27 8 33 47 2,129 150
939 701 136 49 5 4 13 31 884 5561,229 35,608 12,943 4,106 2,822 804 3,312 1,634 52,333 8,89610,830 6,333 1,278 397 679 185 907 1,051 8,929 1,90144,101 25,533 10,476 3,522 1,723 525 1,826 496 38,144 5,957
6,298 3,742 1,189 187 420 94 579 87 5,260 1,03861,229 35,608 12,943 4,106 2,822 804 3,312 1,634 52,333 8,896
E-5Navy
EnlistedE-1E-2E-3E-4
Total Enlisted
E-6E-7E-8E-9
HispanicNon HispanicUnknownTOTAL

94
Table 4-5c: Marine Corps Active Duty Reenlistment and Extension DemographicsTotal White Black Asian AMI/ALN PI Multi Unknown Male Female
Commissioned Non Hispanic 2 2 0 0 0 0 0 0 2 02 2 0 0 0 0 0 0 2 02 2 0 0 0 0 0 0 2 0
Hispanic 5,328 3,381 118 20 53 25 29 1,702 4,867 461Non Hispanic 24,017 17,576 4,019 668 293 303 312 846 22,597 1,420
4 2 1 1 0 0 0 0 3 133 26 3 1 2 0 0 1 28 5
1,395 1,146 141 32 10 13 12 41 1,309 867,764 6,008 970 192 93 105 67 329 7,215 5498,428 6,166 974 183 105 99 115 786 7,851 5776,322 4,210 994 148 75 60 85 750 5,949 3733,334 2,153 577 85 38 27 36 418 3,136 1981,454 879 316 37 18 14 17 173 1,385 69
611 367 161 9 5 10 9 50 588 2329,345 20,957 4,137 688 346 328 341 2,548 27,464 1,881
5,328 3,381 118 20 53 25 29 1,702 4,867 46124,019 17,578 4,019 668 293 303 312 846 22,599 1,42029,347 20,959 4,137 688 346 328 341 2,548 27,466 1,881TOTAL
HispanicNon Hispanic
Marine Corps
Enlisted
O-4Total Officer
E-1E-2
E-8
E-3E-4E-5E-6E-7
E-9Total Enlisted
Table 4-5d: Air Force Active Duty Reenlistment and Extension DemographicsTotal White Black Asian AMI/ALN PI Multi Unknown Male Female
Hispanic 3,947 1,697 150 13 114 18 50 1,905 3,076 871Non Hispanic 73,021 51,512 13,589 2,003 447 925 2,358 2,187 59,236 13,785Unknown 41 21 4 0 1 0 6 9 31 10
14,019 10,128 2,423 302 109 138 677 242 11,712 2,3072,317 1,725 342 80 14 16 102 38 1,863 4544,805 3,381 809 216 25 57 228 89 3,758 1,0479,934 6,832 1,828 321 94 199 350 310 7,831 2,103
21,285 14,213 3,939 625 167 319 669 1,353 17,006 4,27914,972 9,926 2,785 307 109 159 273 1,413 12,064 2,908
6,979 5,066 1,095 126 38 41 90 523 5,736 1,2431,713 1,229 335 21 5 9 17 97 1,489 224
772 564 149 15 0 5 3 36 693 79213 166 38 3 1 0 5 0 191 22
77,009 53,230 13,743 2,016 562 943 2,414 4,101 62,343 14,6663,947 1,697 150 13 114 18 50 1,905 3,076 871
73,021 51,512 13,589 2,003 447 925 2,358 2,187 59,236 13,78541 21 4 0 1 0 6 9 31 10
77,009 53,230 13,743 2,016 562 943 2,414 4,101 62,343 14,666
Air Force
EnlistedE-1E-2E-3
TOTAL
E-4E-5E-6E-7E-8E-9Enlisted UnknownTotal EnlistedHispanicNon HispanicUnknown

95
Table 4-6a: Army Selected Reserve Reenlistment DemographicsTotal White Black Asian AMI/ALN PI Multi Unknown Male Female
13 12 1 0 0 0 0 0 12 11 1 0 0 0 0 0 0 0 1
10 8 1 1 0 0 0 0 8 232 25 5 0 1 0 0 1 28 424 21 0 2 0 0 0 1 24 025 20 2 1 1 0 0 1 24 117 16 1 0 0 0 0 0 14 3
0 0 0 0 0 0 0 0 0 01 1 0 0 0 0 0 0 1 00 0 0 0 0 0 0 0 0 0
123 104 10 4 2 0 0 3 111 1210 9 0 0 0 0 0 1 8 2
113 95 10 4 2 0 0 2 103 100 0 0 0 0 0 0 0 0 0
123 104 10 4 2 0 0 3 111 12Total White Black Asian AMI/ALN PI Multi Unknown Male Female
1 0 0 0 0 0 0 1 1 05 4 1 0 0 0 0 0 5 0
44 27 11 3 0 3 0 0 36 82,027 1,395 407 103 18 48 0 56 1,580 4472,213 1,518 434 107 21 27 0 106 1,762 4511,584 1,062 330 67 8 17 0 100 1,271 313
477 298 115 17 6 6 0 35 379 9860 47 9 1 0 0 0 3 51 9
9 6 1 0 0 0 0 2 8 10 0 0 0 0 0 0 0 0 0
6,420 4,357 1,308 298 53 101 0 303 5,093 1,327981 700 26 0 5 0 0 250 771 210
5,437 3,656 1,281 298 48 101 0 53 4,320 1,1172 1 1 0 0 0 0 0 2 0
6,420 4,357 1,308 298 53 101 0 303 5,093 1,327
Enlisted UnknownTotal Enlisted
Total
E-1E-2E-3E-4
USAR
HispanicNon HispanicUnknown
E-5E-6E-7E-8E-9
E-1
ARNG
HispanicNon HispanicUnknown
E-2E-3E-4E-5E-6E-7E-8E-9Enlisted UnknownTotal Enlisted
Total

96
Table 4-6b: Navy Selected Reserve Reenlistment DemographicsTotal White Black Asian AMI/ALN PI Multi Unknown Male Female
0 0 0 0 0 0 0 0 0 00 0 0 0 0 0 0 0 0 01 0 1 0 0 0 0 0 1 00 0 0 0 0 0 0 0 0 02 2 0 0 0 0 0 0 2 03 1 2 0 0 0 0 0 1 23 1 1 0 0 0 0 1 3 01 0 1 0 0 0 0 0 0 10 0 0 0 0 0 0 0 0 00 0 0 0 0 0 0 0 0 00 0 0 0 0 0 0 0 0 0
10 4 5 0 0 0 0 1 7 30 0 0 0 0 0 0 0 0 08 4 4 0 0 0 0 0 5 32 0 1 0 0 0 0 1 2 0
10 4 5 0 0 0 0 1 7 3
E-1E-2E-3E-4
USNR
HispanicNon HispanicUnknown
E-5E-6E-7E-8E-9E-10Enlisted UnknownTotal Enlisted
Total
Table 4-6c: Marine Corps Selected Reserve Reenlistment Demographics
Total White Black Asian AMI/ALN PI Multi Unknown Male Female0 0 0 0 0 0 0 0 0 00 0 0 0 0 0 0 0 0 02 2 0 0 0 0 0 0 2 0
109 87 8 4 1 1 1 7 103 61,109 826 96 42 6 8 11 120 1,025 84
542 373 60 20 1 2 7 79 501 41259 157 28 7 2 1 0 64 248 11
97 68 12 1 2 2 0 12 92 546 28 10 1 0 0 0 7 44 2
0 0 0 0 0 0 0 0 0 00 0 0 0 0 0 0 0 0 0
2,164 1,541 214 75 12 14 19 289 2,015 149432 229 7 2 3 1 1 189 392 40
1,732 1,312 207 73 9 13 18 100 1,623 1090 0 0 0 0 0 0 0 0 0
2,164 1,541 214 75 12 14 19 289 2,015 149
E-1
USMCR
HispanicNon HispanicUnknown
E-2E-3E-4E-5E-6E-7E-8E-9E-10Enlisted UnknownTotal Enlisted
Total

97
Table 4-6d: Air Force Selected Reserve Reenlistment DemographicsTotal White Black Asian AMI/ALN PI Multi Unknown Male Female
6 5 0 0 1 0 0 0 5 12 1 1 0 0 0 0 0 2 0
60 40 13 0 1 1 4 1 39 21630 450 69 51 4 11 17 28 503 127
3,842 3,083 332 129 22 61 76 139 3,101 7413,665 2,989 312 97 30 20 49 168 2,954 7112,629 2,219 184 63 28 12 24 99 2,137 492
796 699 38 17 6 3 4 29 688 108287 251 17 5 3 3 2 6 252 35
1 1 0 0 0 0 0 0 1 011,918 9,738 966 362 95 111 176 470 9,682 2,236
759 486 11 1 16 4 10 231 604 15511,156 9,250 955 361 79 107 166 238 9,075 2,081
3 2 0 0 0 0 0 1 3 011,918 9,738 966 362 95 111 176 470 9,682 2,236
Total White Black Asian AMI/ALN PI Multi Unknown Male Female30 21 5 0 0 1 2 1 25 518 9 7 0 0 0 0 2 11 7
111 64 35 6 0 1 4 1 77 341,031 676 211 32 8 16 34 54 733 2982,419 1,668 390 75 22 25 65 174 1,746 6732,415 1,667 425 62 16 31 36 178 1,829 5861,437 1,014 269 26 10 11 11 96 1,085 352
500 395 68 5 3 3 3 23 380 120149 113 24 4 1 1 2 4 123 26
0 0 0 0 0 0 0 0 0 08,110 5,627 1,434 210 60 89 157 533 6,009 2,101
703 398 21 1 14 2 8 259 524 1797,399 5,224 1,411 209 46 87 149 273 5,480 1,919
8 5 2 0 0 0 0 1 5 38,110 5,627 1,434 210 60 89 157 533 6,009 2,101
E-1
Enlisted UnknownTotal Enlisted
Total
USAFR
HispanicNon HispanicUnknown
E-2E-3E-4E-5E-6E-7E-8E-9Enlisted UnknownTotal Enlisted
Total
E-1E-2E-3E-4
ANG
HispanicNon HispanicUnknown
E-5E-6E-7E-8E-9

98
Table 4-6e: Army Selected Reserve Extension Demographics Total White Black Asian AMI/ALN PI Multi Unknown Male Female
37 25 9 1 0 0 0 2 29 8199 158 33 6 1 0 0 1 162 37
1,026 779 170 43 12 0 0 22 812 21418,519 14,347 2,469 604 197 0 0 902 15,539 2,98021,466 17,105 2,832 567 175 0 0 787 18,547 2,91814,243 11,519 1,761 291 77 0 0 595 12,654 1,589
5,842 4,688 745 107 44 0 0 258 5,300 5421,538 1,276 163 25 11 0 0 63 1,397 141
335 287 27 6 2 0 0 13 303 320 0 0 0 0 0 0 0 0 0
63,205 50,184 8,209 1,650 519 0 0 2,643 54,743 8,4615,590 3,871 157 16 5 0 0 1,541 4,754 836
57,614 46,313 8,052 1,634 514 0 0 1,101 49,989 7,6251 0 0 0 0 0 0 1 0 0
63,205 50,184 8,209 1,650 519 0 0 2,643 54,743 8,461Total White Black Asian AMI/ALN PI Multi Unknown Male Female
6 5 1 0 0 0 0 0 6 010 8 1 0 1 0 0 0 5 570 48 18 1 1 1 0 1 62 8
1,146 737 269 57 15 22 0 46 921 2251,519 961 341 80 11 19 0 107 1,192 3271,003 617 233 55 6 18 0 74 766 237
239 136 72 6 1 1 0 23 180 5927 20 5 1 0 0 0 1 22 5
0 0 0 0 0 0 0 0 0 00 0 0 0 0 0 0 0 0 0
4,020 2,532 940 200 35 61 0 252 3,154 866690 467 17 1 2 0 0 203 549 141
3,329 2,065 922 199 33 61 0 49 2,604 7251 0 1 0 0 0 0 0 1 0
4,020 2,532 940 200 35 61 0 252 3,154 866
Enlisted UnknownTotal Enlisted
Total
E-1E-2E-3E-4
USAR
HispanicNon HispanicUnknown
E-5E-6E-7E-8E-9
E-1
ARNG
HispanicNon HispanicUnknown
E-2E-3E-4E-5E-6E-7E-8E-9Enlisted UnknownTotal Enlisted
Total
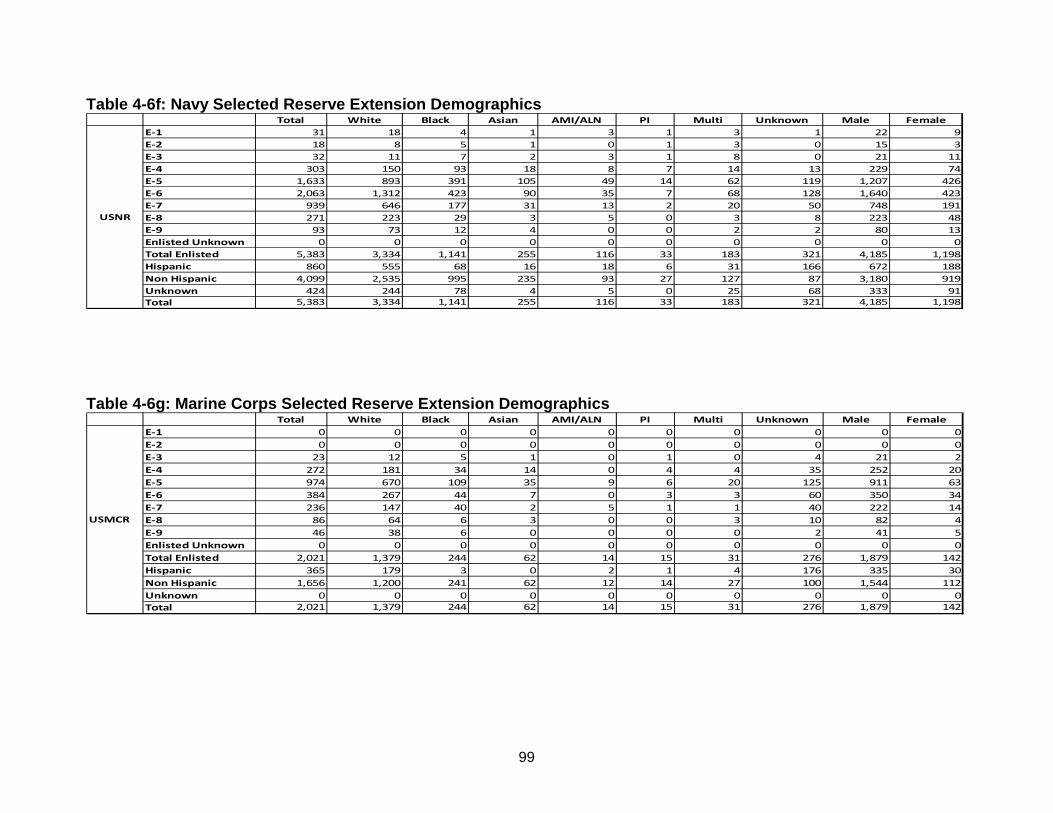
99
Table 4-6f: Navy Selected Reserve Extension Demographics Total White Black Asian AMI/ALN PI Multi Unknown Male Female
31 18 4 1 3 1 3 1 22 918 8 5 1 0 1 3 0 15 332 11 7 2 3 1 8 0 21 11
303 150 93 18 8 7 14 13 229 741,633 893 391 105 49 14 62 119 1,207 4262,063 1,312 423 90 35 7 68 128 1,640 423
939 646 177 31 13 2 20 50 748 191271 223 29 3 5 0 3 8 223 48
93 73 12 4 0 0 2 2 80 130 0 0 0 0 0 0 0 0 0
5,383 3,334 1,141 255 116 33 183 321 4,185 1,198860 555 68 16 18 6 31 166 672 188
4,099 2,535 995 235 93 27 127 87 3,180 919424 244 78 4 5 0 25 68 333 91
5,383 3,334 1,141 255 116 33 183 321 4,185 1,198
Enlisted UnknownTotal Enlisted
Total
E-1E-2E-3E-4
USNR
HispanicNon HispanicUnknown
E-5E-6E-7E-8E-9
Table 4-6g: Marine Corps Selected Reserve Extension Demographics Total White Black Asian AMI/ALN PI Multi Unknown Male Female
0 0 0 0 0 0 0 0 0 00 0 0 0 0 0 0 0 0 0
23 12 5 1 0 1 0 4 21 2272 181 34 14 0 4 4 35 252 20974 670 109 35 9 6 20 125 911 63384 267 44 7 0 3 3 60 350 34236 147 40 2 5 1 1 40 222 14
86 64 6 3 0 0 3 10 82 446 38 6 0 0 0 0 2 41 5
0 0 0 0 0 0 0 0 0 02,021 1,379 244 62 14 15 31 276 1,879 142
365 179 3 0 2 1 4 176 335 301,656 1,200 241 62 12 14 27 100 1,544 112
0 0 0 0 0 0 0 0 0 02,021 1,379 244 62 14 15 31 276 1,879 142
E-1
USMCR
HispanicNon HispanicUnknown
E-2E-3E-4E-5E-6E-7E-8E-9Enlisted UnknownTotal Enlisted
Total

100
Table 4-6e: Air Force Selected Reserve Extension Demographics Total White Black Asian AMI/ALN PI Multi Unknown Male Female
3 2 1 0 0 0 0 0 2 11 1 0 0 0 0 0 0 1 0
33 28 2 0 2 0 0 1 27 6523 397 76 19 3 7 12 9 411 112
2,168 1,740 204 65 14 29 34 82 1,800 3682,431 1,914 241 72 25 22 24 133 1,939 4922,124 1,786 184 31 25 15 23 60 1,718 406
641 558 42 8 6 3 5 19 555 86281 240 18 9 3 2 2 7 239 42
0 0 0 0 0 0 0 0 0 08,205 6,666 768 204 78 78 100 311 6,692 1,513
519 334 13 1 10 0 5 156 428 917,684 6,330 755 203 68 78 95 155 6,262 1,422
2 2 0 0 0 0 0 0 2 08,205 6,666 768 204 78 78 100 311 6,692 1,513
Total White Black Asian AMI/ALN PI Multi Unknown Male Female21 12 8 1 0 0 0 0 15 637 18 16 0 0 0 1 2 26 11
103 66 29 1 1 0 2 4 69 34789 533 144 27 9 21 22 33 530 259
1,146 809 202 36 8 14 23 54 818 3281,335 903 253 41 8 9 21 100 1,040 295
920 655 161 17 3 12 6 66 700 220275 228 33 3 1 1 0 9 219 56
87 72 9 0 0 0 1 5 66 210 0 0 0 0 0 0 0 0 0
4,713 3,296 855 126 30 57 76 273 3,483 1,230404 249 13 4 3 1 7 127 284 120
4,297 3,041 839 121 27 56 69 144 3,191 1,10612 6 3 1 0 0 0 2 8 4
4,713 3,296 855 126 30 57 76 273 3,483 1,230
E-1E-2E-3E-4
ANG
HispanicNon HispanicUnknown
E-5E-6E-7E-8E-9
E-1
Enlisted UnknownTotal Enlisted
Total
USAFR
HispanicNon HispanicUnknown
E-2E-3E-4E-5E-6E-7E-8E-9Enlisted UnknownTotal Enlisted
Total

101
Chapter 5: Medical Manpower Requirements
This chapter displays military medical manpower by corps or designation for Active and Reserve Components along with civilian medical personnel working in medical treatment facilities for the previous, current, and future fiscal years. The FY 13 and FY14 data match what is in the Comptroller Information System (CIS). The reported civilian medical personnel are those funded via the Defense Health Program Appropriation and reported as work-years. These include doctors, dentists, nurses, health and administrative personnel required to support day to day activities in the medical treatment facilities. Mission
The primary mission of the Military Health System (MHS) is to enhance DoD and the Nation’s security by providing health support for the full range of military operations and sustaining the health of all those entrusted to its care. Key Medical Manpower Issues
The MHS provides medical care to more than 9.7 million DOD beneficiaries
located around the globe with a workforce of 182,511 active duty and civilian medical personnel and over 70,924 reserve medical personnel.
To meet the needs of operational Commanders, the Department must be able to deploy anywhere and anytime with flexibility, interoperability, and agility. Using MHS efforts, DOD will ensure that future medical support will be fully aligned with joint force health protection and will enable rapid response to the needs of a changing national security environment. Current military strategies mandate that the medical force structure be joint, agile, and interoperable to ensure optimal responsiveness in diverse operations.
MHS responds rapidly and effectively to disasters, public health emergencies, and mass casualty events involving military personnel, DOD employees, and DOD beneficiaries. When requested, DOD provides support to civil authorities and the general public. In addition to this disaster response is medical readiness mission. The MHS identifies, develops, and sustains critical military capability and readiness in support of resource management and the operational planning process.
The MHS is facing numerous challenges as we continue to strive to ensure delivery of quality healthcare well deserved by our customers to include an increasingly competitive civilian healthcare industry job market, a projected future nationwide shortage of physicians and nurses, a growing and aging beneficiary population, the requirement for lifelong care for injuries sustained in battle, and the increasing cost of sustaining the health care benefit are among these challenges.

102
Table 5-1: DoD Medical Manpower Program
FY12 Actual
FY13 Estimate
FY14 Estimate
FY12 Actual
FY13 Estimate
FY14 Estimate
Medical 11,762 11,769 11,764 3,955 4,381 4,410Dental 3,203 3,172 3,153 1,304 1,333 1,328Nurse 10,405 9,726 9,694 9,178 7,710 7,699Medical Service 8,771 8,460 8,384 6,168 5,873 5,905Medical Specialist (USA) 1,593 1,541 1,505 1,352 1,403 1,393Biomedical Sciences (USAF) 2,300 2,086 2,087 589 540 617Veterinary (USA) 533 558 559 269 241 244Warrant Officers 151 146 148 47 119 118Medical Enlisted 78,494 74,838 73,924 45,340 36,361 36,468Dental Enlisted 5,654 42,465 5,503 49,487 2,039 2,033Total 122,866 117,813 116,721 70,924 60,000 60,215DHP Civilian Workyears 59,645 61,637 61,648 N/A N/A N/A
Reserve ComponentCorps
Active Component
Table 5-1a: Army Medical Manpower Program
FY12 Actual
FY13 Estimate
FY14 Estimate
FY12 Actual
FY13 Estimate
FY14 Estimate
Medical 4,423 4,710 4,707 1,914 2,111 2,117Dental 1,040 1,074 1,065 752 814 814Nurse 4,175 3,656 3,645 5,416 4,082 4,075Medical Service 4,963 4,739 4,688 4,813 4,640 4,661Medical Specialist 1,593 1,541 1,505 1,352 1,403 1,393Veterinary 533 558 559 269 241 244Warrant Officers 151 146 148 47 119 118Medical Enlisted 35,417 33,870 33,483 32,202 23,544 23,633Dental Enlisted 1,511 1,497 1,493 1,929 1,296 1,294Total 53,806 51,791 51,293 48,694 38,250 38,349DHP Civilian Workyears 40,609 42,415 42,680 N/A N/A N/A
Active Component Reserve ComponentCorps

103
Table 5-1b: Navy Medical Manpower Program
FY12 Actual
FY13 Estimate
FY14 Estimate
FY12 Actual
FY13 Estimate
FY14 Estimate
Medical 3,965 3,947 3,934 690 692 686Dental 1,120 1,171 1,160 261 261 256Nurse 2,964 2,941 2,920 1,297 1,317 1,320Medical Service 2,783 2,830 2,805 361 359 359Warrant Officers 0 0 0 0 0 0Medical Enlisted 24,539 24,680 24,137 4,743 4,717 4,618Dental Enlisted 1,836 1,898 1,891 286 286 282Total 37,207 37,467 36,847 7,638 7,632 7,521DHP Civilian Workyears 12,514 12,377 12,242 N/A N/A N/A
CorpsActive Component Reserve Component
Table 5-1c: Air Force Medical Manpower Program
FY12 Actual
FY13 Estimate
FY14 Estimate
FY12 Actual
FY13 Estimate
FY14 Estimate
Medical 3,374 3,112 3,123 1,351 1,578 1,607Dental 1,043 927 928 291 258 258Nurse 3,266 3,129 3,129 2,465 2,311 2,304Medical Service 1,025 891 891 994 874 885Biomedical Sciences 2,300 2,086 2,087 589 540 617Medical Enlisted 18,538 16,288 16,304 8,395 8,100 8,217Dental Enlisted 2,307 2,122 2,119 507 457 457Total 31,853 28,555 28,581 14,592 14,118 14,345DHP Civilian Workyears 6,522 6,845 6,726 N/A N/A N/A
Reserve ComponentActive ComponentCorps

104
Chapter 6: Inventory for Contracts for Services
The Department has monitored the size of the contractor workforce since 2001 in various ways. In FY 2008, section 2330a of title 10, U.S.C., was modified by section 807 of the National Defense Authorization Act to require the Department to submit to Congress an Inventory of Contracts for Services (ICS) to report the service contracts awarded by the Department in the fiscal preceding year. This inventory is used to assess the service contracts awarded and estimate the size of the contractor workforce. Reviews of the inventory inform budget plans and workforce mix decisions in accordance with sections 129a, 235 and 2463 of title 10, United States Code, respectively.
Table 1-1: Results of Fiscal Year 2010 Inventory of Contracts for Services
DoD Components with Procurement Authority Total
Obligations
CFTEs
Department of the Army (USA) $39,529,088,453 241,043 Department of the Navy (USN) $29,389,637,321 170,285 Department of the Air Force (USAF) $24,814,273,335 144,208 Business Transformation Agency (BTA) $73,749,404 337 Defense Advanced Research Projects Agency (DARPA) $95,724,798 551 Defense Commissary Agency (DeCA) $347,860,562 5,365 Defense Contract Management Agency (DCMA) $250,101,724 1,199 Defense Finance and Accounting Service (DFAS) $265,505,362 1,567 Defense Human Resource Activity (DHRA) $20,695,090 107 Defense Information Systems Agency (DISA) $4,617,122,769 15,331 Defense Logistics Agency (DLA) $1,835,142,249 12,540 Defense Media Activity (DMA) $87,566,369 442 Defense Microelectronics Activity (DMEA) $34,338,347 98 Defense Security Cooperation Agency (DSCA) $54,596,703 272 Defense Security Service (DSS) $55,371,024 373 Defense Threat Reduction Agency (DTRA) $526,698,517 2,914 Department of Defense Education Activity (DoDEA) $187,309,905 1,208 Missile Defense Agency (MDA) $502,177,839 2,603 TRICARE Management Activity (TMA) $11,343,546,761 12,660 Uniformed Services University of the Health Sciences (USUHS) $29,141,666 181 United States Special Operations Command (USSOCOM) $1,458,039,853 5,099 United States Transportation Command (USTRANSCOM) $4,955,303,509 1,091 Washington Headquarter Services (WHS) $548,654,883 3,247
Total $121,021,646,444 622,722

105
Table 1-2: Results of Fiscal Year 2011 Inventory of Contracts for Services
Reporting Component
CFTE's Total Contract
Obligations Notes
United States Africa Command (AFRICOM) 191 $65,578,331 United States Air Force (USAF) 166,496 $33,553,494,773 United States Army (USA) 246,916 $40,345,114,626 Chainnan of the Joint Chiefs of Staff(CJCS) 430 $107,469,870 Defense Advanced Research Projects Agency (DARPA) 607 $134,078,676 Defense Contract Audit Agency (DCAA) 59 $12,492,773 Defense Contract Management Agency (DCMA) 245 $47,103,875 Defense Commissary Agency (DeCA) 3,376 $374,565,869 Defense Finance and Accounting Service (DFAS) 1,323 $262,658,837 Defense Human Resource Activity (DHRA) 220 $45,880,370 Defense Infonnation Systems Agency (DISA) 12,298 $2,743,365,623 Defense Logistics Agency (DLA) 12,639 $1,722,433,858 Defense Media Activity (DMA) 672 $137,292,452 Defense Micro-Electronics Activity (DMEA) 123 $45,922,996 NOTE I Department of Defense Education Activity (DoDEA) 1,825 $206,368,699 Defense Security Cooperation Agency (DSCA) 73 $11,267,339 Defense Security Service (DSS) 377 $60,353,881 Defense Threat Reduction Agency (DTRA) 4,617 $1,034,777,227 Defense Test Resource Management Center (DTRMC) 29 $8,027,811 United States European Command (EUCOM) 201 $47,163,268 Missile Defense Agency (MDA) 2,362 $524,610,148 United States Department of the Navy (DoN) 175,929 $32,728,959,199 United States North Command (NORTHCOM) 460 $20,279,325 Office of the Director Administration and Management (ODA&M)
1,987
$398,942,432
Pentagon Force Protection Agency (PFPA) 590 $70,855,688 United States Special Operations Command (SOCOM) 6,610 $1,739,427,371 TRICARE Management Activity (TMA) 8,020 $12,048,716,111 United States Transportation Command (TRANSCOM) 3,853 $7,260,921,084 United States Forces Korea (USFK) 135 $25,697,322 Uniformed Services University of the Health Sciences (USUHS)
142
$22,191,843
Washington Headquarters Services (WHS) 1,054 $148,537,757 Other DoD Inputs 56,290 $8,509,597694 NOTE2
Total 709,879 $144,506,473,793 NOTE 1 - CFTE data not provided by component, but calculated by OSD. NOTE 2 - Data added by OSD as a result of omissions discovered in component reporting.
The Department considers the ICS is an effective tool to be used to inform budget plans and workforce mix decisions and is continuing to improve upon the information from previous year submissions. The Department also recognizes the need and benefit of collecting direct labor and cost data from contractors to account for and report CFTEs with greater accuracy. The Department continues to improve its ability to report and utilize the ICS through implementation of the Enterprise-wide Contractor Manpower Reporting Application (ECMRA).

106
Chapter 7: Manpower Request Justifications
Army Manpower Request Introduction
The Army is in a state of transition. Defense Strategic Guidance rebalances the military
to the Asia-Pacific region. After more than 10 years of war, the Army has concluded its mission
in Iraq and commenced the drawdown of surge forces in Afghanistan while transferring
responsibility to Afghan forces. Additionally, the 2011 Budget Control Act requires the Army to
face the challenges of our Nation’s current fiscal environment. Given this evolving environment,
the Army is still working to strike the right balance between readiness, maintaining faith with the
All-Volunteer Force, and reduced resources to fund end strength—all during a time of war.
When the Army developed this military manpower program for FYs 13-17, only the size of the
Active Component was known, 490K by the end of FY17. Army senior leadership was still in
the process of evaluating and deciding upon emerging force structure options as part of the
Total Army Analysis (TAA). As a result, the strength reduction plan was largely built on a bed of
uncertainty. Specifically, fiscal-year end-strengths were defined but the composition of the force
(officer vs. enlisted, grades, and specialties) were yet to be clearly identified. Moreover, the
Army was only then beginning to evaluate and request the necessary authorities and resources
necessary to separate Soldiers to meet the force shaping objectives and end strength.
Temporary End Strength Army - Medical (TEAM): The PB14 submission includes the continuation of additional end strength authorizations
to mitigate the impact of the large population of Soldiers in the disability evaluation system
(DES), currently 14.8K for the active component. However, based on changes to anticipated
operational requirements, the Army was able to reduce the amount of additional strength for
TEAM from 12.4K in FY13 to 3.0K in FY14. The additional strength in select specialties will help
ensure that the Army is able to meet readiness requirements in deploying units.
MILITARY MANPOWER Operating Forces:
a. Active Component. During 2012, the Army built two new multi-functional support
brigades and converted one functional support brigades to complete AC; bringing the Army to a

107
total of 45 BCTs (two still in a legacy maneuver brigade design), 38 Multifunctional Support
Brigades, and 44 Functional Support Brigades. Inactivations to achieve end-strength reduction
requirements will begin in 2013.
b. Army National Guard. In 2012, ARNG force had no modular conversions. In 2013,
the ARNG will finish conversion to a modular structure ending the year with 28 BCTs, 48
multifunctional support brigades, and 40 functional support brigades.
c. Army Reserve.
The USAR finished conversion to a modular structure in 2011 with 12 multi-functional
support brigades and 47 functional support brigades.
Generating Force: The Army is adjusting its generating force. The goal of this adjustment is to
build the best generating force while we restore balance. The Army also created Warrior
Transition Units. These units are a key element of the Army Medical Action Plan that will
provide Soldiers a continuum of integrated care from point of injury, illness or disease to return
to duty or transition from active duty. These units are manned by soldiers from all three
components and by civilians. The multi-compo makeup of these units reflects that our Warriors
in Transition come from all three components.
Civilian Manpower:
Congress requires the Army to project the number of full time equivalent civilians in the
budget based on workload. Congress establishes floors and ceilings on certain categories of
manpower, such as military technicians. In addition, Congress establishes a ceiling on the
number of military and civilian employees assigned to the Office of the Secretary of the Army
and the Army Staff. Highly Qualified Experts are not part of the projected full time equivalent
civilians in the budget, but are funded in the year of execution from funds established for other
purposes. About 50% of the Army civilian workforce is within the discretionary control of the
Army. The remaining 50% of the civilian workforce is subject to different statutory constraints
and/or funding sources external to the Army and falls into the following categories: 1) 7.5% are
foreign national employees controlled by international agreements; 2) 10.1% are paid for by the
working capital fund (pursuant to 10 USC 2208); 3) 13.4% are Military Technicians; and 4)
19.1% are externally funded (to include Defense Health Programs, Special Operations,
108
Intelligence, Foreign Military Sales and Counter-Drug programs). In addition, there are about
23,181 employees separately funded by the Civil Works and Cemetarial appropriations.
Contract Manpower The Army is continuing its efforts to account for the capabilities provided through
contracted services and to subject these capabilities to requirements validation and review for
functions at risk of inherently governmental performance and to ensure personal services have
proper statutory authority. To do this we have established a contractor inventory pursuant to the
requirements of 10 United States Code §§ 129a and 2330a. In the FY 2012 DOD Inventory of
Contracts for Services (ICS), the Army has accounted for invoices totaling $38 billion for
approximately 240K contractor full-time equivalents (CFTEs): 150K CFTEs in the generating
force and 90K CFTEs in the Central Command area of responsibility providing support to
OIF/OEF.
On 17 April 2013, the Army Deputy Assistant Secretary for Force Management,
Manpower and Resources (DASA-FMMR), the Acting Army Deputy Assistant Secretary for
Procurement (DASA-P) and the Director of the Army Budget Office (DAB) jointly signed out
guidance to the Command and Headquarters organizations to reduce spending in FY 2013 on
contracts for services to comply with NDAA 12 Section 808.
Commands will review their contracts for services and adjust their projections for
contract services spending in the Panel for Documentation of Contractors tool to reflect contract
service reductions planned for FY13. Commands will also discuss their FY13 contract service
reduction plans on a monthly basis in conjunction with discussion of the total force in the
workforce shaping VTCs hosted by ASA(M&RA) and ASA(FM&C).

109
Navy Manpower Request
Introduction
Outlined in this request are the requirements for Active, Reserve, and Civilian manpower. Trends are addressed as indicated by actual performance in FY 2012 to projections into FY 2014. The information reflects changes contained in the President’s Budget (PB) submission for FY 2014. Key initiatives focus on future needs of a more efficient, highly effective Fleet. Requested strength levels are required to support the Navy’s missions throughout the world. Major force structure changes affecting manpower are described below.
Key Manpower Issues The FY14 budget submission implements the Defense Strategic Guidance (DSG), Sustaining U.S. Global Leadership: Priorities for 21st Century Defense, and continues the Navy’s current efforts by making decisions based on our three tenets – Warfighting First, Operate Forward, and Be Ready. Regardless of the size or the budget or the Fleet, these tenets are the key consideration applied to each decision made. This approach to building the FY14 program focused on three main priorities, in order: Priority 1: Delivering Presence The FY14 program includes investments in force structure needed to meet the presence requirements of the FY2014 Global Force Management Allocation Plan (GFMAP) and associated future projections. The investments in ships and aircraft are complemented with the funding for training, maintenance and operations necessary for readiness today and to ensure they can continue to provide presence over their expected service life. The funded operations and maintenance in FY2013 will complete the manning, training, and maintenance, and other preparations necessary to enable the Navy to meet the FY2014 Global Force Management Allocation Plan (GFMAP). The FY2014 budget submission, combined with anticipated Overseas Contingency Operations (OCO) funding, fully funds our planned ship and aircraft maintenance and the ship and aircraft operations needed to execute the FY2014 GFMAP. The overall FY2014 readiness is dependent on OCO funding, as it subsidizes about 20 percent of our ship and aircraft maintenance costs in FY2014, including depot maintenance. The Navy is requesting OCO funding for about 20% of planned ship operations to support training and certification for deployment and deployed operations. Dependence on this type of funding has decreased from $3.3 billion in FY2011 to approximately $2.6 billion in FY2014 as “OCO to base” funding migration occurs. A more enduring funding strategy will eventually be required for Navy to maintain its current readiness level of overseas presence into the future. The Navy also continues to develop more efficient ways to generate presence. The FY2014 budget submission requests investments needed to modify the Fleet Readiness Training Plan (FRTP), the means the Navy uses to train and maintain ships and aircraft in Carrier Strike Groups (CSG) and Amphibious Ready Groups (ARG) in preparation for deployment. This change, called “Enhanced CSG Presence,” will enable increased overseas presence of rotationally-deployed CSGs by lengthening the overall FRTP cycle, adding time for

110
maintenance and training, and increasing the deployed time of each CSG per operating cycle. This transition will take two years to complete, but at the end, there will be an established, sustainable process for training and maintaining our rotationally deploying ships, aircraft, and crews. Priority 2: Fielding Near-term Capabilities Mine warfare continues to be a significant emphasis in the near-term. The FY2014 program increases investment in the new AQS-20 towed mine hunting sonar and the new unmanned surface vehicle that will tow it, freeing up manned helicopters and ships and further expanding mine hunting capacity. The budget submission funds upgrades for existing helicopter-towed mine hunting sonar and minesweeper (MCM) hull-mounted sonar and accelerates fielding of the Mk-18 mine-hunting unmanned underwater vehicles (UUV) and SEAFOX mine neutralization system. To support MCMs and Patrol Coastal (PC) ships in Bahrain, Navy’s FY2014 program sustains USS PONCE as an Afloat Forward Staging Base-Interim (AFSB-I) in the Arabian Gulf and funds the outfitting of its replacement – the first Mobile Landing Platform (MLP) modified to be an AFSB. To address the near-term threat from submarines, the FY2014 program sustains accelerated procurement of Mk-54 torpedoes, improves sustainment and replacement of today’s fixed and mobile undersea sensors and further accelerates fielding of the surface ship torpedo defense system, which is scheduled to deploy in FY2014. Additionally, small boats with explosives or anti-ship missiles remain a potential threat to naval forces in the constrained waters of the Arabian Gulf. The FY2014 program funds the integration of Advanced Precision Kill Weapon System (APKWS) onto the MH-60R helicopters to counter this threat. To improve the ability to defeat larger surface combatants, the FY2014 program invests in the development and testing of near-term modifications to existing weapons that would enable them to be used for surface warfare. Additionally, improving the defense of the Navy’s computer networks depends on reducing its “footprint,” improving day-to-day network functioning, and developing an effective cyber workforce. To expand cyber warfare capabilities, the FY2014 program funds the manpower and training to man and train a cyber force increase of about 1,000 personnel by FY2016 in addition to the 800 billets realigned in 2013 from other specialties. These cyber specialists will help form 40 computer defense, attack, and exploitation teams at U.S. Cyber Command. Priority 3: Developing Future Capabilities The development of future capability is benchmarked to support the rebalance toward the Asia-Pacific region and is guided, in large part, by the Air-Sea Battle concept, which implements the Joint Operational Access Concept. Both concepts are designed to assure U.S. forces freedom of action and access to support deterrence, assurance of allies and partners, and the ability to respond to crises. Investments focus on assuring access in each domain, often exploiting the asymmetric capability advantages of U.S. forces across domains. The FY2014 program continues rebalancing efforts toward the Asia-Pacific in four main ways: 1. Increased Presence: The FY2014 budget submission enables Navy presence in the Asia-Pacific to increase by almost 20 percent between now and 2020. This shift is a result of more ships operating from forward locations, including an additional nuclear attack submarine (SSN)

111
homeported in Guam, Littoral Combat Ship (LCS) operating from Singapore, and Joint High Speed Vessel (JHSV), MLP, and AFSB operating from ports throughout the region. It also reflects additional guided missile destroyer (DDG) and amphibious ships rotationally deployed to the Asia-Pacific after being made available by forward homeporting of DDG in Rota, Spain or because they were replaced by JHSV and LCS in Africa and South America. 2. Homeporting: The Navy implemented a plan in FY2013 to shift 60 percent of the Fleet to be homeported in the Pacific by 2020; the FY2014 program continues this plan. 3. Capabilities: The capability investments for the Asia-Pacific are guided by the Air-Sea Battle concept and the future capabilities described above will be deployed preferentially and first to the Asia-Pacific. For example, the P-8A will conduct its first deployment to the Asia-Pacific in 2014, followed by the MQ-4C and F-35 later this decade. The improved kill chain capabilities will go first to the carrier air wing (CVW) in Japan and Navy Integrated Fire Control-Counter Air (NIFC-CA) will be first fielded to Pacific Fleet once it completes its operational testing. 4. Intellectual Capital: Navy investments in education, exercises, interoperability and engagement continue to focus on the Asia-Pacific. The plan for Rim of the Pacific (RIMPAC)14 is to continue growing sophistication and participation, including China for the first time. Additionally, the Navy established a permanent squadron staff to support LCS in Singapore and manage Navy security cooperation activities in the South China Sea.
Conclusion Budget uncertainties or reductions may slow progress toward stated goals, but the tenets which guide our decisions will remain firm. Along with its primary joint partner, the U.S. Marine Corps, the Navy will remain America’s “force in readiness,” prepared to promptly respond to crises overseas and remain focused on warfighting first, operating forward, and being ready.

112
Marine Corps Manpower Request
Introduction
The Marine Corps manpower requirements consist of active duty, reserve, and civilian members dedicated to meeting the demands of the Overseas Contingency Operations (OCO). Over the next year, Marines will continue to deploy to all corners of the globe in support of our nation. OPERATION ENDURING FREEDOM will remain the Marine Corps largest commitment in OCO.
In addition to those operations, the Marine Corps will deploy forces to support Theater Security Cooperation (TSC) events, which range from small Mobile Training Teams in Central America to Marine Expeditionary Unit exercises in Africa, the Middle East, and the Pacific. In keeping with our naval sea traditions, the Marine Corps will participate in maritime security operations to ensure freedom of navigation along vital sea lines of communication. In addition, the Marine Corps will take part in civil-military, humanitarian assistance, and disaster relief operations, focused military to military training events in Africa, Europe, and Central/South America, and theatre security cooperation events in the Pacific Command Area of Responsibility.
The Marine Corps will continue to provide the best trained and equipped Marines and
their units in Afghanistan. Second, we will protect the readiness of our forward-deployed rotational forces around the world. Third, we will reset and reconstitute our operational forces as our Marines and equipment return from nearly 12 years of continuous combat. Fourth, as much as is humanly possible, we will modernize our force through investing in the individual Marine first, and by replacing aging combat systems next. And, lastly, we will keep faith with our Marines, our sailors, and our families.
The New Strategic Guidance - How Your Marine Corps is Changing:
New strategic guidance issued by the President and the Secretary of Defense provides the framework by which the Marine Corps will balance the demands of the future security environment with the realities of our current budget. The guidance calls for a future force that will “remain capable across the spectrum of missions, fully prepared to deter and defeat aggression and to defend the homeland and our allies in a complex security environment.”
We have built a quality force that is fully capable of executing its assigned missions. Our strategic guidance rightfully focuses our attention on the Pacific and Central Command regions. Navy-Marine Corps forward basing, response capabilities and plans are already positioned to support that strategy, yet we will remain vigilant and capable to respond on short notice in other areas of the world as the nation requires. Marines continually stand ready to contribute to a decisive joint force, and can help provide access for that force wherever needed.
The constrained fiscal environment as a result of sequestration - both the immediate cuts in FY13 and the associated reductions in discretionary caps in future years - could have a significant impact on our Nation's readiness both short- and long-term. However, no matter what the implications, there are some things that must endure. The Marine Corps is, and will continue to be, our Nation’s expeditionary force in readiness. We will be ready to rapidly respond to crises around the globe to ensure the continued security of the American people and to protect the interests that underpin our prosperity.

113
Though the fiscal choices made over the past year were difficult, we are confident that we are managing risk by balancing capacity and capabilities across our forces while maintaining the high levels of readiness for which the Nation relies on its Marines. The Corps of today and tomorrow will maintain its high standards of training, education, leadership and discipline, while contributing vital capabilities to the Joint Force capabilities across the spectrum of military operations. The emerging strategy revalidates our role as America’s Expeditionary Force in Readiness. Our partnership with the Navy enables a forward-deployed and engaged force that shapes, deters, responds and projects power well into the future. During our force structure assessment, we cross-checked recommendations against approved DoD Operations and Contingency Plans, and incorporated lessons learned from 10 years of combat. The resulting force structure decisions to support the new strategy are:
(1) Reduce the end strength of the active component of the Marine Corps from 202,100 beginning in FY13 to 182,100 by the end of FY16.
(2) Design a force with capabilities optimized for forward-presence, engagement and rapid crisis response.
(3) Properly re-shape organizations, capabilities and capacities to increase aggregate utility and flexibility across the range of military operations; also enhancing support provided to U.S. Special Operations and Cyber Commands.
(4) Properly balance critical capabilities and enablers across our air-ground-logistics task forces, ensuring that identified low density/ high demand assets became right density/ high demand assets.
(5) Incorporate the lessons learned from 10 years of war—in particular, the requirements to field a force that is manned, trained, and equipped to conduct distributed operations.
(6) Create an operational reserve component capability without any reductions in reserve force structure.
(7) Design the force for more closely integrated operations with our Navy, special operations and inter-agency partners.
Throughout this period of adjustment, we will “keep faith with our Marines, Sailors and their families.” Our approach to caring for them is based on our recognition and appreciation for their unwavering loyalty and unfailing service through a decade of combat operations. This strong commitment will not change.
Key Manpower Issues
Active Component (AC)
We are conducting our drawdown to 182,100 in a measured way. Our plan is to reduce our end strength by approximately 5,000 Marines per year and will be accomplished primarily by natural attrition, voluntary separation, and retirement authorities. Involuntary separations will be minimized as much as possible, and we have no plans to conduct a reduction-in-force. Such an approach would no doubt do significant long-term damage to our ability to recruit and maintain a quality force. Our overarching goal must be to keep faith with our Marines and their families.
While maintaining DoD quality standards, the Marine Corps continues to recruit the best of America’s youth. The Marine Corps forecasts that both active and Reserve recruiting will

114
remain challenging in FY14, particularly when viewed through the lens of accession missions to sustain low density/high demand Military Occupational Specialties (MOSs). The Marine Corps will continue to need the support of Congress for targeted enlistment bonuses for shaping the force with critical specialty skills and other recruiting programs, such as advertising, which will be essential in meeting these challenges.
Retention is the other important part of building and sustaining the Marine Corps. In
Fiscal Year 2012, the Marine Corps achieved its retention missions. We retained 24% of our First Term and 57% of our eligible career force. In Fiscal Year 2013, the Marine Corps is poised to achieve targets of ~54% First Term and ~49% Career Force retention rates.
The Marine Corps’ continuing success can be largely attributed to two important
enduring themes. First, Marines want to stay Marine because of the superb leadership in our officer and staff noncommissioned officer ranks and their desire to remain part of a "band of brothers." Second, the Marine Corps’ wise use of the selective reenlistment bonus program (SRBP) that the Congressional leadership has provided. This program remains critical to force shaping and sustainment. Filling low density/high demand MOSs will continue to be a challenge and will require continued congressional support of the SRBP.
On January 24, 2013, the Secretary of Defense rescinded the 1994 policy that restricted
women from combat roles. The Secretary has provided the services ample time to assess this change in policy by setting a deadline for full implementation of 1 January 2016. The Marine Corps is dedicated to maintaining the highest levels of combat readiness and capitalizing upon every opportunity to enhance our warfighting capabilities and the contributions of every Marine; it is the right thing to do. Our ongoing deliberate, measured and responsible approach to validate occupational performance standards for all Marines is consistent with the Secretary’s decision to rescind the direct combat exclusion rule for women. As our Corps moves forward with this process, our focus will remain on combat readiness and generating combat-ready units while simultaneously ensuring maximum success for every Marine. The talent pool from which we select our finest warfighters will consist of all qualified individuals, regardless of gender.
Reserve Component (RC)
The Marine Corps Selective Reserve provides the strategic and operational depth to the Active Component (AC) as part of the Total Force. Even as mobilization of reservists in support of OEF diminishes in line with the Afghanistan drawdown, the Marine Corps Reserve continues to augment, reinforce and sustain the AC in support of the Geographical Combatant Commanders across the full spectrum of operations ranging from Defense Support of Civil Authorities (Hurricane Sandy), to the resumption of the Unit Deployment Program towards the Pacific Pivot, to Counternarcotics military to military training missions in Mexico, and to numerous Theater Support Cooperation Exercises globally.
The current authorized Reserve Component (RC) end strength of 39,600 Selected
Reserve Marines is appropriate and provides us with the Marines we require to support the force and to achieve our goal of a 1:5 deployment-to-dwell ratio. The force structure realignment within the RC seeking to mirror the AC construct to ensure component interoperability is currently in effect. Although this has resulted in increased funding requirements for RC personnel retraining now and in the next three fiscal years, the Marine Corps is poised to support the initiative towards sound management of the Total Force.

115
Despite the current fiscal challenges and budget uncertainty, the Marine Corps Reserve remains ready, willing and able to satisfy individual and unit operational requirements, recurring or contingent.
Civilian Manpower The Marine Corps took measures to review, realign and restrain growth in direct funded personnel to ensure its limited civilian personnel resources were properly balanced to accomplish its mission while operating in a fiscally constrained environment. The civilian workforce has remained stable, except for limited growth to accommodate mandated initiatives such as in-sourcing, acquisition, Intel, NGEN/Cyber, and civilian police. Our civilian workforce remains the leanest within DoD with only one civilian for every ten Marines. Over 95 percent of our civilians do not work in Headquarters’ elements in the Pentagon; they are at our bases, stations, depots, and installations. Contract Full Time Equivalents (FTEs), in accordance with Section 807 of Public Law 111-181, are derived using approved OSD AT&L calculation methodologies. They do not represent an actual depiction of the contract workforce, as the Navy continues to increase the fidelity of its contract inventory.

116
Air Force Manpower Request
Introduction
Force structure and programmed military manpower changes require continual dialogue between the Active Air Force, the Air Force Reserves, the Air National Guard, the Office of the Secretary of Defense (OSD), Congress, and the U.S. governors. Over the past year, the Air Force has worked with OSD and the reserve components to assign missions and apportion end strength levels across the Total Force in a manner consistent with the applicable guidelines on programming and budgetary priorities and requirements before formalizing our budget request to Congress. Moving forward, it is essential that we continue to manage the health of the Total Military Force holistically while remaining committed, now more than ever, to strengthen our integration of effort.
The civilian work force supports the Air Force mission in numerous capacities to include
expeditionary missions. All major commands and organizations depend on the contributions of civilian employees to accomplish the mission, with civilians assigned to virtually every Air Force installation worldwide. Air Force civilian end strength also includes ANG and AFR Military Technicians, who serve their units as both full-time civilians and part-time guardsmen and reservists available for mobilization. The Air Force continues to rebalance the civilian workforce to meet current and future skill mix requirements.
Outlined in this report are the Air Force manpower end strength requirements for total
force, which includes active military, Air National Guard, Air Force Reserve, and civilians. Trends are addressed as indicated by actual performance in Fiscal Year 2012 (FY12), FY13 President’s Budget (PB) as amended by the FY13 National Defense Authorization Act (NDAA), and the FY14 President’s Budget (PB) submission. The major theme in FY14 centered around key initiatives that focus on future needs of a more efficient, highly effective Total Force, to include improved oversight of support service contractors. Strength levels requested are those required to support the Air Force’s missions throughout the world. Major force structure changes affecting manpower are described below. Strategic Guidance
In January 2012, the Secretary of Defense issued new defense strategic guidance (DSG) – Sustaining U.S. Global Leadership: Priorities for 21st Century Defense – which directed a rebalance of forces, with a renewed focus on the Asia-Pacific region, as well as continued emphasis on the Middle East. In light of budget realities, such as sequestration, and strategic uncertainty, the Air Force recognized the need to adapt to a relatively static or reduced budget, while continuing to uphold the reliance of the joint community and the Nation on our unique ability to provide Global Vigilance, Global Reach, and Global Power. This reliance constrained Air Force’s options in reducing or terminating capabilities or missions; therefore, we are working diligently and making real progress in eliminating unnecessary expenses and ensuring more disciplined use of resources. Notwithstanding, the current fiscal environment requires us to make trades between force structure, readiness, and modernization among the core missions to ensure the highest quality and ready Air Force possible.
In today’s climate, the Air Force’s technological advantage is being threatened by the worldwide proliferation of advanced technologies in adversarial capabilities in space control and cyber warfare. Some of these technologies are attained with relatively minimal cost, greatly reducing the barriers to entry that have historically limited the reach and power of non-state actors, organized militias, and radical extremists. We must continue to invest in our science and

117
technology base to ensure that future balance of power remains in our favor, while mitigating the need for additional tax dollars.
Force Structure
Air Force launched a Total Force Task Force, a team led by three two-star general officers from Regular Air Force, Air National Guard, and Air Force Reserve, to get a better understanding of our Total Force mixture and develop strategic options to sustain necessary capabilities in the years ahead. The task force developed a Total Force Proposal (TFP), codified in FY13 NDAA, which was centered on creating cost-effective associations that share equipment and facilities at a single location. There are currently 121 such units associations, most of which are in our mobility forces. The Air Force plans to translate this success story for every U.S.-based Reserve fighter unit to become an association with the Regular Air Force within the Future Years Defense Program (FYDP), as will the continental U.S. locations for the KC-46 tanker.
Even as we rebalance our forces, we are aware that the time, place, and nature of the
next contingency can never be predicted with certainty. When these contingencies arise, we must maintain the ability to respond immediately and effectively if called to action. To align with the DSG, the Air Force has traded size for quality. We aim to be a smaller, but superb, force that maintains the agility, flexibility, and readiness to engage a full range of contingencies and threats. FY14 President’s Budget (PB) Request for Air Force Manpower
a. Active Component. The FY14 PB decreases active duty end strength by 1,860 from 329,460 in FY13 to 327,600 in FY14, of which 1,309 correlates with reductions in force structure as a result of Air Force’s TFP. The proposal transferred one Flying Training Unit (FTU), with 24 A-10 and 28 C-130 aircraft from active to ANG, and the divestiture of 8 KC-135R aircraft. Once fully implemented, TFP will provide savings of 2,000 personnel by FY18. Amidst the tough economic times, the active personnel increased by 765 personnel, of which 560 was mandated by FY13 NDAA to delay divestiture of Global Hawk, RQ-4, until FY15, and the balance increased Cyber and Space personnel to help meet the increased demand in these key capabilities. In lieu of asking for additional tax dollars, the Air Force paid these bills and the balance of the end strength decrease by reducing Tactical Air Control Party (TACP) operators and number of personnel required for 365-day deployments.
b. Air Force Reserve (AFR). The FY14 PB decreases the AFR by 480 from 70,880 in FY13 to 70,400 in FY14. To ensure compliance with FY13 NDAA, Air Force established an Intratheater Airlift Working Group (IAWG), comprised of members from ANG, AFR, Air Mobility Command (AMC), and Headquarters Air Force (HAF). The group focused its attention locations still affected by force structure reductions taken as part of FY13 PB and locations that did not receive a backfill mission as part of the Air Force’s TFP, which resulted in restoring 100 positions. The balance of 380 positions is a result of FY13 NDAA directed drill adds that increased only FY13 position.
c. Air National Guard (ANG). The FY14 PB decreases the ANG by 300 from 105,700 in FY13 to 105,400 in FY14. In concert with TFP, 4,114 of 4,414 positions taken during FY13 PB, were restored to ANG and will be used to support the C-130 and A-10 aircraft that was transferred from the active component.
118
d. Civilian Manpower. The FY14 PB decreases the civilian workforce by 2,566 from
188,592 in FY13 to 186,026 in FY14. This decrease includes reducing civilian workforce AF-directed civilian workforce review (CWR), transferring workload to sister services and joint community, Defense Health Program (DHP) clean-up, and various offsets identified through the Planning, Programming, Budgeting, and Execution (PPBE) process.
Conclusion The Air Force continues to face the challenge of tempering its military and civilian personnel to its programmed end strength and Operations and Management dollars respectively. Record high retention rates require a multiyear strategy to size and shape the force while maintaining accessions and civilian career pipelines for the long-term. Reductions-in-force, selective early retirement boards, separation incentives, and reduced opportunities for selective continuation continue to be effective in reducing the military and civilian inventory. The Air Force will continue to manage the force along the 30-year continuum of service and use voluntary measures first, with incentives as needed and involuntary means as required to shape the force in the future to meet end strength levels.
Our Airmen are the best in the world, and we can rely on them to meet any challenge,
overcome any obstacle, and defeat any enemy – as long as they are given adequate resources and the freedom to innovate. As they have time and again, our innovative Airmen will find new and better ways to approach future military challenges across the spectrum of conflict, throughout every domain, and against nascent and unpredicted threats. The FY14 PB reflects the Air Forces commitment to be responsible stewards of the taxpayer’s dollars, while continuing to serve America’s long-term security interests by giving our Nation and its leadership unmatched options against the challenges of an unpredictable future.

Prepared by: Total Force Planning and Requirements
Office of the Assistant Secretary of Defense for Readiness & Force Management 4000 Defense Pentagon, Room 5A734
Washington DC 20301 Voice: 703-697-3402; Fax: 703-614-1243
Past reports available at: http://prhome.defense.gov/RFM/TFPRQ/reports.aspx