deepwater desalination plant, moss landing, california · deepwater desalination plant, moss...
TRANSCRIPT


DeepWater Desalination Plant, Moss Landing, California Hydrogeological Literature Review and Analysis
EcoSystems Management Associates, Inc. i Technical Report ECO-M Reference No. 14-04
TABLE OF CONTENTS
1.0 INTRODUCTION ................................................................................................................................................. 1
2.0 GEOLOGIC SETTING .......................................................................................................................................... 4
3.0 AQUIFER SYSTEMS IN THE VICINITY OF MOSS LANDING .......................................................................... 11 3.1 PAJARO VALLEY – SPRINGFIELD TERRACE, NORTH OF ELKHORN SLOUGH ............................ 11 3.2 SALINAS VALLEY – PRESSURE SUBAREA, SOUTH OF ELKHORN SLOUGH ................................ 12 3.3 DISCUSSION AND RECOMMENDATIONS ............................................................................................ 14
4.0 GROUNDWATER CHARACTERISTICS ............................................................................................................ 26 4.1 STUDY AREA .............................................................................................................................................. 26 4.2 SAMPLING .................................................................................................................................................. 27 4.3 RESULTS ..................................................................................................................................................... 27
5.0 GEOLOGIC HAZARD ANALYSIS ..................................................................................................................... 40 5.1 EARTHQUAKE HAZARDS ........................................................................................................................ 40 5.2 LIQUEFACTION HAZARDS AND EFFECTS ON VERTICAL FLUID FLOW ...................................... 41 5.3 LANDSLIDE HAZARDS ............................................................................................................................. 42 5.4 TSUNAMI HAZARDS ................................................................................................................................. 42
6.0 SUB-SURFACE INTAKE SYSTEMS .................................................................................................................. 51 6.1 TYPES OF SUBSURFACE INTAKE SYSTEMS ....................................................................................... 51 6.2 ADVANTAGES AND DISADVANTAGES ............................................................................................... 51 6.3 DATA FROM SELECTED SUBSURFACE INTAKE SYSTEMS IN OPERATION ................................. 52
7.0 SUMMARY AND CONCLUSIONS .................................................................................................................... 58
8.0 REFERENCES ................................................................................................................................................... 61
LIST OF APPENDICES
Appendix A. Coastal Aquifers and Seawater Recharge …………………………….……….A-1
LIST OF FIGURES
Figure 1-1. Shaded relief bathymetry/topography map showing the location of Moss
Landing on the eastern shoreline of Monterey Bay in central California ...................2 Figure 1-2. Map showing Moss Landing Harbor and locations of geophysical data used
to describe the geological setting and subsurface character of the aquifer system .........................................................................................................................3
Figure 2-1. Geological map from Greene and Clark (1979) showing the major surficial rock units and tectonic structure (faults) .....................................................................6
Figure 2-2. Stratigraphic column published by Greene and Clark (1979) for the offshore area south of Monterey Canyon ..................................................................................7
Figure 2-3. Geology and selected wells used to estimate aquifer thicknesses, geologic outcrops, and sites for geophysical logging in the Pajaro Valley, Santa Cruz and Monterey Counties ...............................................................................................8
Figure 2-4. Geology of the Moss Landing area from the 100:000-scale U.S. Geological Survey digital map ......................................................................................................9
Figure 2-5. Isopach map of Pleistocene sediments in Monterey Bay ..........................................10

DeepWater Desalination Plant, Moss Landing, California Hydrogeological Literature Review and Analysis
EcoSystems Management Associates, Inc. ii Technical Report ECO-M Reference No. 14-04
Figure 3-1. Map showing the Salinas Valley Water Project in the vicinity of Moss Landing. Modified from the Monterey County Water Resources Agency (2003) ........................................................................................................................15
Figure 3-2. Cross-section showing relation between geology and selected water quality attributes along the coast in the Pajaro Valley, Santa Cruz and Monterey Counties, California ..................................................................................................16
Figure 3-3. Map and diagrams showing seawater intrusion within the Pajaro Basin. Hydrologic modeling suggests that seawater intrusion occurs as a landward thinning wedge of saline water .................................................................................17
Figure 3-4. Map showing the distribution of pumping wells with depth to top of perforations in the Pajaro Valley, California ............................................................18
Figure 3-5. Geophysical logs and well construction for selected monitoring wells and test holes in the Pajaro Valley, Monterey County, California ..................................19
Figure 3-6. Geophysical logs for selected monitoring wells and test holes in the Pajaro Valley, Monterey County, California .......................................................................20
Figure 3-7. Cross-section across Elkhorn Slough at the Highway 1 bridge based on Caltrans boreholes .....................................................................................................21
Figure 3-8. Shallow geophysical log section from abandoned oil well “Vierra #1” drilled in 1946 and located near Moss Landing ........................................................22
Figure 3-9. Shallow geophysical log section from abandoned oil well “Pieri #1” drilled in 1949 and located near Moss Landing ...................................................................23
Figure 3-10. Seawater intrusion in the Salinas Valley Groundwater Basin – 180-Foot Aquifer ......................................................................................................................24
Figure 3-11. Seawater intrusion in the Salinas Valley Groundwater Basin – 400-Foot Aquifer ......................................................................................................................25
Figure 4-1. The Monterey Bay and Salinas Valley GAMA study unit, locations of study areas, major cities, rivers, creeks, groundwater basins, and subbasins .....................29
Figure 4-2. Monterey study area; public supply wells sampled are shown in black; flow- path wells are shown in blue; monitoring wells 1-3 are shown in green ..................30
Figure 4-3. Blue circles show wells where conductivity is >700 uS/L .......................................31 Figure 5-1. Map showing earthquake epicenters (seismicity) and major faults in the
vicinity of Moss Landing, California ........................................................................44 Figure 5-2. Map showing distribution of liquefaction-induced ground failures in the
Moss Landing area following the October 18, 1989 Loma Prieta earthquake .........45 Figure 5-3. CPT profiles of the subsurface deposits at the Moss Landing Marine
Laboratory where liquefaction occurred following the 1989 Loma Prieta earthquake .................................................................................................................46
Figure 5-4. Marigram from the Monterey Tide Gauge showing the first 12 hours of the tsunami from the Prince William Sound, Alaska, Good Friday earthquake of March 28, 1964 .........................................................................................................47
Figure 6-1. Selected subsurface intake well systems ...................................................................54 Figure 6-2. Feed water supply (mgd) and number of wells for each desalination plant
presented in Table 6-1 ...............................................................................................55 Figure 6-3. Average well feed water supply (mgd) for each desalination plant presented
in Table 6-1 ...............................................................................................................56

DeepWater Desalination Plant, Moss Landing, California Hydrogeological Literature Review and Analysis
EcoSystems Management Associates, Inc. iii Technical Report ECO-M Reference No. 14-04
LIST OF TABLES
Table 4-1. Analyte list ................................................................................................................32 Table 4-2. Water quality parameters ..........................................................................................33 Table 4-3. Major and minor ions ................................................................................................34 Table 4-4. Nutrients and DOC and radioisotopes ......................................................................35 Table 4-5a. Trace elements - A ....................................................................................................36 Table 4-5b. Trace elements - B ....................................................................................................37 Table 4-6. Volatile organic compounds .....................................................................................38 Table 4-7 Pesticides...................................................................................................................39 Table 5-1. Significant historical earthquakes affecting the Monterey Bay area ........................48 Table 5-2. Major faults affecting the Moss Landing area (within 100 km of site). ...................49 Table 5-3. Modified Mercalli Intensity Scale (1931) .................................................................50 Table 6-1. Selected subsurface beach well intake systems for seawater desalination
currently in operation ................................................................................................57

DeepWater Desalination Plant, Moss Landing, California Hydrogeological Literature Review and Analysis
EcoSystems Management Associates, Inc. 1 Technical Report ECO-M Reference No. 14-04
DEEPWATER DESALINATION PLANT MOSS LANDING, CALIFORNIA
HYDROGEOLOGICAL LITERATURE REVIEW AND ANALYSIS
1.0 INTRODUCTION Moss Landing is located in Monterey County on the central California coast near the
center of Monterey Bay (Figure 1-1). The harbor at Moss Landing is bisected by the Elkhorn Slough where the Salinas River empties into the Pacific Ocean via Monterey Bay (Figure 1-2). Monterey Canyon, one of the largest active submarine canyons in western North America, lies directly west offshore of the mouth of Elkhorn Slough. Moss Landing and Elkhorn Slough lie between two major watersheds – the Pajaro River and the Salinas River – and both groundwater basins suffer from seawater intrusion along the coast. DeepWater Desal (DWD) is planning to construct a seawater desalination plant at Moss Landing to address the growing demand for freshwater in the Monterey Bay area. This report describes the hydrogeology of the area and the available background literature that is being used to evaluate the feasibility of subsurface intake systems for the project. The DWD facility is expected to have the capacity of 25 mgd (million-gallons-per-day).
This report consists of six chapters. Chapter 1: General introduction to the project site and the proposed desalination plant. Chapter 2: Gives a historical evaluation of the geological character and formation of the
project site. Chapter 3: Provides a description of the two major groundwater basins, the Pajaro
Valley and the Salinas Valley, which exist on opposite sides of the Elkhorn Slough. In this chapter, the main water-bearing units, the upper 180-foot Aquifer and the lower 400-foot Aquifer, were discussed, along with the 900-foot Aquifer. This chapter also describes the shallow alluvial aquifer, including Dune Sand Aquifer, which may be used for subsurface intake at other desalination plants.
Chapter 4: Discussion of the groundwater chemical characteristics for the wells located near the coast. Several tables are presented to provide qualitative values for various water quality parameters, ions, nutrients, DOC and radioisotopes, trace elements, volatile compounds, and pesticides.
Chapter 5: Discussion of historical and potential future hazards from earthquakes and tsunamis.
Chapter 6: Brief description of various types of subsurface intake systems, as well as a discussion of their advantages and disadvantages. The intake capacities of selected desalination plants in operation are presented in graphical and tabular forms.
Chapter 7: Summary and conclusions of the study.

DeepWater Desalination Plant, Moss Landing, California Hydrogeological Literature Review and Analysis
EcoSystems Management Associates, Inc. 2 Technical Report ECO-M Reference No. 14-04
Figure 1-1. Shaded relief bathymetry/topography map showing the location of Moss Landing on the eastern shoreline of Monterey Bay in central California. Monterey Canyon is one of the largest active submarine canyons along the U.S. West Coast. (USGS, 2005)

DeepWater Desalination Plant, Moss Landing, California Hydrogeological Literature Review and Analysis
EcoSystems Management Associates, Inc. 3 Technical Report ECO-M Reference No. 14-04
Figure 1-2. Map showing Moss Landing Harbor and locations of geophysical data used to describe the geological setting and subsurface character of the aquifer system. Seismic reflection profiles and offshore backscatter images are provided by the U.S. Geological Survey, National Archive of Marine Seismic Surveys (NAMSS) and the Coastal and Marine Geology Branch (InfoBank). Bathymetry data used in this study were acquired, processed, archived, and distributed by the Seafloor Mapping Lab of California State University Monterey Bay. The oil well data are provided by the State of California Division of Oil, Gas, and Geothermal Resources (DOGGR). The water well data are provided by the Pajaro Valley Water Management Agency and published in Hanson (2003). The coastline and inland waterways boundaries are provided by Bureau of Ocean Energy Management (BOEM).

DeepWater Desalination Plant, Moss Landing, California Hydrogeological Literature Review and Analysis
EcoSystems Management Associates, Inc. 4 Technical Report ECO-M Reference No. 14-04
2.0 GEOLOGIC SETTING The Monterey Bay region of central California lies within the California Coast Ranges
geomorphic province along the Pacific continental margin of North America (Greene, 1977; Greene and Clark, 1979). The Coast Ranges in central California have undergone a complex geological history related to the transition of the margin from Mesozoic to early Tertiary subduction of the Farallon plate beneath North America to the late Cenozoic evolution of the Pacific-North America transform fault plate boundary (Atwater, 1970). Active northwest-trending strike-slip faults of the San Andreas system accommodate the right-lateral shear between the Pacific and North America tectonic plates at present (Wallace, 1990). A component of northeast-directed convergence is also evident based on earthquake focal mechanisms, folding and thrust faulting within the Coast Ranges (Plafker and Galloway, 1989).
The Monterey Bay region is located on Cretaceous granitic rocks of the Salinian block
(Page, 1970), which is flanked by two major fault zones – the San Andreas to the east and the San Gregorio offshore to the west (Figure 2-1). The relatively impermeable basement rocks are estimated to be about 1 km below the surface in the coastal area (Greene and Clark, 1979). A well located a few kilometers south of Moss Landing may have reached basement at a depth of 989 meters (3245 ft). However, exploratory oil and gas wells drilled to the north of Elkhorn Slough found a large erosional “gorge” cut into the Salinian granitic rocks nearly 2.5 kilometers below the ground surface (Greene, 1977; Schwartz, 1983). The well log for Vierra #1 (DOGGR, 2003) drilled near Moss Landing recorded hard sand at a total depth of 7916 feet (2413 m; Figure 1-2). The thick sand layers above the bottom of the well were described as granitic debris and may represent decomposed granite, so the true depth to basement is uncertain.
A sequence of poorly permeable consolidated rocks of Miocene age, described as the
Monterey formation, overlie the basement in the Monterey Bay region (Figure 2-2, Greene and Clark, 1977). The Monterey formation in the coastal area near Moss Landing consists of marine mudstones, shales, siltstones, and to the south, basal sandstone. Thickness of the Monterey unit in Monterey Bay is about 550 to 640 m (1800-2100 ft; Figure 2-2). Marine sediment deposition continued into the Pliocene epoch with the semi-consolidated to consolidated sandstone, siltstone, and shale of the Purisima formation. The Purisima formation dips to the west or northwest in southern Monterey Bay and crops out on the seafloor to the north near Santa Cruz and along the walls of the Monterey Canyon, near the 200 m (656 ft) contour a few miles west of Moss Landing (Figure 2-1, Greene and Clark, 1979; Figure 2-3, Hanson, 2003). Strata of the Purisima formation are about 400 m thick (1312 ft) along the coast from north of Moss Landing (Figure 2-2, Greene and Clark, 1979) and thin to zero at the erosional edge in southernmost Monterey Bay.
Upper Pliocene to Holocene sediments along the coast of Monterey Bay include the Plio-
Pleistocene Paso Robles formation, the Pleistocene Aromas Sand, and surficial deposits including Quaternary deltaic sediments of the Salinas River, submarine canyon fill, slump and landslide deposits, and Holocene marine sediments (Figure 2-2, Greene and Clark, 1979). Onshore deposits of eolian, older dune sands, and marine terraces are exposed, and basin sediments of sand and mud are submerged in parts of the Elkhorn Slough (Figure 2-4, Wagner et al., 2002). The Aromas Sand shows cross-bedding in seismic reflection profiles, appears to
DeepWater Desalination Plant, Moss Landing, California Hydrogeological Literature Review and Analysis
EcoSystems Management Associates, Inc. 5 Technical Report ECO-M Reference No. 14-04
unconformably overlie the Purisima formation north of Monterey Canyon, and extends more than 10 km seaward from the mouth of the Pajaro River (Figure 2-1, Greene and Clark, 1979; Figure 2-3, Hanson, 2003; Figure 2-4, Wagner et al., 2002). South of the submarine canyon, the undifferentiated Aromas-San Pablo units are poorly defined in seismic reflection profiles and lap onto the folded and faulted Monterey strata offshore in the Monterey Bay fault zone (Greene, 1977; Greene and Clark, 1979). The Aromas Sand is more than 255 m thick (837 ft; Figure 2-5) near the coast north of the submarine canyon, and less than about 75 m thick (246 ft) south of the canyon. Quaternary deltaic deposits of the Salinas River extend up to eight kilometers offshore south of the canyon, whereas Holocene marine surficial deposits extend as a west-northwest elongate mass from the mouth of the Pajaro River for more than 25 km toward the northwest corner of Monterey Bay (Figure 2-5, Greene and Clark, 1979). The surficial deposits are about 25 m (82 ft) thick near the coast between Moss Landing and the Pajaro River (Figure 2-5) and likely represent deltaic deposits from the Pajaro River.

DeepWater Desalination Plant, Moss Landing, California Hydrogeological Literature Review and Analysis
EcoSystems Management Associates, Inc. 6 Technical Report ECO-M Reference No. 14-04
Figure 2-1. Geological map from Greene and Clark (1979) showing the major surficial rock units and tectonic structure (faults). Granitic basement rocks of the Salinian crustal block outcrop near Monterey and in the Santa Cruz Mountains. Moss Landing (ML) lies on the coastal plain near the head of Monterey submarine canyon.

DeepWater Desalination Plant, Moss Landing, California Hydrogeological Literature Review and Analysis
EcoSystems Management Associates, Inc. 7 Technical Report ECO-M Reference No. 14-04
Figure 2-2. Stratigraphic column published by Greene and Clark (1979) for the offshore area south of Monterey Canyon (see Figure 2-1 for general location #4).

DeepWater Desalination Plant, Moss Landing, California Hydrogeological Literature Review and Analysis
EcoSystems Management Associates, Inc. 8 Technical Report ECO-M Reference No. 14-04
Figure 2-3. Geology and selected wells used to estimate aquifer thicknesses, geologic outcrops, and sites for geophysical logging in the Pajaro Valley, Santa Cruz and Monterey Counties (Source: Hanson, 2003). Profile A-A’ is shown in Figure 3-2.

DeepWater Desalination Plant, Moss Landing, California Hydrogeological Literature Review and Analysis
EcoSystems Management Associates, Inc. 9 Technical Report ECO-M Reference No. 14-04
Figure 2-4. Geology of the Moss Landing area from the 100:000-scale U.S. Geological Survey digital map (Wagner et al., 2002). The red line shows the approximate location of the proposed intake pipe. Onshore wells (oil in red, water in green) with geophysical and descriptive logs are shown. The blue line labeled Caltrans shows the location of a borehole cross-section that was used to determine the subsurface stratigraphy beneath the Highway 1 bridge across Elkhorn Slough (Figure 3-7).

DeepWater Desalination Plant, Moss Landing, California Hydrogeological Literature Review and Analysis
EcoSystems Management Associates, Inc. 10 Technical Report ECO-M Reference No. 14-04
Figure 2-5. Isopach map of Pleistocene sediments in Monterey Bay (Source: Greene and Clark, 1979). See Figure 2-2 for stratigraphic column offshore southern Monterey Bay.
DeepWater Desalination Plant, Moss Landing, California Hydrogeological Literature Review and Analysis
EcoSystems Management Associates, Inc. 11 Technical Report ECO-M Reference No. 14-04
3.0 AQUIFER SYSTEMS IN THE VICINITY OF MOSS LANDING Two major groundwater basins, the Pajaro Valley and the Salinas Valley, exist on
opposite sides of the Elkhorn Slough at Moss Landing (Figure 2-3, Hanson, 2003; Figure 3-1, MCWRA, 2003; PVWMA, 2003). The Pajaro Valley is the coastal part of the Pajaro River Basin located in southern Santa Cruz County and Monterey County north of Elkhorn Slough. The Springfield Terrace subarea comprises the region between the Pajaro River and Elkhorn Slough (Figure 2-3). The coastal part of the Salinas Valley Basin includes the Pressure subarea (Figure 3-1, MCWRA, 2003) located south of Elkhorn Slough and adjacent to Moss Landing.
3.1 PAJARO VALLEY – SPRINGFIELD TERRACE, NORTH OF ELKHORN
SLOUGH
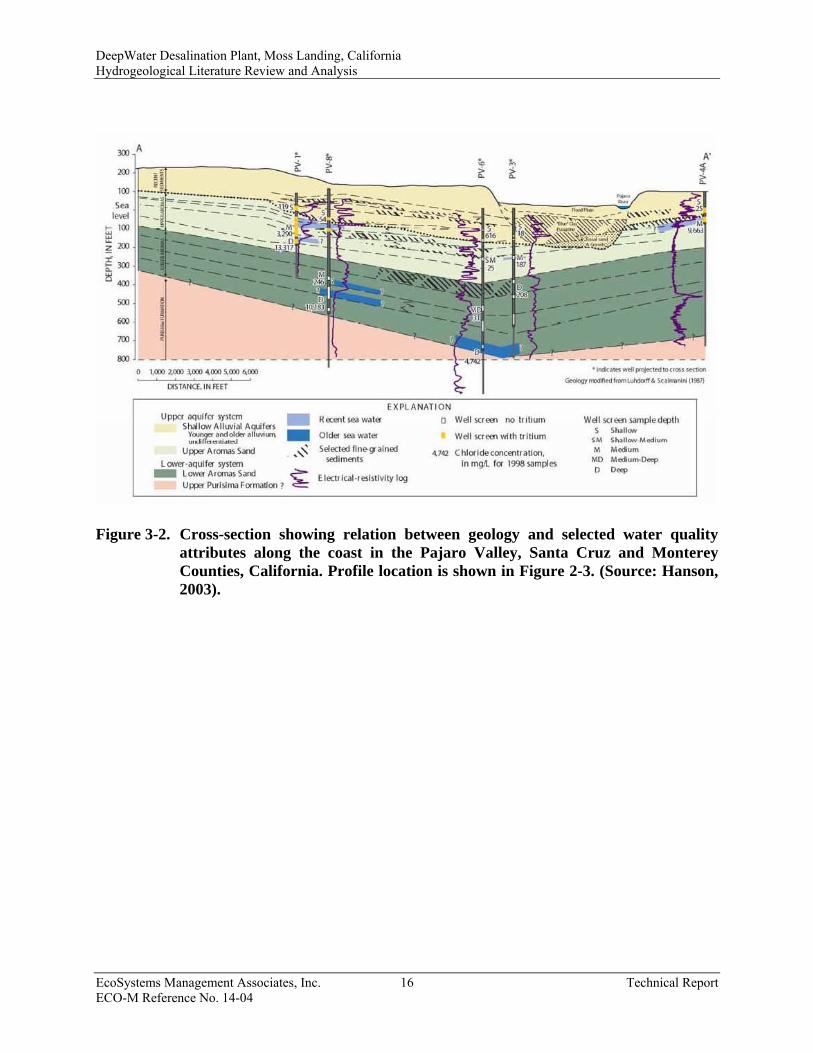
The principal aquifers described by the Pajaro Valley Water Management Agency (PVWMA, 2000; Hanson, 2003) are based on the major geologic units, including the Purisima formation, Aromas Sand and Quaternary Alluvium (Figure 3-2). The Aromas Sand is subdivided based on lithology and geophysical characteristics into upper and lower parts. The upper-aquifer system may include both the alluvial deposits and the upper Aromas Sand, whereas the lower-aquifer system may include both the lower Aromas Sand and Purisima Formation (Hanson, 2003). Hanson states that “the geologic factors that, in part, control the distribution of recharge, pumpage, and related seawater intrusion include the layering of the sediments, the potential connectivity of the coarse-grained deposits that allows deep percolation of recharge to replenish pumpage, and the potential barriers to groundwater flow or infiltration of recharge.”
Coarse-grained deposits that exist over large areas control and define the aquifer where
pumpage and related seawater intrusion occur (Hanson, 2003). The upper alluvial sediments include eolian, terrace, and fluvial deposits onshore and deltaic deposits offshore (Figure 2-2, Greene and Clark, 1979; Figure 2-4, Wagner et al., 2002; Dupré, 1975). Water wells in the Springfield Terrace subarea of the Pajaro Valley are widespread and generally tap the upper aquifer in the coastal area (Figure 3-4, Hanson, 2003). The upper Aromas Sand in the Pajaro Valley is considered to connect to the 180-foot aquifer in the Salinas Valley (Pressure subarea, Figure 3-1). The lower aquifer is mostly within the Aromas Sand (Johnson, 1982) and includes fluvial sand and gravels (Figure 3-5, Hanson, 2003). More widely-spaced wells pumping in the 300-600 ft interval tap the lower aquifer in the coastal area (Figure 3-4, Hanson, 2003). The lower aquifer may correspond to the 400-ft aquifer of the Salinas Valley.
The upper aquifer has seawater intrusion which intrudes at a depth near the coast of 100-
200 ft below sea level (Figure 3-2, Hanson 2003, quoting Johnson, 1982; Figure 3-3, PVWMA, 2000). Saline water has intruded through most of the coastal area north of Moss Landing (Figure 3-3, PVWMA, 2000), progressing farther east in the upper-aquifer system. Hydrologic modeling suggests that seawater intrusion occurs as a landward-thinning wedge of saline water within the major aquifer systems (Figure 3-3, PVWMA, 2000). The lower aquifer, in particular the lower Aromas Sand, might be considered as an area of potential seawater intrusion, but the data north of the Pajaro River show distinct zones of “older sea water” based on geochemical analysis (Figure 3-2, Hanson, 2003).

DeepWater Desalination Plant, Moss Landing, California Hydrogeological Literature Review and Analysis
EcoSystems Management Associates, Inc. 12 Technical Report ECO-M Reference No. 14-04
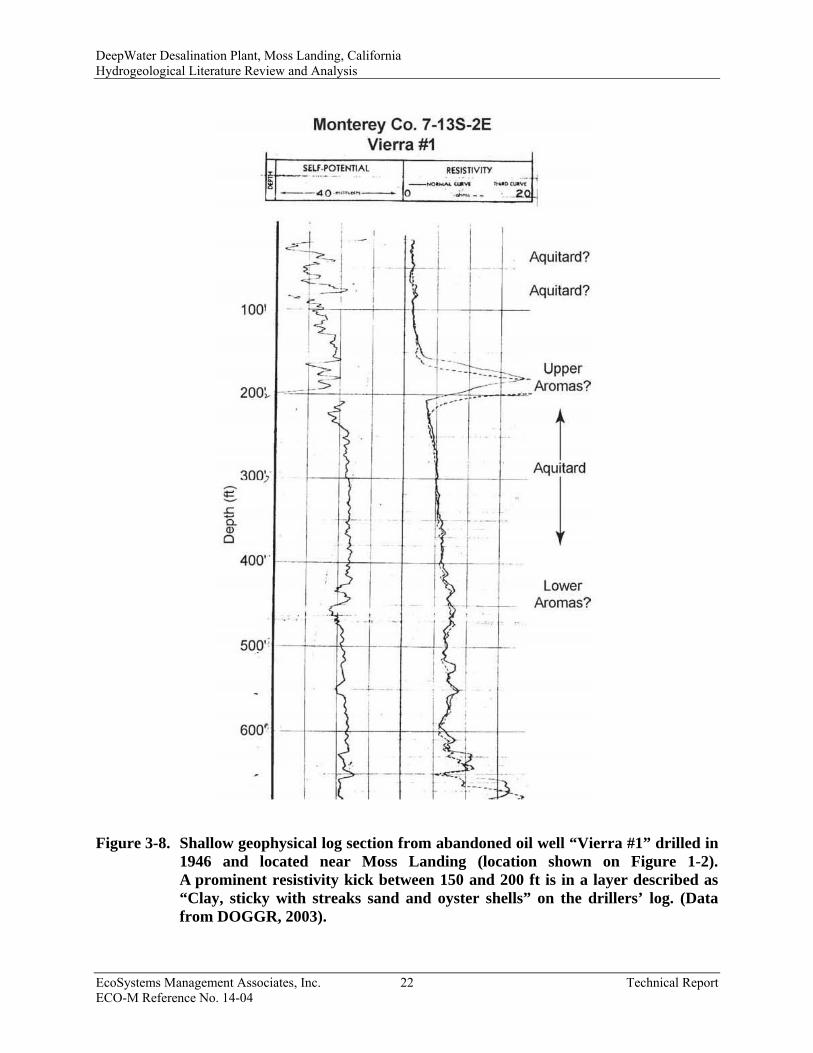
Large areas of fine-grained deposits have been mapped as a continuous layer in the Pajaro River floodplain (Hanson, 2003). However, drillers’ logs and geophysical logs from wells in the area show variable thickness of shallow fine-grained deposits (Figures 3-5 and 3-6, Hanson, 2003). Boreholes drilled by Caltrans for construction of the Highway 1 Bridge across Elkhorn Slough also show this complex layering of fine-grained and coarse-grained units in the shallowest deposits (Figure 3-7, SEI, 2006). Here at Moss Landing, a distinct fining-upward sequence is recognized and considered to represent the filling of the Elkhorn Valley paleochannel and onshore extension of Monterey Canyon as sea level rose following the last ice age. These fine-grained layers that separate the coarse-grained aquifers are called “aquitards” and appear to be laterally extensive parallel to the coast (Figure 3-2, Hanson, 2003; Figure 3-7, SEI, 2006). Massive fine-grained layers in the shallow subsurface near the Moss Landing area are exemplified in the well log from test hole PV-5 (Figure 3-6, Hanson, 2003) and from the abandoned oil well “Vierra #1” (Figure 3-8).
Surficial sediments in the area around Moss Landing include unconsolidated marine and
non-marine gravel, sand, silt, and clay deposits. Recently stabilized coarse-grained sand dunes that surround the salt marshes of Elkhorn Slough facilitate rapid penetration of water delivered by local storms. However, widespread layers of fine-grained material in the shallow alluvium and Aromas Sand create aquitards that limit recharge of the deeper aquifers. Deep saline waters encountered in wells of the Pajaro Valley represent recharge from thousands of years ago (Hanson, 2003). Layered strata in the coastal aquifer systems restrict vertical migration of water resulting in seawater intrusion that is vertically restricted. Rather than a wedge of saline water, discrete layers of coarse-grained water-bearing units from 10-150 feet thick accommodate the lateral migration of seawater (Hanson, 2003).
Seawater intrusion was recognized as early as 1943 in Santa Cruz and Monterey
Counties; seasonal pumping troughs of 15 ft below sea level were considered to drive the intrusion (California State Water Resources Board, 1953). The most extensive seawater intrusion has been in the aquifers from 100 to 200 ft depths below sea level, and less severe in the lower Aromas Sand (Muir, 1974). Long-term declines of groundwater levels in the Springfield Terrace subarea exceed 20 ft prior to the 1990s, and increasing water-level differences exceeding 10 ft are occurring in the Aromas Sand relative to shallow aquifers (well PV-4A, Figure 3-2, Hanson, 2003). Droughts exacerbate the decline in groundwater levels and may increase seawater intrusion. However, depressed groundwater levels in the coastal areas suggest that seawater intrusion may be unable to recharge the aquifer at depth if subsurface intakes for desalination plants are installed. The fine-grained layers that restrict vertical fluid movement for seawater intrusion would also restrict recharge of offshore aquifers with fresh seawater for desalination projects.
3.2 SALINAS VALLEY – PRESSURE SUBAREA, SOUTH OF ELKHORN SLOUGH
The principal aquifers within the Pressure subarea of the Salinas Valley are based on the
typical depth of the aquifer tapped by wells (Figure 3-1, MCWRA, 2003). The primary aquifer system is called the 180/400-Foot Aquifer Subbasin, which includes the lower reaches of the Salinas River and the coastal area south of Moss Landing. As stated in DWR Bulletin 118 (2004), “The northern boundary of the 180/400-Foot Aquifer Subbasin is shared with the Pajaro

DeepWater Desalination Plant, Moss Landing, California Hydrogeological Literature Review and Analysis
EcoSystems Management Associates, Inc. 13 Technical Report ECO-M Reference No. 14-04
Valley Groundwater Basin and coincides with the inland projection of a 400-foot deep, buried and clay-filled paleodrainage of the Salinas River. This acts as a barrier to groundwater flow between these subbasins (DWR, 1969; Durbin et al., 1978).”
Two main water-bearing units, the upper 180-Foot Aquifer and the lower 400-Foot
Aquifer, exist within the Aromas Sand with the names based on their average depth. A complex zone of interconnected sands, gravels, and clay lenses, varying from 50-150 feet in thickness and averaging 100 ft comprise the 180-Foot Aquifer (DWR, 2004). The 400-Foot Aquifer also consists of sand, gravel, and clay lenses with a greater average thickness of about 200 ft (DWR, 2004). As observed in the Pajaro Valley, the two main aquifers are separated by a zone of discontinuous aquifers and aquitards with thicknesses varying from 10 to 70 ft.
A near-surface water-bearing zone exists as a minor source of poor quality water, and
corresponds to the shallow alluvial aquifer in the Pajaro Valley north of Elkhorn Slough. The Dune Sand Aquifer within recent dune sands along the shoreline of Monterey Bay south of Moss Landing may correspond to the shallow alluvial aquifer. The Dune Sand Aquifer extends from the ground surface to 160 ft below mean sea level and consists of silty, fine to medium sand with some paleosols (ancient soil horizons) at various levels.
A deeper aquifer consisting of alternating layers of sand-gravel mixtures and clays, up to
900-ft thick, exists and is referred to as the 900-Foot or Deep Aquifer (DWR, 2004). The 400-Foot and 900-Foot aquifers are separated by a blue marine clay aquitard. The 900-Foot Aquifer may correspond to the Paso Robles Formation (Figure 2-2) or the Purisima Formation aquifer of the Pajaro Valley, which crops out on the south wall of Monterey Canyon offshore (Figure 2-1) at seafloor depths of 500-1000 ft. The 900-Foot Aquifer has been used to replenish groundwater from the 180-Foot and 400-Foot aquifers that were contaminated by seawater intrusion (Monterey County Planning Department, 2012). Massive fine-grained layers in the shallow subsurface south of Moss Landing are exemplified in the well log from the abandoned oil well “Pieri #1” (Figure 3-9).
According to DWR Bulletin 118 (2004), “Heavy pumping of the 180- and 400-Foot
Aquifers has caused significant seawater intrusion into both these aquifers, which was first documented in the 1930s (DWR, 1946). Groundwater flow in the northernmost subbasin has been directed from Monterey Bay inland since at least this time. By 1995, seawater had intruded over five miles inland through the 180-Foot Aquifer, including the area beneath the towns of Castroville and Marina. Seawater has also intruded over two miles into the 400-Foot Aquifer by 1995.” The Monterey County Water Resources Agency (MCWRA, 2003) mapped the time history of seawater intrusion within these two aquifers (Figures 3-10 and 3-11). Elongate “tongues” of intrusion appear to coincide with the surface stream channels and are likely to follow the buried Pleistocene paleochannels of the Salinas River. Seawater intrusion does not appear to have progressed farther inland along the south side of Elkhorn Slough, perhaps due to the fine-grained sediment layers that filled the Elkhorn Slough paleochannel; these may represent estuarine deposits similar to the modern sediments in Elkhorn Slough (basin deposits in Figure 2-4, Wagner et al., 2002). In contrast, seawater intrusion to the north in the Pajaro Valley does appear to reach farther inland along the north side of Elkhorn Slough (Figure 3-3). This

DeepWater Desalination Plant, Moss Landing, California Hydrogeological Literature Review and Analysis
EcoSystems Management Associates, Inc. 14 Technical Report ECO-M Reference No. 14-04
observation may indicate a more continuous coarse-grained aquifer to the north of Elkhorn Slough than there is to the south.
Continuing with DWR Bulletin 118, “Due to the impermeable nature of the clay aquitard
above the 180-Foot Aquifer, subbasin recharge (including that from precipitation, agricultural return flows, or river flow) is nil. Instead, recharge is from underflow originating in upper valley areas such as the Arroyo Seco Cone and Salinas River bed or the adjacent Eastside Subbasin, and more recently, from seawater intrusion. Historically, groundwater flowed from subbasins to the south and east through the subbasin and seaward to discharge zones in the walls of the submarine canyon in Monterey Bay (Durbin and others, 1978; Greene, 1970). With increased pumping in the adjacent Eastside Subbasin since the 1970s, groundwater flow is dominantly northeastward in the central and southern subbasin.”
If historical discharge zones of fresh groundwater were in the walls of the Monterey
Canyon, then one could infer that recharge for seawater intrusion is derived mainly from the canyon walls; vertical recharge from the seafloor into the 180-Foot Aquifer may be negligible. Careful mapping of the blue clay aquitard above the 180-Foot Aquifer would be necessary to identify the likely areas of seawater recharge. Hydrologic modeling would be necessary to determine what flow rates could be achieved for a desalination intake system. The observations of seawater intrusion over time may provide a calibration for the hydrologic modeling for the intake system.
According to the California Department of Water Resources (DWR Bulletin 160-93),
during the drought of 1987-1992, seawater intrusion rates accelerated due to “decreased ground water recharge and increased ground water extraction.” The current drought may create similar problems with increased rates of seawater intrusion. Some important questions arise: Would seawater extraction from subsurface intakes for desalination alleviate this problem? Would injection of brines resulting from desalination make the problem worse? Would denser brines flow seaward within the aquifer and act as a barrier to seawater intrusion? Or would that create greater depression of groundwater levels inland? In the absence of a natural barrier, like the Newport-Inglewood fault zone in the LA-Orange Counties region, would a line of injection wells to produce a barrier to seawater intrusion be infeasible?
3.3 DISCUSSION AND RECOMMENDATIONS
Careful hydrologic modeling and analysis must be conducted to evaluate the feasibility
and consequences of potential subsurface seawater intake systems. Abundant data exist onshore to describe the subsurface geology as described above, and there are abundant data farther offshore, >1-km to the seismic profiles (Figures 1-2 and 2-4) where the U.S. Geological Survey and other scientists have been mapping the Monterey Bay Marine Sanctuary. However, there are few subsurface data in the nearshore region where tidal currents, ocean waves, and littoral drift may have eroded and removed the fine-grained deposits. A layer of coarse material that may be well-suited for an offshore subsurface intake system may exist in the nearshore area.

DeepWater Desalination Plant, Moss Landing, California Hydrogeological Literature Review and Analysis
EcoSystems Management Associates, Inc. 15 Technical Report ECO-M Reference No. 14-04
Figure 3-1. Map showing the Salinas Valley Water Project in the vicinity of Moss Landing.
Modified from the Monterey County Water Resources Agency (MCWRA, 2003).
DeepWater Desalination Plant, Moss Landing, California Hydrogeological Literature Review and Analysis
EcoSystems Management Associates, Inc. 16 Technical Report ECO-M Reference No. 14-04
Figure 3-2. Cross-section showing relation between geology and selected water quality
attributes along the coast in the Pajaro Valley, Santa Cruz and Monterey Counties, California. Profile location is shown in Figure 2-3. (Source: Hanson, 2003).

DeepWater Desalination Plant, Moss Landing, California Hydrogeological Literature Review and Analysis
EcoSystems Management Associates, Inc. 17 Technical Report ECO-M Reference No. 14-04
Figure 3-3. Map and diagrams showing seawater intrusion within the Pajaro Basin.
Hydrologic modeling suggests that seawater intrusion occurs as a landward thinning wedge of saline water. (Source: PVWMA, 2000).

DeepWater Desalination Plant, Moss Landing, California Hydrogeological Literature Review and Analysis
EcoSystems Management Associates, Inc. 18 Technical Report ECO-M Reference No. 14-04
Figure 3-4. Map showing the distribution of pumping wells with depth to top of
perforations in the Pajaro Valley, California (modifed from Hanson, 2003). ML = Moss Landing.

DeepWater Desalination Plant, Moss Landing, California Hydrogeological Literature Review and Analysis
EcoSystems Management Associates, Inc. 19 Technical Report ECO-M Reference No. 14-04
Figure 3-5. Geophysical logs and well construction for selected monitoring wells and test
holes in the Pajaro Valley, Monterey County, California. (Source: Hanson, 2003) Well locations are shown in Figure 2-3.

DeepWater Desalination Plant, Moss Landing, California Hydrogeological Literature Review and Analysis
EcoSystems Management Associates, Inc. 20 Technical Report ECO-M Reference No. 14-04
Figure 3-6. Geophysical logs for selected monitoring wells and test holes in the Pajaro
Valley, Monterey County, California. (Source: Hanson, 2003) Well locations are shown in Figure 1-2.

DeepWater Desalination Plant, Moss Landing, California Hydrogeological Literature Review and Analysis
EcoSystems Management Associates, Inc. 21 Technical Report ECO-M Reference No. 14-04
Figure 3-7. Cross-section across Elkhorn Slough at the Highway 1 bridge based on Caltrans boreholes (Source: SEI, 2006).
Location of cross-section is shown on Figure 2-4.
DeepWater Desalination Plant, Moss Landing, California Hydrogeological Literature Review and Analysis
EcoSystems Management Associates, Inc. 22 Technical Report ECO-M Reference No. 14-04
Figure 3-8. Shallow geophysical log section from abandoned oil well “Vierra #1” drilled in 1946 and located near Moss Landing (location shown on Figure 1-2). A prominent resistivity kick between 150 and 200 ft is in a layer described as “Clay, sticky with streaks sand and oyster shells” on the drillers’ log. (Data from DOGGR, 2003).

DeepWater Desalination Plant, Moss Landing, California Hydrogeological Literature Review and Analysis
EcoSystems Management Associates, Inc. 23 Technical Report ECO-M Reference No. 14-04
Figure 3-9. Shallow geophysical log section from abandoned oil well “Pieri #1” drilled in
1949 and located near Moss Landing (location shown on Figure 1-2). (Data from DOGGR, 2003).

DeepWater Desalination Plant, Moss Landing, California Hydrogeological Literature Review and Analysis
EcoSystems Management Associates, Inc. 24 Technical Report ECO-M Reference No. 14-04
Figure 3-10. Seawater Intrusion in the Salinas Valley Groundwater Basin – 180-Foot Aquifer, August 6, 2012. (Source: Monterey County Water Resource Agency, http://www.MCWRA-CO.Monterey.ca.us)

DeepWater Desalination Plant, Moss Landing, California Hydrogeological Literature Review and Analysis
EcoSystems Management Associates, Inc. 25 Technical Report ECO-M Reference No. 14-04
Figure 3-11. Seawater Intrusion in the Salinas Valley Ground Water Basin – 400-Foot Aquifer, August 7, 2012. (Source: Monterey County Water Resource Agency, http://www.MCWRA-CO.Monterey.ca.us)
DeepWater Desalination Plant, Moss Landing, California Hydrogeological Literature Review and Analysis
EcoSystems Management Associates, Inc. 26 Technical Report ECO-M Reference No. 14-04
4.0 GROUNDWATER CHARACTERISTICS
4.1 STUDY AREA The Salinas River is the Central Coast’s largest river and has the fourth largest watershed
in California. Most rivers in California flow west or south. River water is used for irrigation. The river and the underground flow catch agricultural discharges, precipitation percolated through surface soils, and river and stream infiltration, all potential sources of contaminants. In considering subsurface intake systems for desalination plans, it is important to know the quality of the underground water in the vicinity of the plant.
A large database exists as a result of the Groundwater Ambient Monitoring and
Assessment program (GAMA) carried out by the U.S. Geological Survey (USGS), in collaboration with the California State Water Resource Control Board and Lawrence Livermore National Laboratory (LLNL). The GAMA program is a statewide groundwater quality monitoring and assessment program designed to help better understand and identify risks to groundwater resources (Hanson et al., 2002; RMC, 2006; Kulongoski and Belitz, 2007).
Groundwater quality in the approximately 1,000-square-mile Monterey Bay and Salinas
Valley study unit (Figure 4-1) was investigated in order to provide a spatial assessment of raw groundwater quality. Samples were collected from public-supply wells and monitoring wells. These wells were located in Monterey, Santa Cruz, and San Luis Obispo Counties.
The samples were analyzed for volatile organic compounds (VOCs), pesticides, nutrients,
metals, major and minor ions, trace elements, radioactivity, microbial indicators, and dissolved noble gases. Naturally occurring isotopes (tritium, carbon-14, helium-4, and the isotopic composition of oxygen and hydrogen) were also measured to help identify the source and age of the sampled groundwater.
Figure 4-2 shows the wells at Monterey Bay study area. Those wells located nearby
the coast at Moss Landing are most likely to impact the subsurface intake system of the desalination plant. The Monterey Bay (MSMB) study area extends from east of Santa Cruz south along Monterey Bay to the Forebay of the Salinas Valley. It covers approximately 450mi2 and includes most of the Quaternary sediment-filled basins in this area, which includes the Pajaro Valley, Carmel Valley, and the following subbasins of the Salinas Valley: 180/400- Foot Aquifer, Eastside Aquifer, Seaside Area, Langley Area, and Corral de Tierra Area.
The sampling stations penetrate several water-bearing geologic units. The geologic
units located to the north in the Pajaro Valley (Figure 4-1) are the Purisima Formation, the Aromas Sands, the Terrace Deposits, the Quarternary alluvium, and the Dune Deposits (Johnson et al., 1988). The geologic units located to the south are the Salinas Valley formations (Figure 4-1): the 180/400-Foot Aquifer and Langley Area subdivisions. The 180/400-Foot Aquifer also extends to the southeast and is referred to as the East Side Aquifer in Figure 4-1. To the south, the 180/400-Foot Aquifer joins the Forbay and Upper Valley aquifers located in the Salinas Valley groundwater basin.

DeepWater Desalination Plant, Moss Landing, California Hydrogeological Literature Review and Analysis
EcoSystems Management Associates, Inc. 27 Technical Report ECO-M Reference No. 14-04
4.2 SAMPLING Groundwater samples were collected and analyzed for the constituents listed on either the
fast, slow, or monitoring-well sampling schedules. Table 4-1 gives a summary list for the major parameters analyzed per sample for fast, slow and monitoring well schedules. A complete list of these analytes is given by Kulongoski and Belitz (2007). All wells were sampled between August and September 2005.
For the fast schedule, samples were collected at the well head using a foot-long length of
Teflon tubing. For the slow schedule, the samples were collected inside an enclosed flow-through chamber located inside a mobile laboratory and connected to the well head by a 10-50 ft length of the Teflon tubing. For the field measurements groundwater was pumped through a flow-through chamber fitted with a multi-probe meter that simultaneously measures pH, DO, temperature, conductivity, and turbidity.
4.3 RESULTS
The results presented here are for the 26 Monterey Bay sampling stations in the area
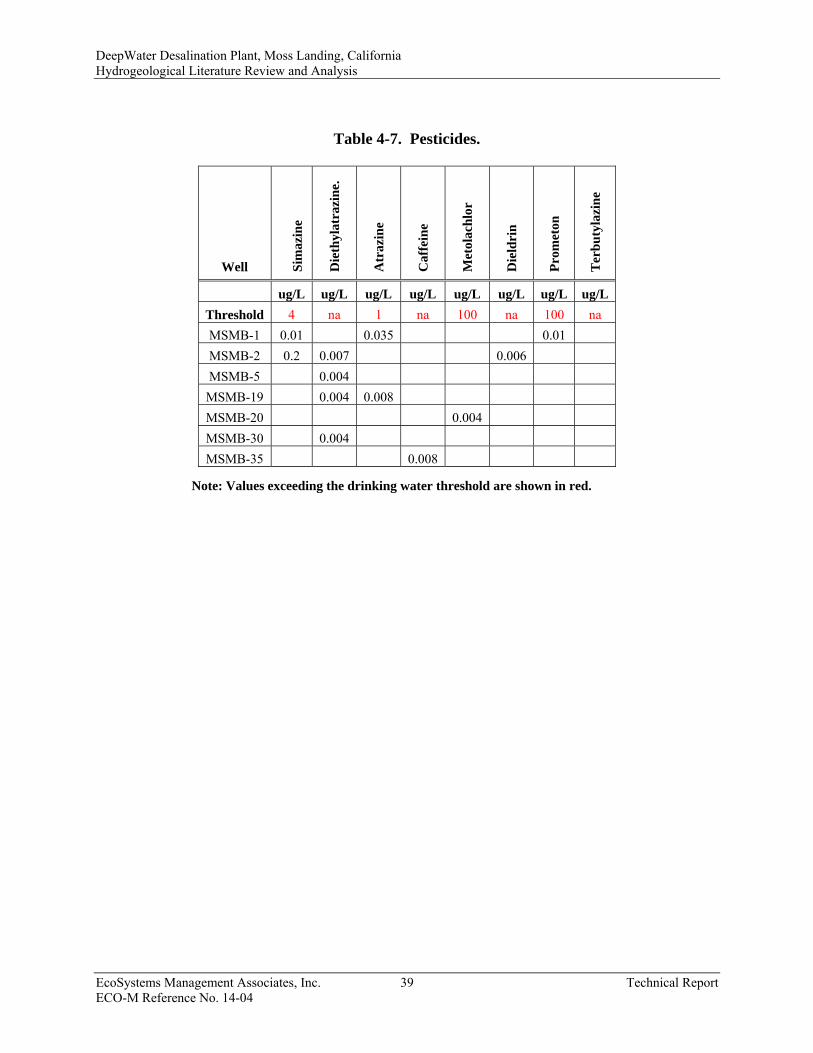
within 10 miles of the desalination plant (Figure 4-2). Table 4-2 presents the results of the water quality parameters; Table 4-3 shows the concentration of major and minor ions near the proposed plant; Table 4-4 lists nutrients, dissolved organic matter (DOC), and radio isotopes; Table 4-5 lists the trace elements; Table 4-6 lists volatile organic carbons and gasoline additives; and Table 4-7 lists the pesticides.
Tables 4-2 and 4-6 list the results for selected stations measured under the “fast” and
“slow” sampling schedule within 10 miles of the coast, while Tables 4-3, 4-4, 4-5, and 4-7 show the additional analytes measured under the monitoring program for selected stations.
Tables 4-2 through 4-7 show that there can be discrepancies between stations even
though they are all from within the same 10-mile radius. However, one should takes into account the fact that the area contains several aquifers of different origin with different geochemistries, and samples may be taken at different depths.
A second observation that can be made is that most of the measured analytes in Tables 4-
3 through 4-7 have values considerably below their threshold values (TV). The same can be said for two of the three radioisotopes measured (Table 4-4). Only Rn-222 is elevated above TV in many samples, and in the study zone, values range from 170 pC/L to 1,610 pC/L (TV = 300 pC/L). The human health effects of the higher levels are unknown.
The samples provide evidence of saltwater intrusion into the aquifers. Stations MSB4,
MSB17, MSB22, and MSB35 show conductivities above the TV of 900 u/s/cm. These observations are supported by higher Cl-and SO4= values. Three of the stations, MSB4, MSB22, and MSB35, all lie along the Pajaro River from the coast to 15 mi inland. Conductivity values above 700 uS/L characterize six stations in the same area (Figure 4-3). The lower threshold also points to another high-salinity cluster in the central portion of the studied area.

DeepWater Desalination Plant, Moss Landing, California Hydrogeological Literature Review and Analysis
EcoSystems Management Associates, Inc. 28 Technical Report ECO-M Reference No. 14-04
An additional comment may be made about atmospheric CO2(g) in the Monterey Bay zone. Pure water in equilibrium with the present atmosphere (pCO2 = 390 µatm) has a pH of about 5.5; the pH increases with increased alkalinity. Groundwater has a pH ≈ 7.5 because of its alkalinity. If pCO2 is calculated for a pH = 7.5 and an alkalinity of 300 mg/L (as CaCO3-Table 4-1), a value of ≈ 3,600 µatm is obtained, e.g., considerably above atmospheric CO2(g) (Pierrot and Wallace, 2006; Jahangir et al., 2012) and ultimately cause this gas to be vented to the atmosphere.

DeepWater Desalination Plant, Moss Landing, California Hydrogeological Literature Review and Analysis
EcoSystems Management Associates, Inc. 29 Technical Report ECO-M Reference No. 14-04
Figure 4-1. The Monterey Bay and Salinas Valley GAMA study unit, locations of study
areas, major cities, rivers, creeks, groundwater basins, and subbasins (Kulongoski and Belitz, 2007).

DeepWater Desalination Plant, Moss Landing, California Hydrogeological Literature Review and Analysis
EcoSystems Management Associates, Inc. 30 Technical Report ECO-M Reference No. 14-04
10 mi Figure 4-2. Monterey study area; public supply wells sampled are shown in black; flow-
path wells are shown in blue; monitoring wells 1-3 are shown in green. The oval highlights stations within ten miles of the coast.

DeepWater Desalination Plant, Moss Landing, California Hydrogeological Literature Review and Analysis
EcoSystems Management Associates, Inc. 31 Technical Report ECO-M Reference No. 14-04
Figure 4-3. Blue circles show wells where conductivity is >700 uS/L.

DeepWater Desalination Plant, Moss Landing, California Hydrogeological Literature Review and Analysis
EcoSystems Management Associates, Inc. 32 Technical Report ECO-M Reference No. 14-04
Table 4-1. Analyte list.
Schedule
Fast Slow Monitoring Well pH, conductivity, DO, and temperature Volatile organic compounds Gasoline additives Pesticides and pesticide degradates Chromium abundance and speciation Stable isotopes of hydrogen and oxygen Tritium Noble gases
Fast schedule analyte list, plus: Arsenic and iron speciation perchlorate, NDMA, 1,2,3-trichloropropane Nutrients and dissolved organic carbon Major and minor ions and trace elements Carbon isotopes Radium isotopes Radon-222 Gross alpha and beta radiation Microbial constituents
Fast schedule analyte list, plus: Perchlorate, NDMA, 1,2,3-trichloropropane Nutrients and dissolved organic carbon Major and minor ions and trace elements Arsenic and iron speciation Gross alpha and beta radiation

DeepWater Desalination Plant, Moss Landing, California Hydrogeological Literature Review and Analysis
EcoSystems Management Associates, Inc. 33 Technical Report ECO-M Reference No. 14-04
Table 4-2. Water quality parameters.
Well Mode Depth
Water Quality Parameters Turbid. DO pH Conduct. Alkal. Bicarb. Carbon.
NTU mg/L uS/cm mg/L mg/L mg/L
Threshold na na <6.5->8.5 900 na na na Sched. feet
MSMB-2 Fast 288 2.2 885 MSMB-3 Fast 1364 1.9 338 MSMB-4 Slow 800 0.1 0.1 8.1 1210 163 199 2 MSMB-5 Slow nd 7.8 397 MSMB-9 Slow 466 0.1 2.9 7.3 435 173 211 0 MSMB-10 Fast 600 4.3 708 MSMB-11 Fast 590 1.3 591 MSMB-12 Slow nd 0.2 0.2 8.8 538 135 161 2 MSMB-13 Fast 557 3.9 648 MSMB-16 Fast 552 4.1 651 MSMB-17 Fast 630 1.8 953 MSMB-18 Slow nd 0.1 3.5 7.3 499 138 168 0 MSMB-19 Fast 518 2.9 622 MSMB-20 Slow 177 0.2 0.9 7.3 753 300 366 0.5 MSMB-21 Fast nd 0.2 534 MSMB-22 Slow nd 0.1 0.1 7.4 985 311 378 0.8 MSMB-23 Fast nd 2.7 693 MSMB-24 Fast 600 7.5 555 MSMB-25 Fast nd 4.5 562 MSMB-26 Fast 650 2.7 777 MSMB-30 Slow 668 0.2 4 6.7 894 180 219 0 MSMB-31 Fast 619 5.2 595 MSMB-32 Fast 214 8.4 353 MSMB-33 Slow nd 0.3 1.4 7.2 567 148 180 0.2 MSMB-34 Fast 510 0.2 711 MSMB-35 Slow nd 0.2 7.3 1260 330 401 0.5 MSMB-36 Fast 640 0.4 568
Note: Values exceeding the drinking water threshold are shown in red.

DeepWater Desalination Plant, Moss Landing, California Hydrogeological Literature Review and Analysis
EcoSystems Management Associates, Inc. 34 Technical Report ECO-M Reference No. 14-04
Table 4-3. Major and minor ions.
Well
Major and Minor Ions Ca Mg K Na Br Cl- F- I- SiO2 SO4= TDS
mg/L mg/L mg/L mg/L mg/L mg/L mg/L mg/L mg/L mg/L mg/L
Threshold na Na na na na 250 2 na na 250 500 MSMB-4 40.2 52.4 16.9 112 1.01 241 0.1 0.015 31.2 61.9 658 MSMB-9 49.5 20.8 1.85 20.3 17 0.3 0.004 34 31.6 281 MSMB-12 15.4 0.64 3.78 1.3 0.42 123 0.1 0.049 39 46.4 446 MSMB-18 34.8 14.6 1.97 45.7 0.01 61.2 0.2 51.1 14.4 302 MSMB-20 78.9 32.7 2.53 39 0.28 31.3 0.2 0.008 37.5 54.3 464 MSMB-22 69.2 53.2 2.56 69.1 0.27 73.9 0.2 0.041 30.9 125 619 MSMB-30 84 30.9 2.21 58.4 0.38 112 0.3 0.002 45.5 88.1 547 MSMB-33 27.7 11 1.93 69.7 0.22 71.2 0.4 0.029 31.4 6.8 312 MSMB-35 100 57.9 2.36 89.5 0.92 98.2 0.3 0.03 31.5 216 828
Note: Values exceeding the drinking water threshold are shown in red.

DeepWater Desalination Plant, Moss Landing, California Hydrogeological Literature Review and Analysis
EcoSystems Management Associates, Inc. 35 Technical Report ECO-M Reference No. 14-04
Table 4-4. Nutrients and DOC and radioisotopes.
Well
Nutrients and DOC Radioisotopes NH3 DOC NO2 NO2+ TN PO4 Ra-228 Rn-222 Tritium mg/L mg/L mg/L mg/L mg/l mg/L pC/L pC/L pC/L
Threshold 30 na 1 10 na na 5 300 20000 MSMB-2 4.5 MSMB-4 0.011 0.37 300 2.2 MSMB-9 0.09 0.13 0.079 0.41 210 1.6 MSMB-12 0.5 0.4 0.55 0.013 0.61 1450 MSMB-18 0.3 0.67 0.7 0.057 0.7 360 MSMB-20 0.4 1.6 1.75 0.08 0.67 480 2.6 MSMB-22 1.8 0.014 0.48 250 MSMB-30 0.3 3.87 4 0.06 0.31 560 0.3 MSMB-33 0.4 0.005 1.52 1.55 0.039 0.58 1610 1.6 MSMB-35 0.07 1.8 0.17 0.048 0.29 170 8
Note: Values exceeding the drinking water threshold are shown in red.

DeepWater Desalination Plant, Moss Landing, California Hydrogeological Literature Review and Analysis
EcoSystems Management Associates, Inc. 36 Technical Report ECO-M Reference No. 14-04
Table 4-5a. Trace elements - A.
Well
Trace Elements - A Al Sb As Ba Be B Cd Cr Co Cu Fe
ug/L ug/L ug/L ug/L ug/L ug/L ug/L ug/L ug/L ug/L ug/L
Threshold 1000 6 10 1000 4 1000 5 50 na 1300 300 MSMB-2 MSMB-4 1 4 88 0.073 4.4 48 MSMB-9 0.9 0.6 26 0.059 0.4 18
MSMB-12 7 2.3 23 131 0.04 0.3 11 MSMB-18 1.4 51 32 0.03 13.1 0.059 0.7 MSMB-20 0.7 59 162 7.4 0.126 0.8 MSMB-22 1 0.56 96 463 0.02 0.07 0.161 90 MSMB-30 0.9 0.11 3.3 89 46 0.04 3.5 0.183 4 9 MSMB-33 0.39 7.3 87 168 0.07 0.2 0.127 0.2 87 MSMB-35 1 0.14 0.5 191 1.28 427 0.03 1.2 2 35
Note: Values exceeding the drinking water threshold are shown in red.

DeepWater Desalination Plant, Moss Landing, California Hydrogeological Literature Review and Analysis
EcoSystems Management Associates, Inc. 37 Technical Report ECO-M Reference No. 14-04
Table 4-5b. Trace elements - B.
Well
Trace Elements - B Pb Li Mn Hg Mo Ni Se Ag Sr Tl U V Zn
ug/L ug/L ug/L ug/L ug/L ug/L ug/L ug/L ug/L ug/L ug/L ug/L ug/L
Threshold 15 na 50 2 40 100 50 na 4000 2 30 50 5000 MSMB-2 MSMB-4 0.55 10.9 13.3 2.1 1.22 276 0.74 0.3 3 MSMB-9 0.25 13.2 0.6 5 1.8 0.9 248 0.5 3.7 6.5 MSMB-12 45 5.5 4.5 0.42 0.1 284 0.03 0.38 MSMB-18 0.14 16.1 0.9 1.35 0.9 239 0.91 12.6 0.8 MSMB-20 0.85 18.2 1.6 2.3 2.68 2 504 1.72 4.4 1.4 MSMB-22 12.8 60.8 4.2 1.41 698 2.38 4.8 0.9 MSMB-30 0.94 29 1.3 0.01 2.7 4.26 4.8 494 0.02 5.94 7.1 4.5 MSMB-33 0.46 5.8 208 42.6 0.87 0.2 245 0.21 1 4 MSMB-35 0.15 19.3 2410 3.7 7.24 0.1 699 1.35 3 6.6
Note: Values exceeding the drinking water threshold are shown in red.

DeepWater Desalination Plant, Moss Landing, California Hydrogeological Literature Review and Analysis
EcoSystems Management Associates, Inc. 38 Technical Report ECO-M Reference No. 14-04
Table 4-6. Volatile organic compounds.
Well Chl
orof
orm
Tet
rach
loro
ethe
.
Car
bon
Dis
ulfid
e
1,2,
4 T
rim
ethy
lb.
MT
BE
Tri
chlo
roet
he.
Bro
mod
ichl
oro
1,2-
dich
lo.e
thy.
C.T
etra
chlo
ride
Bro
mof
orm
Dib
rom
ochl
.me.
1,1D
ichl
oroe
ta.
1,1D
ichl
oroe
te
Eth
ylbe
nzen
e
T-B
utyl
benz
ene
Xyl
ene,
m&
p
Tra
ns-1
,2-D
ichl
.
ug/L ug/L ug/L ug/L ug/L ug/L ug/L ug/L ug/L ug/L ug/L ug/L ug/L ug/L ug/L ug/L ug/L
Threshold 80 10 160 330 13 5 80 6 0.5 80 80 1 1200 300 na 1750 10
MSMB-1 0.17 0.1
MSMB-2 0.17 0.48 0.1 0.06 0.08 0.1 0.01
MSMB-5 0.09 0.09 0.1 0.04 0.84 0.2 0.04 0.07
MSMB-8 0.02 0.03 0.03
MSMB-11 0.01
MSMB-13 0.08 0.43 0.8 0.38 0.03
MSMB-15 0.22
MSMB-16 0.04 0.04 0.41 0.04 0.06
MSMB-18 0.02 0.05
MSMB-20 0.07 0.24 0.23 0.56 0.02 0.02
MSMB-24 0.14 0.08 0.02
MSMB-29 0.02
MSMB-30 0.07 2.05 0.02 0.07
MSMB-31 0.02
MSMB-32 0.03
MSMB-33 0.12 0.02 Note: Values exceeding the drinking water threshold are shown in red.
DeepWater Desalination Plant, Moss Landing, California Hydrogeological Literature Review and Analysis
EcoSystems Management Associates, Inc. 39 Technical Report ECO-M Reference No. 14-04
Table 4-7. Pesticides.
Note: Values exceeding the drinking water threshold are shown in red.
Well Sim
azin
e
Die
thyl
atra
zine
.
Atr
azin
e
Caf
fein
e
Met
olac
hlor
Die
ldri
n
Prom
eton
Ter
buty
lazi
ne
ug/L ug/L ug/L ug/L ug/L ug/L ug/L ug/L Threshold 4 na 1 na 100 na 100 na MSMB-1 0.01 0.035 0.01 MSMB-2 0.2 0.007 0.006 MSMB-5 0.004 MSMB-19 0.004 0.008 MSMB-20 0.004 MSMB-30 0.004 MSMB-35 0.008

DeepWater Desalination Plant, Moss Landing, California Hydrogeological Literature Review and Analysis
EcoSystems Management Associates, Inc. 40 Technical Report ECO-M Reference No. 14-04
5.0 GEOLOGIC HAZARD ANALYSIS 5.1 EARTHQUAKE HAZARDS
Moss Landing is located within the lower Salinas Valley of central California adjacent to Monterey Bay and within the Coast Ranges structural province. The Santa Cruz Mountains form the northern boundary of the Salinas Valley, the Gabilan Range rise to the east and the rugged Santa Lucia Mountains rise to the south of Monterey Bay. The region lies on a major crustal sliver called the Salinian Block bounded by major faults of the San Andreas fault system. The Coast Ranges region has high seismicity (Figure 5-1), but the Moss Landing area has moderate seismicity with only about 506 earthquakes, Magnitude (M) > 3.5, occurring within 50 km of the subject site during the 104-yr interval between 1910 and 2013. Many smaller (<4.5) earthquakes in the early part of the 20th century were not located, but 289 earthquakes (M>3.0) were located in this area during the 18-yr interval between 1996 and 2013. There have been four moderate earthquakes striking the central Coast Ranges area since 1910 (Table 5-1) within about 50 km of the subject site. The July 1, 1911 event (Magnitude1 = 6.6) was associated with the Calaveras fault, caused slight damage (Modified Mercalli Intensity2 (MMI) = V-VI) in the Monterey Bay area. Two events located offshore on October 26, 1926 (Magnitude = 6.1 each) were damaging in the Monterey Bay area, especially at Santa Cruz. The October 18, 1989 Loma Prieta earthquake (Magnitude = 7.1) produced only moderate shaking damage (MMI = VII) in the Moss Landing area, but produced severe liquefaction and ground failure damage (Greene et al. 1991; Mejia, 1998; Dupré and Tinsley, 1998). The latter part of the 19th century saw substantially greater earthquake activity in the San Francisco Bay area, culminating in the 1906 San Francisco (Magnitude = 7.8) earthquake on the northern San Andreas fault. The San Francisco earthquake also produced severe liquefaction and ground failure in the Moss Landing area (Lawson, 1908)/ The activity in this region has again been building up with several moderate events occurring since about 1980, including the 1989 Loma Prieta earthquake. For a 10% chance of exceedance during a 50 year interval, earthquakes as large as M = 7.25 may be expected to strike within 50 km of the site, resulting in damaging levels of shaking.
Many active and potentially-active faults lie within 100 km of the subject site, and most
are capable of generating moderate to large (Magnitude > 6.5) earthquakes. Table 5-2 lists the more significant faults near the site. No California Earthquake Fault Rupture Zones are located in the Moss Landing area. For shaking and secondary ground failure hazards, the greatest threat to the subject site are active faults of the San Andreas fault system including the northern San Andreas and Calaveras fault located east of the site, and the San Gregorio fault located offshore to the west. The rates of earthquake activity for these major faults is high with moderate earthquakes (Magnitude = 5.5-6.5) striking every few decades, and large earthquakes (Magnitude > 6.5) striking at least once per century. The San Andreas fault is about eleven (11) miles east of the site. Other nearby faults including the Monterey Bay fault zone may sustain moderate earthquakes, but with lower recurrence frequency, perhaps several hundred or thousands of years between events. Scientists estimate the likelihood of a large earthquake (Magnitude > 6.7) along
1 Magnitude listed here is generally surface wave magnitude, MS, or moment magnitude MW for more recent events. 2 See Table 5-3.

DeepWater Desalination Plant, Moss Landing, California Hydrogeological Literature Review and Analysis
EcoSystems Management Associates, Inc. 41 Technical Report ECO-M Reference No. 14-04
the San Andreas fault, in the Santa Cruz Mountains region, at about 21% during the 30-year interval from 2000 to 2030 (WGCEP, 1999). At present, however, no one can predict when or where the next damaging earthquake will occur.
Because there are many active faults within 100 km of the site, the combined hazard from
all sources is estimated to pose shaking levels of about 38% of gravity at the site with the 10% chance of exceedance during a 50-year interval (NSHMP, 2002, 2008). This probability level corresponds to a 475-year average recurrence interval for this level of shaking. This level of shaking corresponds to Modified Mercalli Intensity (MMI) VIII. The Moss Landing area experienced shaking of MMI = VII during the 1989 Loma Prieta earthquake (Plafker and Galloway, 1989), with estimated Peak Horizontal Ground Acceleration (Pga) of 25% of gravity (Mejia, 1998). The site experienced shaking of MMI = VIII during the 1906 San Francisco earthquake. Damage from direct shaking effects for both events was minor. However, liquefaction-induced ground failure including settlement and lateral spreading destroyed the Moss Landing Marine Laboratories (Greene et al., 1991; Mejia, 1998; Dupré and Tinsley, 1998).
The subject site does not lie within any Alquist-Priolo Earthquake Fault Zone (EFZ).
Also, no Active Fault Near-Source Zones are located in the vicinity of the property according to the 1997 Uniform Building Code (no faults closer than 10 km).
5.2 LIQUEFACTION HAZARDS AND EFFECTS ON VERTICAL FLUID FLOW
Ground failure induced by liquefaction of water-saturated cohesionless soils and sensitive clays is typically caused by earthquake strong ground-motion, but may also be triggered during heavy flooding. The Moss Landing area has a high to very high susceptibility to liquefaction based on mapping by U.S. Geological Survey scientists (Dupré and Tinsley, 1980, 1998). Both the 1989 Loma Prieta (Magnitude = 7.1) and the 1906 San Francisco (Magnitude = 7.9) earthquakes triggered severe liquefaction-related ground failures (Figure 5-2, Dupre and Tinsley, 1998, modified from Green et al., 1991; Lawson, 1908; EERI, 1990; Mejia, 1998).
A large-scale lateral spread occurred following the 1989 earthquake that resulted in
slumping at the head of Monterey Canyon and destruction of the Moss Landing Marine Laboratory (Greene et al., 1991). An investigation of the liquefaction at Moss Landing determined that liquefaction occurred in loose to medium-dense sand at about 10- to 20-ft depth beneath the Moss Landing Marine Laboratory (Figure 5-3, Mejia, 1998). Seafloor geophysical surveys after the earthquake identified sand boils and possible mud volcanoes, evidence of submarine liquefaction in water depths of 9-12 m (30-40 ft) at the head of Monterey Canyon (Greene et al., 1991).
Liquefaction occurred at the Monterey Bay Aquarium Research Institute (MBARI)
technology building and pier, too. However, damage was minor. Mejia (1998) concluded that the pier and its pile foundations helped to buttress the liquefied soils and prevent larger deformations. Also, the settlement and permanent ground deformation at the MBARI technology building were small, which “suggest that limited liquefaction may have occurred in the medium-dense to dense sand underlying the building to about 25-ft depth.” (Mejia, 1998).

DeepWater Desalination Plant, Moss Landing, California Hydrogeological Literature Review and Analysis
EcoSystems Management Associates, Inc. 42 Technical Report ECO-M Reference No. 14-04
The subsurface profiles from the liquefaction investigations at Moss Landing show that layers of fine-grained material exist within the beach and dune sands of the shallow (<85-ft depth) deposits on the sand spit adjacent to the beach. Some liquefaction deformations appeared to have occurred within a clayey-silt and silty-sand layer. These fine-grained layers would tend to inhibit vertical fluid flow (recharge) to deeper aquifers. However, there were widespread and abundant sand blows (sand ejection cones and craters) that cut through the shallow fine-grained layers from the liquefied sands at depth. The sand injection dikes that connect the deeper sands to the surface would enhance downward flow of water, and therefore, enhance the recharge in areas where liquefaction has occurred.
5.3 LANDSLIDE HAZARDS
Most of the area around Moss Landing is relatively flat-lying, so that typical subaerial landslides are unlikely. Lateral spreads induced by liquefaction were discussed in the previous section. Erosion of levees and banks along the flanks of Elkhorn Slough and other inland waterways may occur during flood or tsunami inundation events. More significantly, submarine landslides at the head of Monterey Canyon may be destructive to seafloor installations such as intake pipelines. Several large slumps and landslides have been mapped in Monterey Canyon (Qls in Figure 2-4, Wagner et al., 2002). Greene et al (1991) describe the large (up to eight km2 with 6.3-m scarp – 21 ft) liquefaction-induced lateral spread at the head of Monterey Canyon that destroyed the Moss Landing Marine Laboratory. Such events would be destructive to seafloor installations that cross the unstable area.
5.4 TSUNAMI HAZARDS
The Monterey Bay coast is subject to tsunami attack from distant sources and from local sources. Distant sources are more frequent as the large trans-Pacific tsunamis are generated at major subduction zones around the Pacific Rim including Alaska, Japan, and South America. Local sources include large offshore earthquakes or submarine landslides, which may be triggered by earthquakes, major storms, or other seafloor disturbances including spring sapping from submarine ground-water seepage. The largest tsunami wave heights recorded in Monterey Bay were measured at the Monterey tide gauge (Figure 5-4) following the March 28, 1964 Alaska earthquake (Magnitude = 9.2). The initial wave raised the sea level above the tide about one meter (>3 ft), and subsequent waves showed peak-to-trough amplitudes of about 2.5 m (8.3 ft) that persisted for more than five hours. Recent tsunamis recorded at Monterey include the March 11, 2011, Tohoku, Japan (Magnitude 9.0) event at about 1.5 m peak-to-trough (5 ft) and the October 27, 2010 Chile (Magnitude 8.8) event at about 0.6 m peak-to-trough (2 ft). Tsunami wave activity from these extreme events persist for more than four days and may involve significant bottom currents. As described in the liquefaction section, the 1989 Loma Prieta earthquake triggered a submarine slump at the head of Monterey Canyon that destroyed the Moss Landing Marine Laboratory. The wave height measured at the Monterey tide gauge was about 0.4 m peak-to-trough (1.3 ft) arriving about 20 minutes after the earthquake origin time (Lander et al., 1993).

DeepWater Desalination Plant, Moss Landing, California Hydrogeological Literature Review and Analysis
EcoSystems Management Associates, Inc. 43 Technical Report ECO-M Reference No. 14-04
The State of California has published Tsunami Inundation Maps for emergency planning along the populated coastal areas (CalEMA, 2009). The map for the Moss Landing 7.5-minute quadrangle shows inundation over most of the low-lying coastal areas and up into the Elkhorn Slough. The estimated wave heights above mean sea level are about ten feet, which is comparable to the predictions made by Garcia and Houston (1975). Their estimates were 6.0 ft for the 100-yr and 11.7 ft for the 500-yr recurrence intervals. The CalEMA tsunami inundation maps do not have a probability specified and represent all types of sources, distant and local, that were modeled by the USC Tsunami Research Center. Although wave height may be small compared to the disastrous waves observed in Alaska, Hawaii, Japan, and Sumatra, very strong currents that affect the entire water column due to the long-period wave character may be destructive for tsunami attack in California. Dr. Mark Legg measured currents of four knots in the Santa Ana River mouth from the 2011 Tohoku tsunami and was told by LA County sheriff’s deputies that 14 knot currents were observed at the entrance to King Harbor, Redondo Beach from that event. The San Diego Harbor police reported that severe scour to the pilings of their boat docks was observed following the 2011 tsunami and one of their rubber pilot boats was ripped apart by being dragged beneath the floating dock due to the strong currents almost six hours after the first wave arrival. Such currents may be amplified at the head of Monterey Canyon offshore and could be damaging to seafloor pipelines or other structures.

DeepWater Desalination Plant, Moss Landing, California Hydrogeological Literature Review and Analysis
EcoSystems Management Associates, Inc. 44 Technical Report ECO-M Reference No. 14-04
Figure 5-1. Map showing earthquake epicenters (seismicity) and major faults in the
vicinity of Moss Landing, California. (Epicenters from the Northern California Seismograph Network; fault traces from the California Geological Survey, 2000).

DeepWater Desalination Plant, Moss Landing, California Hydrogeological Literature Review and Analysis
EcoSystems Management Associates, Inc. 45 Technical Report ECO-M Reference No. 14-04
Figure 5-2. Map showing distribution of liquefaction-induced ground failures in the Moss
Landing area following the October 18, 1989 Loma Prieta earthquake. (Source: Dupré and Tinsley, 1998, modified from Greene et al., 1991).

DeepWater Desalination Plant, Moss Landing, California Hydrogeological Literature Review and Analysis
EcoSystems Management Associates, Inc. 46 Technical Report ECO-M Reference No. 14-04
Figure 5-3. CPT profiles of the subsurface deposits at the Moss Landing Marine
Laboratory where liquefaction occurred following the 1989 Loma Prieta earthquake. The two profiles cross the sand spit on each side of the building which was located immediately south of the bridge that crossed from the mainland to the sand spit (see Figure 5-2) (Source: Mejia, 1998).

DeepWater Desalination Plant, Moss Landing, California Hydrogeological Literature Review and Analysis
EcoSystems Management Associates, Inc. 47 Technical Report ECO-M Reference No. 14-04
Figure 5-4. Marigram from the Monterey Tide Gauge showing the first 12 hours of the
tsunami from the Prince William Sound, Alaska, Good Friday earthquake of March 28, 1964. (Source: Lander et al., 1993).

DeepWater Desalination Plant, Moss Landing, California Hydrogeological Literature Review and Analysis
EcoSystems Management Associates, Inc. 48 Technical Report ECO-M Reference No. 14-04
Table 5-1. Significant historical earthquakes affecting the Monterey Bay area.
Year Mon Day Time
(UTC) Lat Lon MS MMI (max) Fault or Zone
1800 Oct 11 36.9 121.6 VII Near San Juan Bautista
1857 Jan 9 16:24 35.7 120.3 7.9 X San Andreas (South-Central)
1865 Oct 8 20:46 37.2 121.9 6.3 VIII San Andreas (Sta Cruz Mtns)
1870 Feb 17 20:12 37.2 122.1 5.8 VII Near Santa Cruz
1882 June 27 13:32 37.2 122.0 VII Near Santa Cruz
1883 Mar 30 15:45 36.9 121.6 5.6 VII Near Gilroy (Calaveras?)
1885 Mar 31 7:56 36.7 121.3 5.5 VII South of Hollister
1890 Apr 24 11:36 36.9 121.6 6.0 VIII San Andreas? (Corralitos)
1897 June 20 20:14 37.0 121.1 6.2 VIII Calaveras (Near Gilroy)
1899 Apr 30 22:41 36.9 121.7 5.6 VII Near Watsonville
1899 July 6 20:10 37.2 121.5 5.8 VII North of Watsonville
1906 Apr 18 13:12 37.7 122.5 7.8 XI San Andreas (North)
1910 Mar 11 6:52 36.9 121.8 5.8 VI Near Watsonville
1911 July 1 22:00 37.2 121.8 6.6 VIII Near Coyote (Sta Clara Co.)
1926 Oct 22 12:35 36.6 122.4 6.1 VII Offshore Monterey
1926 Oct 22 13:35 36.6 122.2 6.1 VII Offshore Monterey
1939 June 24 13:02 36.8 121.4 5.5 VII Southwest of Hollister
1949 Jan 1 1:18 36.9 121.6 4.5 VII Near Watsonville
1949 Mar 9 12:29 37.0 121.5 5.2 VII Near Hollister
1954 Apr 25 20:33 36.9 121.7 5.3 VIII East of Watsonville
1959 May 26 15:58 36.7 121.6 4.6 VI Near Salinas
1961 Apr 9 7:26 36.7 121.3 5.5 VII South of Hollister
1966 June 28 4:26 36..0 120.5 6.0 VII San Andreas (Parkfield)
1979 Aug 6 17:05 37.1 121.5 5.9 VII Calaveras (Coyote Lake)
1984 Apr 24 21:15 37.3 121.7 6.2 VIII Calaveras (Morgan Hill)
1989 Oct 18 0:04 37.0 121.9 7.1 IX San Andreas? (Loma Prieta)

DeepWater Desalination Plant, Moss Landing, California Hydrogeological Literature Review and Analysis
EcoSystems Management Associates, Inc. 49 Technical Report ECO-M Reference No. 14-04
Table 5-2. Major faults affecting the Moss Landing area (within 100 km of site).
No. Fault Name and Type Date of Last
Major Event M
max Distance
(km) Slip Rate (mm/yr)
1 Zayante-Vergeles [SS] 7.0 12.2 0.1 2 Monterey Bay [SS?] 6.5 12.8 0.5 3 San Andreas [SS] - North Section 1906 [M=7.8] 8.1 17.8 17 4 Sargent-Berrocal [SS] 7.1 22 3 5 Riconada [SS] 7.5 30 3
6 Calaveras [SS] 1911,1979, 1984 6.8 33 15
7 Paicines [SS] 6.7 33 15 8 San Gregorio [SS] 7.2 33 3-7 9 Quien Sabe [SS] 6.4 39 1
10 Butano [SS] 6.5 39 ? 11 Monte Vista-Shannon [T] 6.7 45 0.4 12 Hayward [SS] 1836,1868 7.5 52 9 13 San Benito [SS] 6.7 54 ? 14 San Joaquin [T] 6.6 60 1.1 15 Ortigalita [SS] 7.1 63 1 16 Hosgri [SS] 7.5 60 2.5 17 Greenville [SS] 1980 6.6 68 2 18 O’Neill [T?] 6.5 69 1.1
Faults in Bold Type are the closest to the subject site.

DeepWater Desalination Plant, Moss Landing, California Hydrogeological Literature Review and Analysis
EcoSystems Management Associates, Inc. 50 Technical Report ECO-M Reference No. 14-04
Table 5-3. Modified Mercalli Intensity Scale (1931)
I. Not felt. Marginal and long-period effects of large
earthquakes. II. Felt by persons at rest, on upper floors, or favorably placed. III. Felt indoors. Hanging objects swing. Vibration like passing of
light trucks. Duration estimated. May not be recognized as an earthquake.
IV. Hanging objects swing. Vibration like passing of heavy
trucks; or sensation of a jolt like a heavy ball striking the walls. Standing motor cars rock. Windows, dishes, doors rattle. Glasses clink. Crockery clashes. In the upper range of IV wooden walls and frame creak.
V. Felt outdoors; direction estimated. Sleepers wakened. Liquids
disturbed, some spilled. Small unstable objects displaced or upset. Doors swing, close, open. Shutters, pictures move. Pendulum clocks stop, start, change rate.
VI. Felt by all. Many frightened and run outdoors. Persons walk
unsteadily. Windows, dishes, glassware broken. Knickknacks, books, etc., off shelves. Pictures off walls. Furniture moved or overturned. Weak plaster and masonry D cracked. Small bells ring (church, school). Trees, bushes shaken (visibly, or heard to rustle).
VII. Difficult to stand. Noticed by drivers of motor cars. Hanging
objects quiver. Furniture broken. Damage to masonry D, including cracks. Weak chimneys broken at roof line. Fall of plaster, loose bricks, stones, tiles, cornices (also unbraced parapets and architectural ornaments). Some cracks in masonry C. Waves on ponds; water turbid with mud. [Small slides and caving in along sand or gravel banks.]! Large bells ring. Concrete irrigation ditches damaged.
VIII. Steering of motor cars affected. Damage to masonry C; partial collapse. Some damage to masonry B; none to masonry A. Fall of stucco and some masonry walls. Twisting, fall of chimneys, factory stacks, monuments, towers, elevated tanks. Frame houses moved on foundations if not bolted down; loose panel walls thrown out. Decayed piling broken off. Branches broken from trees. [Changes in flow or temperature of springs and wells. Cracks in wet ground and on steep slopes.]
IX. General panic. Masonry D destroyed; masonry C
heavily damaged, sometimes with complete collapse; masonry B seriously damaged. (General damage to foundations.) Frame structures, if not bolted, shifted off foundations. Frames racked. Serious damage to reservoirs. Underground pipes broken. [Conspicuous cracks in ground. In alluviated areas sand and mud ejected, earthquake fountains, sand craters.]
X. Most masonry and frame structures destroyed
with their foundations. Some well-built wooden structures and bridges destroyed. Serious damage to dams, dikes, embankments. [Large landslides.] Water thrown on banks of canals, rivers, lakes, etc. [Sand and mud shifted horizontally on beaches and flat land. Rails bent slightly.]
XI. [Rails bent greatly. Underground pipelines
completely out of service.] XII. Damage nearly total. [Large rock masses
displaced. Lines of sight and level distorted.] Objects thrown into the air.
*Abridged and Modified by C. F. Richter, 1958, Elementary Seismology: W. H. Freeman and Company, San
Francisco, p. 137-138. ! Bracketed items describe ground failure effects which are less reliable for shaking intensity measurement.
Masonry A. Good workmanship, mortar, and design; reinforced, especially laterally, and bound together by using steel, concrete, etc.; designed to resist lateral forces. Masonry B. Good workmanship and mortar; reinforced, but not designed in detail to resist lateral forces.
Masonry C. Ordinary workmanship and mortar; no extreme weaknesses like failing to tie in at corners, but neither reinforced nor designed against horizontal forces. Masonry D. Weak materials, such as adobe; poor mortar; low standards of workmanship; weak horizontally.

DeepWater Desalination Plant, Moss Landing, California Hydrogeological Literature Review and Analysis
EcoSystems Management Associates, Inc. 51 Technical Report ECO-M Reference No. 14-04
6.0 SUB-SURFACE INTAKE SYSTEMS 6.1 TYPES OF SUBSURFACE INTAKE SYSTEMS
While surface intake systems for seawater reverse osmosis (SWRO) desalination plants may improve feed water quality in some cases, the feasibility of subsurface intake systems for desalination plants depends on the local hydrological conditions, site location and available space, engineering concerns, hazards, and the proposed capacity of SWRO plans (Missimer et al., 2013; Dietrich, 2013).
Subsurface intake systems for desalination plants is evolving technology having the
advantage of no impacts to ocean environment in the form of entrainment or impingement to marine life; however, they have a short history and few successful surface intakes are in operation worldwide in comparison to open ocean intake plants.
There are a number of different types of subsurface systems that can be used: (1) vertical
beach wells; (2) Ranney collector wells; (3) horizontal directionally drilled (HDD) wells; (4) slant wells; (5) beach infiltration galleries; and (6) offshore infiltration galleries.
Missimer et al. (2013) provide a good summary and discussion of various subsurface
intake systems. An overview of desalination plant intake alternatives is also given in Water Reuse Association (2011) and Dietrich (2013). Figure 6-1 summarizes the various types of subsurface intake systems from Missimer et al. (2013).
The selection of an appropriate intake system depends on geological and geotechnical
characteristics of the site, engineering and construction of the subsurface intake system as facilities, possible impacts on the ground water, nearby wetlands and agricultures, reliability of the system and costs.
6.2 ADVANTAGES AND DISADVANTAGES Advantages
• Subsurface intakes have no impacts to the ocean environment in the form of
entrainment or impingement to marine life. • The need for pretreatment (in the case of well feedwater supply), is significantly
reduced . • Land water well technology has a very well developed technology over the last 70
years. Application of this technology to vertical wells, Ranney Wells, HDD wells and slant wells may ensure success of supply and the ability to maintain the supply with minimum maintenance, which is a major issue for such systems.
• Beach wells, Ranney Wells, HDD wells and slant wells have no ocean construction impacts.
• Beach wells, Ranney Wells, HDD wells and slant wells tapping subsea or near shore aquifers provide natural filtration of organic matter and suspended sediment,

DeepWater Desalination Plant, Moss Landing, California Hydrogeological Literature Review and Analysis
EcoSystems Management Associates, Inc. 52 Technical Report ECO-M Reference No. 14-04
particularly during storm surges and periods of heavy precipitation and surface runoff.
• Both slant and vertical well intake systems can be completely buried such that there are no visible structures at the land surface, offering an acceptable solution to environmental concerns.
Disadvantages
• Research has shown that subsurface intake systems are site specific and a system
which may work in one environment (and country) may or may not be successfully applied to other areas. As local geologic, hydrologic, oceanographic, and environmental conditions vary widely, success or failure of a particular system may also vary widely.
• Use of subsurface intake systems is an emerging technology with a relatively short history.
• All subsurface intake systems (wells and galleries) are in a minority as compared to open ocean intakes. As such, only a handful of successful subsurface intakes are in operation worldwide.
• In some coastal areas, obtaining permits is the number one constraint in constructing a near shore or offshore subsurface feedwater supply.
• Many of the operational intakes worldwide do not have the same stringent environmental requirements as required in the United States and especially along the coast of California.
• During construction, visual impacts may include unsightly facilities on the beach or in near shore areas where recreational or other high use occur.
6.3 DATA FROM SELECTED SUBSURFACE INTAKE SYSTEMS IN OPERATION
Information from worldwide desalination plants utilizing subsurface well intake systems are summarized in Table 6-1. Table 6-1 gives the name of the desalination plant: its location, the volume of the feed water supply (mgd), the number of the wells and the source of the information. On average the mean feed water supply from wells for desalination plants in operation is 14 mgd. The average number of wells per desalination plant is about 10.
The data is presented graphically in Figure 6-2. Figure 6-3 gives the average feed water
supply per well for each desalination plant. The mean feed water supply per well is about 1.3 mgd/well with a maximum feed water supply of 4 mgd/well.
There is one offshore infiltration gallery currently in operation, at Fukoka desalination
plant in Japan. This plant was begun in 2001 and became operational in 2005. The subsurface intake feed water supply is 27.2 mgd. The cost was approximately $400 million. This plant uses an Infiltration Gallery of perforated pipes below the seabed to draw in seawater (Figure 6-1). The Infiltration Gallery is located approximately 2100 ft offshore at a depth of 38 ft. The infiltration gallery is approximately 215,000 square feet in size. It has approximately 3 meters of engineered sand and crushed stone around the pipes. The sand has a D10 size of 0.4 mm. The infiltration

DeepWater Desalination Plant, Moss Landing, California Hydrogeological Literature Review and Analysis
EcoSystems Management Associates, Inc. 53 Technical Report ECO-M Reference No. 14-04
gallery was located in an area of the Genkai Sea where there is continual gentle wave action such that sand is neither eroded nor deposited in any significant amounts. The SDI of the seawater was between 4.3 and 5.7, but it decreased to 2 once it flows through the sand/crushed stone filter surrounding the perforated pipes. The feed water is filtered by an ultrafiltration membrane prior to entering the RO plant (www.niph.go.jp/soshiki/suido/pdf/h21JPUS/abstract/r9-2.pdf; Dietrich, 2013).

DeepWateHydrogeol
EcoSystemECO-M Re
Hori
Verti
r Desalination logical Literatu
ms Managemeneference No. 1
zontal Wells
ical Beach W
Plant, Moss Lure Review and
nt Associates, I4-04
Figure 6-1.
s
Well
anding, Califod Analysis
Inc.
Selected su
Ranney
rnia
54
ubsurface in
Radial
Slant W
y Collector W
ntake well s
Collector W
Well
Well
systems.
Well
Technical RReport

DeepWater Desalination Plant, Moss Landing, California Hydrogeological Literature Review and Analysis
EcoSystems Management Associates, Inc. 55 Technical Report ECO-M Reference No. 14-04
*Slant well
Figure 6-2. Feed water supply (mgd) and number of wells for each desalination plant presented in Table 6-1.

DeepWater Desalination Plant, Moss Landing, California Hydrogeological Literature Review and Analysis
EcoSystems Management Associates, Inc. 56 Technical Report ECO-M Reference No. 14-04
*Slant well
Figure 6-3. Average well feed water supply (mgd) for each desalination plant presented in Table 6-1.

DeepWater Desalination Plant, Moss Landing, California Hydrogeological Literature Review and Analysis
EcoSystems Management Associates, Inc. 57 Technical Report ECO-M Reference No. 14-04
Table 6-1. Selected subsurface beach well intake systems for seawater desalination
currently in operation.
Site No.
Desalination Plant Location Feed Water
Supply (MGD)Number of Wells
Source of Information
1 Al-Birk Saudi Arabia 2.3 3 Missimer et al., 2013 2 Alicante II Alicante, Spain 34.3 30 Missimer et al., 2013 3 Aruba SWRO-2 Aruba 12.4 14 Dietrich, 2013 4 Arucas-Moya Gran Canaria 2.1 1 Bartak et al., 2012 5 Bajo Almanzora Almeria, Spain 31.7 14 Missimer et al., 2013 6 Bay of Palma Mallorca, Spain 23.7 16 Missimer et al., 2013
7 Blue Hills New Providence Island 14.4 12 ? Missimer et al., 2013
8 Britannia Grand Cayman 1.4 4 Missimer et al., 2013 9 Dahab Red Sea, Egypt 6.6 15 Missimer et al., 2013
10 Dana Point Dana Point, CA 3.0 1 a Bartak et al., 2012 11 Ghar Lapsi Malta 11.9 18 Missimer et al., 2013 12 Ibiza Spain 4.0 8 Missimer et al., 2013 13 Lanzarote IV Canary Islands 15.9 11 Missimer et al., 2013 14 Lower Valley Grand Cayman 2.1 3 Missimer et al., 2013 15 Morro Bay Morro Bay, CA 1.2 5 Dietrich, 2013
16 Nuweiba City Sinai, Egypt 2.6 8 Djebedjian et al., 2007
17 Pemex Refinery Salina Cruz, Mexico 11.9 3 b Bartak et al., 2012
18 San Pedro del Pinatar Spain 39.6 10 c Bartak et al., 2012
19 Sand City Sand City, CA 0.6 4 Water-technology.net
20 Santa Cruz de Tenerife Canary Islands 13.2 8 Missimer et al., 2013
21 SAWACO Jeddah, Saudi Arabia 8.3 10 Missimer et al., 2013
22 Soslaires Canarias Gran Canaria 2.6 3 Rybar et al., 2005 23 Sur Oman 58 32 Dietrich, 2013 24 Tordera Blanes, Spain 33.8 10 Missimer et al., 2013
25 Turks & Caicos Water Co. Turks and Caicos 6.1 6 Missimer et al., 2013
26 WEB Aruba 21.1 10 Missimer et al., 2013 Mean 14.0 9.9
Notes: a = Installed well is a Slant Well b = 3 Rainey Collector Wells being used for intake c = 10 Horizontal Wells being used for intake

DeepWater Desalination Plant, Moss Landing, California Hydrogeological Literature Review and Analysis
EcoSystems Management Associates, Inc. 58 Technical Report ECO-M Reference No. 14-04
7.0 SUMMARY AND CONCLUSIONS
1. Major coarse-grained aquifers exist at about 180 ft and 400 ft below sea level in the
coastal zone near Moss Landing. A shallow aquifer in alluvium, eolian, and older dune sands
also exists along the coastal zone and has been considered as a saltwater source for a subsurface
intake system.
2. Seawater intrusion has occurred in these aquifers since at least the 1930s. In the Moss
Landing area, saline water has reached farther (1.75-2.5 miles) inland in the upper (180-Foot, or
upper Aromas Sand) aquifer, and not as far (0.75-1.2 miles) in the lower (400-Foot, or lower
Aromas Sand) aquifer. Thus, seawater transport from offshore to inland areas occurs by lateral
flow within the aquifers. Rates of fluid flow and the character of saline water may be determined
from pump tests in monitoring wells in the coastal zone.
3. Layers of fine-grained deposits between and within the major aquifers form aquitards that
limit the vertical flow and recharge of the major aquifers. Recharge of groundwater into the 180-
Foot Aquifer is from underflow originating in upper valley areas, which demonstrates the
impermeable nature of shallow aquitards. The depth of saline water observed in coastal wells is
vertically restricted and not continuous throughout the main aquifer deposits. Therefore, vertical
recharge of seawater into deeper aquifers is restricted and may be insufficient for a large-scale
desalination plant subsurface intake system.
4. As described in Section 5, natural hazards, including the strong ground motion of
earthquakes, liquefaction-induced ground failures, submarine landslides, and potential tsunami or
storm surges, pose significant risks, including damaged intake systems and disrupted operations.
Subsurface intake systems would be more difficult and costly to repair than seabed intake
systems, which would result in the limited availability of source water for months. Existing data
published by the U.S. Geological Survey (earthquake.usgs.gov/hazards), California Geological
Survey (http://www.consrv.ca.gov/CGS/Pages/Index.aspx), and other sources (Greene et al.,
1991; Dupre and Tinsley, 1998) are available to quantify the risks posed by these hazards.
Additional data are necessary to map the seafloor hazards in the nearshore zone where the
proposed intake system would be constructed.
5. The construction and operation of a subsurface intake system in or near the Monterey

DeepWater Desalination Plant, Moss Landing, California Hydrogeological Literature Review and Analysis
EcoSystems Management Associates, Inc. 59 Technical Report ECO-M Reference No. 14-04
Canyon may impact the stability of the canyon edges. Disturbance of the saturated cohesionless
sediments on the seafloor and shallow sub-bottom may trigger liquefaction and downslope
movement that could damage or destroy the intake system. It is known that spring sapping of
groundwater in unconsolidated sediments along submarine slopes may trigger slope failure.
6. A borehole drilled by Cal Am at Moss Landing during 2013 found “intermittent clay
layers mixed with silt and fine sand, without enough continuous sand layers to use any type of
subsurface intake system efficiently” (“Monterey boreholes reveal good slant-well conditions,”
The International Desalination & Water Reuse Quarterly website, 5 January 2014). Promising
sites where boreholes have shown highly favorable conditions for subsurface slant well locations
are located south of the Salinas River in the area of dune sands. Similar dune sands exist along
the coast in a small area north of the Pajaro River. However, due to the variable layers of fine-
grained material without continuous sand layers, the coastal sediments at Moss Landing appear
to be unsuitable for subsurface intake systems.
7. Subsurface intake systems are newly evolving technologies, and at present are suitable
only for small desalination plants (about 10 mgd) unless very special hydrogeological conditions
exist. Their success requires site-specific hydrogeological conditions relative to the recharge rate,
water quality, engineering concerns, geological hazards, maintenance, reliability, and economic
concerns.
8. Results from 26 operating desalination plants (Figures 6-2 and 6-3) that are using
subsurface intake systems show that the maximum well production was 3.98 mgd. The average
production of the wells from these plants was 1.5 mgd. These subsurface intake systems were
located within different sediment types and grain sizes, which yield differing amounts of raw
seawater. Based on this production range, approximately 20 to 37 wells will be required at Moss
Landing to reliably and continuously produce the 51.6 mgd of raw seawater that would enable
the production of the design capacity of 22.3 mgd of desalinated water.
9. Hydrologic modeling of the aquifer systems in the vicinity of Elkhorn Slough was used to
estimate the leakage at about 3,000 to 5,000 acre-feet per year (2.7 to 4.5 mgd) of seawater into
the groundwater system (Fugro, 1995). About 20 percent of this value is due to horizontal flow
(seawater intrusion) and the rest to vertical leakage from Elkhorn Slough (Fugro, 1995). In order

DeepWater Desalination Plant, Moss Landing, California Hydrogeological Literature Review and Analysis
EcoSystems Management Associates, Inc. 60 Technical Report ECO-M Reference No. 14-04
to sustain a 50 mgd desalination plant, the recharge area or infiltration rates must be increased by
at least one order-of-magnitude. A summary of Fugro (1995) study is presented in Appendix A.
10 A larger area covered by seawater exists offshore and adjacent to the Monterey Canyon.
If the shallow alluvial basin (paleochannel) has similar layering of coarse-grained aquifers
interbedded with low-permeability clays and silts, as are found in wells onshore (Fugro, 1995),
then the area for vertical infiltration systems must be at least ten times larger than the 1,000 to
2,000 acres assumed for the Elkhorn Slough hydrologic modeling. Alternatively, a thick, coarse-
grained layer exposed at the seafloor (outcrop at Monterey Canyon) and laterally continuous to
the coastal area near Moss Landing would be needed to provide sufficient lateral flow. It is also
should be point out that the lateral flow rate assumed for the Elkhorn Slough model was only 20
percent of the vertical infiltration, so that the combination of surface exposure and enhanced
conductivity must be about five times greater than that considered in the Slough model.
11. Based on the available information and literature we have reviewed, the hydrogeological
conditions appear unfavorable for the large-scale (51.6 mgd) subsurface seawater intake system
required to supply the proposed 22.3 mgd of desalinated water production at the proposed site. A
hydrological analysis based on the geometry and character of the subsurface hydrogeological
conditions in the Moss Landing area would be required to further evaluate candidate subsurface
intake systems and quantify the potential capacity of such systems. In order to provide a more
definitive assessment, significant additional data would need to be developed based on test
borings and the construction of at least 1 pilot test well of a capacity sufficiently large to test the
draw-down and recharge rates of the local aquifer penetrated. Additionally, given the uncertainty
regarding surface water quality, the pilot well would need to be pumped for an extended period
(6-12 months) to provide reliable data regarding sustainable flows, capacity and stable water
quality. Only on this basis is it possible for us to provide a more definitive conclusion as to the
feasibility of supplying the required volumes of raw water for subsequent desalination of a
regional desalination plant with a design capacity of 25,000 acre-feet per year.

DeepWater Desalination Plant, Moss Landing, California Hydrogeological Literature Review and Analysis
EcoSystems Management Associates, Inc. 61 Technical Report ECO-M Reference No. 14-04
8.0 REFERENCES Atwater, T., 1970. Implications of plate tectonics for the Cenozoic evolution of western North
America. Geological Society of America Bulletin, Vol. 81, 3515-3536. Bartak, R., T. Grischek, K. Ghodeif, and C. Ray, 2012. Beach sand filtration as pre-treatment for
RO desalination. International Journal of Water Sciences Vol. 1, 2:2012. California American Water (Cal Am), 2013. Monterey boreholes reveal good slant-well
conditions. The International Desalination & Water Reuse Quarterly Industry Website. (http://www.desalination.biz/news/news_story.asp?id=7377&title=Monterey+boreholes+reveal+good+slant-well+conditions).
California Department of Public Works, Division of Water Resources (DWR), 1946. Bulletin 52:
Salinas Basin Investigation, 230 p. California Department of Water Resources (DWR), 1969. Geology of the lower portion of the
Salinas Valley groundwater basin, office report, Central District Office, 18 p. California Department of Water Resources (DWR), 1994. The California water plan update,
DWR Bulletin 160-93, October 1994. www.waterplan.water.ca.gov California Department of Water Resources (DWR), 2004. California’s groundwater, Bulletin
118: Central Coast Hydrologic Region, Salinas Valley Groundwater Basin, 180/400 Foot Aquifer Subbasin (last updated 2/27/04).
California Emergency Management Agency (CalEMA), 2009. Tsunami inundation map for
emergency planning: Moss Landing Quadrangle/Prunedale Quadrangle, State of California, http://www.conservation.ca.gov/cgs/geologic_hazards/Tsunami/index.htm.
California Geological Survey, 2000. Digital database of faults from the fault activity map of
California and adjacent areas. California Department of Conservation, Division of Mines and Geology, DMG CD 2000-006.
California State Water Resources Board, 1953. Santa Cruz-Monterey Counties investigation,
Bulletin #5, August, 1953. Publication of State Water Resources Board. Dietrich, J., 2013. Intake alternatives: Review and status of subsurface intakes. DCG
Memorandum, April 2013. Djebedjian, B., H. Gad, I. Khaled, and M.A. Rayan, 2007. Reverse osmosis desalination plant in
Nuweiba City (case study). Eleventh International Water Technology Conference, IWTC11 2007 Sharm El-Sheikh, Egypt, 315-330.

DeepWater Desalination Plant, Moss Landing, California Hydrogeological Literature Review and Analysis
EcoSystems Management Associates, Inc. 62 Technical Report ECO-M Reference No. 14-04
DOGGR (Division of Oil, Gas, and Geothermal Resources), 2003. California Digital Map Data – Oil, Gas & Geothermal Well Locations, California Department of Conservation, Sacramento, CD-2. Well Finder web-site:
http://maps.conservation.ca.gov/doggr/index.html# Duprė, W.R., 1975. Quaternary history of the Watsonville lowlands north-central Monterey Bay
region, California. Unpublished Ph.D. dissertation, Stanford, University, 145 p. Duprė, W.R., 1998. Quaternary geology of the Monterey Bay Region, California. Duprė, W.R., and J.C. Tinsley III, 1980. Maps showing geology and liquefaction potential of
northern Monterey and southern Santa Cruz counties, California. U.S. Geological Survey Miscellaneous Field Studies Map MF-1199, sheet 1, scale 1:62,500.
Dupré, W.R., and J.C. Tinsley III, 1998. Evaluation of liquefaction-hazard mapping in the
Monterey Bay region, central California. In: Holzer, T.L., ed., The Loma Prieta, California, Earthquake of October 17, 1989 – Liquefaction, U.S. Geological Survey Professional Paper 1551-B, B273-B285.
Durbin, T.J., G.W. Kapple, and J.R. Freckleton, 1978. Two-dimensional and three-dimensional
digital flow models of the Salinas Valley groundwater basin, California. U.S. Geological Survey, Water Resources Investigations Report 78-113. Prepared in cooperation with the U.S. Army Corps of Engineers, 134 p.
Earthquake Engineering Research Institute (EERI), 1990. Loma Prieta Earthquake
Reconnaissance Report, Supplement to Volume 6, Earthquake Spectra, El Cerrito, California, 448 p.
Fugro West, Inc., 1995. North Monterey County Hydrogeologic Study: Volume I, Water
Resources. Prepared for Monterey County Water Resources Agency, October 1995. 118 pp. + 9 appendices.
Eittreim, S.L., R.J Anima, and A.J. Stevenson, 2002. Seafloor geology of the Monterey Bay area
continental shelf. Marine Geology, Volume 181:3-34. Garcia, A.W., and J.R. Houston, 1975. Type 16 Flood insurance study: Tsunami predictions for
Monterey and San Francisco Bays and Puget Sound. U.S. Army Corps of Engineers Waterways Experiment Station, Vicksburg, Mississippi, Hydraulics Laboratory, Technical Report H-75-17.
Greene, H.G., 1970. Geology of Southern Monterey Bay and its relationship to the groundwater
basin and saltwater intrusion. United States Department of the Interior Geological Survey, Open File report 70-141.
Greene, H.G., 1977. Geology of the Monterey Bay region: U.S. Geological Survey Open File
Report 77-718, 347 p.

DeepWater Desalination Plant, Moss Landing, California Hydrogeological Literature Review and Analysis
EcoSystems Management Associates, Inc. 63 Technical Report ECO-M Reference No. 14-04
Greene, H.G., and J.C. Clark, 1979. Neogene paleogeography of the Monterey Bay area,
California. In: Armentrout, J.M., Cole, M.R., and Terbest, H., Jr., Cenozoic Paleogeography of the Western United States, Pacific Section SEPM, Pacific Coast Paleogeography Symposium 3, Los Angeles, 277-323.
Greene, H.G., J. Gardner-Taggert, M.T. Ledbetter, R. Barminski, T.E. Chase, K.R. Hicks, and C.
Baxter, 1991. Offshore liquefaction and onshore liquefaction at Moss Landing spit, central California: Result of the October 17, 1989, Loma Prieta earthquake. Geology, v. 19, p. 945-949.
Hanson, R.T., 2003. Geohydrologic framework of recharge and seawater intrusion in the Pajajo
Valley, Santa Cruz and Monterey Counties, California. U.S. Geological Survey Water Resources Investigation Report 03-4096, 88 p.
Hanson, R.T., R.R. Everett, M.W. Newhouse, S.M. Crawford, M.I. Pimentel, and G.A. Smith,
2002. Geohydrology of a deep-aquifer system monitoring-well site at Marina, Monterey County, California. U.S. Geological Survey, Water Resources Investigation Report 02-400.
Israel, K., and S. Watt, 2006. Elkhorn Slough: A Review of the geology, geomorphology,
hydrodynamics and inlet stability. Technical Report by Sea Engineering Inc. Jahangir, M.J., P. Johnston, M.I. Khalil, J. Grant, C. Somers, and K.G. Richards, 2012.
Evaluation of headspace equilibration methods for quantifying greenhouse gases in groundwater. Journal of Environmental Management, 111:208-12.
Johnson, M.J., 1982. Public hearing regarding critical overdraft in the Santa Cruz-Pajaro
groundwater basin. U.S. Geological Survey written testimony submitted to California Department of Water Resources at public hearings in Watsonville, California, October, 1982, 8 p.
Johnson, M.J., C.J. Londquist, J. Laudon, and H.T. Mitten, 1988. Geohydrology and
mathematical simulation of the Pajaro Valley Aquifer system, Santa Cruz and Monterey Counties, California. U.S. Geological Survey Water Resources Investigations Report 87-4281, 62 p.
Kulongoski, J.T., and K. Belitz, 2007. Groundwater quality data in the Monterey Bay and
Salinas valley basins, California, 2005: Results from the California GAMA Program. U.S. Geological Survey Data Series 258, 84 p.
Lander, J.F., P.A. Lockridge, and M.J. Kozuch, 1993. Tsunamis affecting the West Coast of the
United States 1806-1992. NOAA, National Geophysical Data Center, Geophysical Records Documentation No. 29, 242 p.
DeepWater Desalination Plant, Moss Landing, California Hydrogeological Literature Review and Analysis
EcoSystems Management Associates, Inc. 64 Technical Report ECO-M Reference No. 14-04
Lawson, A.C., and others, 1908. The California earthquake of April 18, 1906: Report of the California State Earthquake Investigation Commission, Washington, Carnegie Institution, Publication 87, v. 1, 2 parts, 451 p.
MCWRA, Monterey County Water Resources Agency, 2003. Salinas Valley Water Project.
Website: http://mcsra.co.monterey.ca.us/welcome_svwp_n.htm. MCWRA, Monterey County Water Resources Agency, 2012. Map showing seawater intrusion in
the Salinas Valley Groundwater Basin – 180-Foot Aquifer, August 6, 2012. Website: http://www.MCWRA-CO.Monterey.ca.us
MCWRA, Monterey County Water Resources Agency, 2012. Map showing seawater intrusion in
the Salinas Valley Groundwater Basin – 400-Foot Aquifer, August 7, 2012. Website: http://www.MCWRA-CO.Monterey.ca.us
Mejia, L.H., 1998. Liquefaction at Moss Landing. In: Holzer, T.L., ed., The Loma Prieta,
California, Earthquake of October 17, 1989 – Liquefaction, U.S. Geological Survey Professional Paper 1551-B, p. B129-B150.
Missimer, T.M., N. Ghaffour, A.H.A. Dehwah, R. Rachman, R.G. Maliva, and G. Amy, 2013.
Subsurface intakes for seawater reverse osmosis facilities: Capacity limitation, water quality improvement, and economics. Desalination 322 (2013) 37-51.
Monterey County Planning Department, 2012. Ferrini Ranch Subdivision, Draft Environmental
Impact Report. Muir, K.S., 1974. Seawater intrusion, groundwater pumpage, groundwater yield, and artificial
recharge of the Pajaro Valley area, Santa Cruz and Monterey Counties, California. U.S. Geological Survey Water Resources Investigations Report 9-74, 31 p.
National Seismic Hazard Mapping Project (NSHMP), 2008. Documentation for the 2008 update
of the United States National Seismic Hazard Maps, U.S. Geological Survey Open-File Report 2008-1128, 60 p.
Page, B.M., 1970. Sur-Nacimiento fault zone of California: Continental Margin Tectonics.
Geological Society of America Bulletin, v. 81, p. 667-690. Pierrot, D., E. Lewis, and D.W.R. Wallace, 2006. MS Excel Program Developed for CO2 System
Calculations. ORNL/CDIAC-105a. Carbon Dioxide Information Analysis Center, Oak Ridge National Laboratory, U.S. Department of Energy, Oak Ridge, Tennessee.
Plafker, G., and J.P. Galloway, 1989. Lessons learned from the Loma Prieta, California,
Earthquake of October 17, 1989. U.S. Geological Survey Circular 1045, 48 p.

DeepWater Desalination Plant, Moss Landing, California Hydrogeological Literature Review and Analysis
EcoSystems Management Associates, Inc. 65 Technical Report ECO-M Reference No. 14-04
PVWMA, 2000. Pajaro Valley Water Management Agency, website: http://www.pvwma.dst.ca.us/ RMC, 2006. Salinas Valley integrated regional water management functionally equivalent plan
summary document update. The Monterey County Water Resources Agency, May 2006. Rybar, S., M. Vodnar, F. Laurentiu, R.L. Méndez, and J.B.L. Ruano, 2005. Experience with
renewable energy sources and SWRO desalination in Gran Canaria. International Desalination Association World Congress: SP05-100.
Schwartz, D.L., 1983. Geological history of Elkhorn Slough, Monterey County, California. M.S.
Thesis, San Jose State University, San Jose, CA. Sea Engineering Incorporated (SEI), 2006. Elkhorn Slough: A review of the geology,
geomorphology, hydrodynamics and inlet stability. Prepared for Elkhorn Slough National Estuarine Research Reserve, May 31, 2006. 86 p.
Toccalino, P.L., J.E. Norman, R.H. Phillips, L.J. Kauffman, P.E Stackelberg, L.H. Nowell, S.J.
Krietzman, and G.B. Post, 2004. Application of health-based screening levels to groundwater quality data in a state-scale pilot effort. U.S. Geological Survey Scientific Investigations Report 2004-5174, 64 p.
United States Geological Survey (USGS), 1995. Monterey Bay Geophysical Survey Data.
Website: http://walrus.wr.usgs.gov/infobank/j295mb/html/j-2-95-mb.meta.html March 6 – April 15, 1995. United States Geological Survey (USGS), 2005. Status and understanding of groundwater
quality in the Monterey Bay and Salinas valley basins, 2005: California GAMA Priority Basin Project. Scientific Investigations Report 2011-5058, U.S. Department of the Interior U.S. Geological Survey.
Wagner, D.L., H.G. Greene, G.J. Saucedo, and C.J. Pridmore, 2002. Geologic map of the
Monterey 30’ x 60’ quadrangle and adjacent offshore region, California: A Digital Database: California Department of Conservation, Division of Mines & Geology, DMG CD 2000-000.
Wallace, R.E., ed., 1990. The San Andreas fault system, California, U.S. Geological Survey
Professional Paper 1515, 283 p. Water Reuse Association, 2011. Overview of Desalination Plant Intake Alternatives, White
Paper, June 2011. 17 p. Website: http://www.watereuse.org/sites/default/files/u8/Intake_White_Paper.pdf
Water-Technology.net. Sand City coastal desalination plant, United States of America.
http://www.water-technology.net/projects/sand-city-plant/

DeepWater Desalination Plant, Moss Landing, California Hydrogeological Literature Review and Analysis
EcoSystems Management Associates, Inc. 66 Technical Report ECO-M Reference No. 14-04
Working Group on California Earthquake Probabilities (WGCEP), 1999. Earthquake
probabilities in the San Francisco Bay Region, 2000-2030: A summary of findings. U.S. Geological Survey Open-File Report 99-517.

DeepWater Desalination Plant, Moss Landing, California Hydrogeological Literature Review and Analysis
EcoSystems Management Associates, Inc. A-1 Technical Report ECO-M Reference No. 14-04
APENDIX A
COASTAL AQUIFERS & SEAWATER RECHARGE
FUGRO (1995) STUDY

DeepWater Desalination Plant, Moss Landing, California Hydrogeological Literature Review and Analysis
EcoSystems Management Associates, Inc. A-2 Technical Report ECO-M Reference No. 14-04
COASTAL AQUIFERS & SEAWATER RECHARGE The following is of summary of the main points from of Fugro (1995) report related to this study. 1. A deep late-Pleistocene channel (Figure 1) is inferred to exist beneath Elkhorn Slough in the
vicinity of Moss Landing (Fugro, 1995). This has been called the Elkhorn Valley and was interpreted to be filled with marine and fluvial deposits near the coast. Isopachs of Holocene sediments mapped offshore north of Monterey Canyon project toward the Moss Landing area and appear to define the offshore buried paleochannel (ancestral valley). A well located at the center of the ancestral valley (well 13S/02E-07K) documented about 600 feet of low-permeability materials. Adjacent wells document varying thicknesses of clay and low-permeability materials, ranging from 10 to 70 feet thick, with some interbeds of sand, gravel, or sandy clay (Fugro, 1995). The thick clay layer (“mud plug”) restricts lateral migration (north-south) of fluids between the adjacent Salinas and Pajaro Valley aquifer systems. This boundary appears to account for different seawater intrusion rates in the two aquifer systems, with greater distance inland of the saline water on the north side of Elkhorn Slough. Fluvial channels with coarse-grained materials, including sand, gravel, and sandy clays, are documented in wells north of Elkhorn Slough (Figures 1, 2, and 3)
2. Figure 4 shows the geophysical section from abandoned oil well “Vierra #1”. In this geophysical section the shallow mud-logging is simplified up to depth <1000 ft. However, the observation of sand and oyster shells in the area (Figure 4) where the high resistivity occurs is consistent with a fresh water aquifer (drilling and logging in 1946). This aquifer is subject to seawater intrusion at present due to drawdown of shallow aquifers by agricultural pumpage. Coarse-grained layers may provide favorable paths for seawater intrusion and possible seawater recharge for subsurface intake systems near the coast if these layers have lateral continuity to the west offshore and crop out at the head of Monterey Canyon.
3. Seawater intrusion in the Springfield Terrace area of the Pajaro Valley aquifer system is recognized at discrete levels—between -100 and -130 feet MSL in wells near the coast (Fugro, 1995). These observations are consistent with lateral flow as a mechanism for seawater intrusion into deeper aquifers.
4. Vertical infiltration of the saline water from Elkhorn Slough is also recognized as a mechanism for increasing chloride ion concentrations in shallow aquifers adjacent to the Slough. Shallow, fine-grained layers slow the vertical infiltration of saline water downward into shallow aquifers, but excessive withdrawal has lowered the groundwater elevation by 10 to 20 feet in the past few decades, which induces lateral migration from coarse-grained layers that crop out on the sides of the Slough to increase localized seawater intrusion. Deeper, fine-grained (clay) layers restrict the vertical infiltration and help preserve freshwater in aquifers at deeper levels.
5. The observations that seawater intrusion is confined to discrete levels below the shallow alluvial systems as outlined above (points 2 and 3) leads to the conclusion that rates of recharge by lateral flow are constrained by the configuration and thickness of coarse-grained material interbedded with low-permeability clay layers. A subsurface seawater-intake system

DeepWater Desalination Plant, Moss Landing, California Hydrogeological Literature Review and Analysis
EcoSystems Management Associates, Inc. A-3 Technical Report ECO-M Reference No. 14-04
for a large-scale desalination plant must be located within a thick, laterally-continuous, coarse-grained aquifer (paleochannel) that is directly connected to the ocean. Hydrologic modeling of the aquifer systems in the vicinity of Elkhorn Slough was used to estimate the leakage at about 3,000 to 5,000 acre-feet per year (2.7 to 4.5 mgd) of seawater into the groundwater system (Fugro, 1995). About 20 percent of this value is due to horizontal flow (seawater intrusion) and the rest to vertical leakage from Elkhorn Slough (Fugro, 1995). In order to sustain a 50 mgd desalination plant, the recharge area or infiltration rates must be increased by at least one order-of-magnitude.
6. A larger area covered by seawater exists offshore and adjacent to the Monterey Canyon. If the shallow alluvial basin (paleochannel) has similar layering of coarse-grained aquifers interbedded with low-permeability clays and silts, as are found in wells onshore, then the area for vertical infiltration systems must be at least ten times larger than the 1,000 to 2,000 acres assumed for the Elkhorn Slough hydrologic modeling. Alternatively, a thick, coarse-grained layer exposed at the seafloor (outcrop at Monterey Canyon) and laterally continuous to the coastal area near Moss Landing would be needed to provide sufficient lateral flow. It is also should be point out that the lateral flow rate assumed for the Elkhorn Slough model was only 20 percent of the vertical infiltration, so that the combination of surface exposure and enhanced conductivity must be about five times greater than that considered in the Slough model.
RECOMIDATIONS
1. Lateral continuity of the paleochannel to the offshore head of Monterey Canyon may be determined with an offshore geophysical survey, as was performed for the City of Santa Cruz. The paleochannel may be mapped in the nearshore area to verify its geometry and provide data needed for hydrological modeling of recharge rates for seawater infiltration. Offshore sampling (vibracores) may be necessary to confirm the seafloor materials that could restrict the vertical infiltration rates (recharge) and to provide quantitative data on flow conductivities.
2. An updated hydrologic model to directly estimate the potential for seawater recharge of a coastal or nearshore subsurface intake system is recommended to provide quantitative information on the feasibility of such systems. A preliminary version could be developed in conjunction with the Pajaro Valley Water Management Agency or the Monterey County Water Resources Agency.
3. Drilling borehole in the neighborhood of well 13S/02E-07K to obtain detail log of the aquifer at this location.
REFERENCES
Fugro West, Inc., 1995. North Monterey County Hydrogeologic Study: Volume I, Water Resources. Prepared for Monterey County Water Resources Agency, October 1995. 118 pp. + 9 appendices.

DeepWater Desalination Plant, Moss Landing, California Hydrogeological Literature Review and Analysis
EcoSystems Management Associates, Inc. A-4 Technical Report ECO-M Reference No. 14-04
Figure 1. Geological map of the Moss Landing area north of Elkhorn Slough showing well locations and isopach contours of offshore Holocene sediments (thin green lines). A deep late Pleistocene channel referred to as the Elkhorn Valley is inferred to lie beneath the Elkhorn Slough (Fugro, 1995). Cross-section shown in Fig. 2 follows Highway 1 from Capurro Ranch (well#516), through well 07k and past the well south of Moss Landing.

DeepWater Desalination Plant, Moss Landing, California Hydrogeological Literature Review and Analysis
EcoSystems Management Associates, Inc. A-5 Technical Report ECO-M Reference No. 14-04

DeepWater Desalination Plant, Moss Landing, California Hydrogeological Literature Review and Analysis
EcoSystems Management Associates, Inc. A-6 Technical Report ECO-M Reference No. 14-04

DeepWater Desalination Plant, Moss Landing, California Hydrogeological Literature Review and Analysis
EcoSystems Management Associates, Inc. A-7 Technical Report ECO-M Reference No. 14-04
Figure 4. Shallow geophysical log section from abandoned oil well “Vierra #1,” drilled in 1946 and located near Moss Landing. A prominent resistivity kick between 150 and 200 feet is in a layer described as “clay, sticky with streaks sand and oyster shells” on the drillers’ log (data from DOGGR, 2003). High resistivity is interpreted to represent fresh water in the coarse-grained layer with sand and shells – Upper Aromas aquifer. “Mud-loggers” recording the material mixed with drilling mud during oil exploration drilling are less interested in the shallow material (<1000 ft) and shallow layers are not “cored” to get accurate description of the geological layers. The electrical log provides evidence that a shallow coarse-grained layer saturated with fresh water (in 1948) may be present (possibly the Upper Aromas aquifer).