deepwater circulation variation in the south china …epic.awi.de/42671/1/zhenggrl.pdf · deepwater...
TRANSCRIPT

Deepwater circulation variation in the South ChinaSea since the Last Glacial MaximumXufeng Zheng1, ShuhJi Kao2, Zhong Chen1, Laurie Menviel3, Han Chen4, Yan Du5, Shiming Wan6,Hong Yan7, Zhonghui Liu8, Liwei Zheng2, Shuhong Wang1, Dawei Li2, and Xu Zhang9
1Key Laboratory of Marginal Sea Geology, South China Sea Institute of Oceanology, Chinese Academy of Sciences,Guangzhou, China, 2State Key Laboratory of Marine Environmental Science, Xiamen University, Xiamen, China, 3ClimateChange Research Centre, ARC Centre of Excellence for Climate System Science, University of New South Wales, Sydney,Australia, 4Island Research Center, State Oceanic Administration, Fuzhou, China, 5State Key Laboratory of TropicalOceanography, South China Sea Institute of Oceanology, Chinese Academy of Sciences, Guangzhou, China, 6KeyLaboratory of Marine Geology and Environment, Institute of Oceanology, Chinese Academy of Sciences (CAS), Qingdao,China, 7State Key Laboratory of Loess and Quaternary Geology, Institute of Earth Environment, Chinese Academy ofSciences, Xi’an, China, 8Department of Earth Sciences, University of Hong Kong, Hong Kong, China, 9Alfred-Wegener-Institut, Helmholtz-Zentrumfür Polar- und Meeresforschung, Bremerhaven, Germany
Abstract Deepwater circulation plays a central role in global climate. Compared with the Atlantic, thePacific deepwater circulation’s history remains unclear. The Luzon overflow, a branch of the North Pacificdeep water, determines the ventilation rate of the South China Sea (SCS) basin. Sedimentary magneticproperties in the SCS reflect millennial-scale fluctuations in deep current intensity and orientation. The datasuggest a slightly stronger current at the Last Glacial Maximum compared to the Holocene. But, the moststriking increase in deep current occurred during Heinrich stadial 1 (H1) and to a lesser extent during theYounger Dryas (YD). Results of a transient deglacial experiment suggest that the northeastern currentstrengthening at the entrance of the SCS during H1 and the YD, times of weak North Atlantic Deep Waterformation, could be linked to enhanced formation of North Pacific Deep Water.
1. Introduction
Intermediate-deepwater circulation plays a central role in climate change [Marshall and Speer, 2012].Intermediate and deep waters sink to the deep ocean at high latitudes and ultimately return to the surfacedriving the meridional overturning circulation (MOC) [Kuhlbrodt et al., 2007; McManus et al., 2004]. Changesin intermediate-deepwater circulation may influence the storage of carbon in the ocean; the oxygen supply;and thus, the extent of the oxygen minimum zones [Galbraith et al., 2007] as well as the sediment dispersionand burial [McCave et al., 1995]. Understanding changes in intermediate and deepwater currents is crucial toconstrain past changes in climates and ocean biogeochemistry.
The last deglaciation was punctuated by millennial climate changes, such as Heinrich event 1 (H1) and theYounger Dryas (YD) [Blunier and Brook, 2001; Dansgaard et al., 1993], during which North Atlantic DeepWater (NADW) formation weakened significantly [McManus et al., 2004]. Modeling studies and paleoproxyrecords have suggested that a shutdown of NADW formation could lead to enhanced North Pacific DeepWater (NPDW) formation due to atmospheric and oceanic teleconnections [e.g., Saenko et al., 2004;Okumura et al., 2009; Okazaki et al., 2010; Rae et al., 2014]. While these paleoreconstructions are derived fromhigh to middle latitudes (close to NPDW formation region), there is a lack of records from lower latitudes.Given its location, close to the NPDW potential path, the South China Sea (SCS) provides a key area to testwhether NPDW was significantly stronger during North Atlantic stadials.
The SCS, located in the tropical to subtropical western North Pacific (NP), is the largest marginal sea in thewestern Pacific. An overflow of North Pacific water through the Luzon Strait connects the SCS and thePacific Ocean at a depth of about 2400m (sill depth) and sustains deep circulation in the SCS (Figure 1)[Qu et al., 2006]. Similarities in physical and chemical properties between deep water in the SCS basin andthe Pacific at 2000m [Wang et al., 2011] suggest that the SCS deep water originates from NPDW. The highsedimentation rates in the SCS and the tight connection between the SCS and the NP make the SCS an ideallocation to reconstruct North Pacific intermediate/deep current history and its link to North Atlanticmillennial-scale variability.
ZHENG ET AL. SOUTH CHINA SEA DEEP CURRENT 8590
PUBLICATIONSGeophysical Research Letters
RESEARCH LETTER10.1002/2016GL070342
Key Points:• SCS’s magnetic property changecoincides with global climatetransitions
• SCS deep current increased during H1and the Younger Dryas
• SCS deep current increases due toenhanced NPDW formation
Supporting Information:• Data Set S1• Supporting Information S1
Correspondence to:Z. Chen,[email protected]
Citation:Zheng, X., et al. (2016), Deepwatercirculation variation in the South ChinaSea since the Last Glacial Maximum,Geophys. Res. Lett., 43, 8590–8599,doi:10.1002/2016GL070342.
Received 6 JUL 2016Accepted 29 JUL 2016Accepted article online 30 JUL 2016Published online 19 AUG 2016
©2016. American Geophysical Union.All Rights Reserved.

Observed water properties [Wang et al., 2011] and numerical modeling [Lan et al., 2015] suggest a basin-scalecyclonic gyre path in the SCSbelow2400mwater depth, forcedby the Luzonoverflow. The incoming SCSdeepwater flows southward and rises in the southern basin, forming the general SCS MOC-like deep circulationsystem [Shu et al., 2014]. By using seismic profile analyses (drift sediment accretion), Lüdmann et al. [2005]suggested that the overflow water possesses enough energy to flow up directly crossing the northern slope
Figure 1. (a) Ocean bathymetry in the North Pacific (color) and ocean currents (m/s) at 1992–2622m depth at the LGM assimulated in LOVECLIM Earth system model [Menviel et al., 2011]. (b) A schematic map with the enlargement of the blacksquare in Figure 1a to show the topography and current system in the NE part of the SCS, with spatial references of coreslocations. NPDW=North Pacific DeepWater. The core 10E203marked with pink color was the primary core analyzed in thisstudy. The red colored circles are the cores to which we referred. The yellow dashed line is the deep current route proposedby Lüdman et al. [2005]. The cyan solid line is the deep current path revealed by Liu et al. [2010] and Shao et al. [2007].Sediment drift: yellow crosses [Shao et al., 2007] and grey shaded area [Lüdman et al., 2005]. LS and KS represent the LuzonStrait (�2400m) and Karimata Strait (�40m), respectively (red bar).
Geophysical Research Letters 10.1002/2016GL070342
ZHENG ET AL. SOUTH CHINA SEA DEEP CURRENT 8591

of the SCS basin near Dongsha Island (Figure 1). However, Shao et al. [2007], employing a similar method,revealed persistent cyclonic deep circulation along the isobaths since 3Ma. Temporal and spatial variabilitiesof clay mineral assemblages in sediments from the northeastern (NE) SCS also support a basin-scale cyclonicgyrepatternof deepcirculation [Liu et al., 2008, 2010;Wanet al., 2010], agreeingwith the aforementionedmod-eling and present-day observations. However, seismic profile and clay mineral distributionmethods are quali-tative in nature; a more specific method to quantify the current orientation is required to address the debate.
Previous paleoreconstructions from the SCS based on δ13C and ventilation age changes revealed significanttemporal variability in deepwater advection within the SCS since the Last Glacial Maximum (LGM) [Wan andJian, 2014; Wei et al., 2006]. However, an additional high-resolution archive is urgently needed to betterconstrain the deglacial SCS deep water’s history, its relationship to deep circulation in the NP and to NorthAtlantic millennial-scale climatic events.
Magnetic properties, i.e., magnetic grain size proxies and fabric alignment coefficients, are sensitive to bot-tom current dynamics and are not affected by changes in sedimentation rate [Kissel et al., 1997, 2009].Magnetic properties are routinely used to reconstruct paleoflow’s magnitude and azimuth [Kissel et al.,2009, 2013]. Based on paleomagnetic parameters of a SCS sediment core, we herein reconstruct the evolu-tionary history of the SCS deep current since the LGM at a centennial to millennial time scale. The temporalvariations of the deep current’s intensity support the Atlantic-Pacific interbasin seesaw theory.
2. Materials and Methods
A sediment core (10E203), (118°23.351′E, 20°34.963′N), 3.44m in length, was collected during the “OPEN ANDSHARE” cruise. It is located on the NE slope of the SCS, at a depth of 2439m (Figure 1). This core lies within theflowing path of the SCS deep cyclonic circulation and, as evidenced by sediment drifts deposition [Shao et al.,2007], is situated where the NPDW branch encounters the slope of the SCS basin (Figure 1).
Core lithology is dominated by terrigenous clayed silt with successive laminations. Planktonic foraminifera(Neogloboquadrina dutertrei) were isolated from a selection of fine-grained sediment layers for 14C dating(accelerator mass spectrometry (AMS) laboratory, Beta Analytic). The age model is based on 10 AMS 14C ages(Figure S1 in the supporting information). Calendar age is determined by using Calib 7.0 with a regional 14Creservoir age of ΔR=18 ± 37 [Yu et al., 2010]. Core 10E203 is characterized by a high, yet stable, depositionalrate (50 yr/cm; Figure S1). This offers a valuable archive to explore the deep circulation at centennial tomillennial time scales.
Paleomagnetic samples were prepared using a standard 2 × 2 × 2 cm plastic cube at 2 to 4 cm intervals(total 100 samples) along a fiducial line that was drawn prior to sampling. Low-field magnetic susceptibility(k), magnitude and the direction of the anisotropy of magnetic susceptibility (AMS), saturated isothermalremanent magnetization (SIRM), anhysteretic remanent magnetization (ARM), and characteristic remanentmagnetization (ChRM) analyses were measured according to Wu et al. [2016].
The mean ChRM was acquired for each section in order to reorient the core to geographical north accordingto Parés et al. [2007] (see Table S1 in the supporting information). Statistical analyses on the inclination of kmax
and kmin were conducted to infer if core 10E203 was a nonperturbed system after deposition (Figure S2).Volumetric magnetic susceptibility as a function of temperature (k versus T) was measured for six samplesfrom room temperature to 700°C using CS4/CSL high- and low-temperature units attached to the MFK1-FAinstrument to infer the main magnetic mineral composition of this sediment core (Figure S2).
Five samples were chosen to conduct replicate measurements (5 times). The precision of ARM, SIRM, and kmeasurement are better than 0.1%, 1.4%, and 0.1%, respectively. The near-bottom flow speed is inferred frommagnetic parameters that are sensitive to bottom current, e.g., ARM/k and ARM/SIRM [Kissel et al., 2009,2010]. The degree of AMS (PJ) and the alignment factor (Fs), independent of sedimentation rate, sedimentsource, or sediment composition [Ledbetter and Ellwood, 1980], are calculated to constrain the flow patternof the deep current.
Anisotropy degree (PJ) [Jelinek, 1981]
PJ ¼ exp 2� η1 � ηmð Þ2 þ η2 � ηmð Þ2 þ η3 � ηmð Þ2h in o1=2
Geophysical Research Letters 10.1002/2016GL070342
ZHENG ET AL. SOUTH CHINA SEA DEEP CURRENT 8592
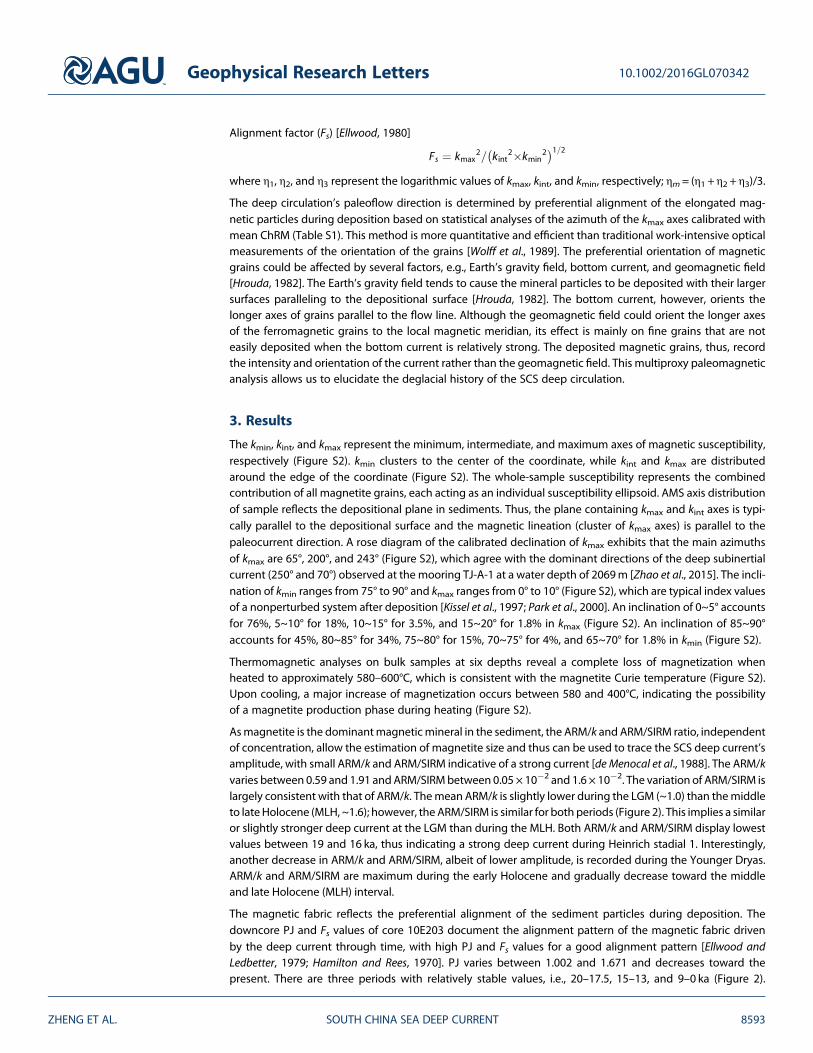
Alignment factor (Fs) [Ellwood, 1980]
Fs ¼ kmax2= kint
2�kmin2� �1=2
where η1, η2, and η3 represent the logarithmic values of kmax, kint, and kmin, respectively; ηm= (η1 + η2 + η3)/3.
The deep circulation’s paleoflow direction is determined by preferential alignment of the elongated mag-netic particles during deposition based on statistical analyses of the azimuth of the kmax axes calibrated withmean ChRM (Table S1). This method is more quantitative and efficient than traditional work-intensive opticalmeasurements of the orientation of the grains [Wolff et al., 1989]. The preferential orientation of magneticgrains could be affected by several factors, e.g., Earth’s gravity field, bottom current, and geomagnetic field[Hrouda, 1982]. The Earth’s gravity field tends to cause the mineral particles to be deposited with their largersurfaces paralleling to the depositional surface [Hrouda, 1982]. The bottom current, however, orients thelonger axes of grains parallel to the flow line. Although the geomagnetic field could orient the longer axesof the ferromagnetic grains to the local magnetic meridian, its effect is mainly on fine grains that are noteasily deposited when the bottom current is relatively strong. The deposited magnetic grains, thus, recordthe intensity and orientation of the current rather than the geomagnetic field. This multiproxy paleomagneticanalysis allows us to elucidate the deglacial history of the SCS deep circulation.
3. Results
The kmin, kint, and kmax represent the minimum, intermediate, and maximum axes of magnetic susceptibility,respectively (Figure S2). kmin clusters to the center of the coordinate, while kint and kmax are distributedaround the edge of the coordinate (Figure S2). The whole-sample susceptibility represents the combinedcontribution of all magnetite grains, each acting as an individual susceptibility ellipsoid. AMS axis distributionof sample reflects the depositional plane in sediments. Thus, the plane containing kmax and kint axes is typi-cally parallel to the depositional surface and the magnetic lineation (cluster of kmax axes) is parallel to thepaleocurrent direction. A rose diagram of the calibrated declination of kmax exhibits that the main azimuthsof kmax are 65°, 200°, and 243° (Figure S2), which agree with the dominant directions of the deep subinertialcurrent (250° and 70°) observed at the mooring TJ-A-1 at a water depth of 2069m [Zhao et al., 2015]. The incli-nation of kmin ranges from 75° to 90° and kmax ranges from 0° to 10° (Figure S2), which are typical index valuesof a nonperturbed system after deposition [Kissel et al., 1997; Park et al., 2000]. An inclination of 0~5° accountsfor 76%, 5~10° for 18%, 10~15° for 3.5%, and 15~20° for 1.8% in kmax (Figure S2). An inclination of 85~90°accounts for 45%, 80~85° for 34%, 75~80° for 15%, 70~75° for 4%, and 65~70° for 1.8% in kmin (Figure S2).
Thermomagnetic analyses on bulk samples at six depths reveal a complete loss of magnetization whenheated to approximately 580–600°C, which is consistent with the magnetite Curie temperature (Figure S2).Upon cooling, a major increase of magnetization occurs between 580 and 400°C, indicating the possibilityof a magnetite production phase during heating (Figure S2).
Asmagnetite is the dominantmagneticmineral in the sediment, the ARM/k and ARM/SIRM ratio, independentof concentration, allow the estimation of magnetite size and thus can be used to trace the SCS deep current’samplitude, with small ARM/k and ARM/SIRM indicative of a strong current [de Menocal et al., 1988]. The ARM/kvaries between 0.59 and 1.91 andARM/SIRMbetween 0.05 × 10�2 and 1.6 × 10�2. The variation of ARM/SIRM islargely consistent with that of ARM/k. Themean ARM/k is slightly lower during the LGM (~1.0) than themiddleto lateHolocene (MLH, ~1.6); however, the ARM/SIRM is similar for both periods (Figure 2). This implies a similaror slightly stronger deep current at the LGM than during the MLH. Both ARM/k and ARM/SIRM display lowestvalues between 19 and 16 ka, thus indicating a strong deep current during Heinrich stadial 1. Interestingly,another decrease in ARM/k and ARM/SIRM, albeit of lower amplitude, is recorded during the Younger Dryas.ARM/k and ARM/SIRM are maximum during the early Holocene and gradually decrease toward the middleand late Holocene (MLH) interval.
The magnetic fabric reflects the preferential alignment of the sediment particles during deposition. Thedowncore PJ and Fs values of core 10E203 document the alignment pattern of the magnetic fabric drivenby the deep current through time, with high PJ and Fs values for a good alignment pattern [Ellwood andLedbetter, 1979; Hamilton and Rees, 1970]. PJ varies between 1.002 and 1.671 and decreases toward thepresent. There are three periods with relatively stable values, i.e., 20–17.5, 15–13, and 9–0 ka (Figure 2).
Geophysical Research Letters 10.1002/2016GL070342
ZHENG ET AL. SOUTH CHINA SEA DEEP CURRENT 8593
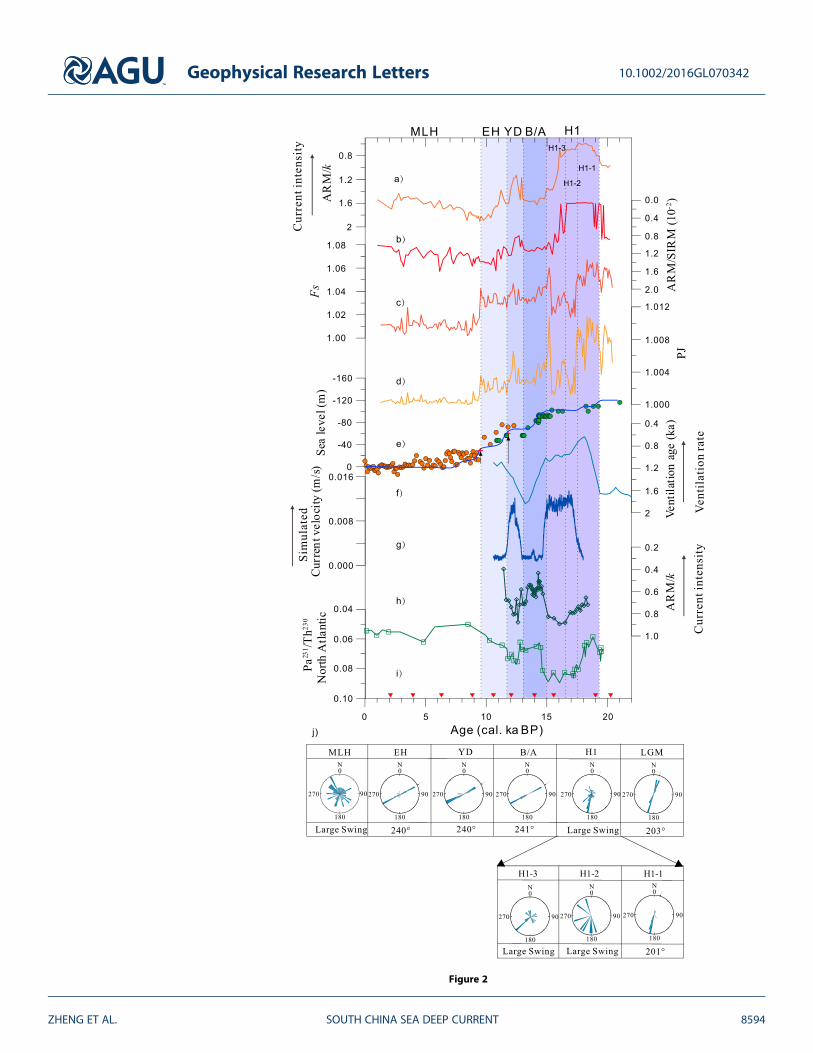
Figure 2
Geophysical Research Letters 10.1002/2016GL070342
ZHENG ET AL. SOUTH CHINA SEA DEEP CURRENT 8594
Four peaks could also be found at 15, 12.3, 9.2, and 2.9 ka. The temporal variation of Fs is in accordance withPJ, but Fs is less variable during the Holocene interval (Figure 2).
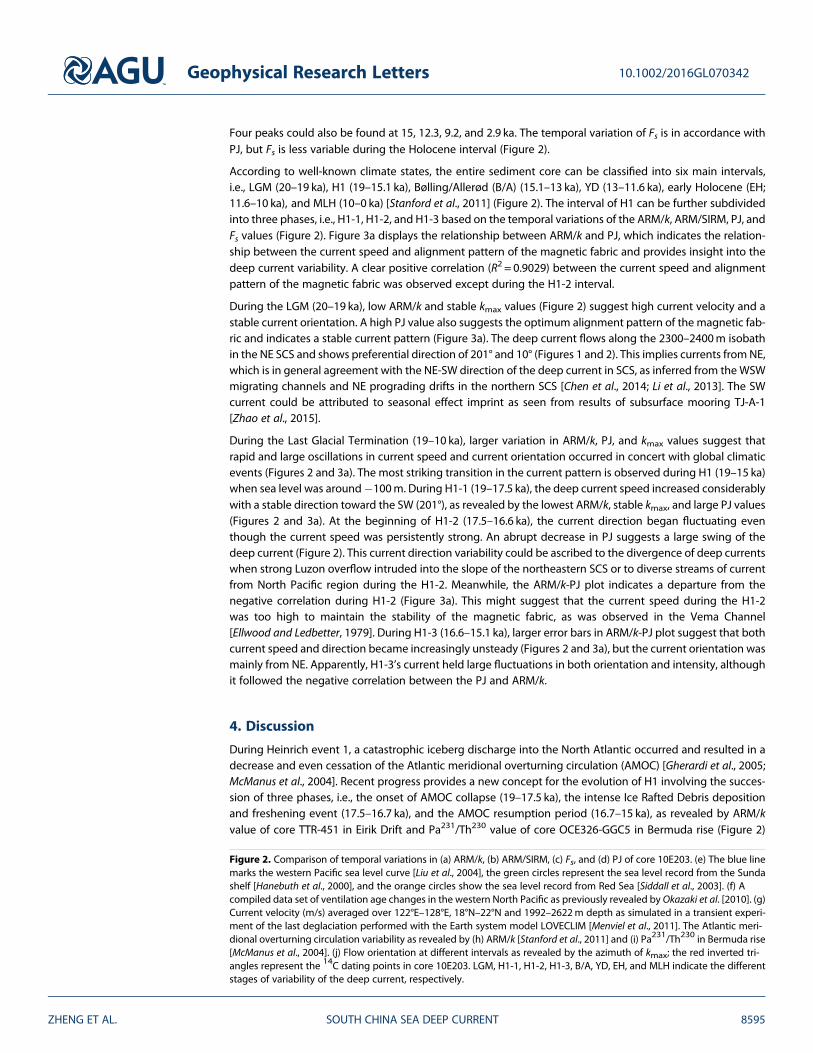
According to well-known climate states, the entire sediment core can be classified into six main intervals,i.e., LGM (20–19 ka), H1 (19–15.1 ka), Bølling/Allerød (B/A) (15.1–13 ka), YD (13–11.6 ka), early Holocene (EH;11.6–10 ka), and MLH (10–0 ka) [Stanford et al., 2011] (Figure 2). The interval of H1 can be further subdividedinto three phases, i.e., H1-1, H1-2, and H1-3 based on the temporal variations of the ARM/k, ARM/SIRM, PJ, andFs values (Figure 2). Figure 3a displays the relationship between ARM/k and PJ, which indicates the relation-ship between the current speed and alignment pattern of the magnetic fabric and provides insight into thedeep current variability. A clear positive correlation (R2 = 0.9029) between the current speed and alignmentpattern of the magnetic fabric was observed except during the H1-2 interval.
During the LGM (20–19 ka), low ARM/k and stable kmax values (Figure 2) suggest high current velocity and astable current orientation. A high PJ value also suggests the optimum alignment pattern of the magnetic fab-ric and indicates a stable current pattern (Figure 3a). The deep current flows along the 2300–2400m isobathin the NE SCS and shows preferential direction of 201° and 10° (Figures 1 and 2). This implies currents fromNE,which is in general agreement with the NE-SW direction of the deep current in SCS, as inferred from the WSWmigrating channels and NE prograding drifts in the northern SCS [Chen et al., 2014; Li et al., 2013]. The SWcurrent could be attributed to seasonal effect imprint as seen from results of subsurface mooring TJ-A-1[Zhao et al., 2015].
During the Last Glacial Termination (19–10 ka), larger variation in ARM/k, PJ, and kmax values suggest thatrapid and large oscillations in current speed and current orientation occurred in concert with global climaticevents (Figures 2 and 3a). The most striking transition in the current pattern is observed during H1 (19–15 ka)when sea level was around�100m. During H1-1 (19–17.5 ka), the deep current speed increased considerablywith a stable direction toward the SW (201°), as revealed by the lowest ARM/k, stable kmax, and large PJ values(Figures 2 and 3a). At the beginning of H1-2 (17.5–16.6 ka), the current direction began fluctuating eventhough the current speed was persistently strong. An abrupt decrease in PJ suggests a large swing of thedeep current (Figure 2). This current direction variability could be ascribed to the divergence of deep currentswhen strong Luzon overflow intruded into the slope of the northeastern SCS or to diverse streams of currentfrom North Pacific region during the H1-2. Meanwhile, the ARM/k-PJ plot indicates a departure from thenegative correlation during H1-2 (Figure 3a). This might suggest that the current speed during the H1-2was too high to maintain the stability of the magnetic fabric, as was observed in the Vema Channel[Ellwood and Ledbetter, 1979]. During H1-3 (16.6–15.1 ka), larger error bars in ARM/k-PJ plot suggest that bothcurrent speed and direction became increasingly unsteady (Figures 2 and 3a), but the current orientation wasmainly from NE. Apparently, H1-3’s current held large fluctuations in both orientation and intensity, althoughit followed the negative correlation between the PJ and ARM/k.
4. Discussion
During Heinrich event 1, a catastrophic iceberg discharge into the North Atlantic occurred and resulted in adecrease and even cessation of the Atlantic meridional overturning circulation (AMOC) [Gherardi et al., 2005;McManus et al., 2004]. Recent progress provides a new concept for the evolution of H1 involving the succes-sion of three phases, i.e., the onset of AMOC collapse (19–17.5 ka), the intense Ice Rafted Debris depositionand freshening event (17.5–16.7 ka), and the AMOC resumption period (16.7–15 ka), as revealed by ARM/kvalue of core TTR-451 in Eirik Drift and Pa231/Th230 value of core OCE326-GGC5 in Bermuda rise (Figure 2)
Figure 2. Comparison of temporal variations in (a) ARM/k, (b) ARM/SIRM, (c) Fs, and (d) PJ of core 10E203. (e) The blue linemarks the western Pacific sea level curve [Liu et al., 2004], the green circles represent the sea level record from the Sundashelf [Hanebuth et al., 2000], and the orange circles show the sea level record from Red Sea [Siddall et al., 2003]. (f) Acompiled data set of ventilation age changes in the western North Pacific as previously revealed by Okazaki et al. [2010]. (g)Current velocity (m/s) averaged over 122°E–128°E, 18°N–22°N and 1992–2622m depth as simulated in a transient experi-ment of the last deglaciation performed with the Earth system model LOVECLIM [Menviel et al., 2011]. The Atlantic meri-dional overturning circulation variability as revealed by (h) ARM/k [Stanford et al., 2011] and (i) Pa231/Th230 in Bermuda rise[McManus et al., 2004]. (j) Flow orientation at different intervals as revealed by the azimuth of kmax; the red inverted tri-angles represent the 14C dating points in core 10E203. LGM, H1-1, H1-2, H1-3, B/A, YD, EH, and MLH indicate the differentstages of variability of the deep current, respectively.
Geophysical Research Letters 10.1002/2016GL070342
ZHENG ET AL. SOUTH CHINA SEA DEEP CURRENT 8595
[McManus et al., 2004; Stanford et al., 2011]. Thus, the three-phase fluctuation in the SCS deep current patternduring H1 could result from a major reorganization of Pacific deep circulation probably linked to AMOCchanges [Menviel et al., 2011, 2014; Okumura et al., 2009; Saenko et al., 2004; Wan and Jian, 2014].
Radiocarbon records and numerical simulations suggest that NPDW formation was enhanced and extendedto a depth of ~2500–3000m during H1, in response to reducedmoisture transport from the Atlantic to Pacificand increased transport of saline low-latitude waters to the North Pacific (Figures 2f and 2g) [Menviel et al.,2011; Okazaki et al., 2010]. This deep water is analogous to the one currently occurring in the NorthAtlantic, flowing along the western margin of the North Pacific and penetrating the SCS via the Luzon Strait(Figure 3b) [Okazaki et al., 2010; Wan and Jian, 2014].
A few paleoproxy records from the upper 2000m of the North Pacific suggest increased ventilation during H1compared to the LGM [Okazaki et al., 2010; Jaccard and Galbraith, 2013; Max et al., 2014], while some NorthPacific records from water depths greater than 2100m show little signs of increased ventilation during thattime [Lund et al., 2011; Jaccard and Galbraith, 2013; Max et al., 2014]. However, MD02-2489, in the Gulf ofAlaska, displays high ventilation rate at 3600m water depth during H1 [Rae et al., 2014], consistent withour paleomagnetic proxies. Nd isotope and ventilation age evidences in cores MD05-2903/2904 andSO17940-2 from the NE SCS also confirm the penetration of deep water into the SCS during the early degla-ciation period [Wan and Jian, 2014; Wu et al., 2015]. The rapid deep current strengthening occurring duringH1 in the SCS could thus be associated with the abrupt increase in NPDW on the premise of the terminologyof Talley et al. [2003] that refers the deep Pacific as water depth >2000m.
This is in global agreement with a transient deglacial experiment, performed with the Earth system model(LOch–Vecode-Ecbilt-CLio-agIsm Model, LOVECLIM) [Menviel et al., 2011], which suggests enhanced NPDWformation during H1 as a result of the AMOC shutdown (Figure 2g). This simulation clearly shows an increasein NE current along the western margin of the North Pacific between ~1443 and 3300m water depth, with amaximum increase at about 2300m depth (Figure 3b). However, due to the relatively coarse resolution of themodel, the Luzon Strait is at ~1992mwater depth. Thus, a strengthening of the cyclonic circulation in the SCSin response to the stronger NPDW is simulated at 1443–1992m water depth (Figure S4).
Changes in SCS magnetic properties seem to lead North Atlantic changes by approximately 1000 years dur-ing H1 (Figure 2). The weaker summer East Asian monsoon at the LGM compared to the Holocene [Jiang andLang, 2010] could have reduced the North Pacific halocline, thus making it more sensitive to climatic changes.A small AMOC weakening between 19 and 18 ka could have enhanced NPDW formation, which would thenstrengthen through the Stommel feedback [Menviel et al., 2012; Stommel, 1961]. This time leading could alsobe due to a reservoir effect discrepancy in the 14C age model [Sun et al., 2005]. Additional studies are neededto validate this lag and address its potential mechanism.
Figure 3. (a) ARM/k against PJ plot for LGM, H1-1, H1-2, H1-3, B/A, YD, EH, and MLH intervals (average, standard deviation).(b) Ocean current anomalies (m/s) at 1992–2622m depth during H1 stadial as simulated in LOVECLIM Earth system model[Menviel et al., 2011].
Geophysical Research Letters 10.1002/2016GL070342
ZHENG ET AL. SOUTH CHINA SEA DEEP CURRENT 8596
During the B/A (15.1–13 ka), the current velocity weakened and the current direction was restored to a stablecondition with an azimuth of around 240° and 60°, concurrently with a strong NADW as shown by ARM/kvalue of core TTR-451 in Eirik Drift and Pa231/Th230 value of core OCE326-GGC5 in Bermuda rise (Figures 2and 3a). The transition of current orientation from 200°, 10° to 240°, 60°occurring from early H1 to B/A furthersuggests a rapid alternation of the deep current in the SCS.
A subtle reviving of current strength occurred during the YD, as revealed by the ARM/k and ARM/SIRM plots(Figures 2 and 3a).
A pulse of intensification in the deep current occurred during the EH (11.6–10 ka), as seen in the ARM/k andARM/SIRM values (Figures 2 and 3a). During this period, sea level was rising up to �40m, a critical height toreopen the Karimata Strait (KS) to the shallow current throughflow (depth of 40m) [Hanebuth et al., 2000; Liuet al., 2004; Siddall et al., 2003]. Such topographic changes could increase the replenishing rate of the deepwater and thus reduce the water mass resident time (from around 23 to 19 years) in the SCS (Kao et al., underreview in Climate of the Past). According to Qu et al. [2006], the SCS throughflow (SCSTF) with annual meanvalue of 3.8 sverdrup involves inflow through the Luzon Strait and outflow mainly through the KS andMindoro Strait [Qu et al., 2006, 2009]. Thus, we speculate that the closure of the KS at low sea level standmight hamper the deep inflow through the Luzon Strait. In contrast, the opening of the KS, connecting theSCS and Indonesia Seas during EH [Linsley et al., 2010; Pelejero et al., 1999], would increase the outflow ofSCS water and naturally increase the Luzon deep inflow. Analyses from cores MD98-2178 and MD98-2161in the northwestern Celebes Sea also revealed a strengthened SCSTF during the EH, thus corroboratingour inference [Fan et al., 2013]. However, this pulse of intensification should be investigated further due tothe relatively low ARM/k and ARM/SIRM resolution during this interval.
A gradual strengthening of the deep current occurred during the MLH (10–0 ka), although its strength waslow when the AMOC was relatively stable (Figures 2 and 3a). The current direction during this period wasunsteady (Figure 2). The low PJ values further suggest a slow and variable deep current during the MLH.The ARM/k and ARM/SIRM ratios of site ODP1144 generally agree with our core during the Holocene, thusalso supporting the existence of a basin-wide current control (Figures 1 and S3) [Hu et al., 2012]. However,all data from ODP1144 prior to 12 ka cannot be used for magnetic susceptibility studies due to diageneticpyrite formation (Figure S3) [Hu et al., 2012].
Until ~12 ka B.P., the SCS deep current intensity was in antiphase with the AMOC intensity (Figures 2h and 2i)[McManus et al., 2004; Stanford et al., 2011], thus supporting the Atlantic-Pacific interbasin seesaw theory[Okazaki et al., 2010]. This is not the case during the Holocene, where changes in SCS deepwater currentare not linked to AMOC changes (Figure 2). This could be due to the opening of the Bering Strait at theend of the Younger Dryas. Indeed, with an open Bering Strait, a meltwater-induced AMOC weakening wouldalso freshen the surface waters of the North Pacific, thus preventing NPDW formation. This could also be dueto the relatively large influence of the opening of KS on the SCS deepwater characteristics compared to theclimatic changes occurring during the Holocene.
Finally, we find that throughout the deglaciation the current directions at core 10E203 were never purelymeridional, in contrast to the deep current meridional path previously proposed by Lüdmann et al. [2005].
5. Conclusion
Based on magnetic properties of a sediment core taken from the NE SCS, we reconstruct the history of theSCS deep current. We find a slightly stronger deep current at the LGM than during the late Holocene. But,the most striking feature of our record is a significant strengthening of the NE current during Heinrich stadial1. We suggest that this stronger NE current at about 2300–2400m water depth in the north SCS during H1 isdue to enhanced formation of NPDW and subsequent stronger NE current along the western margin of theNorth Pacific. The data also suggest slightly stronger deep current in the SCS during the YD. This is supportedby a transient experiment of the last deglaciation performed with an Earth system model, showing that ashutdown of the AMOC during H1 and the YD can enhance NPDW formation through oceanic and atmo-spheric teleconnections [Menviel et al., 2011]. We also suggest that the opening of the KS due to sea level risein the early Holocene likely enhanced deep circulation in the SCS. The overall current intensity variations dur-ing the deglaciation were in antiphase with AMOC changes, thus underscoring the tight connection betweenthe Atlantic and Pacific Oceans as well as the interbasin seesaw theory.
Geophysical Research Letters 10.1002/2016GL070342
ZHENG ET AL. SOUTH CHINA SEA DEEP CURRENT 8597

ReferencesBlunier, T., and E. J. Brook (2001), Timing of millennial-scale climate change in Antarctica and Greenland during the Last Glacial Period,
Science, 291(5501), 109–112, doi:10.1126/science.291.5501.109.Chen, H., X. Xie, D. Van Rooij, T. Vandorpe, M. Su, and D. Wang (2014), Depositional characteristics and processes of alongslope currents
related to a seamount on the northwestern margin of the Northwest Sub-Basin, South China Sea, Mar. Geol., 355, 36–53, doi:10.1016/j.margeo.2014.05.008.
Dansgaard, W., S. Johnsen, H. Clausen, D. Dahl-Jensen, N. Gundestrup, C. Hammer, C. Hvidberg, J. Steffensen, A. Sveinbjörnsdottir, andJ. Jouzel (1993), Evidence for general instability of past climate from a 250-kyr ice-core record, Nature, 364(6434), 218–220, doi:10.1038/364218a0.
de Menocal, P. B., E. P. Laine, and P. F. Ciesielski (1988), A magnetic signature of bottom current erosion, Phys. Earth Planet. In., 51(4), 326–348,doi:10.1016/0031-9201(88)90074-X.
Ellwood, B. B. (1980), Application of the anisotropy of magnetic susceptibility method as an indicator of bottom-water flow direction, Mar.Geol., 34(3), M83–M90, doi:10.1016/0025-3227(80)90066-3.
Ellwood, B. B., and M. T. Ledbetter (1979), Paleocurrent indicators in deep-sea sediment, Science, 203(4387), 1335–1337, doi:10.1126/science.203.4387.1335.
Fan, W., Z. Jian, F. Bassinot, and Z. Chu (2013), Holocene centennial-scale changes of the Indonesian and South China Sea throughflows:Evidences from the Makassar Strait, Global Planet. Change, 111, 111–117, doi:10.1016/j.gloplacha.2013.08.017.
Galbraith, E. D., S. L. Jaccard, T. F. Pedersen, D. M. Sigman, G. H. Haug, M. Cook, J. R. Southon, and R. Francois (2007), Carbon dioxide releasefrom the North Pacific abyss during the last deglaciation, Nature, 449, 890–893, doi:10.1038/nature06227.
Gherardi, J.-M., L. Labeyrie, J. McManus, R. Francois, L. Skinner, and E. Cortijo (2005), Evidence from the Northeastern Atlantic basin forvariability in the rate of the meridional overturning circulation through the last deglaciation, Earth Planet. Sci. Lett., 240, 710–723,doi:10.1016/j.epsl.2005.09.061.
Hamilton, N., and A. Rees (1970), The use of magnetic fabric in paleocurrent estimation, Palaeogeophysics, 445.Hanebuth, T., K. Stattegger, and P. M. Grootes (2000), Rapid flooding of the Sunda Shelf: A late-glacial sea-level record, Science, 288(5468),
1033–1035, doi:10.1126/science.288.5468.1033.Hrouda, F. (1982), Magnetic anisotropy of rocks and its application in geology and geophysics, Geophys. Surv., 5(1), 37–82, doi:10.1007/
BF01450244.Hu, D., P. Böning, C. M. Köhler, S. Hillier, N. Pressling, S. Wan, H. J. Brumsack, and P. D. Clift (2012), Deep sea records of the continental
weathering and erosion response to East Asian monsoon intensification since 14 ka in the South China Sea, Chem. Geol., 326–327, 1–18,doi:10.1016/j.chemgeo.2012.07.024.
Jaccard, S., and E. Galbraith (2013), Direct ventilation of the North Pacific did not reach the deep ocean during the last deglaciation, Geophys.Res. Lett., 40, 199–203, doi:10.1029/2012GL054118.
Jiang, D., and X. Lang (2010), Last Glacial Maximum East Asian monsoon: Results of PMIP simulations, J. Clim., 23, 5030–5038, doi:10.1175/2010JCLI3526.1.
Jelinek, V. (1981), Characterization of the magnetic fabric of rocks, Tectonophysics, 79(3), T63–T67, doi:10.1016/0040-1951(81)90110-4.Kissel, C., C. Laj, B. Lehman, L. Labyrie, and V. Bout-Roumazeilles (1997), Changes in the strength of the Iceland–Scotland Overflow Water in
the last 200,000 years: Evidence from magnetic anisotropy analysis of core SU90-33, Earth Planet. Sci. Lett., 152(1), 25–36, doi:10.1016/S0012-821X(97)00146-5.
Kissel, C., C. Laj, T. Mulder, C. Wandres, and M. Cremer (2009), The magnetic fraction: A tracer of deep water circulation in the North Atlantic,Earth Planet. Sci. Lett., 288, 444–454, doi:10.1016/j.epsl.2009.10.005.
Kissel, C., C. Laj, M. Kienast, T. Bolliet, A. Holbourn, P. Hill, W. Kuhnt, and P. Braconnot (2010), Monsoon variability and deep oceanic circulationin the western equatorial Pacific over the last climatic cycle: Insights from sedimentary magnetic properties and sortable silt,Paleoceanography, 25, doi:10.1029/2010PA001980.
Kissel, C., A. Van Toer, C. Laj, E. Cortijo, and E. Michel (2013), Variations in the strength of the North Atlantic bottom water during Holocene,Earth Planet. Sci. Lett., 369, 248–259, doi:10.1016/j.epsl.2013.03.042.
Kuhlbrodt, T., A. Griesel, M. Montoya, A. Levermann, M. Hofmann, and S. Rahmstorf (2007), On the driving processes of the Atlantic meri-dional overturning circulation, Rev. Geophys., 45, doi:10.1029/2004RG000166.
Lüdmann, T., H. K. Wong, and K. Berglar (2005), Upward flow of North Pacific Deep Water in the northern South China Sea as deduced fromthe occurrence of drift sediments, Geophys. Res. Lett., 32, doi:10.1029/2004GL021967.
Lan, J., Y. Wang, F. Cui, and N. Zhang (2015), Seasonal variation in the South China Sea deep circulation, J. Geophys. Res. Oceans, doi:10.1002/2014JC010413.
Ledbetter, M. T., and B. B. Ellwood (1980), Spatial and temporal changes in bottom-water velocity and direction from analysis of particle sizeand alignment in deep-sea sediment, Mar. Geol., 38, 245–261, doi:10.1016/0025-3227(80)90062-6.
Li, H., Y. Wang, W. Zhu, Q. Xu, Y. He, W. Tang, H. Zhuo, D. Wang, J. Wu, and D. Li (2013), Seismic characteristics and processes of the Plio-Quaternary unidirectionally migrating channels and contourites in the northern slope of the South China Sea, Mar. Petrol. Geol., 43,370–380, doi:10.1016/j.marpetgeo.2012.12.010.
Linsley, B. K., Y. Rosenthal, and D. W. Oppo (2010), Holocene evolution of the Indonesian throughflow and the western Pacific warm pool,Nat. Geosci., 3, 578–583, doi:10.1038/ngeo920.
Liu, J. P., J. D. Milliman, S. Gao, and P. Cheng (2004), Holocene development of the Yellow River’s subaqueous delta, North Yellow Sea, Mar.Geol., 209, 45–67, doi:10.1016/j.margeo.2004.06.009.
Liu, Z., S. Tuo, C. Colin, J. T. Liu, C.-Y. Huang, K. Selvaraj, C.-T. A. Chen, Y. Zhao, F. P. Siringan, and S. Boulay (2008), Detrital fine-grained sedimentcontribution from Taiwan to the northern South China Sea and its relation to regional ocean circulation,Mar. Geol., 255, 149–155,doi:10.1016/j.margeo.2008.08.003.
Liu, Z., C. Colin, X. Li, Y. Zhao, S. Tuo, Z. Chen, F. P. Siringan, J. T. Liu, C.-Y. Huang, and C.-F. You (2010), Clay mineral distribution in surfacesediments of the northeastern South China Sea and surrounding fluvial drainage basins: Source and transport, Mar. Geol., 277, 48–60,doi:10.1016/j.margeo.2010.08.010.
Lund, D. C., A. C. Mix, and J. Southon (2011), Increased ventilation age of the deep northeast Pacific Ocean during the last deglaciation, Nat.Geosci., 4, 771–774, doi:10.1038/ngeo1272.
Marshall, J., and K. Speer (2012), Closure of the meridional overturning circulation through Southern Ocean upwelling, Nat. Geosci., 5,171–180, doi:10.1038/ngeo1391.
Geophysical Research Letters 10.1002/2016GL070342
ZHENG ET AL. SOUTH CHINA SEA DEEP CURRENT 8598
AcknowledgmentsWe are grateful to Catherine Kissel,Xiaodong Tan, Tatiana Ilyina, NaomiHarada, and three anonymous reviewersfor providing the insightful suggestionson ourmanuscript. We thank the crew ofthe R/V Shiyan 3 of South China SeaInstitute of Oceanology, ChineseAcademy of Sciences, who helped us alot during the cruise. Our work is sup-ported by the National Natural ScienceFoundation of China (41506051,91128206, 41376057, 91328207, and41430965); the Strategic PriorityResearch Program of the ChineseAcademy of Sciences (XDA11030302);the Guangdong Natural ScienceFoundation (KLMMR-2015-B-07); andthe Key Laboratory of Marine Geologyand Environment, Institute ofOceanology, CAS (MGE2015KG03).L. Menviel acknowledges funding fromthe Australian Research Council grantDE150100107. Thedatapresented in thispaper can be found in the supportinginformation. Our measurement wasconducted at Guangzhou Institute ofGeochemistry, Chinese Academy ofSciences.

Max, L., L. Lembke-Jene, J.-R. Riethdorf, R. Tiedemann, D. Nürnberg, H. Kühn, and A. Mackensen (2014), Pulses of enhanced North PacificIntermediate Water ventilation from the Okhotsk Sea and Bering Sea during the last deglaciation, Clim. Past, 10, 591–605, doi:10.5194/cp-10-591-2014.
McCave, I. N., B. Manighetti, and S. G. Robinson (1995), Sortable silt and fine sediment size/composition slicing: Parameters for palaeocurrentspeed and palaeoceanography, Paleoceanography, 10(3), 593–610, doi:10.1029/94PA03039.
McManus, J., R. Francois, J.-M. Gherardi, L. Keigwin, and S. Brown-Leger (2004), Collapse and rapid resumption of Atlantic meridionalcirculation linked to deglacial climate changes, Nature, 428, 834–837, doi:10.1038/nature02494.
Menviel, L., A. Timmermann, O. E. Timm, and A. Mouchet (2011), Deconstructing the Last Glacial Termination: The role of millennial andorbital-scale forcings, Quat. Sci. Rev., 30, 1155–1172, doi:10.1016/j.quascirev.2011.02.005.
Menviel, L., A. Timmermann, O. E. Timm, A. Mouchet, A. Abe-Ouchi, M. Chikamoto, N. Harada, R. Ohgaito, and Y. Okazaki (2012), Removing theNorth Pacific halocline: Effects on global climate, ocean circulation and the carbon cycle, Deep Sea Res. Part II, 61, 106–113, doi:10.1016/j.dsr2.2011.03.005.
Menviel, L., M. England, K. Meissner, A. Mouchet, and J. Yu (2014), Atlantic-Pacific seesaw and its role in outgassing CO2 during Heinrichevents, Paleoceanography, 29, 58–70, doi:10.1002/2013PA002542.
Okazaki, Y., A. Timmermann, L. Menviel, N. Harada, A. Abe-Ouchi, M. Chikamoto, A. Mouchet, and H. Asahi (2010), Deepwater formation in theNorth Pacific during the Last Glacial Termination, Science, 329, 200–204, doi:10.1126/science.1190612.
Okumura, Y. M., C. Deser, A. Hu, A. Timmermann, and S.-P. Xie (2009), North Pacific climate response to freshwater forcing in the subarcticNorth Atlantic: Oceanic and atmospheric pathways, J. Clim., 22, 1424–1445, doi:10.1175/2008JCLI2511.1.
Parés, J., N. Hassold, D. Rea, and B. van Der Pluijm (2007), Paleocurrent directions from paleomagnetic reorientation of magnetic fabrics indeep-sea sediments at the Antarctic Peninsula Pacific margin (ODP Sites 1095, 1101), Mar. Geol., 242, 261–269, doi:10.1016/j.margeo.2007.04.002.
Park, C.-K., S.-J. Doh, D.-W. Suk, and K.-H. Kim (2000), Sedimentary fabric on deep-sea sediments from KODOS area in the eastern Pacific,Mar.Geol., 171(1), 115–126, doi:10.1016/S0025-3227(00)00107-9.
Pelejero, C., M. Kienast, L. Wang, and J. O. Grimalt (1999), The flooding of Sundaland during the last deglaciation: Imprints in hemipelagicsediments from the southern South China Sea, Earth Planet. Sci. Lett., 171(4), 661–671, doi:10.1016/S0012-821X(99)00178-8.
Qu, T., J. B. Girton, and J. A. Whitehead (2006), Deepwater overflow through Luzon Strait, J Geophys Res: Oceans (1978–2012), 111(C1),doi:10.1029/2005JC003139.
Qu, T., Y. T. Song, and T. Yamagata (2009), An introduction to the South China Sea throughflow: Its dynamics, variability, and application forclimate, Dyn. Atmos. Oceans, 47, 3–14, doi:10.1016/j.dynatmoce.2008.05.001.
Rae, J. W., M. Sarnthein, G. L. Foster, A. Ridgwell, P. M. Grootes, and T. Elliott (2014), Deep water formation in the North Pacific and deglacialCO2 rise, Paleoceanography, doi:10.1002/2013PA002570.
Saenko, O. A., A. Schmittner, and A. J. Weaver (2004), The Atlantic-Pacific seesaw, J. Climate, 17, 2033–2038, doi:10.1175/1520-0442(2004)017<2033:TAS>2.0.CO;2.
Shao, L., X. Li, J. Geng, X. Pang, Y. Lei, P. Qiao, L. Wang, and H. Wang (2007), Deep water bottom current deposition in the northern SouthChina Sea, Sci. China, Ser. D Earth Sci., 50, 1060–1066, doi:10.1007/s11430-007-0015-y.
Shu, Y., H. Xue, D. Wang, F. Chai, Q. Xie, J. Yao, and J. Xiao (2014), Meridional overturning circulation in the South China Sea envisioned fromthe high-resolution global reanalysis data GLBa0.08, J. Geophys. Res. Oceans, 119, 3012–3028, doi:10.1002/2013JC009583.
Siddall, M., E. J. Rohling, A. Almogi-Labin, C. Hemleben, D. Meischner, I. Schmelzer, and D. Smeed (2003), Sea-level fluctuations during the lastglacial cycle, Nature, 423(6942), 853–858, doi:10.1038/nature01690.
Stommel, H. (1961), Thermohaline convectionwith two stable regimes of flow, Tellus, 13(2), 224–230, doi:10.1111/j.2153-3490.1961.tb00079.x.Sun, Y., D. W. Oppo, R. Xiang, W. Liu, and S. Gao (2005), Last deglaciation in the Okinawa Trough: Subtropical northwest Pacific link to
Northern Hemisphere and tropical climate, Paleoceanography, 20, doi:10.1029/2004PA001061.Stanford, J., E. Rohling, S. Bacon, A. Roberts, F. Grousset, and M. Bolshaw (2011), A new concept for the paleoceanographic evolution of
Heinrich event 1 in the North Atlantic, Quat. Sci. Rev., 30(9), 1047–1066, doi:10.1016/j.quascirev.2011.02.003.Talley, L. D., J. L. Reid, and P. E. Robbins (2003), Data-based meridional overturning streamfunctions for the global ocean, J. Clim., 16(19),
3213–3226, doi:10.1175/1520-0442(2003)016<3213:DMOSFT>2.0.CO;2.Wan, S., and Z. Jian (2014), Deep water exchanges between the South China Sea and the Pacific since the Last Glacial Period,
Paleoceanography, doi:10.1002/2013PA002578.Wan, S., A. Li, P. D. Clift, S. Wu, K. Xu, and T. Li (2010), Increased contribution of terrigenous supply from Taiwan to the northern South China
Sea since 3 Ma, Mar. Geol., 278(1), 115–121, doi:10.1016/j.margeo.2010.09.008.Wang, G., S. P. Xie, T. Qu, and R. X. Huang (2011), Deep South China Sea circulation, Geophys. Res. Lett., 38, doi:10.1029/2010GL046626.Wei, G.-J., C.-Y. Huang, C.-C. Wang, M.-Y. Lee, and K.-Y. Wei (2006), High-resolution benthic foraminifer δ
13C records in the South China Sea
during the last 150 ka, Mar. Geol., 232(3), 227–235, doi:10.1016/j.margeo.2006.08.005.Wolff, J. A., B. B. Ellwood, and S. D. Sachs (1989), Anisotropy of magnetic susceptibility in welded tuffs: Application to a welded-tuff dyke in
the Tertiary Trans-Pecos Texas volcanic province, USA, Bull. Volcanol., 51(4), 299–310.Wu, Q., C. Colin, Z. Liu, F. Thil, Q. Dubois-Dauphin, N. Frank, K. Tachikawa, L. Bordier, and E. Douville (2015), Neodymium isotopic composition
in foraminifera and authigenic phases of South China Sea sediments: Implications for the hydrology of the North Pacific Ocean over thepast 25 kyr, Geochem. Geophys. Geosyst., doi:10.1002/2015GC005871.
Wu, Y., Z. Zhu, S. Qiu, Y. Han, J. Cai, and Z. Rao (2016), Magnetic stratigraphy constraints on the Matuyama–Brunhes boundary recorded in aloess section at the southern margin of Chinese Loess Plateau, Geophys. J. Int., 204, 1072–1085, doi:10.1093/gji/ggv502.
Yu, K., Q. Hua, J. X. Zhao, E. Hodge, D. Fink, and M. Barbetti (2010), Holocene marine14C reservoir age variability: Evidence from
230Th-dated
corals in the South China Sea, Paleoceanography, 25, doi:10.1029/2009PA001831.Zhao, Y., Z. Liu, Y. Zhang, J. Li, M. Wang, W. Wang, and J. Xu (2015), In situ observation of contour currents in the northern South China Sea:
Applications for deepwater sediment transport, Earth Planet. Sci. Lett., 430, 477–485, doi:10.1016/j.epsl.2015.09.008.s.
Geophysical Research Letters 10.1002/2016GL070342
ZHENG ET AL. SOUTH CHINA SEA DEEP CURRENT 8599