deep water mechanical harvesting of hydrilla in...
TRANSCRIPT

DEEP WATER MECHANICAL HARVESTING OF HYDRILLA IN WEST LAKE TOHOPEKALIGA,
FLORIDA
Dean Jones1, 2, William Haller 2 and Mike Hulon 3
1Osceola County 2University of Florida
3Texas Aquatic Harvesting, Inc.
Demonstration Project on Hydrilla and Hygrophila
• Osceola County awarded $2.8 million by the EPA for this project
• Goal: To find new and alternative methods of control for hydrilla and hygrophila and to share the findings with the industry and public
• 2006-2012
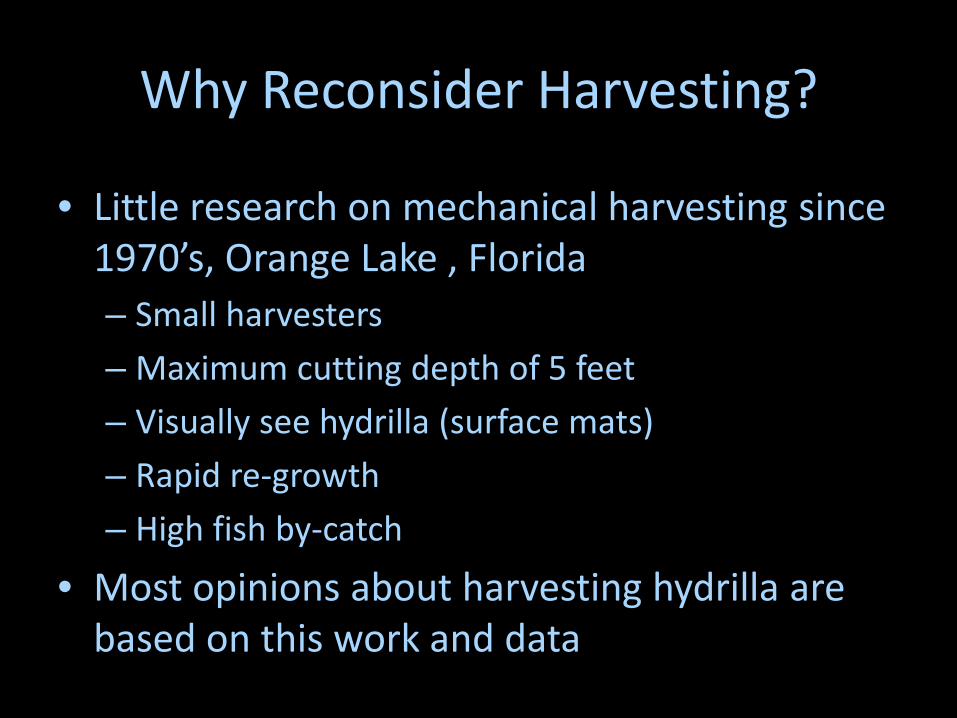
Why Reconsider Harvesting?
• Little research on mechanical harvesting since 1970’s, Orange Lake , Florida – Small harvesters – Maximum cutting depth of 5 feet – Visually see hydrilla (surface mats) – Rapid re-growth – High fish by-catch
• Most opinions about harvesting hydrilla are based on this work and data

Other Considerations • Endangered species restrictions
– Everglades Snail Kite (Rostrhamus sociabilis)
• Limited management resources – Herbicide resistance and costs
• Integrated Pest Management • Equipment and technology advances • Compare results with Orange Lake Study
Haller et al. 1980 – Fish by catch data – Observation – hydrilla did not return in some
areas harvested for approximately one year

Aquamarine H-650

Aquamarine Aquatrio

Aquamarine Aquatrio
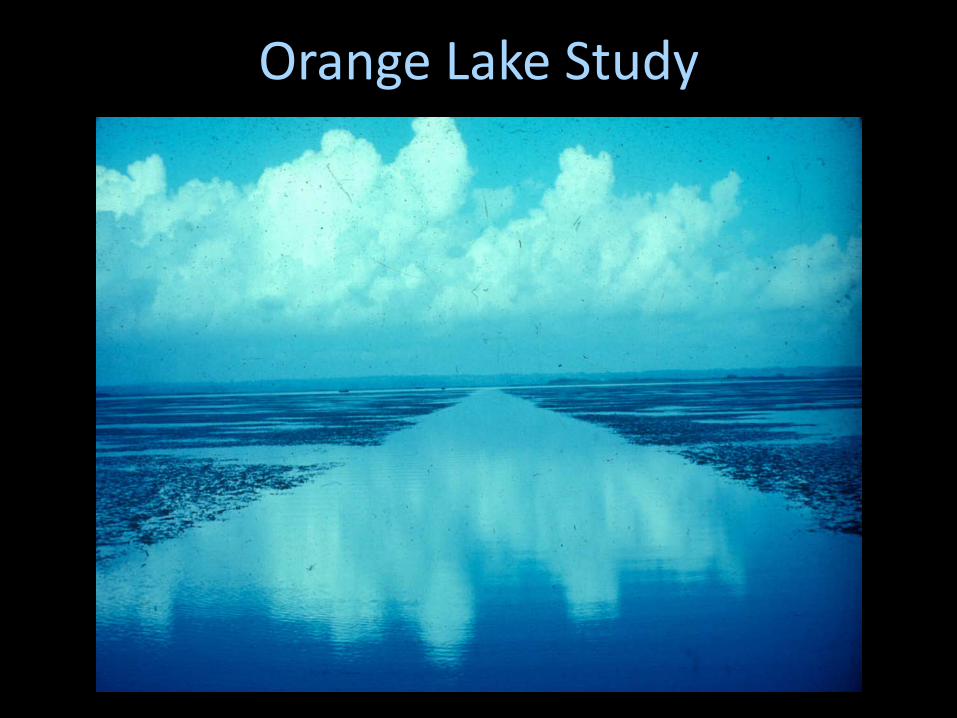
Orange Lake Study

Model 800 Mechanical Harvester

Equipment Advances

Technology Advances

Goals • Harvest a 40 ha area (100 acres) of deep water
hydrilla in West Lake Toho • Determine Efficacy and longevity of control
– Is Deep Water Hydrilla Harvesting efficient? – Can we harvest root crowns?
• Determine fish by catch and compare with Orange Lake Study results – Is it possible to reduce fish by-catch?
• Determine magnitude and duration impacts of selected water quality parameters before, during and following the harvesting operation

Efficacy

Efficacy

1 DAT Comparison

2 MAT Comparison
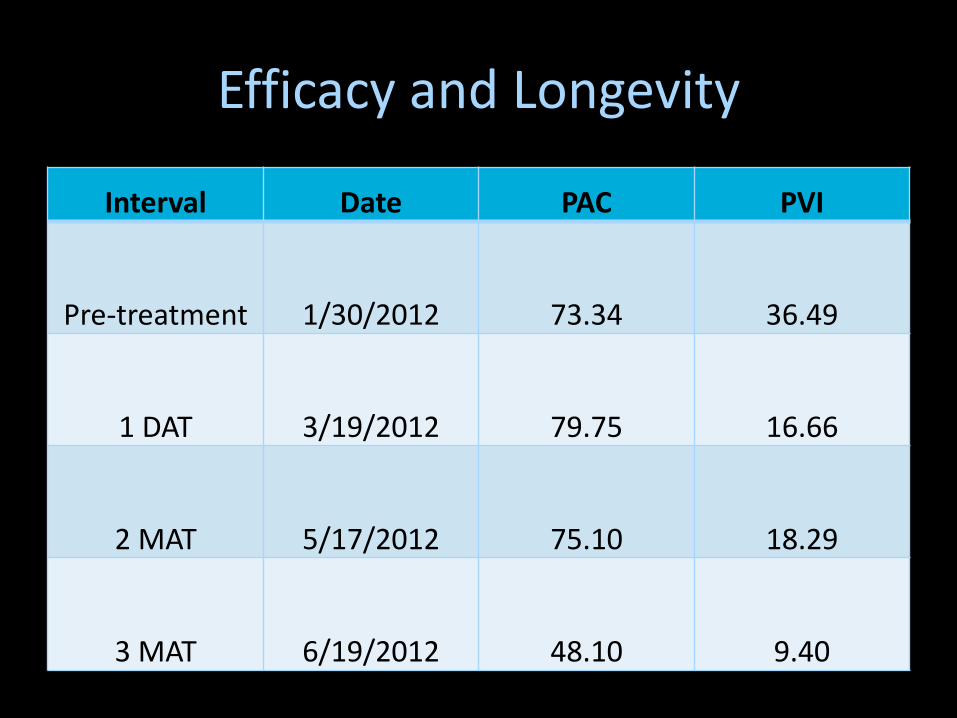
Efficacy and Longevity
Interval Date PAC PVI
Pre-treatment 1/30/2012 73.34 36.49
1 DAT 3/19/2012 79.75 16.66
2 MAT 5/17/2012 75.10 18.29
3 MAT 6/19/2012 48.10 9.40

Fish By Catch Comparison

Fish By Catch Comparison

Fish By Catch Comparison

Harvester Performance Transect Number
1 2 3 4
Area (ha) (ac)
0.117 0.289
0.116 0.286
0.138 0.341
0.117 0.289
Area (ha/hr) (ac/hr)
.98 2.35
0.82 2.02
0.88 2.18
0.90 2.22
Weight (hydrilla) kg/trans. lbs/trans. kg/ha lbs/ac
158 348
1,350 1,204
191 420
1,646 1,469
135 296 978 868
129 284
1,102 983

Fish By Catch Results
Fish
Total
Bluegill No. WT(g)
92 222.1
Redear No. WT(g)
11 311.8
Warmouth No. WT(g)
2 32.0
Black crappie No. WT(g)
2 80.5
Total Sportfish
No. WT(g)
107 646.4
Total All Fish* No.
WT(g) 141
699.5
% sport fish No. WT(g)
75.9 92.4

Fish By Catch Comparison Fish
Mean ± SD
LAKE TOHO 2012 Total All Fish Harvested
No./ha g/ha
299 ± 151 1,470 ± 712
ORANGE LAKE 1977 Total All Fish
No./ha g/ha
66,000 ± 2,000 85,000 ± 12,000
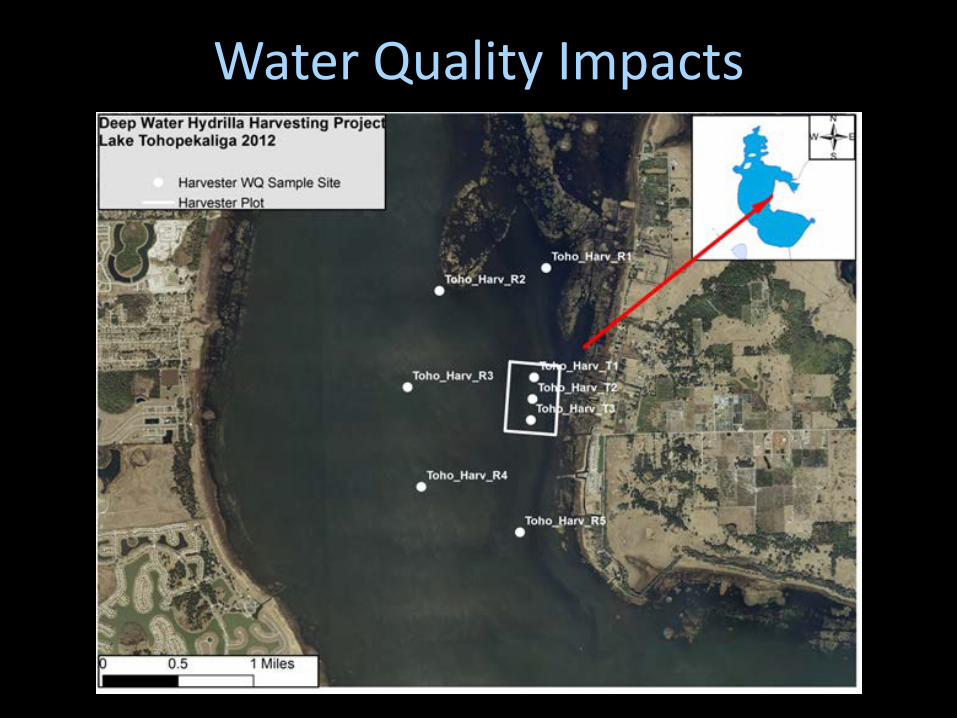
Water Quality Impacts

Water Quality Impacts
• Water samples collected -7, -1, 0, 1, 4, 7, 15 days after harvesting
• 3 samples sites in harvest area • 5 reference sites 1,000 m outside harvest area • Water samples collected at depth of 1m • Average depth of water samples sites is 2m

Results (harvest area and control)
• Secchi – Higher in harvest plot 1 week before harvesting
• Total Chlorophyll – Lower in harvest area 1 week before harvesting
• Total Nitrogen – Lower in harvest plot 1 week before harvesting
• Total Phosphorus – Lower in harvest area 1 week and 1 day before harvesting and 7 DAH
• Only post harvest statistical difference is phosphorus 7 DAT

Results (harvest area and control)
• Also no statistical differences observed in – Turbidity – Dissolved Oxygen – pH – Conductivity
• Temperature difference 1 and 4 DAT (result of time of day sampled)
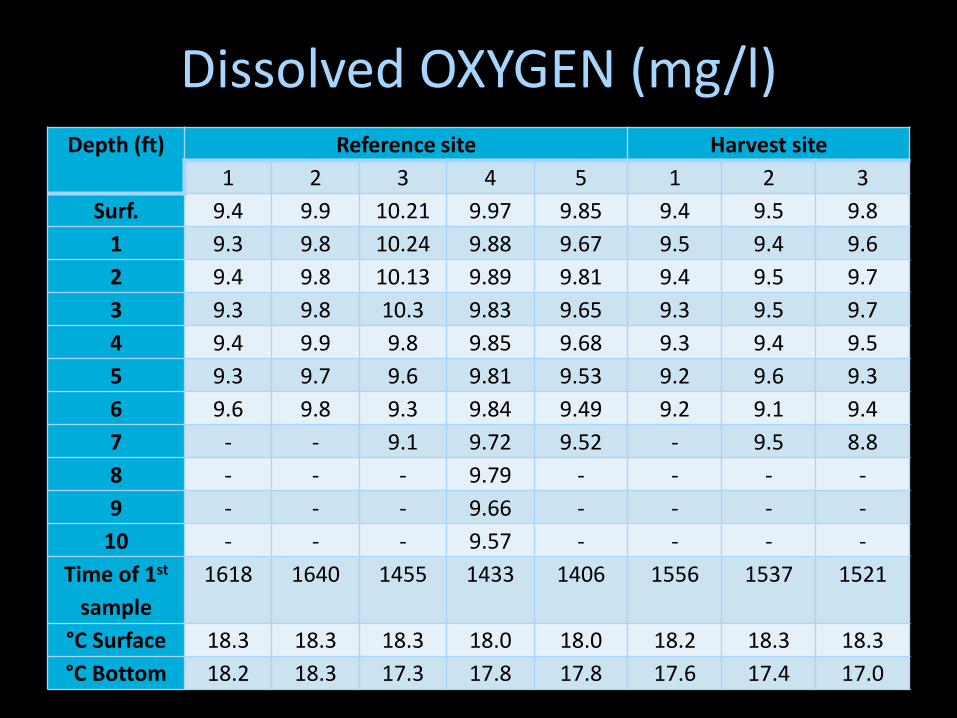
Dissolved OXYGEN (mg/l) Depth (ft) Reference site Harvest site
1 2 3 4 5 1 2 3 Surf. 9.4 9.9 10.21 9.97 9.85 9.4 9.5 9.8
1 9.3 9.8 10.24 9.88 9.67 9.5 9.4 9.6 2 9.4 9.8 10.13 9.89 9.81 9.4 9.5 9.7 3 9.3 9.8 10.3 9.83 9.65 9.3 9.5 9.7 4 9.4 9.9 9.8 9.85 9.68 9.3 9.4 9.5 5 9.3 9.7 9.6 9.81 9.53 9.2 9.6 9.3 6 9.6 9.8 9.3 9.84 9.49 9.2 9.1 9.4 7 - - 9.1 9.72 9.52 - 9.5 8.8 8 - - - 9.79 - - - - 9 - - - 9.66 - - - -
10 - - - 9.57 - - - - Time of 1st
sample 1618 1640 1455 1433 1406 1556 1537 1521
°C Surface 18.3 18.3 18.3 18.0 18.0 18.2 18.3 18.3 °C Bottom 18.2 18.3 17.3 17.8 17.8 17.6 17.4 17.0
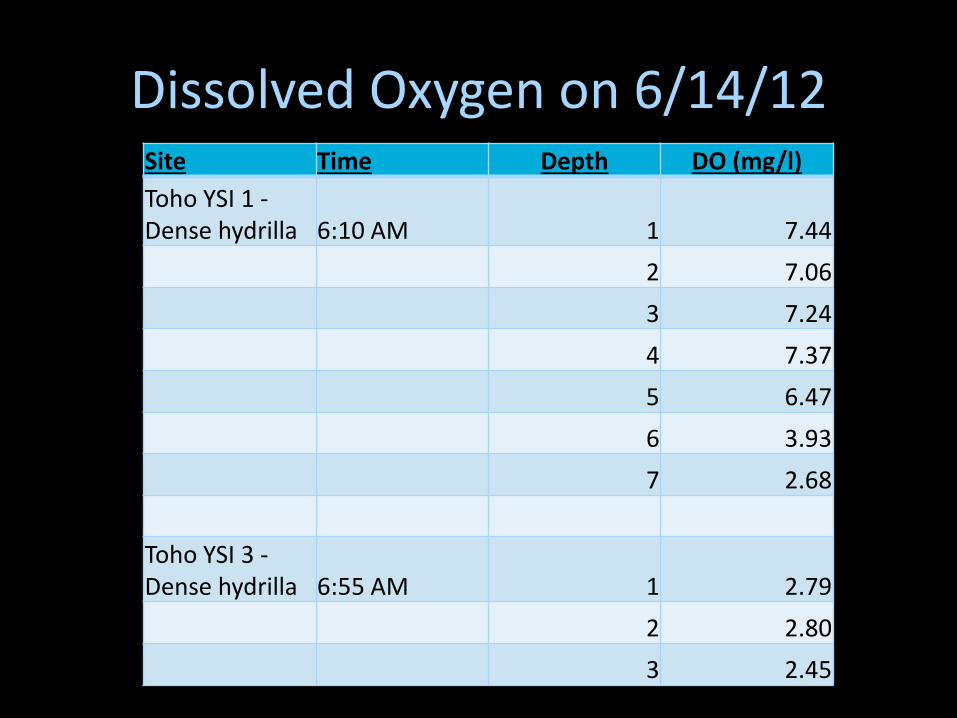
Dissolved Oxygen on 6/14/12 Site Time Depth DO (mg/l) Toho YSI 1 - Dense hydrilla 6:10 AM 1 7.44
2 7.06 3 7.24 4 7.37 5 6.47 6 3.93 7 2.68
Toho YSI 3 - Dense hydrilla 6:55 AM 1 2.79
2 2.80 3 2.45

Comparison Summary
Parameter Orange Lake Lake Tohopekaliga Cutting depth 5 feet 10 feet Hydrilla biomass harvested
12 tons per acres < 1 ton per acre
Hydrilla distribution 80% top 2 feet 100% bottom 4 feet Dissolved oxygen Low in bottom ½ of
water column Uniform throughout water column
By catch 66,000 fish per ha 299 fish per ha Length of control 2-4 months > 4 months Acres per hour harvested
<1 2.2
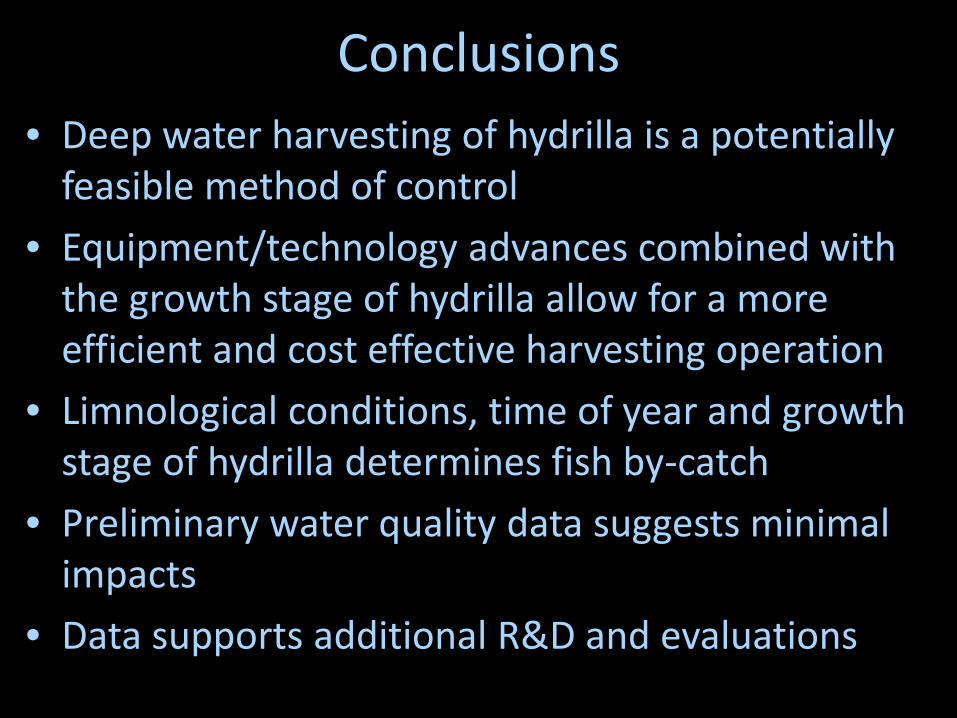
Conclusions • Deep water harvesting of hydrilla is a potentially
feasible method of control • Equipment/technology advances combined with
the growth stage of hydrilla allow for a more efficient and cost effective harvesting operation
• Limnological conditions, time of year and growth stage of hydrilla determines fish by-catch
• Preliminary water quality data suggests minimal impacts
• Data supports additional R&D and evaluations

Acknowledgements
• Osceola County Board of County Commission • United States Environmental Protection
Agency • Texas Aquatic Harvesting Inc. • Florida Fish and Wildlife Conservation
Commission • South Florida Water Management District
Analytical Services Lab