deep tutorial: parallel performance profiling at the ... · pdf filedeep tutorial: parallel...
TRANSCRIPT

® PACIFIC-SIERRA RESEARCH
DEEP Tutorial: DEEP Tutorial: Parallel Performance ProfilingParallel Performance Profiling
at the Source Code Level.at the Source Code Level.
David McNamaraDavid McNamaraVeridian PSRVeridian PSR
September 2000September 2000
® PACIFIC-SIERRA RESEARCH
DEEP Tutorial: TopicsDEEP Tutorial: Topics•• Who is Veridian PSR?Who is Veridian PSR?•• What is DEEP?What is DEEP?•• What can DEEP do for my programs?What can DEEP do for my programs?•• DEEP program analysis demonstration.DEEP program analysis demonstration.
–– Gathering the data.Gathering the data.–– Starting DEEP.Starting DEEP.–– Finding Bottlenecks.Finding Bottlenecks.–– Improving the code.Improving the code.
•• DEEP Debugger.DEEP Debugger.•• DEEP future plans.DEEP future plans.

® PACIFIC-SIERRA RESEARCH
Veridian -- Pacific-Sierra ResearchHigh Performance Computing GroupVeridian Veridian ---- PacificPacific--Sierra ResearchSierra Research
High Performance Computing GroupHigh Performance Computing Group•• PSR founded 1971, part of Veridian since 1998.PSR founded 1971, part of Veridian since 1998.•• High Performance Computing group has been in Santa High Performance Computing group has been in Santa
Monica, CA since 1979.Monica, CA since 1979.•• Products: VAST, DEEPProducts: VAST, DEEP•• Code optimization and porting, seminars on parallel Code optimization and porting, seminars on parallel
programming, consulting.programming, consulting.•• Past and present customers include NEC, Cray, IBM, Past and present customers include NEC, Cray, IBM,
Fujitsu, Hitachi, Convex, Alliant, Intel, DARPA, Absoft, Fujitsu, Hitachi, Convex, Alliant, Intel, DARPA, Absoft, Apogee, ...Apogee, ...

® PACIFIC-SIERRA RESEARCH
DEvelopment Environmentfor Parallel Programs:
DEEP
DEDEvelopmentvelopment EEnvironmentnvironmentfor for PParallel Programs: arallel Programs:
DEEPDEEP•• Motivation:Motivation: Understanding parallel program Understanding parallel program
performance and behavior is performance and behavior is hardhard..•• Goal:Goal: Provide an integrated, crossProvide an integrated, cross--platform, platform,
parallel development environment parallel development environment at the user’s at the user’s source code levelsource code level..
•• Originally developed under DARPA SBIR contract.Originally developed under DARPA SBIR contract.•• Status:Status: First available in 1999.First available in 1999.
® PACIFIC-SIERRA RESEARCH
DEEP: Target Parallel SystemsDEEP: Target Parallel SystemsDEEP: Target Parallel Systems•• One environment for all popular parallel One environment for all popular parallel
programming choices.programming choices.–– Fortran and C (and mixed). C++ soon.Fortran and C (and mixed). C++ soon.
•• Shared Memory Parallel.Shared Memory Parallel.–– Automatic parallelizationAutomatic parallelization–– OpenMP ProgrammingOpenMP Programming
•• Distributed Memory Parallel.Distributed Memory Parallel.–– Data Parallel Programming (HPF and Data Parallel C)Data Parallel Programming (HPF and Data Parallel C)–– MPI ProgrammingMPI Programming
•• Scalar PerformanceScalar Performance–– Cache misses, branch performance, …Cache misses, branch performance, …
•• Vector PerformanceVector Performance–– Mflops Mflops rate, vector length, ….rate, vector length, ….
® PACIFIC-SIERRA RESEARCH
DEEP: OverviewDEEP: OverviewDEEP: Overview•• Supports both Unix and Windows interfaces.Supports both Unix and Windows interfaces.
–– UnixUnix/Motif (Alpha, SUN/Solaris, IBM/AIX, SGI/IRIX, ...)/Motif (Alpha, SUN/Solaris, IBM/AIX, SGI/IRIX, ...)–– LinuxLinux/Motif (x86, Alpha)/Motif (x86, Alpha)–– WindowsWindows/NT, 95, 98 (x86)/NT, 95, 98 (x86)–– Can run DEEP on nonCan run DEEP on non--target system (cross analyze).target system (cross analyze).
•• Coordinated set of tools.Coordinated set of tools.–– Move quickly between tools, point and click.Move quickly between tools, point and click.–– Single master graphical user interface.Single master graphical user interface.–– Framework allows organization of lots of informationFramework allows organization of lots of information
•• better than many separate windows.better than many separate windows.
® PACIFIC-SIERRA RESEARCH
DEEP: FeaturesDEEP: FeaturesDEEP: Features•• ProfilingProfiling
–– Where is the time spent? Which are the most important Where is the time spent? Which are the most important loops? How well are these loops being optimized?loops? How well are these loops being optimized?
–– Where are most of the messages passed? Is the processor Where are most of the messages passed? Is the processor load balanced? How much waiting is being done at load balanced? How much waiting is being done at synchronization points?synchronization points?
•• Program Structure BrowsingProgram Structure Browsing–– How are the procedures connected to each other?How are the procedures connected to each other?–– Where are global (parallel) variables referenced and set?Where are global (parallel) variables referenced and set?
•• Debugging (Under development)Debugging (Under development)–– What is the value of this distributed array?What is the value of this distributed array?–– What is the current status of the parallel processes?What is the current status of the parallel processes?–– What runWhat run--time data types do I have defined?time data types do I have defined?

® PACIFIC-SIERRA RESEARCH
DEEP: Data gatheringDEEP: Data gatheringDEEP: Data gathering
Optimization
Symbols
Instrumentation
Code StructureSource Code
DebuggingDEEP
UserDisplays

® PACIFIC-SIERRA RESEARCH
DEEP: Profiling at All LevelsDEEP: Profiling at All LevelsDistributed Memory Parallel System (load balance, communication traffic).
Message passing library, data parallel languages. Top level loops.
Shared Memory Node (synchronization bottlenecks).
OpenMP, automatic parallelization. Outer loops.
Vector Unit (MOP rates, % utilization)
Hand or auto vectorization. Inner loops.
Cache Memory Levels (cache miss rates).
L3, L2, L1. Loop nests.
Scalar Unit (instruction issue rates)
Inner loops.
® PACIFIC-SIERRA RESEARCH
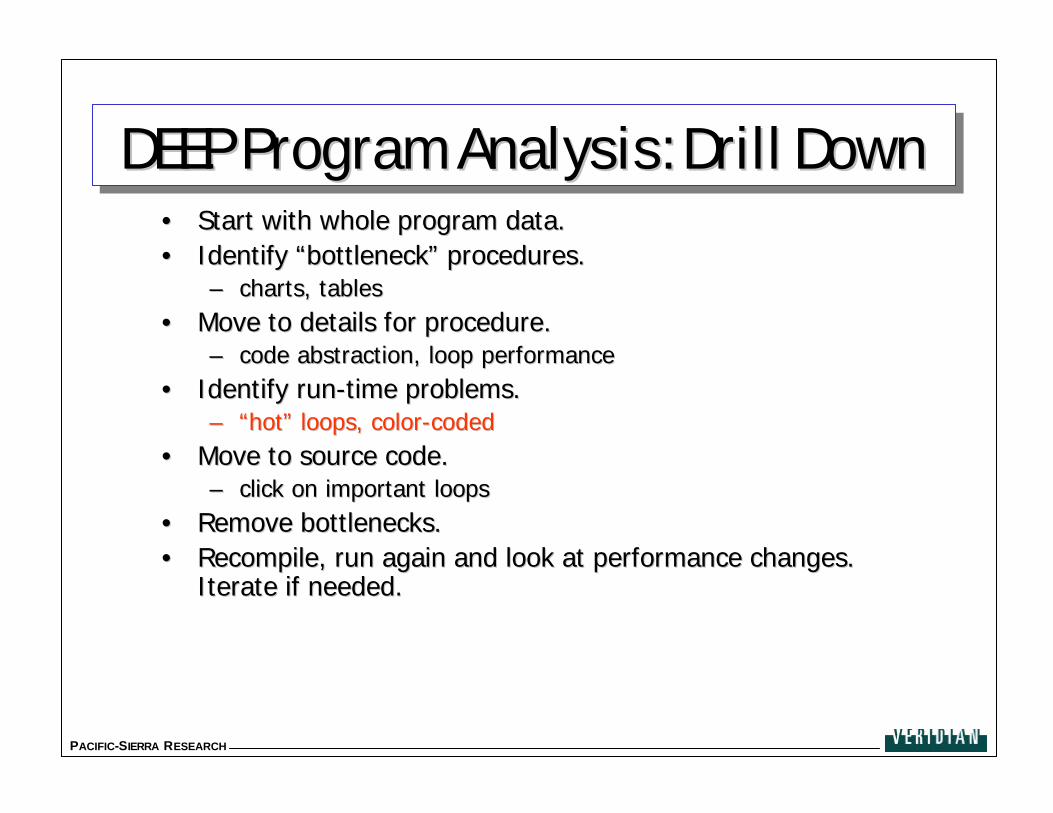
DEEP Program Analysis: Drill DownDEEP Program Analysis: Drill DownDEEP Program Analysis: Drill Down•• Start with whole program data.Start with whole program data.•• Identify “bottleneck” procedures.Identify “bottleneck” procedures.
–– charts, tablescharts, tables•• Move to details for procedure.Move to details for procedure.
–– code abstraction, loop performancecode abstraction, loop performance•• Identify runIdentify run--time problems. time problems.
–– “hot” loops, color“hot” loops, color--codedcoded•• Move to source code.Move to source code.
–– click on important loopsclick on important loops•• Remove bottlenecks.Remove bottlenecks.•• Recompile, run again and look at performance changes. Recompile, run again and look at performance changes.
Iterate if needed.Iterate if needed.
® PACIFIC-SIERRA RESEARCH
DEEP: Drill DownDEEP: Drill Down
•• Or, drill up?Or, drill up?
® PACIFIC-SIERRA RESEARCH
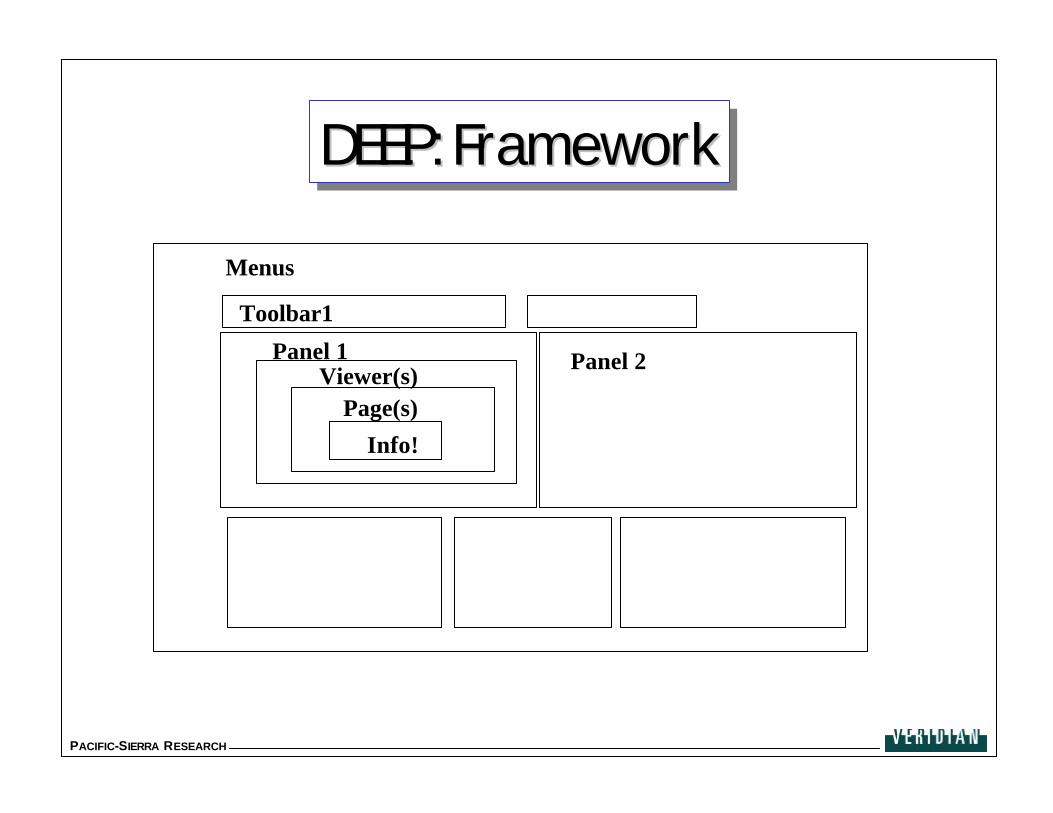
DEEP: FrameworkDEEP: FrameworkDEEP: Framework
Toolbar1
Panel 1Viewer(s)
Page(s)
Info!
Panel 2
Menus

® PACIFIC-SIERRA RESEARCH
DEEP: MPI SupportDEEP: MPI Support
•• MPI message load balance is recorded and displayed.MPI message load balance is recorded and displayed.•• All MPI call sites in the application are profiled.All MPI call sites in the application are profiled.•• Wait time in MPI calls is presented, so inefficient Wait time in MPI calls is presented, so inefficient
synchronizations can be spotted.synchronizations can be spotted.•• MPI usage is summarized for each routine in the MPI usage is summarized for each routine in the
program.program.•• MPI operations are highlighted in the call tree and MPI operations are highlighted in the call tree and
the code abstract, so you can move quickly to that the code abstract, so you can move quickly to that spot in the code.spot in the code.
® PACIFIC-SIERRA RESEARCH
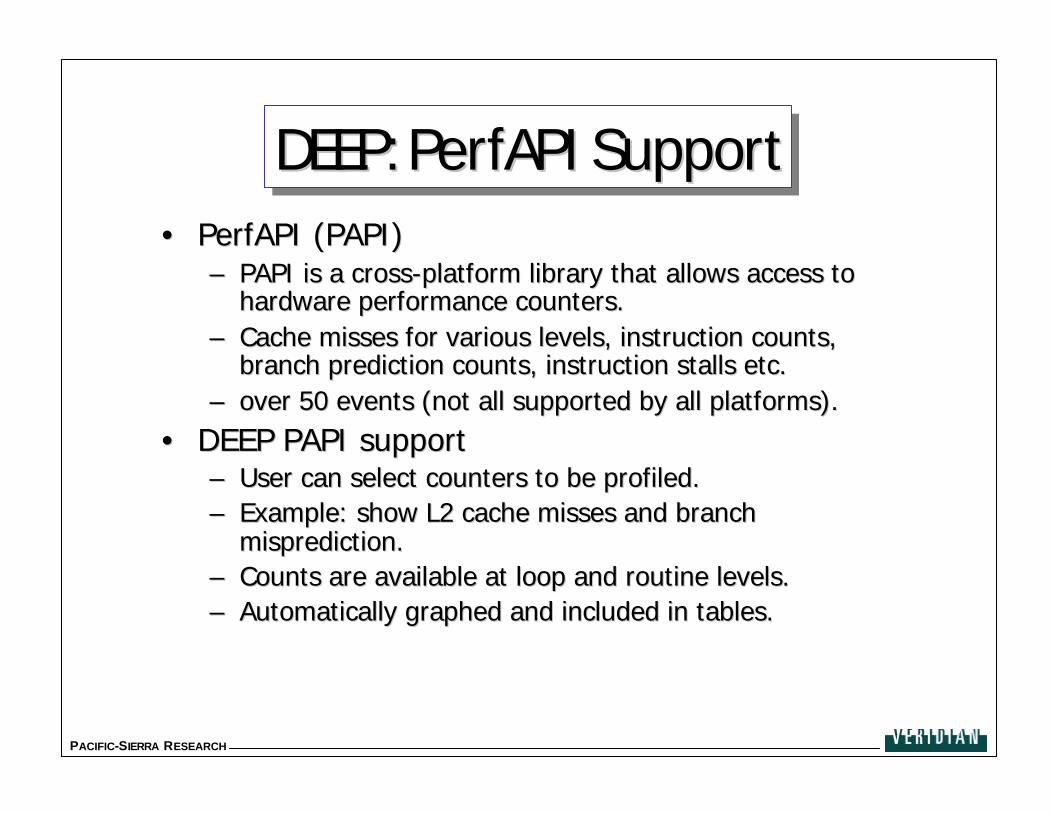
DEEP: PerfAPI SupportDEEP:DEEP: PerfAPIPerfAPI SupportSupport•• PerfAPIPerfAPI (PAPI)(PAPI)
–– PAPI is a crossPAPI is a cross--platform library that allows access to platform library that allows access to hardware performance counters.hardware performance counters.
–– Cache misses for various levels, instruction counts, Cache misses for various levels, instruction counts, branch prediction counts, instruction stalls etc.branch prediction counts, instruction stalls etc.
–– over 50 events (not all supported by all platforms).over 50 events (not all supported by all platforms).
•• DEEP PAPI supportDEEP PAPI support–– User can select counters to be profiled.User can select counters to be profiled.–– Example: show L2 cache misses and branchExample: show L2 cache misses and branch
mispredictionmisprediction..–– Counts are available at loop and routine levels.Counts are available at loop and routine levels.–– Automatically graphed and included in tables.Automatically graphed and included in tables.

® PACIFIC-SIERRA RESEARCH
DEEP: Gathering DataDEEP: Gathering Data•• Run profiler on input source files.Run profiler on input source files.
–– This creates “static information files”.This creates “static information files”.•• Compiler optimization information, program structure, symbol Compiler optimization information, program structure, symbol
table.table.
–– Profiler also instruments the source code.Profiler also instruments the source code.•• Adds data gathering directly to the source code.Adds data gathering directly to the source code.
•• Run the instrumented program.Run the instrumented program.–– This creates a “run file” for each distributed processor.This creates a “run file” for each distributed processor.–– Run files are accumulated information for a particular Run files are accumulated information for a particular
processor (not a huge trace file).processor (not a huge trace file).
•• Run DEEP to view complete picture.Run DEEP to view complete picture.

® PACIFIC-SIERRA RESEARCH
DEEP: InstrumentationDEEP: Instrumentation•• DEEP instruments the source code directly.DEEP instruments the source code directly.•• This allows gathering data on loops, loop nests, call This allows gathering data on loops, loop nests, call
sites, and other language structures lower than the sites, and other language structures lower than the function level.function level.
•• Measured instrumentation overhead can vary greatly Measured instrumentation overhead can vary greatly depending on the program (1% to 200%).depending on the program (1% to 200%).–– If loops turn out to have very small iteration counts, then If loops turn out to have very small iteration counts, then
overhead of instrumentation can swamp computation time.overhead of instrumentation can swamp computation time.
•• If instrumentation impact is high, then use sampling If instrumentation impact is high, then use sampling mode.mode.–– Samples first 1000 instances, then a few instances (about Samples first 1000 instances, then a few instances (about
one out of 100) from then on.one out of 100) from then on.
® PACIFIC-SIERRA RESEARCH
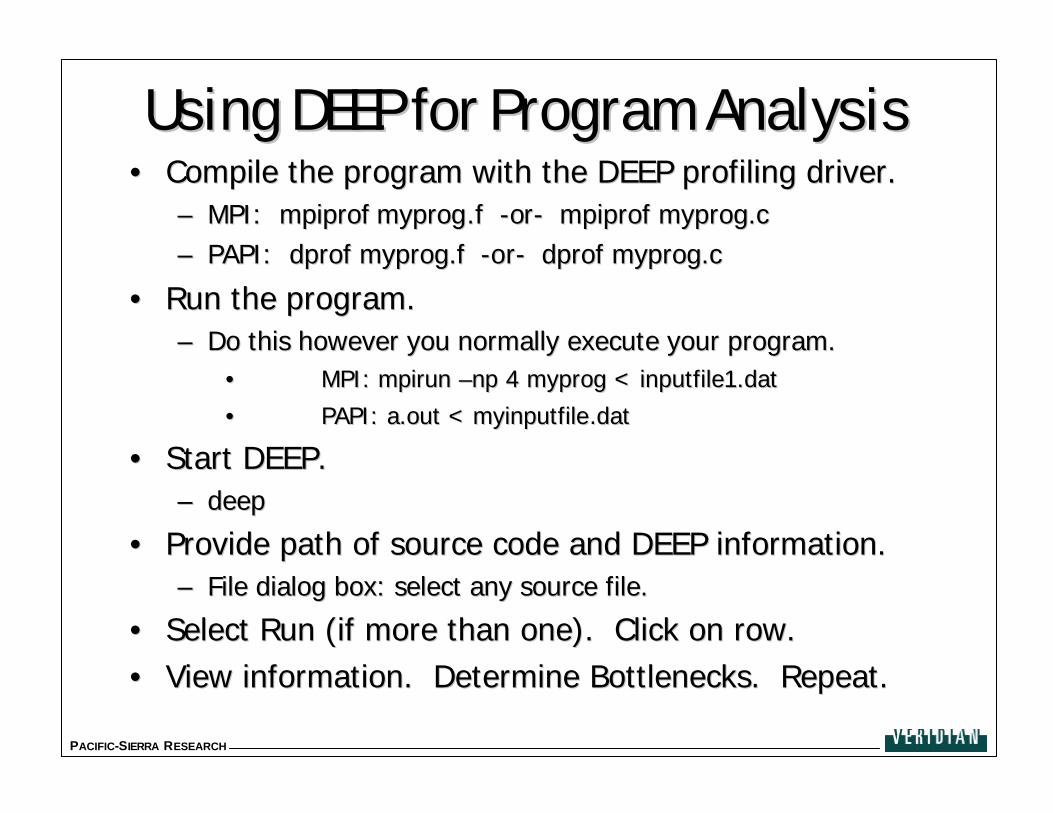
Using DEEP for Program AnalysisUsing DEEP for Program Analysis•• Compile the program with the DEEP profiling driver.Compile the program with the DEEP profiling driver.
–– MPI:MPI: mpiprof myprogmpiprof myprog.f .f --oror-- mpiprof myprogmpiprof myprog.c.c
–– PAPI:PAPI: dprof myprogdprof myprog.f .f --oror-- dprof myprogdprof myprog.c.c
•• Run the program.Run the program.–– Do this however you normally execute your program.Do this however you normally execute your program.
•• MPI:MPI: mpirunmpirun ––npnp 44 myprogmyprog < inputfile1.< inputfile1.datdat
•• PAPI: a.out <PAPI: a.out < myinputfilemyinputfile..datdat
•• Start DEEP.Start DEEP.–– deepdeep
•• Provide path of source code and DEEP information.Provide path of source code and DEEP information.–– File dialog box: select any source file. File dialog box: select any source file.
•• Select Run (if more than one). Click on row.Select Run (if more than one). Click on row.•• View information. Determine Bottlenecks. Repeat.View information. Determine Bottlenecks. Repeat.

® PACIFIC-SIERRA RESEARCH
DEEP FilesDEEP Files•• All files (compileAll files (compile--time and runtime and run--time) are written to time) are written to
subdirectory “/deep”.subdirectory “/deep”.– If you compile and run in different directories, you need to
combine the “/deep”s into one “/deep” prior to starting deep.
• The DEEP files are:– *.sif – static information files, one for each function.– *.sym – symbol table information. This is a binary file.– run.*.*.dif – runtime profile information.
• Written by the Instrumenter profiling library at the end of execution of the application.
• One .dif file is written for each process for each run of the program.
• Name: run.run_no.process_no.dif, where run_no is the number of the run (starting with 0) and process_no is the number of thelogical process (starting with zero).
® PACIFIC-SIERRA RESEARCH
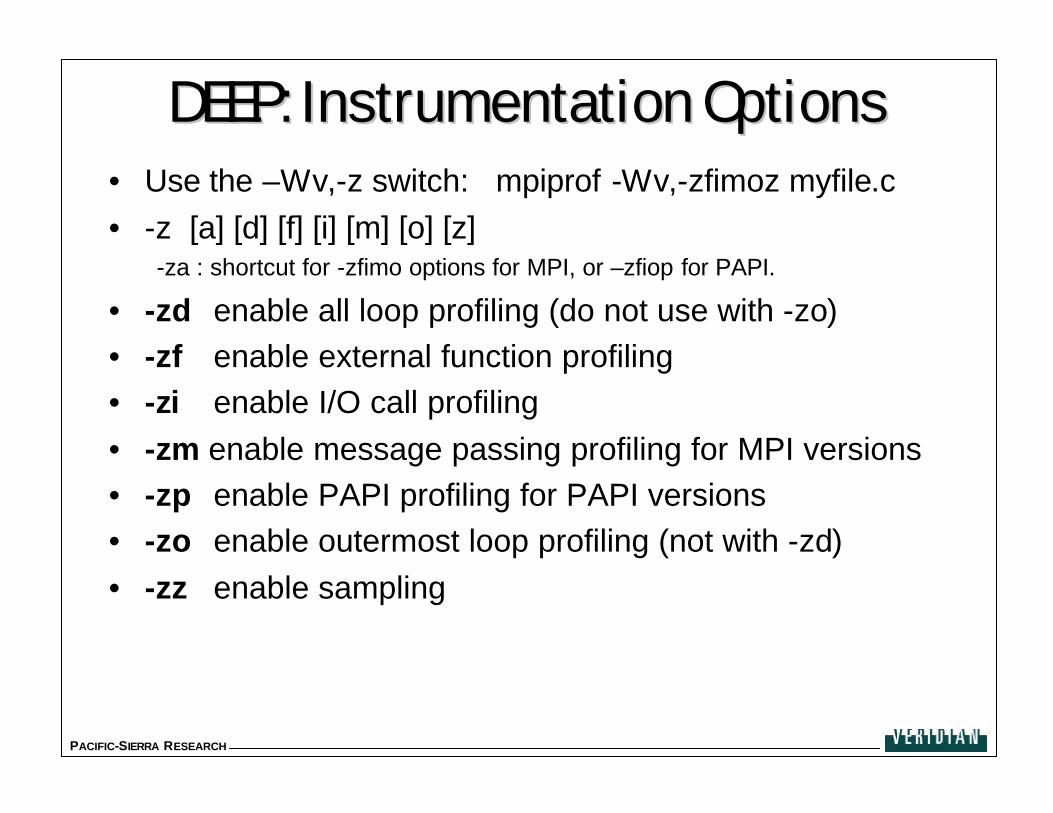
DEEP: Instrumentation OptionsDEEP: Instrumentation Options• Use the –Wv,-z switch: mpiprof -Wv,-zfimoz myfile.c • -z [a] [d] [f] [i] [m] [o] [z]
-za : shortcut for -zfimo options for MPI, or –zfiop for PAPI.
• -zd enable all loop profiling (do not use with -zo)• -zf enable external function profiling• -zi enable I/O call profiling• -zm enable message passing profiling for MPI versions• -zp enable PAPI profiling for PAPI versions• -zo enable outermost loop profiling (not with -zd)• -zz enable sampling

® PACIFIC-SIERRA RESEARCH
DEEP/PAPI: Selecting CountersDEEP/PAPI: Selecting Counters• Hardware can only count a few items at a time.• By default, DEEP/PAPI selects two PAPI events
– Floating Point Operations and Total Cycles.
• Change before run time (after compile time) by setting a series of environment variables:– setenv PROF_PAPI_1 FP_INS– setenv PROF_PAPI_2 L2_TCM
• The general form is:– setenv PROF_PAPI_x FLAG
• where 'x' is a number from 1 to the maximum number of PAPI events that can be counted
• DEEP automatically adjusts its charts and tables to reflect your choice of PAPI counters.

® PACIFIC-SIERRA RESEARCH
DEEP/PAPI Counter OptionsDEEP/PAPI Counter OptionsPAPI Flag PAPI Item DescriptionL1_DCM Level 1 data cache missesL1_ICM Level 1 instruction cache missesL2_DCM Level 2 data cache missesL2_ICM Level 2 instruction cache missesL3_DCM Level 3 data cache missesL3_ICM Level 3 instruction cache missesL1_TCM Level 1 total cache missesL2_TCM Level 2 total cache missesL3_TCM Level 3 total cache missesCA_SNP SnoopsCA_SHR access to shared cache line (SMP)CA_CLN access to clean cache line (SMP)CA_INV Cache Line Invalidation (SMP)CA_ITV Cache Line Intervention (SMP)L3_LDM Level 3 load missesL3_STM Level 3 store missesBRU_IDL Cycles branch units are idleFXU_IDL Cycles integer units are idleFPU_IDL Cycles floating point units are idleLSU_IDL Cycles load/store units are idleTLB_DM Data translation lookaside buffer missesTLB_IM Inst xlation lookaside buffer missesTLB_TL Total xlation lookaside buffer missesL1_LDM Level 1 load missesL1_STM Level 1 store missesL2_LDM Level 2 load missesL2_STM Level 2 store missesBTAC_M BTAC missPRF_DM Prefetch data instruction caused a missTLB_SD Xlation lookaside buf shootdowns (SMP)CSR_FAL Failed store conditional instructionsCSR_SUC Succ store conditional instructionsCSR_TOT Total store conditional instructions
PAPI Flag PAPI Item DescriptionMEM_SCY Cyc Stalled Waiting for Memory AccessMEM_RCY Cyc Stalled Waiting for Memory ReadMEM_WCY Cyc Stalled Waiting for Memory WriteSTL_ICY Cyc with No Instruction IssueFUL_ICY Cyc with Maximum Instruction IssueCCY Cyc with No Instruction CompletionFUL_CCY Cyc with Maximum Instruction CompletionHW_INT Hardware interruptsBR_UCN Uncond branch instructions executedBR_CN Cond branch instructions executedBR_TKN Cond branch instructions takenBR_NTK Cond branch instructions not takenBR_MSP Cond branch instructions mispredictedBR_PRC Cond branch instr correctly predictedFMA_INS FMA instructions completedTOT_IIS Total instructions issuedTOT_INS Total instructions executedINT_INS Integer instructions executedFP_INS Floating point instructions executedLD_INS Load instructions executedSR_INS Store instructions executedBR_INS Total branch instructions executedVEC_INS Vector/SIMD instructions executedFLOPS Floating Point instructions per secondRES_STL Any resource stallsFP_STAL FP units are stalledTOT_CYC Total cyclesIPS Instructions executed per secondLST_INS Total load/store inst. executedSYC_INS Sync. inst. executed
® PACIFIC-SIERRA RESEARCH
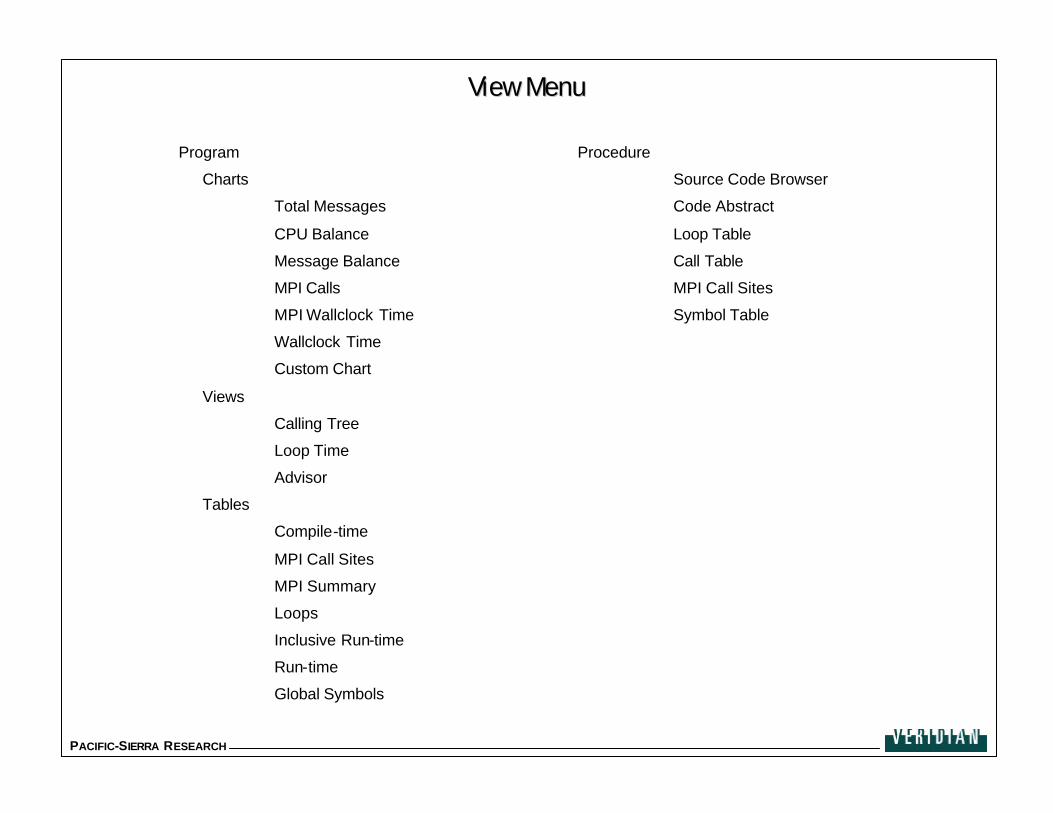
View MenuView Menu
Program
Charts
Total Messages
CPU Balance
Message Balance
MPI Calls
MPI Wallclock Time
Wallclock Time
Custom Chart
Views
Calling Tree
Loop Time
Advisor
Tables
Compile-time
MPI Call Sites
MPI Summary
Loops
Inclusive Run-time
Run-time
Global Symbols
Procedure
Source Code Browser
Code Abstract
Loop Table
Call Table
MPI Call Sites
Symbol Table

® PACIFIC-SIERRA RESEARCH
DEEP: Screen ShotDEEP: Screen Shot
® PACIFIC-SIERRA RESEARCH
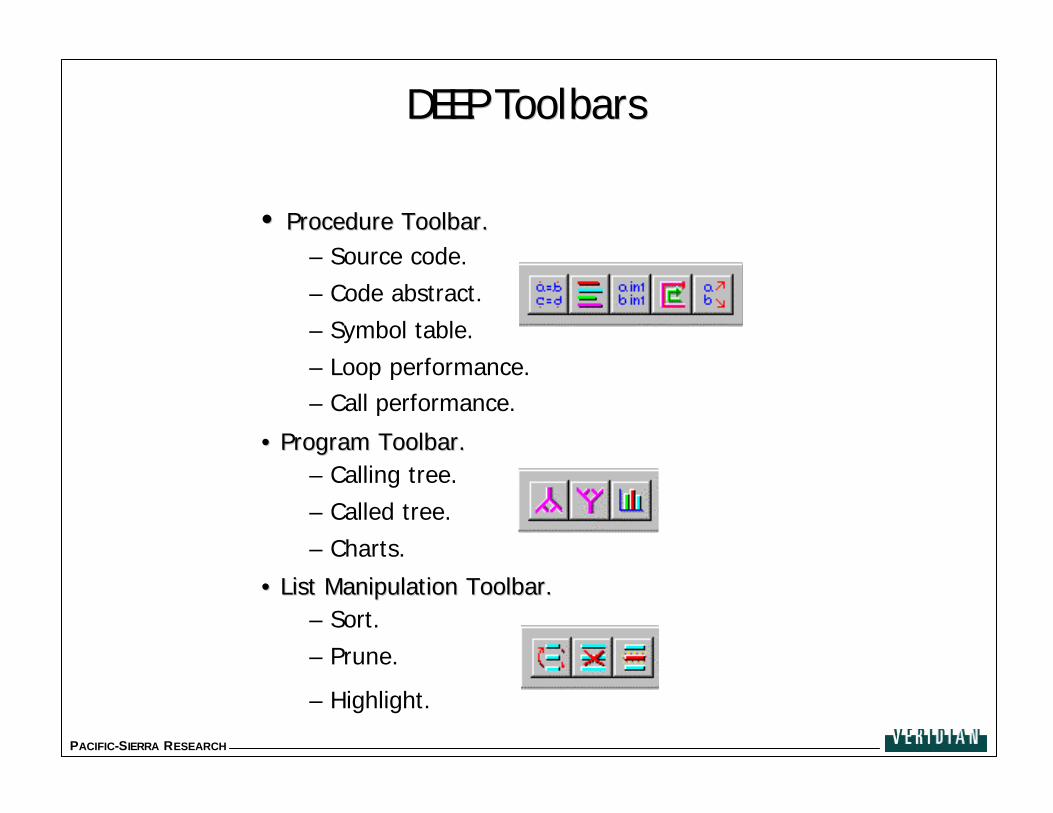
DEEP ToolbarsDEEP Toolbars
•• Procedure Toolbar.Procedure Toolbar.– Source code.
– Code abstract.
– Symbol table.
– Loop performance.– Call performance.
•• Program Toolbar.Program Toolbar.– Calling tree.
– Called tree.
– Charts.
•• List Manipulation Toolbar.List Manipulation Toolbar.– Sort.
– Prune.
– Highlight.

® PACIFIC-SIERRA RESEARCH
DEEP: Whole Program ViewDEEP: Whole Program View

® PACIFIC-SIERRA RESEARCH
DEEP: The big pictureDEEP: The big picture

® PACIFIC-SIERRA RESEARCH
DEEP: DebuggerDEEP: DebuggerDEEP: Debugger•• Parallel Source Code Debugger currently under Parallel Source Code Debugger currently under
development to complement the existing program development to complement the existing program analysis features.analysis features.
•• Control existing scalar debuggers running on each Control existing scalar debuggers running on each parallel process.parallel process.–– rely onrely on dbxdbx,, gdbgdb, etc. for scalar debugger., etc. for scalar debugger.
•• Sophisticated GUI.Sophisticated GUI.–– multiple viewers available.multiple viewers available.
•• Examine values of parallel variables at breakpoints or Examine values of parallel variables at breakpoints or through “watches”.through “watches”.
•• Keep track of current process status for all processes.Keep track of current process status for all processes.

® PACIFIC-SIERRA RESEARCH
DEEP:Debugger structureDEEP:Debugger structureDEEP:Debugger structureDEEP GUI
DBX, GDB
DebuggerControllerProcess 0
User Program User Program
DBX, GDB
DebuggerControllerProcess n
...
Parallel DebuggerController

® PACIFIC-SIERRA RESEARCH
DEEP Debugger ScreenDEEP Debugger Screen
® PACIFIC-SIERRA RESEARCH
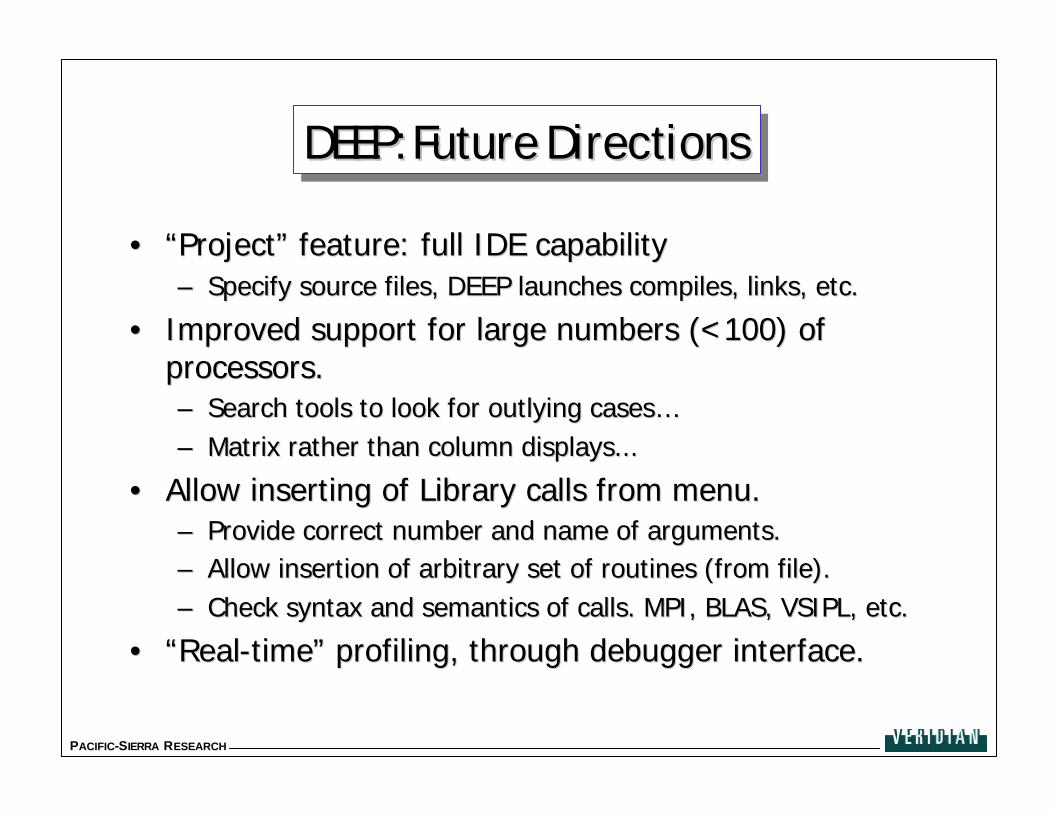
DEEP: Future DirectionsDEEP: Future DirectionsDEEP: Future Directions
•• “Project” feature: full IDE capability“Project” feature: full IDE capability–– Specify source files, DEEP launches compiles, links, etc. Specify source files, DEEP launches compiles, links, etc.
•• Improved support for large numbers (<100) of Improved support for large numbers (<100) of processors.processors.–– Search tools to look for outlying cases…Search tools to look for outlying cases…–– Matrix rather than column displays...Matrix rather than column displays...
•• Allow inserting of Library calls from menu.Allow inserting of Library calls from menu.–– Provide correct number and name of arguments.Provide correct number and name of arguments.–– Allow insertion of arbitrary set of routines (from file).Allow insertion of arbitrary set of routines (from file).–– Check syntax and semantics of calls. MPI, BLAS, VSIPL, etc.Check syntax and semantics of calls. MPI, BLAS, VSIPL, etc.
•• “Real“Real--time” profiling, through debugger interface. time” profiling, through debugger interface.
® PACIFIC-SIERRA RESEARCH
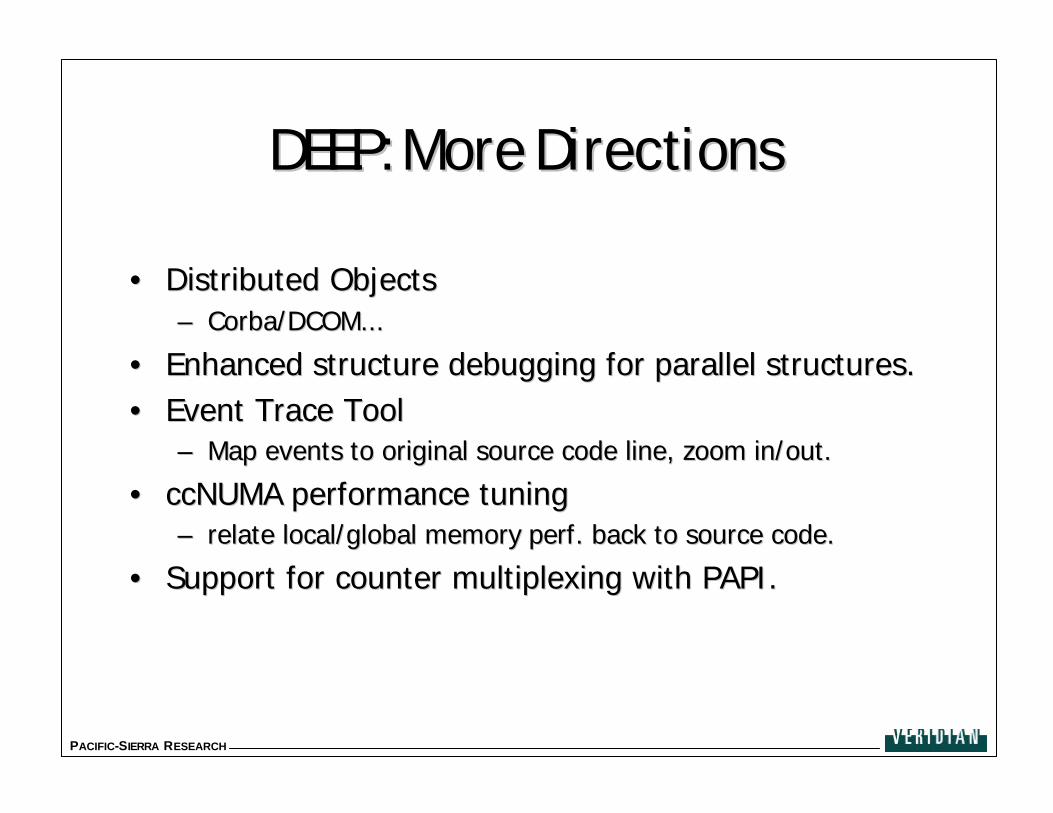
DEEP: More DirectionsDEEP: More Directions
•• Distributed ObjectsDistributed Objects–– CorbaCorba/DCOM... /DCOM...
•• Enhanced structure debugging for parallel structures.Enhanced structure debugging for parallel structures.•• Event Trace ToolEvent Trace Tool
–– Map events to original source code line, zoom in/out.Map events to original source code line, zoom in/out.
•• ccNUMAccNUMA performance tuningperformance tuning–– relate local/global memoryrelate local/global memory perfperf. back to source code. . back to source code.
•• Support for counter multiplexing with PAPI. Support for counter multiplexing with PAPI.
® PACIFIC-SIERRA RESEARCH
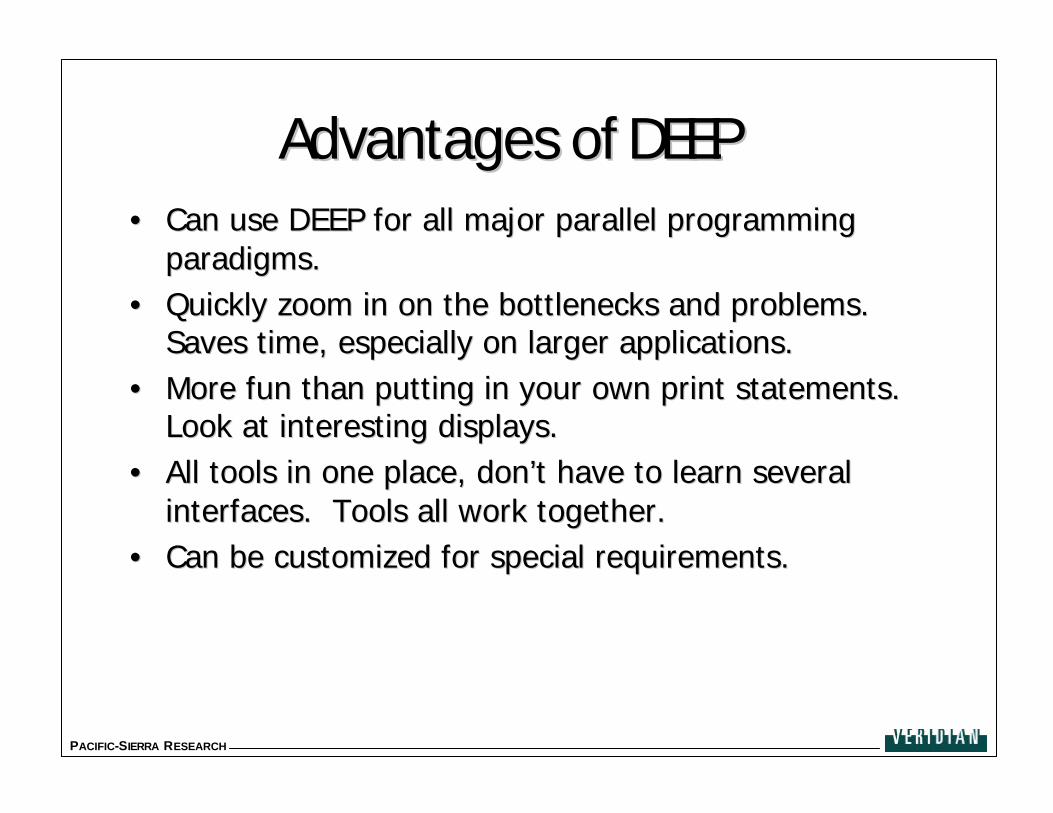
Advantages of DEEPAdvantages of DEEP•• Can use DEEP for all major parallel programming Can use DEEP for all major parallel programming
paradigms.paradigms.•• Quickly zoom in on the bottlenecks and problems. Quickly zoom in on the bottlenecks and problems.
Saves time, especially on larger applications.Saves time, especially on larger applications.•• More fun than putting in your own print statements. More fun than putting in your own print statements.
Look at interesting displays.Look at interesting displays.•• All tools in one place, don’t have to learn several All tools in one place, don’t have to learn several
interfaces. Tools all work together.interfaces. Tools all work together.•• Can be customized for special requirements.Can be customized for special requirements.

® PACIFIC-SIERRA RESEARCH
SummarySummary•• For further information:For further information:
David McNamaraDavid McNamaraVeridian Veridian ---- PacificPacific--Sierra ResearchSierra Research2901 28th Street2901 28th StreetSanta Monica CA 90405Santa Monica CA 90405(310)(310)--314314--23382338brianbrian@@psrvpsrv.com.com