deep trade agreements and global value...
TRANSCRIPT

Policy Research Working Paper 8491
Deep Trade Agreements and Global Value ChainsEdith Laget
Alberto OsnagoNadia RochaMichele Ruta
Macroeconomics, Trade and Investment Global PracticeJune 2018
WPS8491P
ublic
Dis
clos
ure
Aut
horiz
edP
ublic
Dis
clos
ure
Aut
horiz
edP
ublic
Dis
clos
ure
Aut
horiz
edP
ublic
Dis
clos
ure
Aut
horiz
ed

Produced by the Research Support Team
Abstract
The Policy Research Working Paper Series disseminates the findings of work in progress to encourage the exchange of ideas about development issues. An objective of the series is to get the findings out quickly, even if the presentations are less than fully polished. The papers carry the names of the authors and should be cited accordingly. The findings, interpretations, and conclusions expressed in this paper are entirely those of the authors. They do not necessarily represent the views of the International Bank for Reconstruction and Development/World Bank and its affiliated organizations, or those of the Executive Directors of the World Bank or the governments they represent.
Policy Research Working Paper 8491
This paper is a product of the Macroeconomics, Trade and Investment Global Practice. It is part of a larger effort by the World Bank to provide open access to its research and make a contribution to development policy discussions around the world. Policy Research Working Papers are also posted on the Web at http://www.worldbank.org/research. The authors may be contacted at [email protected].
Preferential trade agreements have become deeper over time, often encompassing policy areas that go beyond tra-ditional trade policy, such as investment, competition, and intellectual property rights protection. In the literature, a prominent argument why countries sign “deep” agreements is to promote and facilitate the operation of global value chains. This paper exploits a new data set on the content of trade agreements and data on trade in value added and in parts and components, to quantify the impact of the depth of trade agreements on bilateral cross-border pro-duction linkages. The results show that adding a policy area to a trade agreement increases the domestic value added of intermediates (forward global value chain linkages) and the foreign value added of intermediates (backward global value chain linkages) by 0.48 and 0.38 percent, respec-tively. At the sectoral level, the positive impact of deep
trade agreements is higher for higher value-added indus-tries, suggesting that deep agreements help countries to integrate in industries with higher levels of value added. For a larger sample of countries and years, the results confirm that an additional provision in a trade agreement increases bilateral trade in parts and components by 0.3 percent. The content of trade agreements also matters for global value chain integration, but the impact varies by income group. Provisions outside the current mandate of the World Trade Organization (investment and competition policy) drive the effect of trade agreements on North-South trade in parts and components. Provisions under the cur-rent World Trade Organization mandate (tariff reduction and customs facilitation) drive the effect of trade agree-ments on South-South trade in parts and components.
Deep Trade Agreements and Global Value Chains
Edith Laget, Alberto Osnago, Nadia Rocha and Michele Ruta1
Keywords: Trade Agreements; Global Value Chains; Deep Integration; Regionalism.
JEL Codes: F13; F15.
1 We are grateful to Michael Ferrantino, Nuno Limão, Aaditya Mattoo, Sebastien Miroudot, Alen Mulabdic, Richard Baldwin, Zhi Wang, and seminar participants at Stanford University, University of Maryland, the Graduate Institute in Geneva, University of International Business and Economics (UIBE) in Beijing, the OECD, the World Bank for helpful comments and suggestions. Errors are our responsibility only.
Disclaimer: The findings, interpretations, and conclusions expressed in this paper are entirely those of the authors. They do not necessarily represent the views of the International Bank for Reconstruction and Development/World Bank and its affiliated organizations, or those of the Executive Directors of the World Bank or the governments they represent.
Contact author: Nadia Rocha, World Bank, 1818 H Street, Washington DC, USA. Email: [email protected].
2
1. IntroductionAll members of the World Trade Organization (WTO) signed at least one Preferential Trade
Agreement (PTA).2 The content of these agreements changed over time as they now encompass
a number of disciplines that go beyond traditional trade policy (Hofmann, Osnago and Ruta,
2017). Through PTAs, member countries commit to cut their tariffs and undertake additional
obligations in policy areas covered by the WTO such as customs administration or contingent
protection. But they more and more break new grounds in policy domains that are not regulated
by the WTO, such as investment and competition policy. This new generation of “deep” trade
agreements is at the core of a number of policy and research debates, as economists try to assess
their economic effects and provide guidance on how to efficiently design and implement them.
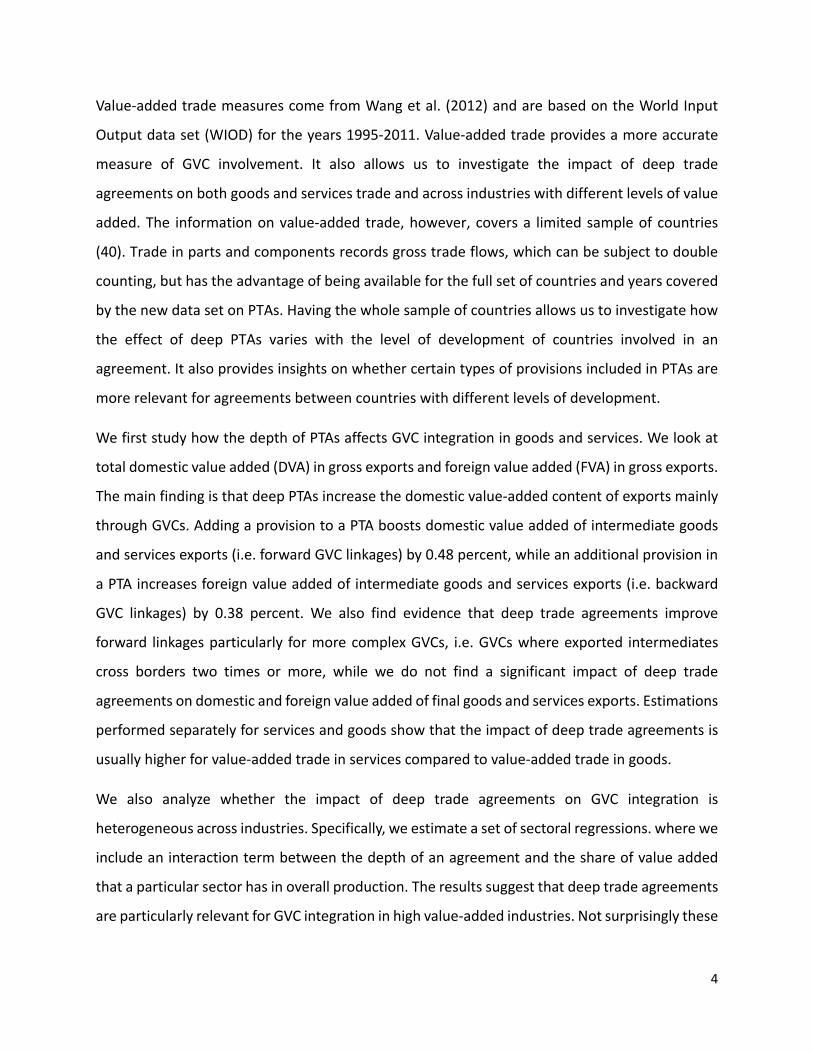
This paper contributes to this broader debate on trade agreements by empirically investigating
the relationship between deep trade agreements and Global Value Chains (GVCs). Using a new
data set on the content of PTAs developed by the World Bank, our analysis allows us to i) quantify
the impact of deep trade agreements on GVC integration among member countries, ii)
disentangle the importance of specific sets of provisions in PTAs, and iii) shed light on the role of
deep trade agreements in shaping the pattern of integration across countries with different levels
of development. Our key finding is that the depth of trade agreements contributes to increase
GVC trade among parties. This impact is higher for industries with higher share of value added in
total production, suggesting that deeper trade arrangements help countries to integrate in
industries with higher levels of value added. We also find that for trade agreements between
developed and developing countries, this effect is mostly driven by the presence of provisions
that are currently outside the domain of the WTO and that deal with behind the border policies,
such as investment and competition policy. For trade agreements between developing countries,
the impact of trade agreements on GVC trade is mostly driven by the reduction of traditional
trade barriers such as tariffs and other border measures.
2 As is common in the recent trade literature, the term PTAs will be used throughout the paper and is preferred to the term ‘regional trade agreements (RTAs)’ since some of these agreements are not necessarily between countries within the same region or in regional proximity. We will also often refer to PTAs as ‘deep (trade) agreements’, in recognition of the fact that several provisions in PTAs are not preferential in nature (Baldwin and Low, 2007).

3
The argument that the rise of deep trade agreements and the increasing importance of GVCs are
related is not new and has been informally made in influential studies by Lawrence (1996),
Baldwin (2010) and WTO (2011), among others. Intuitively, the unbundling of stages of
production across borders creates new forms of cross‐border policy spillovers and time‐
consistency problems. Deeper forms of integration may allow to solve these coordination and
commitment problems, because they discipline those national policies that are needed for the
smooth operation of GVCs. Formal models of the relationship between GVCs and trade
agreements are presented in Antràs and Staiger (2012) and Bickwit, Ornelas and Turner (2017).
Recent studies have looked at related questions from an empirical point of view: Orefice and
Rocha (2011), Johnson and Noguera (2016), Osnago, Rocha and Ruta (2015, 2016).3 Differently
from the current study, these papers either abstract from the depth of trade agreements
(Johnson and Noguera, 2016), are based on a smaller database developed by the WTO (WTO,
2011) covering only 100 agreements and use different measures for GVC related trade (Orefice
and Rocha, 2011; Osnago, Rocha and Ruta, 2015, 2016).4
In the econometric analysis, we use a structural gravity model at the aggregate and sectoral levels
to estimate the relationship between cross‐border production linkages and the depth of PTAs. To
control for selection bias deriving from the presence of zero trade flows, our estimations are
preformed using a Poisson Pseudo Maximum Likelihood (PPML) model. PTA depth measures are
based on the new World Bank data set on the content of PTAs which covers 260 agreements
signed by around 180 countries between 1958 and 2015. This is the entire realm of PTAs in force
and notified to the WTO as of December 2015.5 We build several indicators of PTA depth that
capture the scope and legal enforceability of trade agreements. Bilateral GVC integration is
measured in two ways, using value‐added trade and trade in parts and components.
3 For a survey of the literature, see Limão (2016). A companion paper by Mattoo, Mulabdic and Ruta (2017) uses the new World Bank database on the content of PTAs to revisit the classic Vinerian question of trade creation and trade diversion. 4 Contemporaneous work by Rubinova (2017) and Boffa, Jansen and Solleder (2017) also uses the new World Bank database on the content of PTAs to analyze various aspects of the relationship between deep agreements and GVCs. 5 In our analysis we exclude partial scope agreements.
4
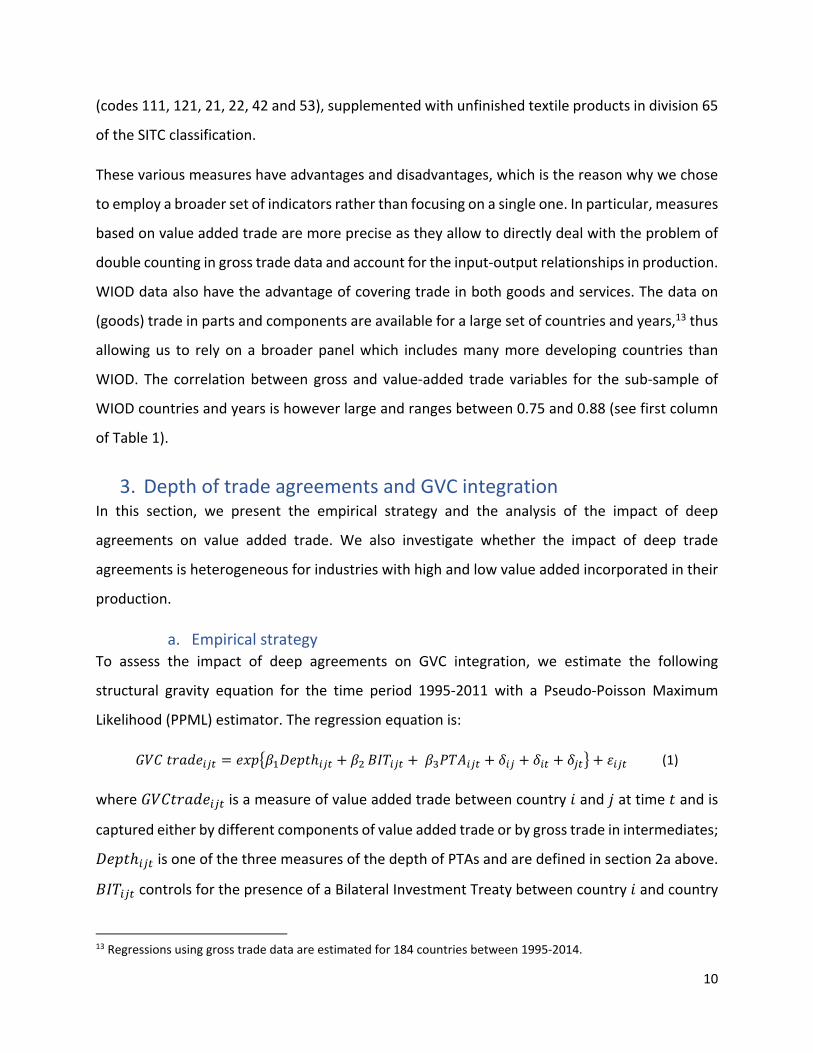
Value‐added trade measures come from Wang et al. (2012) and are based on the World Input
Output data set (WIOD) for the years 1995‐2011. Value‐added trade provides a more accurate
measure of GVC involvement. It also allows us to investigate the impact of deep trade
agreements on both goods and services trade and across industries with different levels of value
added. The information on value‐added trade, however, covers a limited sample of countries
(40). Trade in parts and components records gross trade flows, which can be subject to double
counting, but has the advantage of being available for the full set of countries and years covered
by the new data set on PTAs. Having the whole sample of countries allows us to investigate how
the effect of deep PTAs varies with the level of development of countries involved in an
agreement. It also provides insights on whether certain types of provisions included in PTAs are
more relevant for agreements between countries with different levels of development.
We first study how the depth of PTAs affects GVC integration in goods and services. We look at
total domestic value added (DVA) in gross exports and foreign value added (FVA) in gross exports.
The main finding is that deep PTAs increase the domestic value‐added content of exports mainly
through GVCs. Adding a provision to a PTA boosts domestic value added of intermediate goods
and services exports (i.e. forward GVC linkages) by 0.48 percent, while an additional provision in
a PTA increases foreign value added of intermediate goods and services exports (i.e. backward
GVC linkages) by 0.38 percent. We also find evidence that deep trade agreements improve
forward linkages particularly for more complex GVCs, i.e. GVCs where exported intermediates
cross borders two times or more, while we do not find a significant impact of deep trade
agreements on domestic and foreign value added of final goods and services exports. Estimations
performed separately for services and goods show that the impact of deep trade agreements is
usually higher for value‐added trade in services compared to value‐added trade in goods.
We also analyze whether the impact of deep trade agreements on GVC integration is
heterogeneous across industries. Specifically, we estimate a set of sectoral regressions. where we
include an interaction term between the depth of an agreement and the share of value added
that a particular sector has in overall production. The results suggest that deep trade agreements
are particularly relevant for GVC integration in high value‐added industries. Not surprisingly these

5
industries are usually services sectors, which are characterized by non‐tangible activities such as
research and development or retail services that have high value added.
Next, we dig further into the relationship between deep PTAs and GVCs and we empirically
explore potential heterogeneity in the effects of deep PTAs across countries with different levels
of development and by splitting the provisions into two categories, depending on their
relationship with WTO rules.6 WTO+ provisions fall under the current mandate of the WTO and
are already subject to some form of commitment in WTO agreements. WTO‐X provisions, on the
contrary, refer to policy obligations that are outside the current mandate of the WTO, relating to
areas that are not yet regulated by the WTO. We focus on the larger sample of countries available
for trade in parts and components to explore whether the impact of different provisions is
heterogeneous across countries with different levels of development. The estimates suggest that
WTO‐X provisions are particularly important for GVC‐related trade between North and South
countries. On the other hand, WTO+ provisions are still relevant for trade among developing
countries.
Our results might suffer from endogeneity deriving from omitted variables and simultaneity bias.
Omitted variables bias arises when the error term is correlated with some unobservable country‐
specific policy variables (e.g. restrictive domestic policy regulation), which at the same time affect
both GVC‐related trade and the probability of forming a deep PTA. Reverse causality may arise
from the fact that firms in country pairs involved in GVC may lobby for deeper trade agreements
to secure the supply of intermediates in partner countries. The set of fixed effects included in the
structural gravity estimation partially deals with both sources of endogeneity (Baier and
Bergstrand, 2007; Piermartini and Yotov, 2016).
As an alternative approach, a set of leads and lags of the variable capturing the depth of trade
agreements are included in the regression. This allows to control for the dynamic effect of the
impact of deep trade agreements on GVC‐related trade. The results suggest that there is some
anticipation effect of deep trade agreements, but this is limited to one year before the agreement
enters into force. The positive trade effect of deep agreements persists after the first year and it
6 See Horn, Mavroidis and Sapir (2010).

6
generally stabilizes over time. This is especially true for domestic value added of intermediates.
As to the dynamics for trade in parts and components, the results confirm that there are one‐
year anticipation effects and that the impact of deep agreements persists after the entry into
force of the agreements. The broader country‐coverage uncovers that this dynamic is driven by
deep PTAs involving North and South countries.
Finally, a concern is that in a world where production is fragmented internationally, GVC trade
between two countries is not only affected by their trade agreements but also by the trade
agreements signed by any country along the value chain (Noguera, 2012). As deep agreements
may have a stronger impact on bilateral GVC trade than shallow agreements, it is well possible
that the level of depth of preferential trade agreements signed by third countries along the
supply chain could indirectly affect GVC‐related trade between two countries. We build on the
approach by Noguera (2012) to control for the indirect effect of deep trade agreements and find
that the coefficients of the modified gravity regressions are larger than those of the standard
gravity, confirming the existence of indirect effects of signing deep PTAs through third countries.
The rest of the paper is organized as follows. Section 2 discusses the data used in the paper.
Section 3 presents the empirical analysis focusing on the impact of PTA depth on GVC integration,
while Section 4 focuses on the impact that different sets of provisions in deep trade agreements
have on countries with different levels of development. Section 5 presents robustness tests.
Concluding remarks follow.
2. Data In this section, we take a first look at the data on the content of trade agreements and present
the measures of PTA depth and GVC trade used in the analysis.
a. Deep trade agreements In the literature, the effects of PTAs on trade are generally estimated by including a dummy equal
to one when two countries are involved in an agreement (Limão, 2016). In our econometric
analysis, we also estimate the coefficient of a dummy for PTAs, but we take a step forward by
estimating the effects of deep trade agreements using three new measures of depth. The data on
the content of deep agreements come from a new database at the World Bank that covers 260

7
PTAs, which is the realm of preferential agreements excluding partial scope agreements in force
and notified to the WTO up to the end of 2015 (Hofmann, Osnago and Ruta, 2017). The
methodology is based on the work of Horn, Mavroidis and Sapir (2010), which was also used in
the World Trade Report 2011 (WTO, 2011). The data provide information on two key aspects of
the content of PTAs: (i) what policy areas are covered in each agreement, based on a list of 52
policy areas; (ii) whether each provision is legally enforceable or not, based on an analysis of the
legal language of the treaty text and the possibility of recourse to dispute settlement.7
As a first measure of depth, we use the number of legally enforceable provisions that are included
in an agreement from the World Bank database. While an imperfect metric, this is a logical first
step to capture the level of depth of PTAs, as the extent of policy commitments depends on the
number of areas that are covered by an agreement. Specifically, we define the variable
∑ ‐ i.e. the simple count of ‐legally enforceable‐ provisions
( ) included in the agreement between countries and at time .8
An alternative measure of depth can be constructed on a subset of “core” border and behind the
border provisions –i.e. those provisions that have a clear economic content, as opposed to other
provisions that do not (e.g. cultural cooperation, anti‐terrorism). Core provisions include tariff
liberalization for industrial and agriculture goods, technical barriers to trade (TBT) and sanitary
and phytosanitary (SPS) measures, export taxes and anti‐dumping and countervailing measures,
trade related intellectual property (TRIPs) and trade related investment measures (TRIMs),
movement of capital, state owned enterprises, state aid, competition policies, intellectual
property rights (IPR), investment, public procurement and services. The 18 “core” provisions are
also those most often included in PTAs (Hofmann, Osnago and Ruta, 2017). We define the
variable as the number of core provisions ( ) included in the agreement
between country and at time : ∑ .
7 Annex Table A1 presents the list of provisions. More details on the methodology and the data on deep trade agreements can be found in Hofmann, Osnago and Ruta (2017). The data are freely available at the following website: https://datacatalog.worldbank.org/dataset/content‐deep‐trade‐agreements. 8 Unless otherwise stated, all provisions included in measures of PTA depth are legally enforceable.

8
Finally, we use Principal Component Analysis (PCA) to reduce the dimensionality of our data set.
PCA transforms the 52 provisions into a set of orthogonal variables called components. The first
component is a weighted average of the provisions that takes into account around 27 percent of
the variation in the data.9 The structure of the weights assigned to each provision in the first
component suggests that the first component captures the “scope” of the agreement and it can
be used as an alternative measure of depth.10 In fact, the correlation between the first
component and the number of provisions in a PTA is equal to 0.94. We then define
as the weighted average of provisions using the coefficients of the first component as weights
( ): ∑ .
The database on the content of trade agreements is also useful to examine which disciplines are
more important for GVCs. To do this, we divide provisions into 2 categories following Horn et al.
(2010). WTO+ provisions fall under the current mandate of the WTO and are already subject to
some form of commitment in WTO agreements, such as tariffs, customs and anti‐dumping. WTO‐
X provisions, on the contrary, refer to policy obligations that are outside the current mandate of
the WTO, such as investment and competition policy. We then split into 2 parts
capturing how many legally enforceable WTO+ and WTO‐X provisions are included in a PTA. The
variables are defined as ∑ and ∑ , where
are 14 WTO+ provisions and are 38 WTO‐X provisions included in an agreement
between countries and in year .
b. Global Value Chains In our analysis, we use different data sets and measures to capture the intensity of GVC
relationships between two countries. First, we use data from the World Input‐Output Database
(WIOD) and the decomposition of value added proposed by Wang et al. (2016) to measure
bilateral value‐added trade flows.11 Specifically, Wang et al. (2016) decompose gross trade into
9 The components are not weighted averages of the variables in a strict sense, since the coefficients (or loadings) associated to each variable in each component can also be negative and do not sum to one. In this paper, we use the term weights when referring to the coefficients of the components. 10 Other components still incorporate important information in the data, but their economic interpretation is
difficult.
11 The WIOD database covers 40 countries in the period 1995‐2011.

9
several value‐added components (see Figure 1). Our first measure of interest is domestic value
added (DVA). It simply measures the amount of value added by the exporting country contained
in its exports, i.e. the sum of the first 4 components in the figure. While this is not a direct
measure of GVCs, the comparisons of the results for this variable with our second variable of
interest (discussed next) sheds light on the relationship between deep trade agreements and
GVCs.
The second variable of interest is value added in intermediates. It includes the value of exports
that has been produced domestically, exported as an intermediate good, reprocessed by the
importing countries and either directly absorbed there (component (2) in the figure), further
exported to third countries (component (3)) or re‐exported to the original country (component
4). We define a third variable from the sub‐set of re‐exported intermediates (components (3) and
(4)). The re‐exported intermediates variable represents the most fragmented parts of a
production process in which goods and services cross at least two borders before being
eventually absorbed. These two variables capture the bilateral forward linkages between two
countries. We also use foreign value added in gross exports that can be further decomposed
between final and intermediate goods and services (components (5) and (6)). It measures all
value that has not been produced domestically and that is contained in gross exports. This
variable captures backward linkages. At this stage, the decomposition does not allow us to
identify the country of origin of the foreign value and hence it is an imperfect measure of bilateral
GVC linkages.12
Second, for the analysis based on gross trade flows, we use trade in parts and components to
proxy for global production sharing. There is no broadly accepted definition of trade in parts and
components that we can refer to, so our classification builds on the existing literature in this area
(WTO, 2011 and Orefice and Rocha, 2011). Specifically, for our analysis, we define as parts and
components all non‐fuel intermediates from the Broad Economic Categories (BEC) classification
12 The sum of the six above‐mentioned value‐added components does not match exactly the official trade statistics in gross value terms. The difference is due to double counting (column (7)) that tends to increase when goods and services cross borders multiple times.
10
(codes 111, 121, 21, 22, 42 and 53), supplemented with unfinished textile products in division 65
of the SITC classification.
These various measures have advantages and disadvantages, which is the reason why we chose
to employ a broader set of indicators rather than focusing on a single one. In particular, measures
based on value added trade are more precise as they allow to directly deal with the problem of
double counting in gross trade data and account for the input‐output relationships in production.
WIOD data also have the advantage of covering trade in both goods and services. The data on
(goods) trade in parts and components are available for a large set of countries and years,13 thus
allowing us to rely on a broader panel which includes many more developing countries than
WIOD. The correlation between gross and value‐added trade variables for the sub‐sample of
WIOD countries and years is however large and ranges between 0.75 and 0.88 (see first column
of Table 1).
3. Depth of trade agreements and GVC integration In this section, we present the empirical strategy and the analysis of the impact of deep
agreements on value added trade. We also investigate whether the impact of deep trade
agreements is heterogeneous for industries with high and low value added incorporated in their
production.
a. Empirical strategy To assess the impact of deep agreements on GVC integration, we estimate the following
structural gravity equation for the time period 1995‐2011 with a Pseudo‐Poisson Maximum
Likelihood (PPML) estimator. The regression equation is:
(1)
where is a measure of value added trade between country and at time and is
captured either by different components of value added trade or by gross trade in intermediates;
is one of the three measures of the depth of PTAs and are defined in section 2a above.
controls for the presence of a Bilateral Investment Treaty between country and country
13 Regressions using gross trade data are estimated for 184 countries between 1995‐2014.

11
at time ;14 is a dichotomous variable that takes the value of 1 whenever there is a
preferential trade agreement, either active or inactive, between two countries at time ;15 s are
sets of country‐pair, importer‐time and exporter‐time fixed effects.
b. Baseline results Table 2 reports the coefficients of total depth, core depth and PCA depth for the regressions
using DVA and FVA as dependent variables. All coefficients of depth are positive and significant.
Adding a policy area is associated to an average increase 0.4 percent of total domestic value
added and an average increase of 0.26 percent of foreign value added. The coefficients increase
substantially when looking at core depth only, suggesting that those policy areas are particularly
important as they reduce the governance gap between countries in areas that are relevant for
GVC‐related trade.16 Also, the coefficients of PCA depth show a similar pattern to the one of total
number of provisions. Control variables such as BITs have the expected sign, suggesting that
signing BITs has a positive impact on domestic and foreign value added in exports.17 The PTA
dummy is non‐significant in most of the estimations. This variable controls for the presence of
shallow PTAs and for agreements no longer in force for which we have no information on depth.
The lack of statistical significance indicates that it is the depth of PTAs, and not the mere presence
of shallow agreements, that matters for domestic and foreign value added in exports.
A concern is that the trade variables in our first set of regressions may be driven by traditional
trade in final goods and services rather than by GVC trade. To address this concern, we assess
the impact of deep trade agreements on FVA and on DVA exports separately for intermediate
and final goods and services. Results presented in Table 3 decompose domestic value added into
DVA in final exports (columns 1‐3), DVA in intermediate exports (columns 4‐6) and DVA of re‐
exported intermediates (columns 7‐9). The coefficients capturing PTA depth are only significant
for DVA of intermediate exports, suggesting that deep trade agreements are particularly
14 Data on BITs come from UNCTAD. 15 The variable is taken from Egger and Larch (2008). 16 See Baldwin (2011) and WTO (2011). 17 The magnitude of the BITs coefficient needs to be interpreted carefully, given that these agreements often focus on specific sectors or areas. Therefore, in our regressions, which are aggregated at the country level, their impact might be positively biased.
12
important in the context of global value chains compared to trade in final goods. In terms of
magnitudes, the coefficients capturing the impact of adding one additional provision on domestic
value added in intermediates are slightly higher compared to the aggregate variables presented
in Table 2 and are equal to 0.48 percent on average. In addition, the positive relationship
between deeper trade agreements and GVC integration is particularly important for the subset
of re‐exported intermediates that cross the border at least twice, suggesting that deep
agreements are particularly important in the context highly fragmented production processes.
Results on the impact of deep agreements on foreign value‐added trade of final and intermediate
exports are presented in Table 4. In this case also, the positive impact of our variable of interest
is significant only for FVA of intermediate exports. The magnitude of the coefficients is also higher
compared to the baseline regression. Adding an extra provision in an agreement increases
foreign value added of intermediate exports by 0.38 percent.
In Table 5 and Table 6 the results on the impact of deep trade agreements on GVC integration
are presented for goods and services separately. For simplicity results are presented for one of
our depth variables.18 In the case of goods, the relationship between deep trade agreements and
forward GVC linkages is mainly driven by domestic value added in intermediate exports and is
significant only at a 10 percent level. For foreign value added, depth is positive and significant
only for intermediates. For services, deeper agreements have a positive impact on domestic
value‐added services with results once again driven by intermediate exports, and foreign value‐
added services. Notice that the coefficients capturing the impact of deeper trade agreements on
services are usually of a higher magnitude compared to the coefficients capturing the impact of
deeper agreements on goods, suggesting that agreements going beyond pure market access are
particularly important for GVC integration in services.
c. Sector‐level regressions In this section we investigate whether the impact of deep trade agreements on GVC participation
is heterogeneous across industries with different levels of value added shares in total production.
We estimate the following specification:
18 Results for the other depth variables are qualitatively similar and available upon request.
13
1 2 ∗ 3 4
(2)
where is a measure of GVC integration between countries and in sector k at
time ; is a variable capturing the value added of a certain industry and it is
measured either as the share of value added that an industry has in total production (see annex
Table A2) or with a dummy variable equal to one when the share of value added of an industry
is above the median and zero otherwise; , , and are defined as in equation
(1); , , and , represent respectively country‐pair industry, reporter industry time and
partner industry time fixed effects.
Results for goods presented in Table 7 suggest that deeper agreements are not more relevant on
average for higher value‐added industries compared to lower value industries. On the other
hand, results for services GVC integration presented in Table 8 show that the interaction term
between depth and industry value added is always positive and significant for domestic value
added; in the case of foreign value added the results are less robust. The absence of significant
differentiated impacts in the case of goods might be explained by the fact that the variation
across industries in the level of value added is much lower for goods compared to services. In
addition, the value added incorporated in services production is usually higher than the one
incorporated in goods production. The magnitude of the impact of depth on higher value‐added
industries is usually higher for services GVC integration, suggesting that deep trade agreements
help countries to integrate in industries with higher levels of value added.
4. Content of trade agreements, GVC integration and income level Different groups of provisions may matter more for PTAs between countries at different levels of
development. Intuitively, this is because the reason for signing trade agreements could be
different depending on the countries involved and on the level of liberalization already achieved.
Moreover, as shown in Hofmann et al. (2016) the scope of PTAs varies across different groups of
countries: PTAs signed between developed countries (North) are roughly as deep as agreements
signed between developed and developing (South) countries; on the other hand, PTAs signed
14
among developing countries are on average shallower. We study how the content of PTAs affects
GVC trade between North‐North, North‐South and South‐South country pairs.19
For this exercise, we use the data on trade in parts and components to exploit the information
from a larger sample. As a first step we investigate the relationship between deep PTAs and trade
in parts and components on a sample of 184 countries for the time interval 1995‐2014. In
particular, we estimate the structural gravity model in equation (1) using trade in parts and
components as the dependent variable. As a second step we add to our baseline regression the
interactions of our variables of depth with three different dummies that identify three mutually
exclusive country groups: North‐North, North‐South and South‐South. The specification is as
follows:
∗
∗ , (3)
where represents a vector of any two dummy variables among the three country
groups defined above (i.e. North‐North, North‐South, South‐South).
The results from the PPML estimations, presented in Table 9, are in line with the ones using trade
in value added. In particular, including one more provision increases trade in parts and
components by 0.3 percent on average. An additional core provision has a larger impact of 0.6
percent on average. We find that deep PTAs affect trade in parts and components differently
depending on the income group of countries involved (Table 10). Column 1 shows that the
average impact of WTO+ and WTO‐X provisions is not significant. Column 2 includes the
interactions of the number of WTO+ and WTO‐X provisions with binary variables that identify
South‐South and North‐South country‐pairs. Thus, the coefficients of the number of provisions
have to be interpreted as the coefficients for the omitted category, i.e. North‐North pairs.
Columns 3 and 4 have the same structure but with South‐South and North‐South pairs as omitted
categories respectively. The effect of PTA depth on North‐South GVC‐trade is driven by WTO‐X
provisions such as investment, competition policy and other behind the border provisions. On
19 North is defined as the group of high‐income WTO Members while South comprises low‐ and middle‐income and LDC WTO members.

15
the other hand, South‐South GVC‐trade is mostly affected by WTO+ provisions. For North‐North
agreements, the coefficients on WTO+ and WTO‐X are not significant.20
While there is no formal theory to guide the analysis, the differential effects of deep agreements
across countries’ levels of development may have a simple intuitive explanation. Deep trade
agreements affect GVC trade directly, as they lower trade barriers between members, and
indirectly, as they improve institutions through commitments to reform. Deep PTAs may matter
less for developed countries as trade is already liberalized and domestic institutions are robust.
On the contrary, weak institutions in developing economies are likely to be a constraint for GVC
integration with developed countries. Deep provisions in PTAs can offer a commitment device to
implement reform that contributes to boost GVC‐related trade. Finally, since tariffs and other
border barriers are often still high between developing countries, PTAs may affect GVC trade
mostly through traditional trade liberalization in South‐South relationships.
5. Robustness In this section, we undertake three robustness tests. First, we consider indirect effects of PTAs.
The second robustness exercise allows for slow adjustment in trade policy. Finally, we account
for dynamic effects in the regressions.
a. PTAs indirect effects In a world where production is fragmented across countries, the level of depth of preferential
trade agreements signed by third countries along the supply chain could indirectly affect GVC‐
related trade between two countries. Intuitively, deeper trade agreements in third countries
lower trade costs along the entire supply chain, thus encouraging trade in intermediates also
among countries that are not part of the agreement. To control for the indirect effect of deep
trade agreements, we follow Noguera (2012) and estimate the impact of deep PTAs on the level
of integration in GVCs using the following modified gravity framework:
∑ ∑ ∑
(4)
20 Estimations using WIOD, which covers only a few developing countries, are similar to this last set of results.
16
Where the variables and the set of controls and fixed effects are the same as in equation (1), but
the PTA depth variable is weighted using two different shares. Specifically, is the share of
value added from country to country embodied in country 's final products that reaches
country ; is the share of value added from country embodied in intermediate inputs
produced in country that are absorbed as final demand in country after traveling through
possibly multiple countries .
The estimates in Table 11 are in line with the standard gravity estimates for the total depth
variable.21 Deep PTAs tend to increase forward and backward linkages, with stronger effects for
exports in intermediates. The coefficients of the modified gravity regressions are larger than
those of the standard gravity, suggesting the existence of indirect effects of signing deep PTAs
through third countries.
b. Adjustment to trade policy changes As suggested by Trefler (2004), the adjustment of trade flows between two countries after
signing a PTA is not instantaneous but it may take some time. Therefore, estimations using
consecutive years will not allow our dependent variable to properly adjust. To reduce this bias,
estimations are performed using 3‐year intervals. Results presented in Table 12 and Table 13
have the same sign as the ones presented in the baseline regressions and are slightly higher in
terms of magnitude, confirming the positive relationship between PTA depth and GVC‐related
trade.22 In particular, adding a policy area is associated to an average increase of 0.43 percent of
total domestic value added (column (1) Table 12), an average increase of 0.49 percent of value
added in intermediate exports (column (3) Table 12), and an average increase of 0.37 percent of
foreign value added in intermediates (column (7) Table 12). With respect to gross trade flows,
including one more provision increases trade in parts and components by 0.44 percent on
average (column (1) Table 13).
21 Results for the other depth variables are qualitatively similar and available upon request. 22 Similar results are also found when regressions are performed using 4‐ and 5‐year intervals. Results for the other depth variables are qualitatively similar and available upon request for the data on value added (Table 12).
17
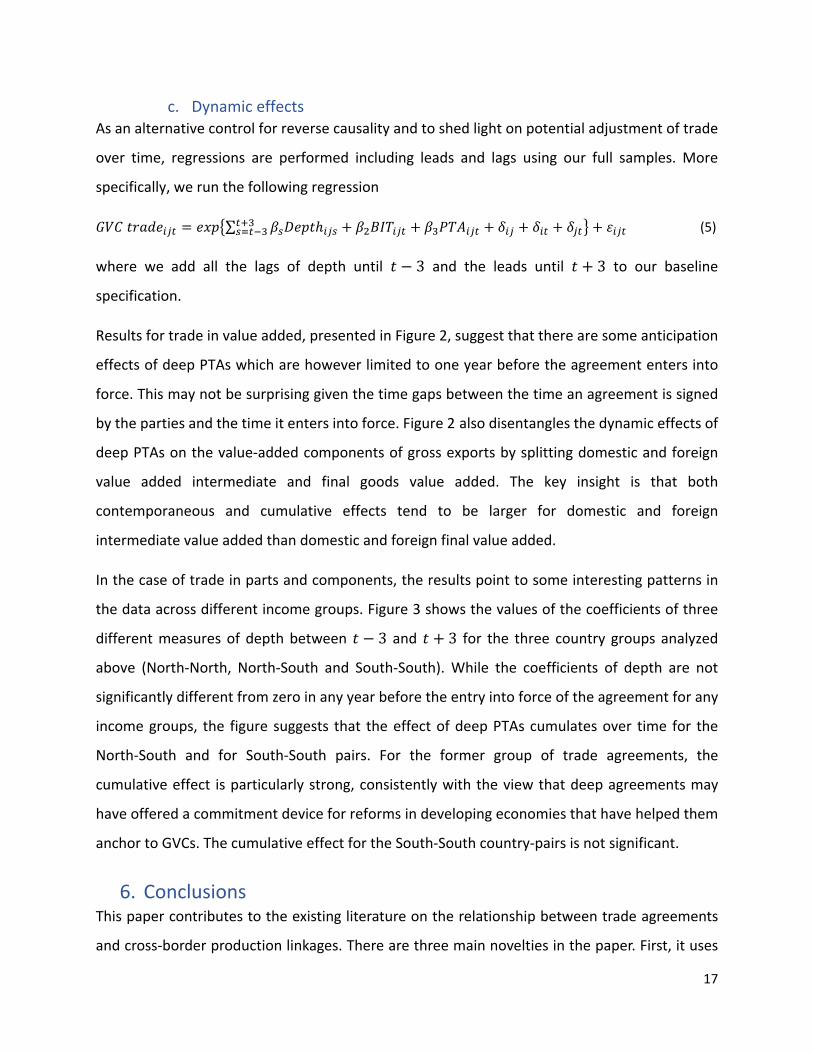
c. Dynamic effects As an alternative control for reverse causality and to shed light on potential adjustment of trade
over time, regressions are performed including leads and lags using our full samples. More
specifically, we run the following regression
∑ (5)
where we add all the lags of depth until 3 and the leads until 3 to our baseline
specification.
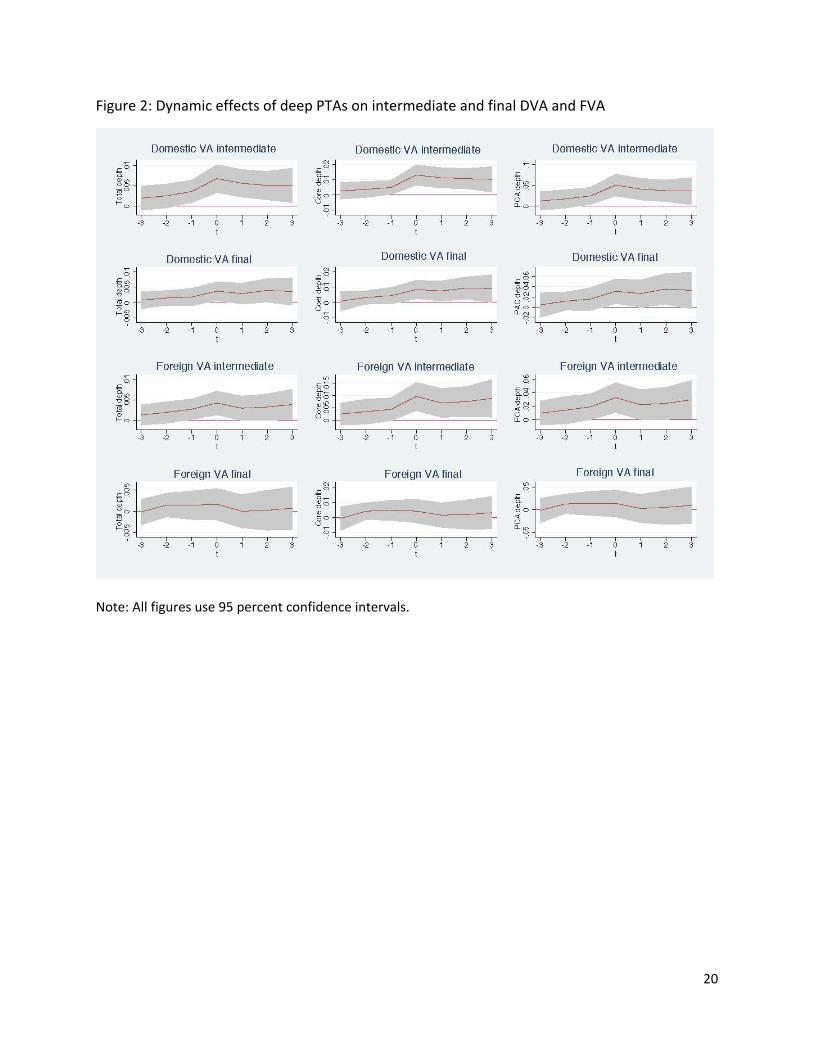
Results for trade in value added, presented in Figure 2, suggest that there are some anticipation
effects of deep PTAs which are however limited to one year before the agreement enters into
force. This may not be surprising given the time gaps between the time an agreement is signed
by the parties and the time it enters into force. Figure 2 also disentangles the dynamic effects of
deep PTAs on the value‐added components of gross exports by splitting domestic and foreign
value added intermediate and final goods value added. The key insight is that both
contemporaneous and cumulative effects tend to be larger for domestic and foreign
intermediate value added than domestic and foreign final value added.
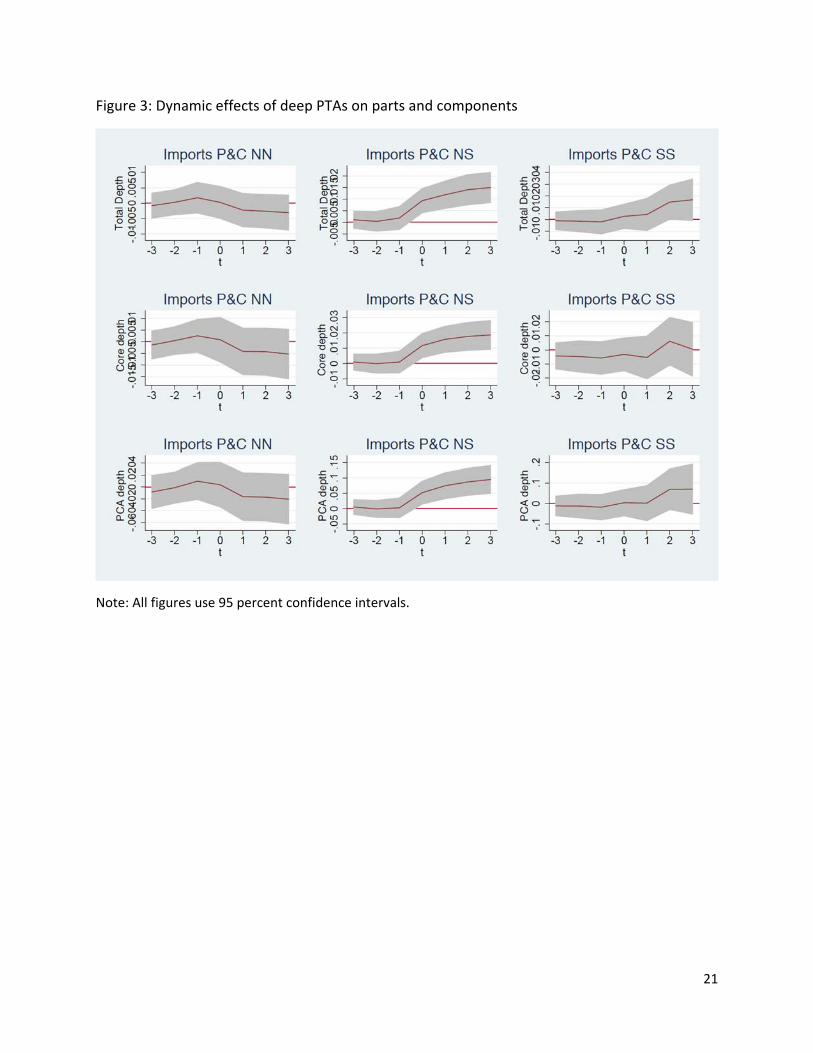
In the case of trade in parts and components, the results point to some interesting patterns in
the data across different income groups. Figure 3 shows the values of the coefficients of three
different measures of depth between 3 and 3 for the three country groups analyzed
above (North‐North, North‐South and South‐South). While the coefficients of depth are not
significantly different from zero in any year before the entry into force of the agreement for any
income groups, the figure suggests that the effect of deep PTAs cumulates over time for the
North‐South and for South‐South pairs. For the former group of trade agreements, the
cumulative effect is particularly strong, consistently with the view that deep agreements may
have offered a commitment device for reforms in developing economies that have helped them
anchor to GVCs. The cumulative effect for the South‐South country‐pairs is not significant.
6. Conclusions This paper contributes to the existing literature on the relationship between trade agreements
and cross‐border production linkages. There are three main novelties in the paper. First, it uses

18
new data on trade in value added in addition to more standard data on trade flows of parts and
components to separately assess the impact of deeper trade agreements on goods and services
and to investigate whether the relationship between trade agreements and GVC participation is
heterogeneous across industries with different levels of value added shares in production.
Second, it exploits new information on the content of PTAs and attempts to identify which type
of provisions matter the most for GVC‐related trade. Third, it looks at how the effect of the
content of deep PTAs changes depending on the level of development of the countries involved
in trade agreements.
With this new approach, we are able to establish three main results.
1. The depth of trade agreements increases GVC‐related trade among participating
countries. The positive impact of deep agreements on GVC integration is driven by value‐
added trade in intermediates rather than in final goods and services. Adding a policy area
to a PTA increases domestic value added of intermediates (forward GVC linkages) and
foreign value added of intermediates (backward GVC linkages) by 0.48 and 0.38 percent,
respectively.
2. At the sectoral level, the positive impact of deep trade agreements is higher for industries
with higher value‐added shares in total production, suggesting that deeper trade
arrangements help countries to integrate in industries with higher levels of value added.
3. Provisions outside the current WTO mandate such as competition policy and investment
are key drivers of the relationship between deep trade agreements and GVC‐related
trade, particularly for North‐South PTAs. Border provisions are still an important driver of
GVC trade for South‐South PTAs.
While these are important new findings, more work is needed in this area. There is little that we
know on the detailed content of specific provisions in trade agreements and how this content
may affect trade, GVC participation or other variables of interest. Future work could aim at
collecting data for core policy areas and study how the detailed content of these provisions in
deep trade agreements affects economic outcomes.

19
Tables and figures Figure 1: Decomposition of gross exports
Source: Authors’ re‐elaboration of Wang et al. (2016).
20
Figure 2: Dynamic effects of deep PTAs on intermediate and final DVA and FVA
Note: All figures use 95 percent confidence intervals.
21
Figure 3: Dynamic effects of deep PTAs on parts and components
Note: All figures use 95 percent confidence intervals.

22
Table 1: Correlation between gross and value‐added trade in good
Parts and components
DVA DVA final
DVA interm.
DVA interm. re‐exported
FVA FVA final
FVA interm.
Parts and components 1.00 DVA 0.87 1.00 DVA final 0.80 0.97 1.00 DVA intermediate 0.88 0.97 0.88 1.00 DVA int. re‐exported 0.82 0.85 0.72 0.91 1.00 FVA 0.79 0.89 0.87 0.85 0.67 1.00 FVA final 0.77 0.88 0.90 0.81 0.63 0.98 1.00 FVA intermediate 0.75 0.84 0.77 0.85 0.68 0.96 0.88 1.00
Table 2: Deep trade agreements and GVC integration, PPML
(1) (2) (3) (4) (5) (6)
DVA of exports FVA of exports
No. of provisions 0.00400*** 0.00258*
(0.00125) (0.00133)
Core provisions 0.00777*** 0.00520*
(0.00266) (0.00273)
PCA depth (1st) 0.0292*** 0.0203*
(0.0101) (0.0105)
BIT 0.121*** 0.118*** 0.119*** 0.0924** 0.0910** 0.0914**
(0.0440) (0.0441) (0.0441) (0.0379) (0.0379) (0.0379) PTA (in force or inactive) ‐0.0296 ‐0.0611 ‐0.041 ‐0.00848 ‐0.0302 ‐0.0189
(0.0433) (0.0492) (0.0461) (0.0410) (0.0481) (0.0440)
Observations 26,520 26,520 26,520 26,520 26,520 26,520
R‐squared 0.994 0.994 0.994 0.996 0.996 0.996
Country‐pair FE Yes Yes Yes Yes Yes Yes
Country‐time FE Yes Yes Yes Yes Yes Yes
Clustered standard errors at the country pair level in parentheses.
*** p<0.01, ** p<0.05, * p<0.1

23
Table 3: Deep trade agreements and Domestic Value‐added exports – intermediates vs final, PPML
(1) (2) (3) (4) (5) (6) (7) (8) (9)
DVA of final exports DVA of intermediate exports DVA of intermediates re‐exported
No. of provisions 0.00220 0.00480*** 0.00484***
(0.00158) (0.00139) (0.00158) Core provisions 0.00424 0.00940*** 0.0106***
(0.00312) (0.00300) (0.00331) PCA depth (1st) 0.0181 0.0345*** 0.0376***
(0.0122) (0.0113) (0.0126)
BIT 0.117** 0.116** 0.116** 0.121** 0.117** 0.119** 0.115** 0.111** 0.113**
(0.0551) (0.0552) (0.0551) (0.0472) (0.0472) (0.0473) (0.0528) (0.0526) (0.0527)
PTA (in force or inactive) 0.118*** 0.0990* 0.106** ‐0.107** ‐0.144*** ‐0.118** ‐0.0754 ‐0.124** ‐0.0937
(0.0442) (0.0539) (0.0485) (0.0492) (0.0553) (0.0519) (0.0578) (0.0628) (0.0597)
Observations 26,520 26,520 26,520 26,520 26,520 26,520 26,520 26,520 26,520
R‐squared 0.996 0.996 0.996 0.991 0.991 0.991 0.989 0.989 0.989
Country‐pair FE Yes Yes Yes Yes Yes Yes Yes Yes Yes
Country‐time FE Yes Yes Yes Yes Yes Yes Yes Yes Yes
Clustered standard errors at the country pair level in parentheses.
*** p<0.01, ** p<0.05, * p<0.1

24
Table 4: Deep trade agreements and foreign value‐added exports ‐intermediates vs final, PPML
(1) (2) (3) (4) (5) (6)
FVA of final exports FVA of intermediate exports
No. of provisions 0.000645 0.00385***
(0.00168) (0.00124) Core provisions 0.000806 0.00765***
(0.00340) (0.00265) PCA depth (1st) 0.00553 0.0290***
(0.0131) (0.0101)
BIT 0.105** 0.105** 0.105** 0.0736* 0.0710* 0.0720*
(0.0473) (0.0474) (0.0473) (0.0413) (0.0412) (0.0413) PTA (in force or inactive) 0.143*** 0.142** 0.139** ‐0.106** ‐0.134*** ‐0.117**
(0.0503) (0.0592) (0.0542) (0.0451) (0.0507) (0.0474)
Observations 26,520 26,520 26,520 26,520 26,520 26,520
R‐squared 0.996 0.996 0.996 0.995 0.995 0.995
Country‐pair FE Yes Yes Yes Yes Yes Yes
Country‐time FE Yes Yes Yes Yes Yes Yes
Clustered standard errors at the country pair level in parentheses.
*** p<0.01, ** p<0.05, * p<0.1

25
Table 5: Deep trade agreements and GVC integration in goods, PPML
(1) (2) (3) (4) (5) (6) (7)
DVA DVA final
DVA intermediate
DVA int. re‐exported FVA FVA final
FVA intermediate
No. of provisions 0.00235* 0.00195 0.00230* 0.00111 0.00161 5.89e‐05 0.00259**
(0.0013) (0.0017) (0.0013) (0.0015) (0.0014) (0.0017) (0.0013)
BIT 0.139*** 0.131** 0.142*** 0.148*** 0.0920** 0.110** 0.0608
(0.0436) (0.0596) (0.0443) (0.0468) (0.0389) (0.0502) (0.0398) PTA (in force or inactive) 0.0254 0.174*** ‐0.0667 ‐0.0527 0.00409 0.159*** ‐0.0939**
(0.0425) (0.0455) (0.0464) (0.0646) (0.0428) (0.0521) (0.0413)
Observations 26,520 26,520 26,520 26,520 26,520 26,520 26,520
R‐squared 0.997 0.997 0.996 0.996 0.997 0.996 0.997
Country‐pair FE Yes Yes Yes Yes Yes Yes Yes
Country‐time FE Yes Yes Yes Yes Yes Yes Yes
Clustered standard errors at the country pair level in parentheses. *** p<0.01, ** p<0.05, * p<0.1
Table 6: Deep trade agreements and GVC integration in services, PPML
(1) (2) (3) (4) (5) (6) (7)
DVA DVA final
DVA intermediate
DVA int. re‐exported FVA
FVA final
FVA intermediate
No. of provisions 0.00474** 0.00310 0.00468** 0.00493** 0.00450** 0.00353 0.00453*
(0.0022) (0.0024) (0.0023) (0.0024) (0.0023) (0.0023) (0.0025) BIT 0.0632 ‐0.0670 0.0868 0.0980 0.133 0.0394 0.173**
(0.0759) (0.0948) (0.0750) (0.0765) (0.0830) (0.0938) (0.0841) PTA (in force or inactive) ‐0.0856 ‐0.108 ‐0.0476 0.0323 0.0188 0.0334 0.0298
(0.0833) (0.0964) (0.0797) (0.0744) (0.0904) (0.110) (0.0828)
Observations 26,401 26,350 26,401 26,401 26,401 26,350 26,401 R‐squared 0.959 0.959 0.957 0.966 0.951 0.946 0.951 Country‐pair FE Yes Yes Yes Yes Yes Yes Yes Country‐time FE Yes Yes Yes Yes Yes Yes Yes
Clustered standard errors at the country pair level in parentheses. *** p<0.01, ** p<0.05, * p<0.1

26
Table 7: Deep trade agreements and GVC integration in goods ‐sectoral estimations, PPML
(1) (2) (3) (4) (5) (6)
DVA FVA
No. of provisions 0.00208*** ‐0.000205 0.00293*** 0.00127 ‐0.00315 0.00230*
(0.000808) (0.00471) (0.00108) (0.00103) (0.00611) (0.00134)
No. of provisions* VA share 0.00734 0.0145
(0.0140) (0.0185) No. of provisions*High VA share {0,1} ‐0.00252* ‐0.00355**
(0.00133) (0.00151)
BIT 0.122*** 0.122*** 0.122*** 0.0848*** 0.0845*** 0.0848***
(0.0232) (0.0232) (0.0232) (0.0253) (0.0254) (0.0253)
PTA (in force or inactive) 0.0368 0.0373 0.0354 0.0357 0.0365 0.0350
(0.0297) (0.0297) (0.0296) (0.0362) (0.0361) (0.0361)
Observations 365,535 365,535 365,535 365,370 365,370 365,370
R‐squared 0.975 0.975 0.975 0.990 0.990 0.990
Country‐pair‐industry FE Yes Yes Yes Yes Yes Yes
Importer‐industry‐time FE Yes Yes Yes Yes Yes Yes
Exporter‐industry‐time FE Yes Yes Yes Yes Yes Yes
p‐value F‐test No. of provisions 0.4472 0.6487 0.3600 0.1808
Clustered standard errors at the country pair level in parentheses. *** p<0.01, ** p<0.05, * p<0.1

27
Table 8: Deep trade agreements and GVC integration in services ‐sectoral estimations, PPML
(1) (2) (3) (4) (5) (6)
DVA FVA
No. of provisions 0.00288* ‐0.0140* ‐0.00155 0.00249 ‐0.00635 ‐0.000882
(0.00170) (0.00760) (0.00216) (0.00167) (0.00726) (0.00218)
No. of provisions* VA share 0.0320** 0.0178
(0.0143) (0.0139) No. of provisions*High VA share {0,1} 0.00730*** 0.00734***
(0.00282) (0.00282)
BIT 0.00389 0.00397 0.00348 ‐0.0252 ‐0.0253 ‐0.0263
(0.0608) (0.0608) (0.0609) (0.0531) (0.0532) (0.0532)
PTA (in force or inactive) ‐0.0442 ‐0.0385 ‐0.0455 0.0563 0.0647 0.0589
(0.0657) (0.0667) (0.0662) (0.0602) (0.0619) (0.0618)
Observations 295,381 295,381 295,381 295,076 295,076 295,076
R‐squared 0.922 0.922 0.922 0.950 0.950 0.950
Country‐pair‐industry FE Yes Yes Yes Yes Yes Yes
Importer‐industry‐time FE Yes Yes Yes Yes Yes Yes
Exporter‐industry‐time FE Yes Yes Yes Yes Yes Yes
p‐value F‐test No. of provisions 0.0117 0.0095 0.1017 0.0020
Clustered standard errors at the country pair level in parentheses. *** p<0.01, ** p<0.05, * p<0.1

28
Table 9: Deep trade agreements and trade in parts and components, PPML
(1) (2) (3)
No. of provisions 0.00294**
(0.00130)
Core provisions 0.00589**
(0.00273)
PCA depth 0.0224**
(0.0107)
BIT 0.127*** 0.126*** 0.127***
(0.0316) (0.0316) (0.0316)
PTA (in force or inactive ‐0.0492 ‐0.0737 ‐0.0574
(0.0470) (0.0505) (0.0489)
Observations 336,976 336,976 336,976
R‐squared 0.990 0.990 0.990
Country‐pair FE Yes Yes Yes
Country‐time FE Yes Yes Yes
Clustered standard errors at the country pair level in parentheses.
*** p<0.01, ** p<0.05, * p<0.1

29
Table 10: The content of PTAs and trade in parts and components by income groups, PPML
(1) (2) (3) (4)
Imports of parts and components
No. of WTO+ provisions 0.00557 0.0160 0.0125* ‐0.00984
(0.00553) (0.00989) (0.00661) (0.00683)
No. of WTO‐X provisions 0.00102 ‐0.00956* 0.0151 0.0220***
(0.00328) (0.00538) (0.00959) (0.00663)
No. of WTO+ provisions * South‐South ‐0.00359 0.0223**
(0.0112) (0.00990)
No. of WTO‐X provisions * South‐South 0.0246** ‐0.00691
(0.0110) (0.0113)
No. of WTO+ provisions *North‐South ‐0.0259** ‐0.0223**
(0.0117) (0.00990)
No. of WTO‐X provisions * North‐South 0.0315*** 0.00691
(0.00896) (0.0113)
No. of WTO+ provisions *North‐North 0.00359 0.0259**
(0.0112) (0.0117)
No. of WTO‐X provisions * North‐North ‐0.0246** ‐0.0315***
(0.0110) (0.00896)
BIT 0.127*** 0.130*** 0.130*** 0.130***
(0.0316) (0.0319) (0.0319) (0.0319)
PTA (in force or inactive) ‐0.0619 ‐0.0744 ‐0.0744 ‐0.0744
(0.0490) (0.0465) (0.0465) (0.0465)
Observations 336,976 336,976 336,976 336,976 R‐squared 0.990 0.991 0.991 0.991
Country‐pair FE Yes Yes Yes Yes
Country‐time FE Yes Yes Yes Yes
Clustered standard errors at the country‐pair level in parenthesis.
*** p<0.01, ** p<0.05, * p<0.1

30
Table 11: Deep trade agreements and GVC integration, indirect effect PPML
(1) (2) (3) (4) (5) (6) (7)
DVA DVA final DVA
intermediate DVA int.
re‐exported FVA FVA final FVA
intermediate
No. of provisions 0.0133*** 0.00982*** 0.0138*** 0.0150*** 0.0104*** 0.00815*** 0.0107***
(0.00209) (0.00255) (0.00213) (0.00231) (0.00201) (0.00241) (0.00184)
BIT 0.380*** 0.322*** 0.359*** 0.334*** 0.309*** 0.291*** 0.276***
(0.0944) (0.0947) (0.0914) (0.0933) (0.0785) (0.0817) (0.0820) PTA (in force or inactive 0.143 0.359*** 0.0224 0.127 0.221** 0.500*** 0.0208
(0.113) (0.0943) (0.115) (0.120) (0.102) (0.110) (0.0942)
Observations 26,520 26,520 26,520 26,520 26,520 26,520 26,520
R‐squared 0.980 0.987 0.974 0.972 0.988 0.988 0.986
Country‐pair FE Yes Yes Yes Yes Yes Yes Yes
Country‐year FE Yes Yes Yes Yes Yes Yes Yes
Clustered standard errors at the country pair level in parentheses.
*** p<0.01, ** p<0.05, * p<0.1
Table 12: Deep trade agreements and GVC integration‐ interval estimations, PPML
(1) (2) (3) (4) (5) (6) (7)
DVA DVA final
DVA intermediate
DVA int. re‐exported
FVA FVA final FVA
intermediate
No. of provisions 0.00431*** 0.00308* 0.00488*** 0.00565*** 0.00337** 0.00227 0.00379***
(0.00137) (0.00173) (0.00151) (0.00179) (0.00142) (0.00179) (0.00130)
BIT 0.123*** 0.0827 0.145*** 0.119** 0.0794** 0.0491 0.104**
(0.0452) (0.0580) (0.0486) (0.0551) (0.0385) (0.0513) (0.0414) PTA (in force or inactive) ‐0.0457 0.154*** ‐0.148*** ‐0.138* ‐0.000971 0.233*** ‐0.149***
(0.0514) (0.0559) (0.0570) (0.0715) (0.0486) (0.0592) (0.0478)
Observations 9,360 9,360 9,360 9,360 9,360 9,360 9,360
R‐squared 0.995 0.996 0.992 0.990 0.997 0.996 0.996
Country‐pair FE Yes Yes Yes Yes Yes Yes Yes
Country‐time FE Yes Yes Yes Yes Yes Yes Yes
Period 3‐year 3‐year 3‐year 3‐year 3‐year 3‐year 3‐year
Clustered standard errors at the country pair level in parentheses.
*** p<0.01, ** p<0.05, * p<0.1

31
Table 13: Deep trade agreements and trade in parts and components interval estimations, PPML
(1) (2) (3)
No. of provisions 0.00439***
(0.00158)
Core provisions 0.00777**
(0.00355)
PCA depth 0.0305**
(0.0138)
BIT 0.146*** 0.144*** 0.145***
(0.0349) (0.0350) (0.0350)
PTA (in force or inactive) ‐0.0520 ‐0.0771 ‐0.0581
(0.0560) (0.0555) (0.0555)
Observations 116,400 116,400 116,400
R‐squared 0.988 0.989 0.988
Country‐pair FE Yes Yes Yes
Country‐time FE Yes Yes Yes
Period 3‐year 3‐year 3‐year
Clustered standard errors at the country‐pair level in parenthesis.
*** p<0.01, ** p<0.05, * p<0.1
32
References Antràs, Pol, and Robert W. Staiger. 2012. "Offshoring and the Role of Trade Agreements." American
Economic Review 102 (7): 3140‐3183.
Baier, Scott L., and Jeffrey H. Bergstrand. 2007. "Do Free Trade Agreements Actually Increase Members'
International Trade?" Journal of International Economics 71 (1): 72‐95.
Baldwin, Richard. 2011. "21st Century Regionalism: Filling the gap Between 21st Century trade and 20th
Century Trade Rules." CEPR Policy Insight (56).
Baldwin, Richard, and Patrick Low, . 2009. Multilateralizing Regionalism: Challenges for the Global
Trading System. Cambridge University Press.
Bergstrand , Jeffrey H., Mario Larch, and Yoto V. Yotov. 2015. "Economic Integration Agreements,
Border Effects, and Distance Elasticities in the gravity Equation." European Economic Review
78(C): 307‐327.
Bickwit, Grant, Emanuel Ornelas, and John Turner. 2017. Preferential Trade Agreements and Global
Sourcing. Mimeo, University of Georgia.
Boffa, Mauro, Marion Jansen, and Olga Solleder. 2017. "Do we Need Deeper Trade Agreements for GVCs
or just a BIT?" ITC working paper series.
Egger, Peter, and Mario Larch. 2008. "Interdependent Preferential Trade Agreement Memberships: An
Empirical Analysis." Journal of International Economics 76 (2): 384‐399.
Hoffman, Claudia, Alberto Osnago, and Ruta Michele. 2017. "The Content of Preferential Trade
Agreements." Forthcoming, World Trade Review.
Horn, Hendrik, Petros C. Mavroidis, and André Sapir. 2010. "Beyond the WTO? An Anatomy of EU and
US Preferential Trade Agreements." The World Economy 33: 1565‐1588.
Johnson, Robert C., and Guillermo Noguera. 2017. "A Portrait of Trade in Value Added over Four
Decades." The Review of Economics and Statistics 99 (5): 896‐911.
Lawrence, Robert Z. 1996. Regionalism, Multilateralism, and Deeper Integration. Washington, DC:
Brookings Institution Press.
Limão, Nuno. 2016. "Preferential Trade Agreements." In Handbook of Commercial policy, edited by Kyle
Bagwell and Robert W, Staiger.
Mattoo, Aaditya, Alen Mulabdic, and Michele Ruta. 2017. Trade Creation and Trade Diversion in Deep
Agreements. Policy Research working paper; no. WPS 8206, Word Bank Group.
Miroudot, Sébastien. 2016. Gravity in a World of Global Value Chains. Mimeo, Organization for
Economic Cooperation and Development.

33
Noguera, Guillermo. 2012. Trade Costs and Gravity for Gross and Value Added Trade. Mimeo, University
of Warwick.
Orefice, Gianluca, and Nadia Rocha. 2014. "Deep Integration and Production Networks: an Empirical
Analysis." The World Economy 37 (1): 106‐136.
Osnago, Alberto, Nadia Rocha, and Michele Ruta. 2015. "Deep Trade Agreements and Vertical FDI: The
Devil is in the Details." Forthcoming, Canadian Journal of Economics.
Osnago, Alberto, Nadia Rocha, and Michele Ruta. 2016. "Do Deep Trade Agreements Boost Vertical
FDI?" World Bank Economic Review 30 (1): 119‐125.
Piermartini, Roberta, and Yoto V. Yotov. 2016. Estimating Trade Policy Effects with Structural Gravity.
Mimeo, Drexel University.
Rubínová, Stela. 2017. The Impact of New Regionalism on Global Value Chains Participation. Mimeo,
Centre for Trade and Economic Integration, The Graduate Institute, Geneva.
Santos Silva, J.M.C., and Silvana Tenreyro. 2006. "The Log of Gravity." The Review of Economics and
Statistics 88 (4): 641‐658.
Trefler, Daniel. 2004. "The Long and Short of the Canada‐U.S. Free Trade Agreement." American
Economic Review 88 (4): 870‐895.
Wang, Zhi, Shang‐Jin Wei, and Kunfu Zhu. 2016. Quantifying International Production Sharing at the
Bilateral and Sector Levels. Mimeo, Columbia University.
World Trade Organization. 2011. World Trade Report 2011: The WTO and Preferential Trade
Agreements: From Co‐Existence to Coherence. Geneva.

34
Annex 1 Table A1: Description of the 52 Provisions in the Content of Deep Trade Agreements Database
WTO‐plus areas
AD Retention of antidumping rights and obligations under the WTO Agreement (Art. VI GATT). Unfair trade practices.
Customs Provision of information; publication on the internet of new laws and regulations; training. Incl. provisions on trade facilitation.
CVM Retention of countervailing measures rights and obligations under the WTO Agreement (Art VI GATT).
Export Taxes Elimination of export taxes. Examples: Elimination of customs duties on exports, elimination of duties, taxes or other charges on exports.
FTA Agriculture Tariff liberalization with regard to agriculture goods; elimination of non‐tariff measures.
FTA Industrial or Customs Tariff liberalization with regard to industrial goods; elimination of non‐tariff measures.
GATS Liberalization of trade in services.
Public Procurement Progressive liberalization; national treatment and/or non‐discrimination principle; publication of laws and regulations on the internet; specification on public procurement regime.
SPS Affirmation of rights and obligations under the WTO Agreement on SPS; harmonization of SPS measures.
State Aid Assessment of anticompetitive behavior; annual reporting on the value and distribution of state aid given; provision of information. Incl. export subsidies on products.
STE
GATT Art. XVII. Establishment or maintenance of a state enterprise in accordance with and affirming provisions of GATT. Non‐discrimination regarding production and marketing condition; provision of information. Incl. provisions on public undertakings.
TBT Affirmation of rights and obligations under WTO Agreement on TBT; provision of information; harmonization of regulations; mutual recognition agreements.
TRIMs Provisions concerning requirements for local content and export performance on FDI. Applies only to measures that affect trade in goods.
TRIPs
Harmonization of standards; enforcement; national treatment; most‐favored nation treatment and any other policy covered by TRIPs. International treaties referenced in TRIPS: Paris Convention, Berne Convention, Rome Convention, IPIC Treaty.
WTO‐X areas
Agriculture Policies and technical assistance to conduct modernization projects; exchange of information.
Anti‐Corruption Regulations concerning criminal offence measures in matters affecting international trade and investment.

35
Approximation of Legislation
Application of international legislation in national legislation. Any form of legislation that provides for approximation of laws. [Appears mainly in customs unions.]
Audio Visual Promotion of the industry; encouragement of co‐production.
Civil Protection Implementation of harmonized rules and policies.
Competition Policy
Chapter/provision on competition policy in general, could include prescriptions as regards anticompetitive business conduct; harmonization of competition laws; establishment or maintenance of an independent competition authority, among others.
Consumer Protection Harmonization of consumer protection laws and policies; exchange of information and experts; training.
Cultural Cooperation Promotion of joint initiatives and local culture.
Data Protection Exchange of information and experts; joint projects.
Economic Policy Dialogue Exchange of ideas and opinions; joint studies.
Education and Training Measures to improve the general level of education.
Energy Exchange of information; technology transfer; joint studies.
Environmental Laws
Development of environmental standards or policies; enforcement of national and international environmental laws; establishment of sanctions for violation of environmental laws; publications of laws and regulation.
Financial Assistance Policies and rules guiding the granting and administration of financial assistance.
Health Monitoring of diseases; development of health information systems; exchange of information.
Human Rights Respect for human rights; policies.
Illegal Immigration Conclusion of re‐admission agreements; prevention and control of illegal immigration.
Illicit Drugs Treatment and rehabilitation of drug addicts; joint projects on prevention of consumption; reduction of drug supply; information exchange.
Industrial Cooperation Assistance in conducting modernization projects; facilitation and access to credit to finance.
Information Society Exchange of information; dissemination of new technologies; training. Cooperation and exchange of information (often in the context of other policies).
Innovation Policies Participation in framework programs; promotion of technology transfers.
Investment
Information exchange; Development of legal frameworks; Harmonization and simplification of procedures; National treatment; Establishment of mechanism for the settlement of disputes. Incl. investment policies not covered by TRIMs (e.g. promotion, protection, liberalization of investment measures, among other).

36
IPR Accession to international treaties not referenced in the TRIPs Agreement. Incl. intellectual property policies and/or the regulation of different types of IPRs not covered by TRIPs.
Labor Market Regulation Regulation of the national labor market; affirmation of International Labor Organization (ILO) commitments and standards; enforcement.
Mining Exchange of information and experience; development of joint initiatives.
Money Laundering Harmonization of standards; technical and administrative assistance.
Movement of Capital Liberalization of capital movement; prohibition of new restrictions.
Nuclear Safety Development of laws and regulations; supervision of the transportation of radioactive materials.
Political Dialogue Convergence of the parties’ positions on international issues; encouragement for increased political dialogue.
Public Administration Technical assistance; exchange of information; joint projects; training.
Regional Cooperation Promotion of regional cooperation; technical assistance programs.
Research and Technology Joint research projects; exchange of researchers; development of public‐private partnership.
SMEs Technical assistance; facilitation of access to finance.
Social Matters Coordination of social security systems; non‐discrimination regarding working conditions.
Statistics Harmonization and/or development and/or exchange of statistical methods and statistics; training.
Taxation Policies and/or assistance in conducting fiscal system reforms.
Terrorism Exchange of information and experience; joint research and studies.
Visa and Asylum Exchange of information; drafting legislation; training. Incl. international movement of persons.

37
Table A2: Shares of value added by sector
Industry name WIOD sectors
Average value added
share
Goods
Food, Beverages and Tobacco 3 0.268
Textiles and Textile Products 4 0.337
Leather, Leather and Footwear 5 0.307
Wood and Products of Wood and Cork 6 0.328
Pulp, Paper, Paper, Printing and Publishing 7 0.357
Chemicals and Chemical Products 9 0.305
Rubber and Plastics 10 0.323
Other Non‐Metallic Mineral 11 0.372
Basic Metals and Fabricated Metal 12 0.299
Machinery, Nec 13 0.337
Electrical and Optical Equipment 14 0.302
Transport Equipment 15 0.276
Manufacturing, Nec; Recycling 16 0.347
Services
Electricity, Gas and Water Supply 17 0.425
Construction 18 0.386 Sale, Maintenance and Repair of Motor Vehicles and Motorcycles; Retail Sale of Fuel 19 0.532 Wholesale Trade and Commission Trade, Except of Motor Vehicles and Motorcycles 20 0.577 Retail Trade, Except of Motor Vehicles and Motorcycles; Repair of Household Goods 21 0.613
Hotels and Restaurants 22 0.487
Inland Transport 23 0.495
Water Transport 24 0.357
Air Transport 25 0.316 Other Supporting and Auxiliary Transport Activities; Activities of Travel Agencies 26 0.478
Post and Telecommunications 27 0.570
Financial Intermediation 28 0.598
Real Estate Activities 29 0.743
Renting of M&Eq and Other Business Activities (has R&D) 30 0.563
Public Admin and Defense; Compulsory Social Security 31 0.651
Education 32 0.772
Health and Social Work 33 0.623
Other Community, Social and Personal Services 34 0.535
Private Households with Employed Persons 35 0.649
Note: value added shares of gross output averaged across the whole WIOD countries sample over 1995‐2011.