deep sequencing of 10,000 human genomes - · pdf filefigure’4 a b c peer-reviewed) is...
TRANSCRIPT

Page 1 of 12
Deep Sequencing of 10,000 Human Genomes
Amalio Telentia,b,1, Levi C.T. Piercea,d,1, William H. Biggs a,1, Julia di Iulioa,b, Emily H.M.
Wonga, Martin M. Fabania, Ewen F. Kirknessa, Ahmed Moustafaa, Naisha Shaha, Chao
Xiec, Suzanne C. Brewertonc, Nadeem Bulsaraa, Chad Garnera, Gary Metzkera, Efren Sandovala, Brad A. Perkinsa, Franz J. Ocha,d, Yaron Turpaza,c, J. Craig Ventera,b,2
a Human Longevity Inc., San Diego, CA, USA.
b J. Craig Venter Institute, La Jolla, CA, USA.
c Human Longevity Singapore Pte. Ltd. Singapore.
d Human Longevity Inc., Mountain View, CA, USA.
1 These authors contributed equally to this work.
2Corresponding author. E-mail: [email protected] (J.C.V.)
.CC-BY-ND 4.0 International licensepeer-reviewed) is the author/funder. It is made available under aThe copyright holder for this preprint (which was not. http://dx.doi.org/10.1101/061663doi: bioRxiv preprint first posted online Jul. 1, 2016;
Page 2 of 12
Abstract
We report on the sequencing of 10,545 human genomes at 30-40x coverage with an
emphasis on quality metrics and novel variant and sequence discovery. We find that
84% of an individual human genome can be sequenced confidently. This high
confidence region includes 91.5% of exon sequence and 95.2% of known pathogenic
variant positions. We present the distribution of over 150 million single nucleotide
variants in the coding and non-coding genome. Each newly sequenced genome
contributes an average of 8,579 novel variants. In addition, each genome carries in
average 0.7 Mb of sequence that is not found in the main build of the hg38 reference
genome. The density of this catalog of variation allowed us to construct high
resolution profiles that define genomic sites that are highly intolerant of genetic
variation. These results indicate that the data generated by deep genome sequencing is of the quality necessary for clinical use.
Significance statement
Declining sequencing costs and new large-scale initiatives towards personalized
medicine are driving a massive expansion in the number of human genomes being
sequenced. Therefore, there is an urgent need to define quality standards for clinical
use. This includes deep coverage and sequencing accuracy of an individual’s
genome, rather than aggregated coverage of data across a cohort or population. Our
work represents the largest effort to date in sequencing human genomes at deep
coverage with these new standards. This study identifies over 150 million human
variants, a majority of them rare and unknown. Moreover, these data identify sites
in the genome that are highly intolerant to variation – possibly essential for life or
health. We conclude that high coverage genome sequencing provides accurate detail on human variation for discovery and for clinical applications.
.CC-BY-ND 4.0 International licensepeer-reviewed) is the author/funder. It is made available under aThe copyright holder for this preprint (which was not. http://dx.doi.org/10.1101/061663doi: bioRxiv preprint first posted online Jul. 1, 2016;
Page 3 of 12
\body
Recent technological advances allowed for the large scale sequencing of the whole
human genome (1-7). Most studies generated population-based information on
human diversity using low to intermediate coverage of the genome (4x to 20x
sequencing depth). The highest coverage (30x or greater) was reported for the
recent sequencing of 1,070 Japanese subjects (6), 129 trios from the 1000 Genome
Project (3), and 909 Icelandic subjects (4). High coverage, also described as deep coverage, may be needed for an adequate representation of the human genome.
In an effort to evaluate the capabilities of whole human genome sequencing using
short read sequencing in full production mode, we first measured accuracy and
generated quality standards by analysis of the reference material NA12878 from the
CEPH Utah reference collection (8). We then assessed these quality standards across
10,545 human genomes sequenced to high depth. This generated a reliable
representation of human single nucleotide variation (SNV), and the reporting of
clinically relevant SNVs. We confronted, like other groups, the limitations of short
read sequencing for accurate calling of structural and copy number variation; even
with a variety of methods, resolving structural variation in a personal genome remains a challenge (9).
Results
Reproducibility of sequencing on a reference genome. We assessed the extent of
genome coverage using data from 325 technical replicates of NA12878 at different
depths of read coverage. The canonical NA12878 Genome-In-A-Bottle call set (GiaB
v2.19) defines a set of high confidence regions that corresponds to approximately
70% of the total genome. Regions of low complexity (e.g. centromeres, telomeres
and repetitive regions) and challenging for sequencing, alignment and variant
calling methods are excluded from the GiaB high confidence region. At the target
mean coverage of 30x, 95% of one NA12878 genome is covered at least at 10x. In
contrast, at a target mean coverage of 7x used by several genome projects, only 23% of the NA12878 genome is sequenced at an effective 10x (Fig. 1A).
We next assessed reproducibility on variant calling for the whole genome by
restricting the analysis to a set of 200 samples of NA12878 that were sequenced at a
mean coverage of 30x to 40x. Due to manufacturer’s changes in clustering reagents,
we analyzed 100 samples prepared with v1 and 100 with v2 (supporting
information). After applying quality filters, passing genotypes calls were compared
for consistency (Fig. 1B). For v2 chemistry, 2.51 billion positions passed, and were
called with 100% reproducibility in all replicates. An additional 210 Mb of genome
positions yielded passing reproducible genotypes in more than 90%. Only 184 Mb of
genome positions were sequenced with lower reproducibility (<90%). Similar
results were obtained for v1 chemistry. The analysis of 100 unrelated genomes (25
individuals for each of the three main populations, African, Asian, European, and 25
admixed individuals) confirmed the consistency of calls across genomes (Fig. 1B).
Overall, a total of 2,157 Mb (97.3%) of the GiaB high confidence region could be
.CC-BY-ND 4.0 International licensepeer-reviewed) is the author/funder. It is made available under aThe copyright holder for this preprint (which was not. http://dx.doi.org/10.1101/061663doi: bioRxiv preprint first posted online Jul. 1, 2016;
Page 4 of 12
sequenced with high reproducibility (Table S1) with a low false discovery rate of
0.0008, precision of 0.999 and recall of 0.994. Overall, these analyses indicate that
the current technology and sequencing conditions generate highly accurate sequence data over a large proportion of the genome.
The full extent of sequence generated for a single genome is greater than what is
defined by the boundaries of GiaB. It should be noted that the various genome
sequencing initiatives use different reporting of what is sequenced (“accessible
genome”), what is sequenced confidently, and whether these estimates are reported
for an individual genome, or for the collective analysis of multiple genomes. Our
work specifically presents the genome calls for a single individual benchmarked
against the complete sequence (hg38 - Total chromosomal length of autosomes and
chrX, 3,031 Mb), and against the community standard (GiaB, on autosomes + chrX,
liftover to hg38, 2,215 Mb); Table S2. For a single individual, we map sequence on
90-95% of the genome - and 84% of a single genome is reported at high confidence
(see below). In contrast, several published sequencing projects (2-5) describe
genome coverage computed from the combination of all genomes – not for an
individual genome. Using similar metrics as those in the current work for one 7X
mean coverage 1000 Genome Project sample (HG02541), we find the following
statistics: 0.2% of the genome covered at 30X, 22.1% covered at 10X, and 75.5%
covered at 5X. The loss of coverage genome wide translates in loss of coverage of
particular genes and variants. For example, the American College of Medical
Genetics and Genomics recommends that laboratories performing clinical
sequencing seek and report mutations of 56 genes (10). At 7X mean coverage none
of the exonic bases of HG02541 could be covered at 30X, 30% would be covered at
10X and 84% at 5X. Therefore, low coverage genomes are not suitable for clinical
use because they can only generate confidence sequence for a fraction of the genome.
The metrics of 10,000 genomes. The confidence regions established from
sequencing of NA12878 and for 100 unrelated genomes served to guide the analysis
of 10,545 human genomes. These samples cover various human populations,
admixture and ancestries (Fig S1). We first defined an extended confidence region
(ECR) that includes the high confidence GiaB regions and the highly reproducible
regions extending beyond the boundaries of GiaB (Fig S2). The ECR encompasses
84% of the human genome, and it includes 91.5% of the human exome sequence
(Gencode, 96 Mb), which is consistent with recent reports on coverage of the human
exome in whole genome analyses (11). We also examined the relevance for clinical
variant calls: 28,831 of 30,288 (95.2%) unique ClinVar and HGMD pathogenic
variant positions are found in the ECR. We have now confirmed that 373 Mb (86%)
of the additional 435 Mb of confident sequence in the ECR is also defined as high confidence in the soon to be released GiaB v3.2.
For 10,545 genomes, the ECR included over 150 million SNVs at 146 million unique
chromosomal positions The mean SNV density in the ECR is 56.59 per 1 kb of
sequence. However, there are differences across chromosomes: Chr.1 is the least
variable (55.12 SNVs/kb) and Chr.16 the most variable (61.26 SNVs/kb) of the
.CC-BY-ND 4.0 International licensepeer-reviewed) is the author/funder. It is made available under aThe copyright holder for this preprint (which was not. http://dx.doi.org/10.1101/061663doi: bioRxiv preprint first posted online Jul. 1, 2016;
Page 5 of 12
autosomal chromosomes. SNV density on ChrX is 35.60 SNVs/kb, but this estimate
only considers female genomes (N=6320). A lower mutation rate of variation on the
X chromosome than on autosomes is thought to reflect purifying selection of
deleterious recessive mutations on hemizygous chromosomes (12). Diversity is
further reduced by the effective population size of the X chromosome, because
males only carry one copy (13). The SNV density on Chr.Y is 12.70 SNVs/kb, also
consistent with knowledge (14); however, only male genomes (N=4,225) are
considered here and only 15% of the single Y chromosome is included in the ECR
(Fig. S3). The definition of ECR allowed for more high confidence calls than those
identified in GiaB (Table 1). This is illustrated by the confident identification of
3,390 ClinVar and HGMD pathogenic variant sites identified in the 10,545 genomes:
2,628 (77.5%) were called in the GiaB region, while 3,191 (94.1%) could be called in the ECR (Table 1).
Patterns of genetic variation in the coding and non-coding genome. The volume
of data presented here provides careful detail on the pattern of sequence
conservation and SNVs across the human genome. We compared the rates of
diversity in protein coding, RNA coding and regulatory elements (Fig. 2A, Fig. S4 and
Table S2). On average, protein coding elements are more conserved than intergenic
regions and, as previously reported, alternative exons are the least variable (15).
Alternative introns of lncRNAs are the most conserved and snoRNA the most
variable of RNA coding elements. Among the analyzed DNA regulatory elements,
repressed chromatin are the most conserved, and promoters are the least conserved
(Fig. 2A). There is an extensive literature on the uneven distribution of SNV density
across the genome. Positive selection, nucleotide composition, recombination hot
spots and replication timing are considered to be contributing factors (16-18). More
recently, the sequence context has been shown to explain >81% of variability in
substitution probabilities (19). These considerations notwithstanding, the pattern of
SNV density is relatively stable across chromosomes (Fig. S5). However, we
identified three unique hypervariable megabase-long regions on autosomes (Fig.
S6). We observe the depletion of enhancer associated histone marks (H3K4me1,
H3K4me2, H3K4me3, H3K27me3 and H3K27ac) in these regions. The hypervariable
regions are also gene-poor, and depleted in chromatin loops, leading us to infer that
these are domains that are not involved in long-distance interactions between
regulatory elements and target genes. The enrichment of variation suggests there is limited purifying selection compared to other regions in the genome.
In order to explore the pattern of variation in the human genome in depth, we built
“SNV metaprofiles” by collapsing all members of a family of genomic elements into a
single alignment. Metaprofiles of protein-coding genes used GENCODE annotated
TSS (n=88,046), start codons (n=21,147), splice donor and acceptor sites
(n=137,079 and 133,702, respectively), stop codons (n=37,742) and
polyadenylation sites (n=88,103) (see supporting information for details). For each
nucleotide aligned against these landmark positions, all of the genomes in this
dataset (n=10,545) were used to generate a precise representation of the pattern of
conservation, and allele spectra (Fig. 2B). A pattern is built by incorporating up to
1.4 billion data points (number of aligned elements x 10,545 samples) per genomic
.CC-BY-ND 4.0 International licensepeer-reviewed) is the author/funder. It is made available under aThe copyright holder for this preprint (which was not. http://dx.doi.org/10.1101/061663doi: bioRxiv preprint first posted online Jul. 1, 2016;

Page 6 of 12
position. For example, the analysis captures the decrease in variant allele frequency
in exons, with the maximum drop occurring at the splice donor site (Fig. 2B).
Positions that do not tolerate human variation can be interpreted as essential and
possibly linked to embryonic lethality. In addition, the metaprofiles reveal discreet
patterns, including with great precision the periodicity of conservation in coding
regions due to the degeneracy of the third nucleotide in the codon in every exon
window. The precision of the approach is also illustrated by the metaprofile of
19304 transmembrane domains from 4719 proteins. The constrain of maintaining
alpha-helices (or other structures), and the hydrophobic (or polar) nature of the
transmembrane domain, result in all aminoacids being distinctively conserved (Fig.
2C).
Many differences across individuals and species occur at the level of transcription
factor binding (20). We use the binding site core motifs for metaprofile landmarking
to identify signatures that include both variation-intolerant and hyper-tolerant
positions at the binding site (Fig. 2D). Ranking of 39 TFBS by the minimum score of
the metaprofile (i.e., the nucleotide with lowest tolerance to variation) emphasizes
profound differences in the requirements for conservation across transcription
factors (Fig. 2E) . While the identification of conserved, intolerant sites is expected,
the biology behind unique hypertolerant positions at transcription binding sites remains to be investigated.
Metaprofile tolerance score and variant pathogenicity. Rare human variants at
intolerant sites may carry a greater fitness cost, associate with greater phenotypic
consequences and thus can be prioritized for clinical assessment. To apply
metaprofiles for scoring of functional severity of variants, we established a tolerance
score (Fig. 3A) that summarizes the rates and frequency of variation at a given
position and for a given landmark. Using this approach, Fig. 3B illustrates the
accumulation of pathogenic variant calls at sites with the lowest metaprofile
tolerance scores. To formalize this analysis, we calculated the tolerance score at
positions aligned to the main coding region landmarks:100 positions upstream and
downstream of the TSS, start codon, splice donor and acceptor, stop codon and
polyadenylation site. At the lowest tolerance score, we observe up to 6-fold
enrichment for pathogenic variants (Fig. 3C). To understand the characteristics of
genes that tolerate variants at privileged sites we used an orthogonal assessment of
gene essentiality (21). The set of essential genes includes highly conserved genes
that have fewer paralogs, and are part of larger protein complexes. Essential genes
also display a higher probability of CRISPR-Cas9 editing compromising cell viability
(22), and knockouts in the mouse model are associated with increased mortality
(23). Fig. 3D supports the concept that the less essential genes can tolerate variation
at sites with low metaprofile tolerance scores.
An important feature of metaprofiling is that it predicts functional consequences of
variation solely on the basis of human diversity. In contrast, the Combined
Annotation-Dependent Depletion (CADD) score (24) uses evolutionary information,
annotation from Ensembl Variant Effect Predictor, and extensive information from
UCSC genome browser tracks. Despite these profoundly different approaches, the
.CC-BY-ND 4.0 International licensepeer-reviewed) is the author/funder. It is made available under aThe copyright holder for this preprint (which was not. http://dx.doi.org/10.1101/061663doi: bioRxiv preprint first posted online Jul. 1, 2016;

Page 7 of 12
tolerant scores obtained from metaprofiles in protein coding regions perform
similarly to CADD for the identification of functional variants (Fig. S7). This
observation underscores the potential of metaprofiling to analyze the genome with
minimal pre-existing knowledge – in particular in the non-coding genome, as
metaprofile tolerance scores only rely on human variation.
Variant discovery rates per individual. The large number of genomes, and the
coverage of various human populations served to describe the rate of newly
observed, unshared SNVs for each additional sequenced genome. We restricted the
analysis to the 8,096 unrelated individuals among the 10,545 genomes (supporting
information). There is an expectation of 500 million variants identified after
sequencing the genomes of 100,000 individuals (Fig. 4A). This analysis establishes
at the whole genome level prior estimates from the study of a limited set of genes or using exome analysis (25, 26).
Unrelated individuals were assigned to five superpopulations or to an admixed or
“other” population group on the basis of genetic ancestry (Fig. S1). Each
subsequently sequenced genome contributes on average 8,579 novel variants, that
varied from 7,214 in Europeans and 10,978 in admixed, to 13,530 in individuals of
African ancestry (Fig. 4B). This reflects the current understanding of Africa as the
most genetically diverse region in the world (5). Of the 150 million SNVs observed in
the ECR, 82 million (54.7%) have not been reported in dbSNP of the National Center
for Biotechnology Information or in the most recent phase 3 of the 1000 Genome
Project (3). The proportion of novel variants increase with decreasing allele
frequency – as expected, there is a negligible number of “novel” variants with allele frequencies greater than 1% (Fig. S8).
Unmapped human genome sequences. In addition to new variants, we identified
4,876 unique Human, or human-like contigs (supporting information) assembled
from 3.26 Mb of non-reference (hg38 build) sequences (“unmapped reads”). On
average, we identified 0.71 Mb of non-reference sequences per genome. A total of
1.89 Mb of the non-redundant sequences could be mapped to known human
sequences in GenBank (though not in the hg38 reference assembly). An additional
0.18 Mb mapped to primate sequences in the NCBI nt database. There are 1.17 Mb
that did not have a known match in nt or nr databases. The GC content and
dinucleotide bias of the unknown contigs reflect the patterns of human sequences.
However, we also identified successfully mapped Eukaryotic, Prokaryotic and viral
contigs that had indistinguishable metrics from human contigs (Fig. S9). Therefore,
it remains difficult to solve bioinformatically the nature of unmapped human-like
reads - they may simply result from contamination (27). Much of the non-reference
sequence is shared with hominins. The unmapped contigs were compared to
Neanderthal and Denisovan sequencing reads that did not map to hg38. There were
0.96 Mb covered by Neanderthal reads and 1.18 Mb covered by Denisovan reads. In
addition, 0.82 Mb are not in hg38 primary assembly, but in the “alt” sequences or
subsequent patches (Fig. 4C). The presence in some individuals of novel sequence
content that is also found among unmapped reads from Denisovan and Neanderthal
genomes and in non-human primates reinforce the notion that the human genome is
.CC-BY-ND 4.0 International licensepeer-reviewed) is the author/funder. It is made available under aThe copyright holder for this preprint (which was not. http://dx.doi.org/10.1101/061663doi: bioRxiv preprint first posted online Jul. 1, 2016;

Page 8 of 12
larger and more distributed than what is currently represented by a single (hg38) reference genome.
Conclusions
The goal of clinical use of the genome requires standards for sequencing, analysis,
and interpretation. Our work specifically addresses the first two steps: sequencing
and sequence analysis. The performance of the platform, implemented in full
production mode, improves on recent benchmarks for the accurate interpretation of
next-generation DNA sequencing in the clinical setting (26, 28, 29). This is needed
for laboratory standards, for regulatory purposes, and for clinical diagnostics and
research. The third step – interpretation - remains a major issue given the many
types of genetic evidence that laboratories consider. Initiatives such as ClinVar, and policies and guidelines (10, 30) set standards for clinical interpretation.
This report also extends prior efforts at genome and exome sequencing by detailing
the distribution of human variation in the non-coding genome. The amount of data
supports the discovery of sites in the genome that are intolerant to variation. The
10,545 genomes provide estimates of the rate of discovery of new SNVs, and
complements the human genome by more than 3Mb through the identification of
non-reference and of putative human-like sequences. These data anticipate the
relentless accumulation of rare variants and the scale of observable mutagenesis of the human genome.
Materials and Methods
Detailed material and methods are provided in SI Materials and Methods.
Acknowledgements
Access to the NA12878 replicates and to genome data is being provided as
described in SI Materials. We thank Drs. Thomas Caskey and Michael Hicks for useful commentaries.
1. Consortium UK, et al. (2015) The UK10K project identifies rare variants in
health and disease. Nature 526(7571):82-90.
2. Genome of the Netherlands C (2014) Whole-genome sequence variation,
population structure and demographic history of the Dutch population. Nat
Genet 46(8):818-825.
3. Genomes Project C, et al. (2015) A global reference for human genetic
variation. Nature 526(7571):68-74.
4. Gudbjartsson DF, et al. (2015) Large-scale whole-genome sequencing of the
Icelandic population. Nat Genet 47(5):435-444.
5. Gurdasani D, et al. (2015) The African Genome Variation Project shapes
medical genetics in Africa. Nature 517(7534):327-332.
.CC-BY-ND 4.0 International licensepeer-reviewed) is the author/funder. It is made available under aThe copyright holder for this preprint (which was not. http://dx.doi.org/10.1101/061663doi: bioRxiv preprint first posted online Jul. 1, 2016;
Page 9 of 12
6. Nagasaki M, et al. (2015) Rare variant discovery by deep whole-genome
sequencing of 1,070 Japanese individuals. Nat Commun 6:8018.
7. Sidore C, et al. (2015) Genome sequencing elucidates Sardinian genetic
architecture and augments association analyses for lipid and blood
inflammatory markers. Nat Genet 47(11):1272-1281.
8. Zook JM, et al. (2015) Extensive sequencing of seven human genomes to
characterize benchmark reference materials. bioRxiv
http://dx.doi.org/10.1101/026468.
9. English AC, et al. (2015) Assessing structural variation in a personal genome-
towards a human reference diploid genome. BMC Genomics 16:286.
10. Richards S, et al. (2015) Standards and guidelines for the interpretation of
sequence variants: a joint consensus recommendation of the American
College of Medical Genetics and Genomics and the Association for Molecular
Pathology. Genet Med 17(5):405-424.
11. Belkadi A, et al. (2015) Whole-genome sequencing is more powerful than
whole-exome sequencing for detecting exome variants. Proc Natl Acad Sci U S
A 112(17):5473-5478.
12. McVean GT & Hurst LD (1997) Evidence for a selectively favourable
reduction in the mutation rate of the X chromosome. Nature 386(6623):388-
392.
13. Schaffner SF (2004) The X chromosome in population genetics. Nat Rev Genet
5(1):43-51.
14. Wilson Sayres MA, Lohmueller KE, & Nielsen R (2014) Natural selection
reduced diversity on human y chromosomes. PLoS genet 10(1):e1004064.
15. Keren H, Lev-Maor G, & Ast G (2010) Alternative splicing and evolution:
diversification, exon definition and function. Nat Rev Genet 11(5):345-355.
16. Hellmann I, et al. (2005) Why do human diversity levels vary at a megabase
scale? Genome res 15(9):1222-1231.
17. Schaibley VM, et al. (2013) The influence of genomic context on mutation
patterns in the human genome inferred from rare variants. Genome res
23(12):1974-1984.
18. Francioli LC, et al. (2015) Genome-wide patterns and properties of de novo
mutations in humans. Nat Genet 47(7):822-826.
19. Aggarwala V & Voight BF (2016) An expanded sequence context model
broadly explains variability in polymorphism levels across the human
genome. Nat Genet 48(4):349-355.
20. Kasowski M, et al. (2010) Variation in transcription factor binding among
humans. Science 328(5975):232-235.
21. Bartha I, et al. (2015) The Characteristics of Heterozygous Protein
Truncating Variants in the Human Genome. PLoS Comput Biol
11(12):e1004647.
22. Shalem O, et al. (2014) Genome-scale CRISPR-Cas9 knockout screening in
human cells. Science 343(6166):84-87.
23. Eppig JT, et al. (2015) The Mouse Genome Database (MGD): facilitating
mouse as a model for human biology and disease. Nucleic acids res
43(Database issue):D726-736.
.CC-BY-ND 4.0 International licensepeer-reviewed) is the author/funder. It is made available under aThe copyright holder for this preprint (which was not. http://dx.doi.org/10.1101/061663doi: bioRxiv preprint first posted online Jul. 1, 2016;
Page 10 of 12
24. Kircher M, et al. (2014) A general framework for estimating the relative
pathogenicity of human genetic variants. Nat Genet 46(3):310-315.
25. Nelson MR, et al. (2012) An abundance of rare functional variants in 202
drug target genes sequenced in 14,002 people. Science 337(6090):100-104.
26. Consortium EA (2015) Analysis of protein-coding genetic variation in 60,706
humans. bioRxiv http://biorxiv.org/content/early/2016/05/10/030338.
27. Lusk RW (2014) Diverse and widespread contamination evident in the
unmapped depths of high throughput sequencing data. PloS one
9(10):e110808.
28. Linderman MD, et al. (2014) Analytical validation of whole exome and whole
genome sequencing for clinical applications. BMC Med Genomics 7:20.
29. Goldfeder RL, et al. (2016) Medical implications of technical accuracy in
genome sequencing. Genome Med 8(1):24.
30. Amendola LM & al. e (2016) Performance of ACMG-AMP Variant-
Interpretation Guidelines among Nine Laboratories in the Clinical
Sequencing Exploratory Research Consortium. Am J Hum Genet.
Contributions
J.C.V. conceived the study. A.T. led the analyses. L.C.T.L., J. di I., E.H.M.W., E.F.K., A.M.,
N.S., and C.X., performed the analyses. W.H.B., M.F. and E.S. led the sequencing
process. N.B., G.M., M.D.S., S.C.B, C.G., and C.M., built informatic annotation and technology infrastructures, B.A.P., F.J.O, and Y.T. supervised research.
.CC-BY-ND 4.0 International licensepeer-reviewed) is the author/funder. It is made available under aThe copyright holder for this preprint (which was not. http://dx.doi.org/10.1101/061663doi: bioRxiv preprint first posted online Jul. 1, 2016;
Page 11 of 12
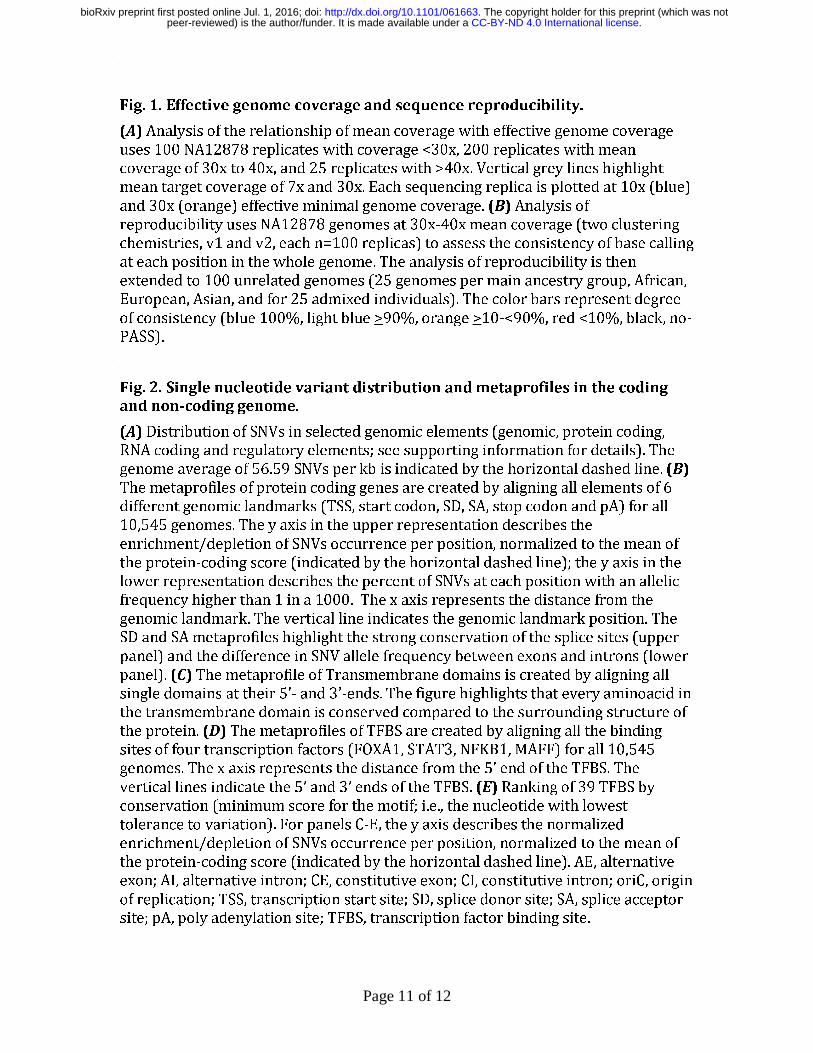
Fig. 1. Effective genome coverage and sequence reproducibility.
(A) Analysis of the relationship of mean coverage with effective genome coverage
uses 100 NA12878 replicates with coverage <30x, 200 replicates with mean
coverage of 30x to 40x, and 25 replicates with >40x. Vertical grey lines highlight
mean target coverage of 7x and 30x. Each sequencing replica is plotted at 10x (blue)
and 30x (orange) effective minimal genome coverage. (B) Analysis of
reproducibility uses NA12878 genomes at 30x-40x mean coverage (two clustering
chemistries, v1 and v2, each n=100 replicas) to assess the consistency of base calling
at each position in the whole genome. The analysis of reproducibility is then
extended to 100 unrelated genomes (25 genomes per main ancestry group, African,
European, Asian, and for 25 admixed individuals). The color bars represent degree
of consistency (blue 100%, light blue >90%, orange >10-<90%, red <10%, black, no-PASS).
Fig. 2. Single nucleotide variant distribution and metaprofiles in the coding
and non-coding genome.
(A) Distribution of SNVs in selected genomic elements (genomic, protein coding,
RNA coding and regulatory elements; see supporting information for details). The
genome average of 56.59 SNVs per kb is indicated by the horizontal dashed line. (B)
The metaprofiles of protein coding genes are created by aligning all elements of 6
different genomic landmarks (TSS, start codon, SD, SA, stop codon and pA) for all
10,545 genomes. The y axis in the upper representation describes the
enrichment/depletion of SNVs occurrence per position, normalized to the mean of
the protein-coding score (indicated by the horizontal dashed line); the y axis in the
lower representation describes the percent of SNVs at each position with an allelic
frequency higher than 1 in a 1000. The x axis represents the distance from the
genomic landmark. The vertical line indicates the genomic landmark position. The
SD and SA metaprofiles highlight the strong conservation of the splice sites (upper
panel) and the difference in SNV allele frequency between exons and introns (lower
panel). (C) The metaprofile of Transmembrane domains is created by aligning all
single domains at their 5’- and 3’-ends. The figure highlights that every aminoacid in
the transmembrane domain is conserved compared to the surrounding structure of
the protein. (D) The metaprofiles of TFBS are created by aligning all the binding
sites of four transcription factors (FOXA1, STAT3, NFKB1, MAFF) for all 10,545
genomes. The x axis represents the distance from the 5’ end of the TFBS. The
vertical lines indicate the 5’ and 3’ ends of the TFBS. (E) Ranking of 39 TFBS by
conservation (minimum score for the motif; i.e., the nucleotide with lowest
tolerance to variation). For panels C-E, the y axis describes the normalized
enrichment/depletion of SNVs occurrence per position, normalized to the mean of
the protein-coding score (indicated by the horizontal dashed line). AE, alternative
exon; AI, alternative intron; CE, constitutive exon; CI, constitutive intron; oriC, origin
of replication; TSS, transcription start site; SD, splice donor site; SA, splice acceptor site; pA, poly adenylation site; TFBS, transcription factor binding site.
.CC-BY-ND 4.0 International licensepeer-reviewed) is the author/funder. It is made available under aThe copyright holder for this preprint (which was not. http://dx.doi.org/10.1101/061663doi: bioRxiv preprint first posted online Jul. 1, 2016;

Page 12 of 12
Fig. 3. Relationship of a metaprofile tolerance score with variant pathogenicity
and gene essentiality.
(A) Metaprofile of the transition between introns and exons expressed as Tolerance
Score (TS). The TS is the product of the normalized SNV distribution value by the
proportion of SNVs with allele frequency > 0.001 (see Fig.2B). The exon sequence
highlights the conservation and tolerance to variation of the third position in codons
(red). The pattern of higher tolerance to variation every third nucleotide is lost in
introns. The TS is lowest at the splice donor and acceptor sites and highest in
introns. (B) The distribution of ClinVar and HGMD pathogenic SNVs (n=29,808 in
SD; n=30,369 in SA metaprofiles) reflects a significant enrichment of pathogenic
variants at the sites of lowest TA. Consistently, the exon sequence highlights the
enrichment for variation at the first position in codons (blue), as it results in amino
acid change or truncation. (C) Relationship of tolerance score and enrichment for
pathogenic variants. Represented on X axis are the median TS values of 1200
positions (six protein coding landmark positions + 100 bp) expressed in 100 bins.
The Y axis present the fold enrichment in pathogenic variants per bin. The LOESS
curve fitting is represented by the solid line; the shaded area indicates the 95%
confidence interval. (D) Less essential genes tolerate variation at sites with lowest
TS values. The x axis represents a gene essentiality score (the posterior probability
of intolerance to truncation (21)). The y axis represents the fraction of genes with a
given essentiality score or lower. Purple = genes with no variation in splice donor
(SD) or acceptor (SA) sites are more essential and appear shifted to the right of the
plot, Orange = genes with variation only in SD sites, Blue= genes with variation only
in SA sites, Green= genes with variation in SD and SA sites are less essential and
appear shifted to the left of the plot.
Fig. 4. Novel variants and genome sequences.
(A) SNV discovery rate for 8,096 unrelated individual genomes contributing over
150 million SNVs (blue line). The projection for discovery rates as more genomes
are sequenced is represented without (dashed black line) and with correction for
the empirical false discovery rate of 0.0025 (dashed orange line). The number of
SNVs in dbSNP is represented by the horizontal straight grey line. (B) The number
of newly observed variants as more individuals are sequences is determined by the
ancestry background and number of participants in the study. Shown are the rates
of identification of novel variants for each additional African genome (13,539 SNVs),
and for each additional genome of admixed individuals (10,918 SNVs). The most
numerous population in the study, Europeans, contribute the lowest number of
novel variants (7,215 SNVs). (C) Unmapped sequence from the analysis of 8,096
unrelated individual genomes contributing over 3.2 Mb of non-reference genome.
The 4,876 unique non-reference contigs had matches in NCBI nt database as human,
or non-human primate, and with hominins. There are contigs with human-like
features that do not have a known match in databases.
.CC-BY-ND 4.0 International licensepeer-reviewed) is the author/funder. It is made available under aThe copyright holder for this preprint (which was not. http://dx.doi.org/10.1101/061663doi: bioRxiv preprint first posted online Jul. 1, 2016;
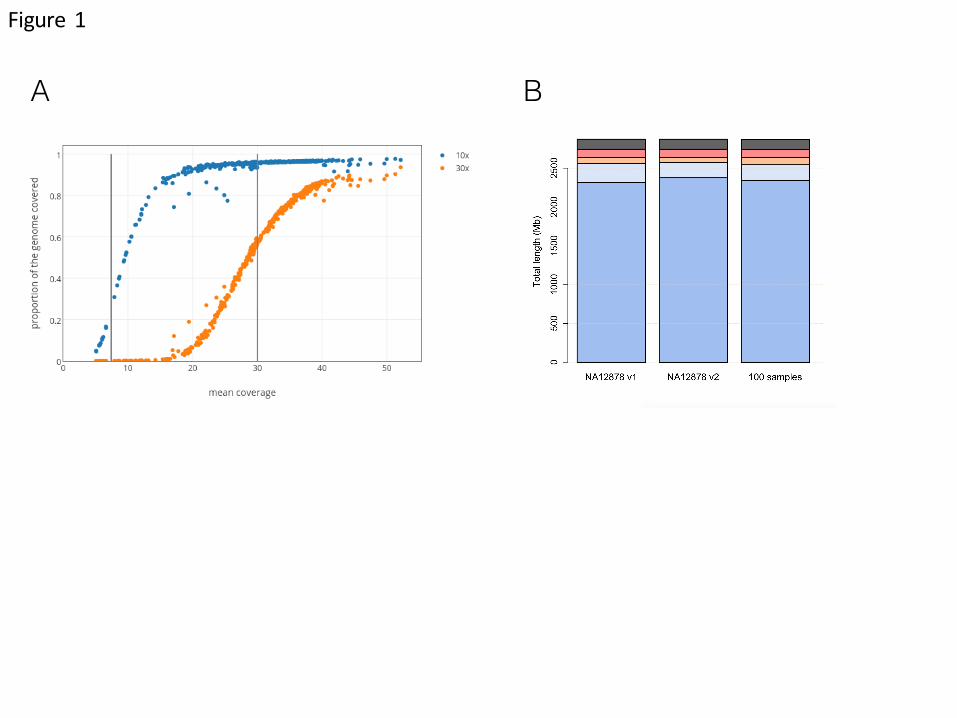
Figure 1
A B
.CC-BY-ND 4.0 International licensepeer-reviewed) is the author/funder. It is made available under aThe copyright holder for this preprint (which was not. http://dx.doi.org/10.1101/061663doi: bioRxiv preprint first posted online Jul. 1, 2016;
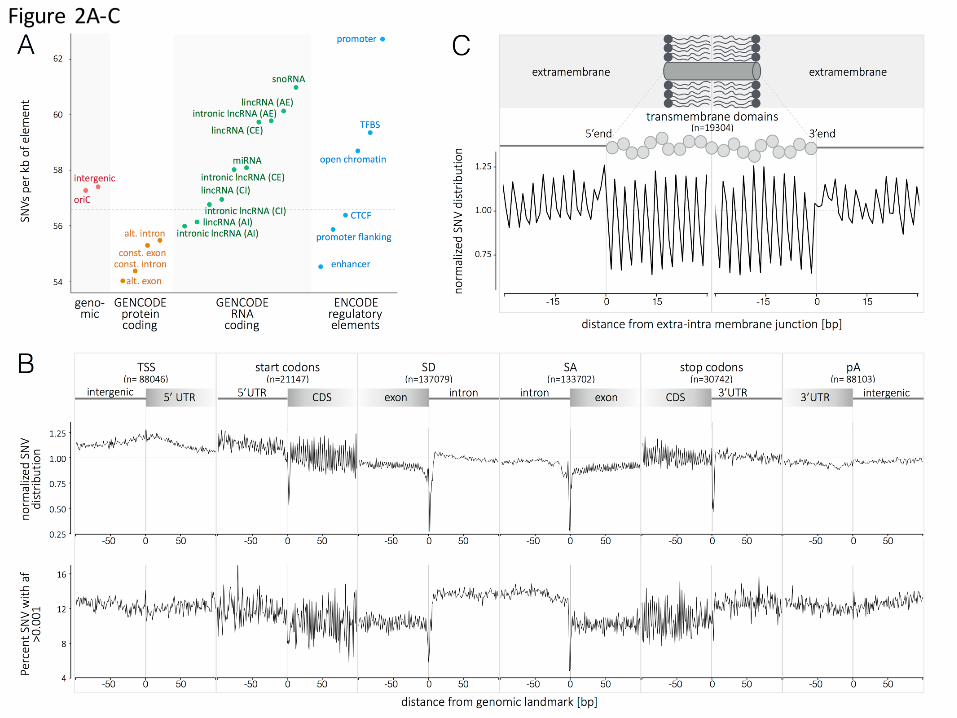
Figure 2Figure 2A-‐C
.CC-BY-ND 4.0 International licensepeer-reviewed) is the author/funder. It is made available under aThe copyright holder for this preprint (which was not. http://dx.doi.org/10.1101/061663doi: bioRxiv preprint first posted online Jul. 1, 2016;

Figure 2D-‐E
.CC-BY-ND 4.0 International licensepeer-reviewed) is the author/funder. It is made available under aThe copyright holder for this preprint (which was not. http://dx.doi.org/10.1101/061663doi: bioRxiv preprint first posted online Jul. 1, 2016;

Figure 3
.CC-BY-ND 4.0 International licensepeer-reviewed) is the author/funder. It is made available under aThe copyright holder for this preprint (which was not. http://dx.doi.org/10.1101/061663doi: bioRxiv preprint first posted online Jul. 1, 2016;

Figure 4
A B
C
.CC-BY-ND 4.0 International licensepeer-reviewed) is the author/funder. It is made available under aThe copyright holder for this preprint (which was not. http://dx.doi.org/10.1101/061663doi: bioRxiv preprint first posted online Jul. 1, 2016;