deep sea drilling project initial reports volume 76 · in an investigation of gas hydrates in deep...
TRANSCRIPT
8. MOLECULAR AND ISOTOPIC COMPOSITIONS OF HYDROCARBONS AT SITE 533,DEEP SEA DRILLING PROJECT LEG 761
James M. Brooks, Leo A. Barnard, Denis A. Wiesenburg,2 and Mahlon C. Kennicutt II, Department ofOceanography, Texas A&M University, College Station, Texas
andKeith A. Kvenvolden, U.S. Geological Survey, MS 99, Menlo Park, California
ABSTRACT
In an investigation of gas hydrates in deep ocean sediments, gas samples from Deep Sea Drilling Project Site 533 onthe Blake Outer Ridge in the northwest Atlantic were obtained for molecular and isotopic analyses. Gas samples werecollected from the first successful deployment of a pressure core barrel (PCB) in a hydrate region. The pressure declinecurves from two of the four PCB retrievals at in situ pressures suggested the presence of small amounts of gas hydrates.Compositional and isotopic measurements of gases from several points along the pressure decline curve indicated that(1) biogenic methane (δ13C = -68‰; CJ/CJ = 5000) was the dominant gas (>90%); (2) little fractionation in the C,/C2 ratio or the C carbon isotopic composition occurred as gas hydrates decomposed during pressure decline experi-ments; (3) the percent of C3, i-C4, and CO2 degassed increased as the pressure declined, indicating that these moleculesmay help stabilize the hydrate structure; (4) excess nitrogen was present during initial degassing; and (5) Cj/Q ratiosand isotopic ratios of C gases were similar to those obtained from conventional core sampling. The PCB gas also con-tained trace amounts of saturated, acyclic, cyclic, and aromatic C5-C14 hydrocarbons, as well as alkenes andtetrahydrothiophenes. Gas from a decomposed specimen of gas hydrate had similar molecular and isotopic ratios to thePCB gas (δ13C of -68% for methane and a q / Q ratio of -6000). Regular trends in the δ13C of methane( 95 60%) and C{/C2 ratios (-25000 — 2000) were observed with depth. Capillary gas chromatography (GC)and total scanning fluorescence measurements of extracted organic material were characteristic of hydrocarbonsdominated by a marine source, though significant amounts of perylene were also present.
INTRODUCTION
Hydrocarbons in marine sediments originate fromeither biogenic or thermogenic processes. Biological sys-tems produce a wide variety of natural hydrocarbons—for example, large quantities of methane (Q) producedby anaerobic bacteria and trace quantities of nonvolatilehydrocarbons (i.e., Λ-C1 5, «-C17, pristane). Thermogen-ic hydrocarbons result from Pyrolytic processes deep inthe sedimentary column. The dominant thermogenic hy-drocarbons are: saturated compounds with straight orbranched (including isoprenoid) cyclic members that con-tain 1 to 50 (or more) carbon atoms; and aromatic com-pounds that contain 1 to 4 (or more) rings. In additionto hydrocarbons, anaerobic decomposition reactions me-diated by denitrifying, iron-oxide reducing, sulfate re-ducing, and methanogenic bacteria in marine sedimentsresult in the production of N2, NH3, HS~, CO2, HCOf,and other related compounds. Most of these terminaldecomposition products are commonly observed as gasexpansion pockets in DSDP cores of reducing sedimentswith high organic content (Edgar et al., 1973; Hunt,1975; Bolli, Ryan, et al., 1978; Whelan and Hunt, 1978;Whelan, 1979; Whelan and Sato, 1980).
Differentiation between biogenic and thermogenic hy-drocarbons is important in understanding petroleum
1 Sheridan, R. E., Gradstein, F. M., et al., Init. Repts. DSDP, 76: Washington (U.S.Govt. Printing Office).
2 Present address (Wiesenburg): Biological and Chemical Oceanography Branch, NavalOcean Research and Development Activity, NSTL Station, Mississippi.
formation, migration, and the origin of gases in subsur-face sediments. A number of parameters have been sug-gested for differentiating hydrocarbon sources. Gaseoushydrocarbons of thermogenic origin generally containsignificant concentrations of C2-C4 saturates. However,several investigators have suggested that the smallamounts of ethane (C2) and possibly propane (C3) thatgenerally accompany both biogenic and thermogenicmethane may also be produced biologically (Whelanand Sato, 1979; Bernard et al., 1978; Oremland, 1981).Thermogenic hydrocarbons generally have CV(C2 +C3) ratios <50, whereas biogenic hydrocarbons haveCj/<Q> + C3) ratios > 1000 (Bernard et al., 1977, 1978;Brooks et al., 1979). Gases also can be characterized bytheir carbon isotopic composition (Bernard et al., 1977).The production of volatile hydrocarbons (C5-C15) bybiological processes is only speculative (Schwarzenbachet al., 1979; Sauer and Sackett, 1980). However, Whe-lan and Hunt (1978, 1980) and Whelan (1979) have iden-tified a number of volatile alkanes, alkenes, cycloal-kanes, furans, and sulfur-containing compounds of ap-parent biogenic origin in several DSDP cores.
Gas Hydrates
The principal objective of this work was an examina-tion of gas from a region of suspected gas-hydrate oc-currence. Gas hydrates are icelike clathrate structures inwhich gases are occluded within a crystalline water lat-tice under appropriate conditions of high pressure andlow temperature. Hydrates exist in two forms. StructureI gas hydrates have a symmetrical shape and can include
377

J. M. BROOKS ET AL.
small molecules up to the size of C2. Structure II hy-drates are slightly larger and have the ability to accom-modate not only Q and C2, but also C3 and isobutane(i-C4) (Davidson et al., 1978). Molecules as large orlarger than n -butane (Λ-C4) cannot be included in eitherlattice type (Hitchon, 1974). The stability regions forgas hydrates in marine sediments are generally found inshelf regions with water depths greater than about 500m and bottom-water temperatures near 0°C. Althougha wide range of molecules (e.g., Q , CO2, N2, O2, H2S,C2 — i-C4 hydrocarbons) can form gas hydrates, Q andpossibly CO2 are the only gases found in sufficientquantities to form gas hydrates in deep-sea sediments.Under the appropriate conditions (T, P) for hydratestability, gas concentrations have to exceed solubilitylevels at the in situ temperature and pressure beforehydrates can form. Therefore, hydrates are only foundin regions where there is significant biogenic methaneproduction or where there is migration of thermogenicgases from deeper horizons. Thermogenic gases do notform hydrates at their site of production because thezone of hydrate stability is well above the temperaturesnecessary for their formation.
The presence of gas hydrates has been suspected inmarine sediments for many years because laboratorystudies have indicated that hydrates are stable at theconditions present along most of the continental slope,and because of the existence in some sediments of a bot-tom-simulating reflector (BSR). A BSR is an anomalousacoustic reflector that approximately parallels the bot-tom topography cutting across bedding planes and deep-ening with increasing water depth (Shipley et al., 1979).The BSR is thought to represent the lower boundary ofgas hydrate stability, below which gas hydrates decom-pose due to increasing temperature with depth. The tran-sition across the hydrated/nonhydrated interface wouldcause a sharp velocity gradient that could produce theBSR observed in seismic records. Kvenvolden and Mc-Menamin (1980) and Kvenvolden and Barnard (in press)have summarized the inferred occurrence of gas hy-drates in marine sediments. Gas hydrates appear to becommon in the continental margins of all the world'soceans. However, gas hydrates were directly observed inmarine sediments only by Yefremova and Zhizhchenko(1974) in shallow cores (< 10 m) of the Black Sea, andby Moore, Watkins, et al. (1979) and von Huene, Au-bouin, et al. (1980) during coring on DSDP Legs 66 and67 in the Middle America Trench off Mexico and Guate-mala.
Kvenvolden and Barnard (this volume) present geo-physical and geochemical evidence for gas hydrates inthe Blake Outer Ridge. Seismic evidence (based on thepresence of a BSR) indicates that gas hydrates are wide-spread on the Blake Outer Ridge (Dillon et al., 1980;Markl et al., 1970; Shipley et al., 1979). DSDP Site 533on the Blake Outer Ridge has a well-developed BSR andthus offered a high probability of successful gas-hydratesampling. Previous drilling in this region on Leg 11found sediments with high gas concentrations (DSDPSites 102, 103, 104) capable of extruding the cores fromthe liners, although no obvious solid gas hydrates were
observed. Nevertheless, Ewing and Hollister (1972) andLancelot and Ewing (1972) postulated the presence ofgas hydrates in these sediments. Thus Site 533 provideda unique research opportunity for the study of gas hy-drates in marine sediments.
The principal tool for this study was the pressure corebarrel (PCB) designed and developed by DSDP to re-trieve sediment cores at in situ pressures, with the goalbeing the capture of intact gas hydrates. This device isespecially useful in sampling gas hydrates, because therestricted pressure-temperature stability field of thesestructures (Kvenvolden and McMenamin, 1980) requiresrecovery of the sediments at nearly in situ conditions. Aprototype PCB had been deployed unsuccessfully twicepreviously on Leg 44, Site 388, in an attempt to demon-strate the presence of gas hydrates in marine sediments(Kvenvolden et al., this volume). The Leg 76 work rep-resents the first successful study of gas hydrates recov-ered using the PCB.
The main objective of this work was to characterizethe gas distribution from the surface down the sedimentcolumn into a hydrate zone in order to:
1) verify conclusively the presence and nature of gashydrates;
2) determine the gas sources for the natural gas hy-drates as either biogenic or thermogenic;
3) determine if gases in the gas hydrate originate insitu or are upwardly migrating gases;
4) explore the conditions necessary and responsiblefor gas hydrate formation in deep ocean sediments; and
5) study the extent to which other gases, especiallynitrogen and carbon dioxide, are present in natural gashydrates.
EXPERIMENTAL METHODS
Sampling
Samples of gas from Site 533 were obtained from (1) the PCB, (2)a discrete sample of gas hydrate recovered from sediment, and (3)canned samples. Gas samples were extracted from the PCB through ahigh-pressure manifold with a regulator designed to attach directly tothe sampling port of the PCB (Fig. 1). Samples were collected duringpressure decline experiments in high-pressure, stainless-steel cyclin-ders. Additional aliquots were transferred from the cyclinders into~250-ml evacuated aluminum samplers. All containers were eitherflushed with sample gas or evacuated before sampling. A detaileddescription of the PCB is found in Kvenvolden et al. (this volume).Samples from the discrete gas hydrate sample were collected from aspecially fabricated sampling "bomb" (for details see Kvenvolden andBarnard, this volume). Canned sediment samples for headspace analy-sis were collected and processed by methods described previously (Ber-nard et al., 1978). Briefly, the technique involves sealing a ~5-cm-long core section of wet sediment in a 0.5-1 glass container holding125-ml of sodium-azide-poisoned, hydrocarbon-free seawater. Theheadspace was then flushed with helium through septa in the containertop. The container was inverted, frozen, and returned to the labora-tory for analysis.
Gas MeasurementsLight hydrocarbons (Cj-C5) were determined using flame ioniza-
tion gas chromatography (GC-FID, Hewlett-Packard 5710) with a3-m, 1.5-mm-I.D. Porapak Q column at 70°C (Brooks et al., 1981).CO2 was determined with an O.I. Corporation Total Carbon Systemthat measures the CO2 using a nondispersive infrared analyzer or byGC-TCD (Carle Model 8000) techniques with a Porapak Q column.Fixed gases (nitrogen, oxygen, and argon) were separated using a mo-lecular seive column and determined using a Hewlett-Packard 583OA
378

MOLECULAR AND ISOTOPIC COMPOSITIONS OF SITE 533 HYDROCARBONS
Figure 1. Manifold including high-pressure regulator, gauge, valves, and sampling cyclinders used to sample the PCB.
gas chromatograph equipped with a thermal conductivity detector(Wiesenburg, in press). An activated charcoal trap was used in theanalysis stream to remove oxygen so that oxygen could be measuredby the difference between Ar + O2 and Ar only. Methane sampleswere prepared for carbon isotope analysis by combustion of severalmilliliters of methane to carbon dioxide at 800° C. Isotopic valueswere determined using a dual collecting Nuclide Isotope Ratio MassSpectrometer (Sackett et al., 1970).
Volatile Organic Compounds
Volatile organic compounds (C5-C15) were analyzed by venting aknown amount of gas contained in stainless steel cyclinders underpressure through a 0.5-cm I.D. × 15-cm column of solid polyphenylether absorbent (Tenax-GC) at a flow of 120 ml/min. Tenax-GC hasexcellent retention characteristics for liquid hydrocarbons, retainsvery little water, and exhibits negligible column bleed at temperaturesunder 300°C (Butler and Burke, 1976). The volatile componentstrapped on the Tenax-GC were desorbed by heating (250 °C) with anon-line heating unit (Sauer, 1978). The components were transferredby helium flow to a liquid-nitrogen-cooled trap for sample consolida-tion (Fig. 2). This trap is attached to a 6-port sample valve that can beisolated and then heated in order to transfer the trapped hydrocarbons(using the GC carrier stream) onto a gas chromatographic column for
sample separation and analysis. The separating column was a 0.3-cmx 305-cm stainless steel chromatographic column packed with 10%SP-2100 on 80/100 Supelcoport, temperature programmed from 50°to 180°C. The eluted organic compounds were analyzed with a Hew-lett-Packard 583OA gas chromatograph using a flame ionization de-tector and with a Hewlett-Packard 5992 guadrapole gas chromato-graph-mass spectrometer (GC-MS) using a jet separator. Mass spec-tra were recorded at a rate of 1/2.25 s from 33 to 250 amu with anelectron ionization source voltage of 1600 volts. Each spectrum wasrecorded using a Hewlett-Packard 9885 M/S flexible disk data system.Total ion chromatograms and selected ion monitoring was utilized.Mass spectra identifications were assisted by Heller and Milne (1978),the NIH-EPA-MSDC Mass Spectral Search System, the Eight PeakIndex, and periodical literature.
Sediment Analysis
Canned sediment samples for headspace analysis were measuredafter the methods of Bernard et al. (1978). Briefly the glass containerswere thawed, and the gases dissolved in the interstitial water wereequilibrated with the helium gas phase of the headspace by agitationon a high-speed shaker. The headspace was then sampled and ana-lyzed by syringe withdrawal of a 1-ml aliquot. If concentrations weretoo low, the entire headspace was purged and trapped using the flow
379

J. M. BROOKS ET AL.
system shown in Figure 3. A flame ionization detector (HP 5710AGC) was used in conjunction with an electronic integrator (HP 3380)for the analysis of hydrocarbon concentrations. Carbon isotope ra-tios, sediment percentages of inorganic and organic carbon, and meth-ane in interstitial water were determined following the method ofSackett et al. (1970).
Vent
Sampleconsolidationtrap
Figure 2. Schematic of the system used to collect and transfer volatileorganic compounds to the gas chromatograph. (LN2 = liquid ni-trogen, IP = injection port, GC = gas chromatograph, GC/MS= gas chromatograph/mass spectrometer.)
Flow
For total scanning fluorescence spectra, 10 g of freeze-dried sedi-ment were Soxhlet extracted for 12 hr. with hexane (Burdick & Jack-son Laboratories, Inc; Spectrometry Nanograde), rotoevaporated to10 ml, and stored in organic-free vials with Teflon lids. A Perkin-Elmer 650-40 Fluorometer with Perkin-Elmer 3600 Data Station wasused to obtain 3-dimensional plots of emission, excitation, and in-tensity. The emission spectrum was obtained by scanning the emissionmonochromator at a fixed excitation wavelength, and the excitationspectrum was acquired by monitoring a fixed emission wavelength andscanning the excitation monochromator. The total fluorescence exci-tation wavelength-emission wavelength array was filled for each sam-ple by sequential stepping of the excitation monochromator and scan-ning the emission monochromator over the wavelength range of inter-est. Intensity data were acquired during each emission scan at presetwavelength intervals. After acquisition and storage, the data weretransformed via a three-dimensional rotation and hidden line correc-tion routine. After transformation, a high resolution Perkin Elmergraphics package was used to generate a plot. Capillary gas chroma-tography of the hexane extracts was performed using a Hewlett-Pack-ard 5880 GC (flame ionization detector) with a 50-m fused silica col-umn programmed from 80° — 280 °C at 6°C/min.
RESULTS AND DISCUSSION
The high probability of gas hydrates at Site 533 led tothe drilling of two holes at this site. Hole 533 was con-tinuously cored to 168 m sub-bottom using a hydraulicpiston core. Hole 533A was rotary cored from 143 to399 m. Gas samples for subsequent molecular and iso-topic analysis were obtained from the PCB, a discretehydrate sample, and canned sediment samples.
Pressure Core Barrel (PCB)
The PCB at Site 533 was used to obtain sedimentsamples at in situ pressures. It was deployed five timesin 3184 m of water at sediment depths between 152 and392 m where gas hydrates were suspected. Hole penetra-tion was limited to 400 m because of constraints againstpenetrating the base of the zone of hydrate stability,which is indicated by the BSR. Table 1 summarizes thePCB samplings that are detailed by Kvenvolden et al.(this volume). Three of the cores (PCB-1, PCB-3, andPCB-5) were retrieved on deck at in situ pressures (aver-age 30 million Pascals, MPa), whereas PCB-4 was re-trieved with only 10.3 MPa pressure, possibly becauseof a temporarily jammed pressure relief valve. PCB-1contained a slurry of drilling fluids and cuttings ratherthan a sediment core and was degassed, but no sampleswere collected for further study. PCB-2 closed correctlybut failed to retain in situ pressure because of a missingplug. PCB-3 and PCB-5 functioned properly, and gassamples were withdrawn at timed intervals. PCB-4 also
Table 1. Results from pressure core barrel sampling at Site 533, DSDPLeg 76.
Figure 3. Schematic of the system used for analysis of sediment lighthydrocarbons (Bernard et al., 1978). (FID = flame ionization de-tector; letters in circles are valve designators.)
PCBNo.
PCP-1PCB-2PCB-3PCB-4PCB-5
Sedimentdepth
(m)
152247333361392
Amountcored(m)
2.51.6a
6.16.16.2
Pressure(MPa)
27.50
32.310.330.2
Cl/C 2
(avg.)
n.d.n.d.560052004100
PCBδ 1 3 C !(avg.)
n.d.n.d.-66-64-69
Sedimentδ 1 3 C !(avg.)
-72-68-64-64-66
Note: n.d. indicates not determined.a Unpressurized core.
380

MOLECULAR AND ISOTOPIC COMPOSITIONS OF SITE 533 HYDROCARBONS
contained gas and was degassed into one cyclinder, im-mediately vented, opened, and inspected for the pres-ence of gas hydrate solids. None were found.
Degassing experiments were conducted with PCB-1,PCB-3, and PCB-5, although no gas samples were ob-tained from PCB-1. The degassing experiments forPCB-3 and PCB-5 are depicted in Figure 4. The pressurerelief curves obtained from the PCBs comprised up to 3distinct intervals: (1) initial hydrostatic pressure loss; (2)gas hydrate decomposition; and (3) sediment degassing.Without a sediment-filled core in the PCB, the hydro-static pressure drop upon initial venting should be theonly pressure change observed, assuming only free gas ispresent. However, because the sediment within the PCBrestricts free movement of gas in the core, a stepwise,sawtooth pattern was observed (e.g., PCB-3) as the corewas vented, the vent was closed, and free gas increasedthe pressure again as it migrated through the core to-ward the sampling port. However, if hydrates are pres-ent in a core, Hunt (1979) suggested that interval pres-sure could be maintained as gas is intermittently vented,with the hydrates decomposing to maintain the internalpressure. This sawtooth pattern appeared in PCB-5(Fig. 4) when the PCB pressure exhibited a plateau at~ 1 MPa during about 2 hr. of intermittent degassing.Although not conclusive, the plateaus observed in bothPCB-1 and PCB-5 (see Kvenvolden et al., this volume),along with visual observation of gas hydrates elsewhere,suggest the presence of small amounts of hydrates inthese cores. The PCB-3 degassing curve (Fig. 4), wheregas pressures never rebuilt to previous levels after de-gassing, may be indicative of a nonhydrate degassingcurve. After all hydrates have decomposed, the pressure
in the core rapidly falls as the sediments degas (Fig. 4,PCB-5).
Sampling times during degassing experiments are in-dicated on Figure 4. The released portions of these gassamples were analyzed at sea by gas chromatography,and the remaining gas was stored for detailed shore-based studies of molecular and isotopic compositions.Only PCB-5 was degassed at two temperatures (15° and25°C measured at a port at the upper end of the PCB).In both PCB-3 and PCB-5, pressures increased after eachsample was collected. Q was the dominant constituentvented from the PCB (Table 2), composing 76 to 96% ofthe gas mixtures from PCB-3 and over 95% of the gasfrom PCB-5. C2 concentrations were three orders ofmagnitude lower than methane. The Q/C2 ratios (Table2) gave no indication of molecular fractionation of thesegaseous hydrocarbons during pressure-decline sampling.The Q/C2 ratios compared favorably with ratios in gaspockets from the surrounding cores (Site 533 report, thisvolume). Carbon isotopic composition of the evolvedQ from both PCB-3 and PCB-5 (Table 2) did notchange significantly during the four-hr. degassing peri-od, and the δ13C values for Q in the PCB gases werefound to be quite similar to the isotopic composition ofC t collected from gas expansion cracks (Galimov andKvenvolden, this volume) in the conventional rotarycores. Also, no isotopic differences were noted betweenPCB and canned headspace gas samples or the discretesample of gas hydrate.
Comparison of phase diagrams for various gas hy-drates reveals interesting relationships (Fig. 5). Pure N2-or CO2-hydrates are not likely to form initially underthe conditions prevailing in Site 533 sediments where Q
50
10
0.5
0.1
— Bath at 0° C
1,2,3,4
PCB-3(Core 533A-23)
5,6,7,8
Bath at 27.7° C
14,15
1 2
Time (hr.)
r- Bath at 0°C
1
-
.β-^k- —« ^ - *r• •— 1 - ^ - —
Bath at 26.7° C-^
PCB-5(Core 533A-29)
rBath at 28.8° C
"1^Bathat28.6°C
6,7,8Freon cyl. 1
1\
L B 2LB 1*tL B 3L B 4L B 5
L B 6
Opened PCB—
1 , 1
πJ12 3
Time (hr.)
Figure 4.tified
Pressure release curves from PCB-3 and PCB-5. (Pressure measurements and sampling locations are iden-Designators represent samples.)
381
J. M. BROOKS ET AL.
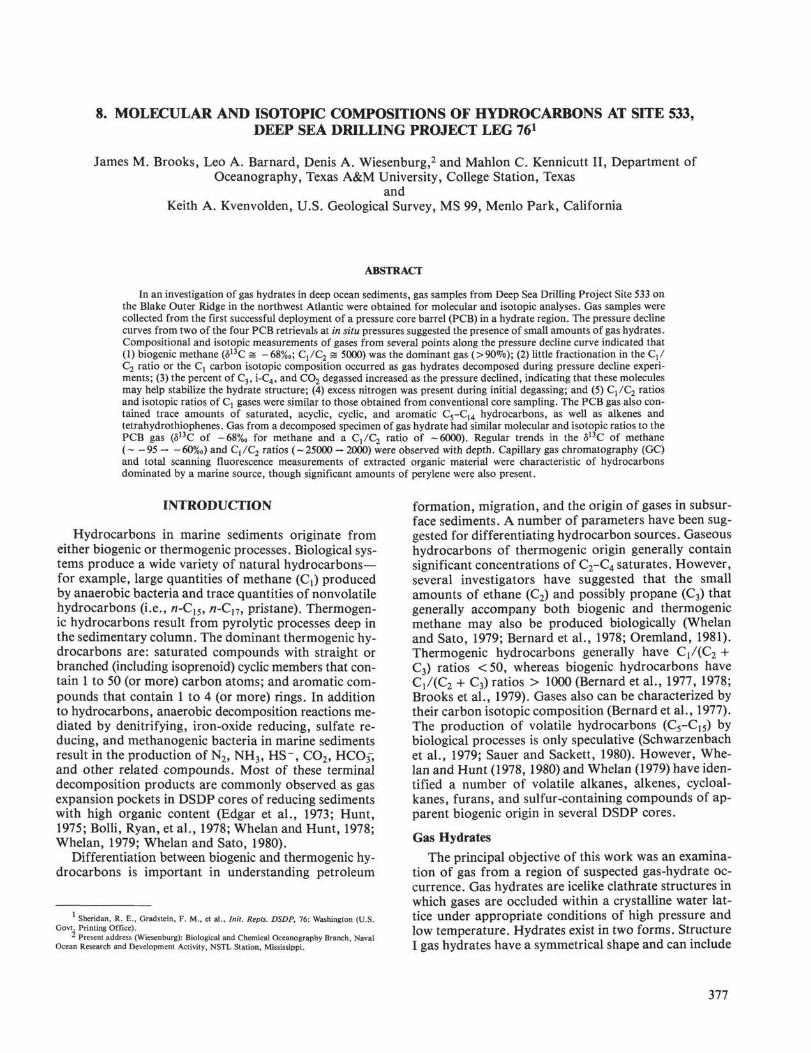
Table 2. Molecular and isotopic compositions of gas recovered from the pressurized core bar-rel, Hole 533A.
Core-section
3-3
26-5
29-5
PCBno.
3
4
5
Aliquot
1-1
1
34567s9
101112131415
1
123456789
Freon 1LB-1LB-2LB-3LB-4LB-5LB-6
Methane
w76.0
78.0
—
————
96.194.590.290.4
7.6
_94.1_—_
—97.096.196.9_
93.9—
93.8
δ 1 3 C !
-
-62.2
-69.3-71.2
-70.9-70.4-62.0-68.4-68.5-66.5
_-68.3
-63.8
-69.2-68.1-68.6-69.7-67.5-68.3-70.6-68.3-68.5-69.7-67.7-67.1-66.7-69.7-68.3-68.5
Ethane(ppm)
10.2
z8.7
—
—_—_
171143179181
13.4
_234
——__—
242236237
_230
——
223
Propane(ppm)
4.2
z1.2
—
—__—
589.79.78.5
0.7
_6.1_—___8.0
11.912.5
15.7—
18.5
i-butane(ppm)
1.8
—0.8
—
———_1.91.53.04.5
0.2
—1.5—————1.62.54.0—4.5——5.5
rt-butane(ppm)
0.5
0.5
—
———_0.70.50.61.0
0.2
—0.6—————0.71.51.6—2.0——2.4
Cl/C 2
7440
—9040
—
————
5620662050305000
5670
_
—4020
—————
401040604090
—4080
——
4200
co2
-
—0.10
—
————
0.930.425.044.72
-
_
—0.16—————
0.471.77——
1.94——
2.35
N 2
(ml/1)
-
——
—
————_——
—
-
1359177—3.53.44.0
—5.9
——————3.4
Note: — indicates no data available.
103
: i
Ice + hydrate
Ice + gas
r Water + \hydrate \
/ \/ \Water + gas J{
i/I 0 2
I0 1 -
10°-90 -80 -70 -60 -50 -40 -30 -20 -10 0 10 20 30 40
Temperature ( ° C )
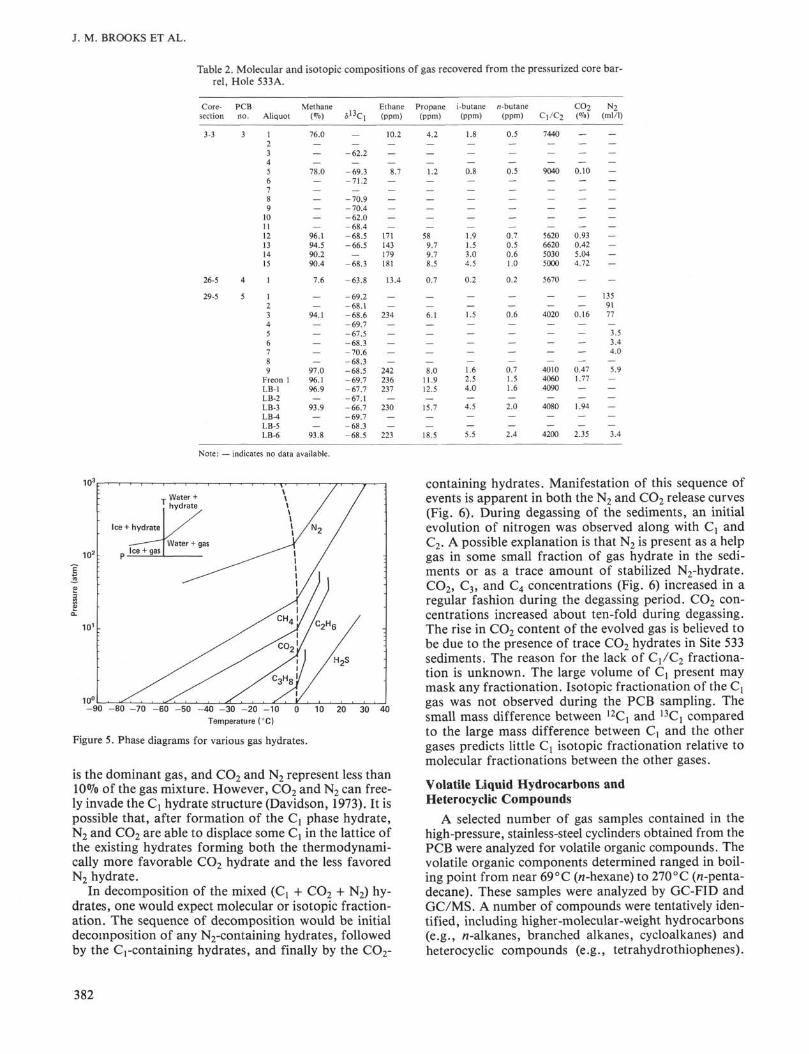
Figure 5. Phase diagrams for various gas hydrates.
is the dominant gas, and CO2 and N2 represent less than10% of the gas mixture. However, CO2 and N2 can free-ly invade the Cx hydrate structure (Davidson, 1973). It ispossible that, after formation of the Q phase hydrate,N2 and CO2 are able to displace some Q in the lattice ofthe existing hydrates forming both the thermodynami-cally more favorable CO2 hydrate and the less favoredN2 hydrate.
In decomposition of the mixed (C + CO2 + N2) hy-drates, one would expect molecular or isotopic fraction-ation. The sequence of decomposition would be initialdecomposition of any N2-containing hydrates, followedby the Q-containing hydrates, and finally by the CO2-
containing hydrates. Manifestation of this sequence ofevents is apparent in both the N2 and CO2 release curves(Fig. 6). During degassing of the sediments, an initialevolution of nitrogen was observed along with Q andC2. A possible explanation is that N2 is present as a helpgas in some small fraction of gas hydrate in the sedi-ments or as a trace amount of stabilized N2-hydrate.CO2, C3, and C4 concentrations (Fig. 6) increased in aregular fashion during the degassing period. CO2 con-centrations increased about ten-fold during degassing.The rise in CO2 content of the evolved gas is believed tobe due to the presence of trace CO2 hydrates in Site 533sediments. The reason for the lack of C /C2 fractiona-tion is unknown. The large volume of C present maymask any fractionation. Isotopic fractionation of the Qgas was not observed during the PCB sampling. Thesmall mass difference between 1 2 Q and UCX comparedto the large mass difference between C and the othergases predicts little C isotopic fractionation relative tomolecular fractionations between the other gases.
Volatile Liquid Hydrocarbons andHeterocyclic Compounds
A selected number of gas samples contained in thehigh-pressure, stainless-steel cyclinders obtained from thePCB were analyzed for volatile organic compounds. Thevolatile organic components determined ranged in boil-ing point from near 69 °C (rc-hexane) to 270 °C (n-penta-decane). These samples were analyzed by GC-FID andGC/MS. A number of compounds were tentatively iden-tified, including higher-molecular-weight hydrocarbons(e.g., n-alkanes, branched alkanes, cycloalkanes) andheterocyclic compounds (e.g., tetrahydrothiophenes).
382

MOLECULAR AND ISOTOPIC COMPOSITIONS OF SITE 533 HYDROCARBONS
100
50
2 -
1 -
Excess nitrogen
Carbon dioxide
I IIJI
20
1 0 -
S 5
Propane
1
i + n-butane
1 2 3 4 5 6 7 8 9 10 11 12 13 14 15
Sample numbers
1 2 3 4 5 6 7 8 9 10 11 12 13 14 15
Sample numbers
Figure 6. Composition of gas samples from Section 533A-29-5 (PCB-5) from sequential sampling during the pres-sure decline experiment.
Compounds identified are summarized in Table 3. Simi-lar compounds have been reported at a number of DSDPsites (Edgar et al., 1973; Bolli et al., 1978; Hunt andWhelan, 1978; Whelan, 1979; Whelan and Sato, 1980).
The origin of C5-C15 compounds in DSDP derivedgases has been an enigma. Generally there is neither suf-ficient temperature nor pressure to abiogenically pro-duce these compounds in situ. These compounds oftenaccompany what appears to be biogenic methane andhave thus been associated with biological activity (Whe-lan and Sato, 1980; Hunt and Whelan, 1978; Whelan,1979; Claypool, 1975; Whelan et al., 1980). Low-tem-perature chemical processes have also been hypothe-sized. A number of compounds in the C5-C15 rangewere detected in this study. A complete suite of n-al-kanes (C5-C15), branched alkanes, aromatics (benzene,toluene), and cycloalkanes (cyclopentane, cyclohexane,etc.) that were detected would infer a thermogenicsource. A deeper thermogenic origin requires a move-ment up the sediment column from a deeper source.Whelan and Sato (1980) argue against this possibilitydue to the abrupt changes seen in the total concentra-tions and ratios of individual compounds. It has alsobeen suggested that light hydrocarbon movement in fine-grained sediments is minimal when small amounts ofhydrocarbons are present at relatively shallow depth(Young and Mclver, 1977). The needed quantitative dataare not available in this present study to resolve theproblem of the source of these compounds. It should benoted, however, that in general the concentrations ofthese compounds are very low and that the amount ofthermogenic Q hypothetically associated with these high-er-molecular-weight organic compounds may not be suf-ficient to significantly shift the isotopic composition ofthe biogenically produced C .
The compounds identified in Table 3 have been previ-ously detected at other DSDP sites with a few exceptions(e.g., tetrahydrothiophenes). Normal alkanes in therange from pentane to pentadecane were detected. Gen-erally only alkanes up to heptane have been previouslyreported. A number of branched alkanes were detectedincluding methyl and dimethyl pentanes and higher-mo-lecular-weight analogues. A few alkenes were tentativelyidentified, including a possible cyclohexene and a di-methyl heptene. The aromatic compounds were general-ly dominated by benzene and toluene. Whelan and Hunt(1980) consistently observed toluene as a major compo-nent in recent organic-matter-rich sediments and haveshown that anaerobic bacteria can produce toluene fromcarotene. They conclude that toluene may have a bacte-rial source in some surface sediments.
The two heterocyclic compounds identified in thisstudy have not, to our knowledge, been previously de-tected. Methyl and dimethyl tetrahydrothiophene weretentatively identified (Fig. 7) from our cyclinder gassamples from PCB-5. Whelan and Hunt (1980) havepreviously identified the unsaturated analogues of themono-methyl compounds (thiophenes). The presence ofthiophenes in ancient sediments and petroleum is welldocumented. The source and significance of these satu-rated analogues in these samples is unknown at thistime.
Hydrate Sample
Although gas pockets were common in core sectionsdeeper than 50 m, and some frothing was present in afew core sections deeper than 152 m, most of the hemi-pelagic sediments throughout the section remained semi-consolidated. The only visual evidence of gas hydrateswas a single sample from 238 m sub-bottom depth in a
383

J. M. BROOKS ET AL.
Table 3. Volatile organic compounds identified ingas samples at Site 533.
Retentiontime
(min.) Tentative identification
Section 533-29-5, PCB-5 (cylinder freon 1/650 ml of gas)
1.2
1.31.82.03.13.43.84.54.65.55.66.28.1
12.015.5
16.519.327.332.1
Branched alkane (2-methylpropane)Butene or butaneIsopentanePentaneBranched alkane (2-methylpentane or dimethylbutane)3-methylpentane (tentative)HexaneAlkane, branchedMethylcyclopentaneBenzenetrace cyclohexaneDimethylpentaneAlkane, n-Cη (mixture)TolueneBranched Alkane, n-C%+ (1-methyl 3-ethyl, cyclopentane
or dimethylheptane)Branched alkane (ethylheptane?)3,3,5 trimethylcylohexaneMixture, n-Cjon-alkane (n-Cji)
Section 533-29-5, PCB-5 (~ 1 1 of gas)
0.31.61.72.12.32.53.03.33.63.94.75.28.39.4
10.514.117.118.019.920.722.323.6
ButaneIsopentanePentaneMethylpentaneHexaneMethylcyclopentaneBenzeneDimethylcyclopentane (tentative)HeptaneMethylcyclohexaneOctane (tentative)Toluene2-methyltetrahydrothiopheneTrimethylcyclohexeneDimethyltetrahydrothiopheneNonaneDecane
n-Cn
"-Cl 3n-C 1 4
"-Cl 5
Section 533-29-5, PCB-5 (cyclinders 1, 2, 3, 5, 6, 7)
1.92.33.03.64.75.16.67.09.5
10.114.117.118.419.421.122.423.6
MethylpentaneHexaneBenzeneHeptaneUnknown (m/z 81) (methylcyclohexene?)TolueneUnknown (m/z 94; 110)Dimethylheptene (tentative)2-methyltetrahydrothiopheneDimethyltetrahydrothiophene/1-C9"-C10n-Cn
"-C12«-Ci3"-C14"-Cl 5
Section 533-3-3, PCB-3 (~ 100 ml gas)
1.92.42.83.74.8,4.95.15.77.18.08.9
10.011.312.913.514.915.816.819.120.522.423.4
MethylpentaneMethylcyclopentaneCycloalkane? (M.W. 84)DimelthylcyclopentaneToluene + alkaneDimethylcyclohexaneDimethylcyclohexane (tentative)Alkane?Trimethylcyclohexane (tentative)XyleneTrimethylcyclohexaneCycloalkaneCycloalkaneAlkaneMesityleneTetramethylcyclohexane
"-C10"-C12"-Cl3"-C14"-Cl 5
Note: M.W. = molecular weight; m/z = mass to charge ratio.
layer of frothy sediments a few centimeters thick wherelayers of white crystals were observed when the core wassplit. Gas expansion measurements from this sedimentsample gave gas:pore fluid ratios of -20:1, which wereseveral times in excess of the amount of gas that couldbe in solution at the in situ pressure and temperature(see Kvenvolden and Barnard, this volume, for detailsof fluid ratios). Therefore this sediment sample musthave contained a gas hydrate.
The carbon isotopic value for the methane in this hy-drate sample was -68.0‰, a value similar to that of anearby headspace sample (- 66.9%, Table 4) and a coregas sample (-69%, Galimov and Kvenvolden, this vol-ume). Molecular analysis on board indicated that Qand CO2 composed 36 and 0.5% of the gas, respective-ly. The C2, C3, and i-C4 composed 123, 2, and 2 ppm ofthe gas, respectively, whereas «-C4, i-C5, and n-C5 onlycomposed 0.06, 0.15, and 0.13 ppm, respectively. Theremainder of the gas was atmospheric contamination.The distribution of Q-C5 hydrocarbons in the hydratedsample was considerably different from that of the sur-rounding gas pockets and headspace samples. The gas inthese nonhydrate sediments did not show the sharp de-crease in concentrations of molecules larger than i-C4.The apparent exclusion of n-C4, i-C5, and n-C5 is alsoevidence of hydrate, because gases larger than i-C4 donot fit in the cages of either Structure I or II hydrates(Hand et al., 1974). Structure II hydrates must havebeen present in these samples, however. This structurewould account for the presence of amounts of C3 andi-C4 in the gas hydrate sample, because these gases can-not fit into Structure I hydrates. The absence of theabrupt drop-off in the gas concentration between i-C4
and n-C4 observed in gas from vacutainer and head-space samples suggests that the majority of the gas inthe sediment section was not in hydrate form. Gas hy-drate in sediments at Site 533 was apparently finely dis-persed in thin, noncontiguous layers and not in the formof thick, massive hydrate zones that could act as a bar-rier to upward gas migration.
Head-Space Analysis
Twenty-four samples for headspace analysis were ob-tained from Holes 533 and 533A. Table 4 presents theC1/C2 and δ13C! ratios. Q is at least three orders ofmagnitude greater in concentration than C2. Accom-panying the Ci at Site 533 are small but significant con-centrations of higher-molecular-weight hydrocarbongases (C2-C5) that tend to increase in abundance withdepth (see Kvenvolden and Barnard, this volume). The< V Q ratios that average > 10,000 in the top 200 m ofsediment suggest that the gases are the result of biogen-ic processes. Between 200 and 400 m, the CVC2 ratiosdecrease to < 3000, indicating the effect of early dia-genesis or the contribution of thermogenic hydrocar-bons from depth. The headspace Q / Q ratios followthe same trend as the vacutainer samples from gas ex-pansion cracks. However, the ratios are generally a fewthousand lower than the ratios obtained from gas invacutainer samples. This difference could result fromloss or utilization of Q in the jars during storage orpreferential migration of methane from the interstitial
384

MOLECULAR AND ISOTOPIC COMPOSITIONS OF SITE 533 HYDROCARBONS
Spectrum no. 40.021, sample no. 2, retention time = 8.3 min.,scanned from 33 to 250 amu, no. of peaks detected = 109,base peak = 86.85, base peak abundance = 779, total abundance = 3524
LUI I.L.1..L.
2- methyl tetrahydroth i ophene
/ S \ ^
50 100
Lower abundance cutoff level = 20%
Mass Abundance (%)
38.90 23.540.90 25.544.90 29.4
150 200 250m/e ratio
Mass Abundance (%)58.85 41.359.85 14.9
300 350 400
Mass Abundance (%)86.85 100.0
101.95 39.7
Spectrum no.42.021, sample no. 2, retention time = 9.4 min.,scanned from 33 to 250 amu, no. of peaks detected = 1 1 1 ,base peak = 108.90, base peak abundance = 1891, total abundance = 10643
I .1 A L,
3,5,5-tri methyl hcycl ohexene
Me
Me
Me
1 1 1 1 1 •
50Lower abundance cutoff
Mass
38.9040.9066.95
100 150
level = 20%Abundance (%)
29.937.1
65.8
200
m/e ratio
Mass Abundance
67.95 85.980.90 20.9
250
(%)
300
Mass
108.90123.95
350
Abundance (%)
100.036.0
400
Spectrum no.44.021, sample no. 2, retention time = 10.5 min.,scanned from 33 to 250 amu, no. of peaks detected = 115,base peak = 100.95, base peak abundance = 3759, total abundance = 15507
J..JJ il
2,5-di methyl tetrahydrothi ophene
^^
. . . 1 1 . . .50
Lower abundance cutoff
Mass
38.9040.9044.90
• 1 i i i i
100
level = 20%
Abundance {%)
22.725.116.9
I •150
. i i | i . i i
200
m/e ratio
Mass Abundance
58.85 44.466.95 21.173.90 20.9
I •
250
(%)
• i i I i
300
Mass
100.95115.90
i i • l
350
Abundance (%)
100.042.6
400
Figure 7. GC/MS spectra for three compounds tentatively identified in Section 533A-29-5—PCB-5 gas.
water into the expansion cracks of the core liner duringpressure reduction. A plot of the Q/C2 ratios versus theδnC is shown in Figure 8. The figure illustrates the gen-eral shift in both carbon isotopic and molecular ratioswith depth.
Figure 9 shows the shifts in Q isotopic values withdepth throughout the hole. Based on the biogenic-ther-
mogenic model of Bernard et al. (1977), the C through-out the hole is biogenic. However, there is a generaltrend from -97.5‰ near the top of the core toward- 60‰ deeper in the section. At Site 533 there is not thealmost linear trend with depth that Whelan (1979) ob-served at Site 397. The greatest isotopic shift from- 95.5 to 70% occurs in the upper 150 m of the sed-
385
J. M. BROOKS ET AL.
Table 4. Carbon components of Holes 533 and 533A sediments.
Sub-bottomCore- depth
section (m)CaCO3
slip.0 Mnorg.
Org. C3COrg. Ci/C2
Hole 533
1-15-17-29-211-213-216-220-124-128-232-237-141-1
Hole 533A
4-29-411-515-117-619-221-424-526-327-529-3
2.711.420.429.438.447.059.577.591.0
113.5131.5149.5167.6
161.5209.0228.0266.0285.0304.0323.0351.3368.8380.0399.0
1.944.918.333.2
9.522.114.516.321.2
7.235.430.111.4
6.911.417.615.616.613.820.617.621.913.016.2
-0.70.9
-0.90.8
-0.40.00.00.9
-0.1-4.3
1.1-2.6-6.2
-5.02.82.03.82.02.74.31.7
-0.11.51.1
0.32.10.41.30.60.30.50.91.11.00.71.41.4
1.41.12.41.31.91.31.61.31.31.31.2
-22.7n.d.
-23.4-21.6-23.4-23.1-24.9-18.8-22.5-24.1-22.3-21.0-22.3
-21.6-22.7-21.9-21.3-22.3-22.3-22.2-22.1-22.3-22.2-22.7
n.d.n.d.
24,20016,60012,10012,6005,780
19,80010,1006,210
10,1009,9303,390
n.d.4,5505,6306,150
12,7002,1402,1902,7201,6201,2401,570
n.d.-42.2-97.5-94.5-90.5-85.7-85.0-72.2-75.5-74.0-74.1-70.2n.d.
n.d.-65.3-66.9-62.7-64.5-64.0-61.8-62.6-63.1-66.0-64.9
Note: n.d. = not determined.
I I I 1 1 1 I 1 T
Biogenic gas zone
- 4 0 - 5 0 -60) -70) - 8 0 - 9 0 -100
Figure 8. Molecular and isotope ratios of headspace gases plotted afterBernard et al. (1977).
imentary column. Below 150 m there is only a very grad-ual enrichment in 13C with depth. There are several pos-sible explanations for the increase toward heavier iso-topes with depth in the sedimentary column. First, ther-mogenic Q from deeper horizons could be moving upfracture or microfracture pathways. This would dilutethe surface, isotopically light biogenic C with the deep-er-sourced, isotopically heavier, thermogenic C . Ber-nard (1978) has shown that diffusion from deeper ther-mogenic sources in fine-grained sediments cannot be thepathway for upward migration of gas beyond a few tensof meters. Therefore, if the δuC gradient observed is aresult of upward migration from deeper thermogenicgas horizons, the gas has to be migrating by a mecha-
100 -
ε 150 -
E 200 -
250 -
300 -
350 -
4001-100 -90 -80 -70 -60
δ1 3C of methane (%o)
-40
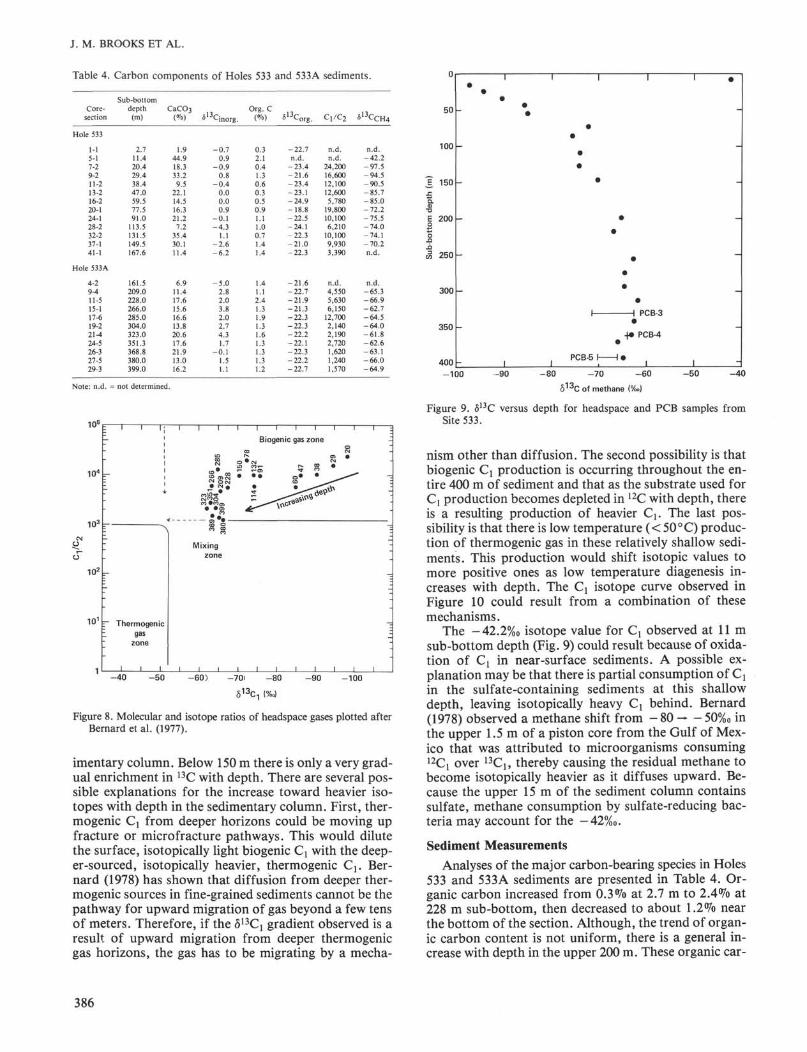
Figure 9. δ 1 3C versus depth for headspace and PCB samples fromSite 533.
nism other than diffusion. The second possibility is thatbiogenic Cj production is occurring throughout the en-tire 400 m of sediment and that as the substrate used forCj production becomes depleted in 12C with depth, thereis a resulting production of heavier Q. The last pos-sibility is that there is low temperature (< 50 °C) produc-tion of thermogenic gas in these relatively shallow sedi-ments. This production would shift isotopic values tomore positive ones as low temperature diagenesis in-creases with depth. The Cj isotope curve observed inFigure 10 could result from a combination of thesemechanisms.
The -42.2% isotope value for C observed at 11 msub-bottom depth (Fig. 9) could result because of oxida-tion of Cj in near-surface sediments. A possible ex-planation may be that there is partial consumption of Cλ
in the sulfate-containing sediments at this shallowdepth, leaving isotopically heavy C{ behind. Bernard(1978) observed a methane shift from - 80 50% inthe upper 1.5 m of a piston core from the Gulf of Mex-ico that was attributed to microorganisms consuming1 2 Q over 1 3C 1 } thereby causing the residual methane tobecome isotopically heavier as it diffuses upward. Be-cause the upper 15 m of the sediment column containssulfate, methane consumption by sulfate-reducing bac-teria may account for the -42%0.
Sediment Measurements
Analyses of the major carbon-bearing species in Holes533 and 533A sediments are presented in Table 4. Or-ganic carbon increased from 0.3% at 2.7 m to 2.4% at228 m sub-bottom, then decreased to about 1.2% nearthe bottom of the section. Although, the trend of organ-ic carbon content is not uniform, there is a general in-crease with depth in the upper 200 m. These organic car-
386

MOLECULAR AND ISOTOPIC COMPOSITIONS OF SITE 533 HYDROCARBONS
-200
275
375
425
525 230
giig^SS^ 430-°" 380
330Excitation
/7-C21
/7-C24
Figure 10. Total scanning fluorescence spectra and gas chromatograms from Section 533-27-5 (340.5m sub-bottom depth). (Intensity maximum of 200 at an emission wavelength of 440 nm and anexcitation wavelength of 434 nm.)
bon values are no doubt the result of a high rate of sedi-mentation in the region, which tends to produce anaero-bic sediments that aid in preserving organic matter. Clay-pool and Trelkeld (this volume) found that sulfate re-duction was complete within the upper 14 m sub-bottom.
The calcium carbonate content of the section wasquite variable (1.9-44.9%). Although the lowest valuewas found at the surface, no discernible trends wererecognizable with depth. Generally δ13C-calcium car-bonate and organic carbon were isotopically lighter inHole 533 in comparison to Hole 533A.
In an attempt to identify further the source of hydro-carbons in Holes 533 and 533A, =5-g aliquots of sedi-ment were Soxhlet extracted for total scanning fluores-cence and GC measurements. In all cases, indications ofaromatic compounds were found similar to di- and tri-methyl naphthalenes and perylene. Typical total scan-ning fluorescence spectra for sedimentary extracts areshown in Figures 10 and 11. The fluorescence patternswere generally of two types. Often only a perylene peakwas evident (Fig. 10). This simple fluorescence pattern
was typical of gas chromatograms exhibiting a strongquintuplet of peaks that eluted in the range of n-C25 to«-C28 The dominant w-alkane was n-C2i or n-C22 Thesecond fluorescence pattern contained a low end fluo-rescence signature in addition to the characteristic pery-lene peaks (Fig. 11). Fluorescence in this area is charac-teristic of naphthalene and alkylated analogues. The gaschromatograms for this type of fluorescence patternshowed a simple alkane distribution, although the quin-tuplet of peaks at A2-C24 to «-C2s is still apparent. Thegas chromatograms throughout the section were consis-tent. The upper 170 m were recovered from a hydraulicpiston core that minimizes sample contamination. Thuscontamination from drilling operations was felt to benegligible.
SUMMARY
Gas hydrates exist in Blake Outer Ridge sedimentsapparently in fine lenses within the semiconsolidatedsediments. The only direct evidence of gas hydrates inthese sediments comes from one specimen from an un-
387

J. M. BROOKS ET AL.
200
400 ^ ^ ^ - ^ : - ^ - - > : . 5 : ^ : ; rEi i i^^ 400450 ^^%- -> f f - - ">^ : ->3 ; ^ " 350
Emission 500 >=<Err- =i>r 300 Excitation550 ^~" 250
600 200
n-C
Figure 11. Total scanning fluorescence spectra and gas chromatograms from Section 533, 13-2(42.9 m sub-bottom depth). (Intensity maximum of 1130 at an emission wavelength of 320nm and an excitation wavelength of 280 nm.)
pressurized core section in which icelike crystals of hy-drates were visually observed and sampled. Molecularcompositions and fluid:gas ratios for the icelike sampleconfirmed that it was a hydrate. Indirect evidence of hy-drates in the sediment column came from two PCB re-trievals in which the pressure decline curve indicated the"sawtooth" pattern characteristic of hydrate decompo-sition. However, much of the gas found in these sedi-ments was apparently not in the hydrate form. Molecu-lar and isotopic ratios of gas samples indicated a bio-genic source for the methane gas. Trace amounts ofhigher-molecular-weight volatile organics were found inthe sedimentary column as well.
ACKNOWLEDGMENTS
We thank the individuals of the Glomar Challenger for their helpduring the sampling procedures. Research support for this study wasprovided by Gas Research Institute Grant 50 81-363-0460 and Officeof Naval Research Grant NO0O14-80-C-0113. This chapter benefitedfrom critical reviews by Drs. William M. Sackett and Thomas Whe-lan, III.
REFERENCES
Bernard, B. B., 1978. Light hydrocarbons in marine sediments [Ph.D.dissert.]. Texas A&M University, College Station, Texas.
Bernard, B. B., Brooks, J. M., and Sackett, W. M., 1977. A geo-chemical model for characterization of hydrocarbon gas sources inmarine sediment. Proc. Offshore Technol. Conf, 2934:435-438.
, 1978. Light hydrocarbons in recent Texas continental shelfand slope sediments. /. Geophys. Res., 83:4053-4061.
Bolli, H. M., Ryan, W. B. F., et al., 1978. Init. Repts. DSDP, 40:Washington (U.S. Govt. Printing Office).
Brooks, J. M., Bernard, B. B., and Sackett, W. M., 1979. Character-ization of gases in marine waters and sediments. In Watterson, J.R., and Theobold, P. K. (Eds.), Geochemical Exploration 1978:Rexdale, Ontario (The Association of Exploration Geochemists),pp. 337-346.
Brooks, J. M., Reid, D. F., and Bernard, B. B., 1981. Methane in theupper water column of the Northwestern Gulf of Mexico. J. Geo-phys. Res., 86:11029-11040.
Butler, L. D., and Burke, M. F., 1976. Chromatographic characteri-zation of porous polymers for use as adsorbents in sampling col-umns. J. Chromatogr. Sci., 14:112-117.
Claypool, G. E., 1975. Manual on Pollution—Prevention and Safety(3rd ed.): JOIDES Journal, November.
388

MOLECULAR AND ISOTOPIC COMPOSITIONS OF SITE 533 HYDROCARBONS
Davidson, D. W., 1973. Clathrate hydrates. In Franks, F. (Ed.),Water, A Comprehensive Treatise, 2, Water in Crystalline Hy-drates, Aqueous Solutions of Simple Nonelectrolytes: New York(Plenum), pp. 115-234.
Davidson, D. W., El-Defrawy, M. K., Fuglem, M. O., and Judge, A.S., 1978. Natural gas hydrates in northern Canada. Proc. Int.Conf. Permafrost 3rd, 1:937-943.
Dillon, W. P., Grow, J. A., and Paull, C. K., 1980. Unconventionalgas hydrate seals may trap gas off southeast U.S. Oil & Gas J., 78(l):124-130.
Edgar, N. T., Saunders, J. B., et al., 1973. Init. Repts. DSDP, 15:Washington (U.S. Govt. Printing Office).
Ewing, J. I., and Hollister, C. H., 1972. Regional aspects of deepsea drilling in the western North Atlantic. In Hollister, C. H., andEwing, J. I., et al., Init. Repts. DSDP, 11: Washington (U.S.Govt. Printing Office), 951-973.
Hand, J. H., Katz, D. L., and Verma, V. K., 1974. Review of gashydrates with implications for ocean sediments. In Kaplan, I. R.(Ed.), Natural Gases in Marine Sediments: New York (Plenum),pp. 179-194.
Heller, S. R., and Milne, G. W. A., 1978. EPA/NIHMass SpectralData Base. Nat. Stand. Ref. Data Ser., Nat. Bureau Stand., 63,Washington (U.S. Govt. Printing Office).
Hitchon, B. 1974. Occurrence of natural gas hydrates in sedimentarybasins. In Kaplan, I. R. (Ed.), Natural Gases in Marine Sediments:New York (Plenum), pp. 195-225.
Hunt, J. M., 1975. Origin of gasoline range alkanes in the deep sea.Nature, 254:411-413.
, 1979. Petroleum Geochemistry and Geology: San Francis-co (W. H. Freeman).
Hunt, J. M., and Whelan, J. K., 1978. Dissolved gases in Black Seasediments. In Ross, D., Neprochnov, Y., et al., Init. Repts. DSDP,42, Pt. 2: Washington (U.S. Govt. Printing Office), 661-666.
Kvenvolden, K. A., and Barnard, L. A., in press. Hydrates of naturalgas in continental margins. Proc. Hedberg Conference: Tulsa(Am. Assoc. Pet. Geol.).
Kvenvolden, K. A., and McMenamin, M. A., 1980. Hydrates of nat-ural gas: a review of their geologic occurrence. U.S. Geol. Surv.Circ, 825:1-11.
Lancelot, Y., and Ewing, J. I., 1972. Correlation of natural gas zona-tion and carbonate diagenesis in tertiary sediments from the north-west Atlantic . In Hollister, C. D., Ewing, J. I., et al., Init. Repts.DSDP, 11: Washington (U.S. Govt. Printing Office), 791-799.
Markl, R. G., Bryan, G. M., and Ewing, J. I., 1970. Structure of theBlake-Bahama Outer Ridge. /. Geophys. Res., 75:4539-4555.
Moore, J. C , Watkins, J. S., and Shipboard Scientific Party, 1979.Middle American Trench. Geotimes, 24(9):20-22.
Oremland, R. S., 1981. Microbial formation of ethane in anoxic estu-arine sediments. Appl. Environ. Microbiol., 42:122-129.
Sackett, W. M., Nakaparksin, S., and Dalrymple, D., 1970. Carbonisotope effects in methane production by thermal cracking. In
Hobson, G. D., Speers, G. C. (Eds.), Advances in Organic Geo-chemistry, 1966: New York (Pergamon Press), pp. 37-53.
Sauer, T. C , Jr., 1978. Volatile liquid hydrocarbons in the marineenvironment [Ph.D. thesis]. Texas A&M University, College Sta-tion.
Sauer, T. C , Jr., and Sackett, W. M., 1980. Gaseous and volatile hy-drocarbons in marine environments with emphasis on the Gulfof Mexico. In Geyer, R. A. (Ed.), Marine Environmental Pollu-tion, I. Hydrocarbons: New York (Elsevier/North-Holland), pp.133-161.
Schwarzenbach, R. P., Bromund, R. H., Gschwend, P. M., andZafiriou, O. C , 1979. Volatile organic compounds in coastal sea-water: preliminary results. J. Org. Geochem., 1:45-61.
Shipley, T. H., Houston, M. H., Buffler, R. T., Shaub, F. J., McMil-lan, K. J., Ladd, J. W., and Worzel, J. L., 1979. Seismic evidencefor widespread possible gas hydrate horizons on continental slopesand rises. Am. Assoc. Pet. Geol. Bull., 63:2204-2213.
von Huene, R., Aubouin, J., and Shipboard Scientific Party, 1980.Leg 67: the Deep Sea Drilling Project Mid-America Trench tran-sect off Guatemal. Geol. Soc. Am. Bull., 91, Pt. 1:421-432.
Whelan, J. K., 1979. Cj-Q Hydrocarbons in Holes 397/397A, Leg47A. In von Rad, U., Ryan, W. B. F., et al., Init. Repts. DSDP,47, Pt. 1: Washington (U.S. Govt. Printing Office), 347-350.
Whelan, J. K., and Hunt, J. M., 1978. Q-Cy hydrocarbons in Holes378A, 38O/38OA and 381. In Ross, D. A. Neprochnov, Y. P., etal., Init. Repts. DSDP, 42, Pt. 2: Washington (U.S. Govt. PrintingOffice), 673-677.
, 1980. Q - Q volatile organic compounds in sediments fromDeep Sea Drilling Project Legs 56 and 57, Japan Trench. In Scien-tific Party, Init. Repts. DSDP, 56, 57, Pt. 2: Washington (U.S.Govt. Printing Office), 1349-1354.
Whelan, J. K., and Sato, S., 1980. Q - Q hydrocarbons from core gaspockets, Deep Sea Drilling Project Legs 56 and 57, Japan Trenchtransect. In Scientific Party, Init. Repts. DSDP, 56, 57, Pt. 2:Washington (U.S. Govt. Printing Office), 1335-1347.
Wiesenburg, D. A., in press. Determination of argon, oxygen, andnitrogen using activated charcoal. Anal. Chem.
Yefremova, A. G., and Zhizhchenko, B. P., 1974. Obnaruzheniyekristalligradov gazov osadkakh sovremennykh akvatoriy. "Occur-rence of crystal-hydrates of gases in the sediments of modern ma-rine basins." Dokl. Akad. Nauk SSSR, 214:1179-1181; Dokl.Akad. Nauk SSSR, Earth Sci. Sect. (Engl. Transl.), 214(1975):219-220
Young, A., and Mclver, R. D., 1977. Distribution of hydrocarbonsbetween oils and associated fine-grained sedimentary rocks—phys-ical chemistry applied to petroleum geochemistry, II. Bull. Am.Assoc. Pet. Geol., 61:1407-1436.
Date of Initial Receipt: April 22, 1982
389