deduction of reliability parameter for spherical roller...
TRANSCRIPT

International Journal of Mechanical Engineering and Applications 2016; 4(3): 130-135
http://www.sciencepublishinggroup.com/j/ijmea
doi: 10.11648/j.ijmea.20160403.15
ISSN: 2330-023X (Print); ISSN: 2330-0248 (Online)
Deduction of Reliability Parameter for Spherical Roller Bearing
Baek Ju Sung
Reliability Assessment Center, Korea Institute of Machinery & Materials, Daejeon, Korea
Email address: [email protected]
To cite this article: Baek Ju Sung. Deduction of Reliability Parameter for Spherical Roller Bearing. International Journal of Mechanical Engineering and
Applications. Vol. 4, No. 3, 2016, pp. 130-135. doi: 10.11648/j.ijmea.20160403.15
Received: May 10, 2016; Accepted: May 28, 2016; Published: June 18, 2016
Abstract: To establish the reliability assessment technology of spherical roller bearing, we performed the major failure
analysis, and then produced the reliability parameters for spherical roller bearing. As a first step, we made out the failure
analysis data of roller bearing. And then, we decided the reliability parameters of spherical roller bearing by using of
MINITAB software. Then we verified propriety the reliability parameters by comparison of pre-performed test results and
MINITAB analysis. In this paper, we proposed a method of the reliability assessment technology of spherical bearing, and
showed the reliability parameters of roller bearing by use of 8-samples spherical roller bearing. And also, we presented the
useful reliability parameters for roller bearing test, which are produced by MINITAB analysis and marking of Weibull
probability paper using the measured some life points, and also verified the propriety of reliability parameters by some kinds of
complex tests.
Keywords: Spherical Roller Bearing, Reliability, Failure Mode, Life Test, Weibull Distribution
1. Introduction
Bearings are a main components part of rotation
equipments. Roller and the raceway surface of the inner and
outer ring of the spherical bearing is spherical shape. The
barrel type roller configured in two rows has a function of
adjusting the rotation center of axis in the outer ring raceway
surface. So, the spherical bearing can correct the center error
of the shaft and the housing. The spherical roller bearing is
used to support pure radial loads as like the large gearbox,
industrial conveyors, rolling machines and power axis of
wind turbine. Roller bearing life is drastically reduced by
excessive misalignment or deflection; hence, when using
spherical roller bearing, the stack-up of tolerances
contributing to misalignment and the shaft or housing
deflections should be carefully considered. To compensate
for some degree of misalignment or deflection and to carry
heavy radial loads, spherical roller bearing is in complete to
prevent the phenomenon known as end loading. [1]
Since the failure of the bearing is directly related to the
fault for the entire system, the life of the bearing is predicted
and on the basis of this, the conservation plan should be
established prevention to avoid getting a great loss. However,
bearing-related standards such as ISO have proposed that the
guarantee applies to life assurance, confidence level, and life
time distribution in batches for the life of the bearing. [2]
In this study, failure analysis, test method and life
distribution for the reliability assessment of the spherical
bearing have been proposed. Through the failure analysis, the
main failure mode of the bearing was confirmed and through
the QFD, the test items for the reliability assessment were
determined. And then, no-failure life test time was calculated
through the field operation time, confidence level and some
parameters. This study developed test equipment which
adapted the field condition for the life test of spherical roller
bearing and life test was performed. Finally, the life
distribution analysis was based on the reliability test results
for the eight samples, it could be predict the life trend of the
bearing through the calculating the related parameters.
2. Specimen and Test Equipment
The shape of the spherical roller bearing is shown in Fig. 1.
Spherical roller bearing is double row, self-retaining units
comprising solid outer ring with a concave raceway, solid

International Journal of Mechanical Engineering and Applications 2016; 4(3): 130-135 131
inner ring and barrel rollers with cages. The symmetrical
barrel rollers freely align themselves to the concave outer
ring raceway. As a result, shaft deflections and misalignments
of the bearing seats are compensated. Self-aligning capability
is reduced when the inner and outer ring are unstable. The
normal operating condition can be corrected by misalignment
0.5°, it can be allowed up to 2° when the load is small.
Figure 1. Spherical roller bearing.
The primary failure mode of the spherical roller bearing is
the spalling of roller contact area due to repetitive loads. The
stress factor that can accelerate the main failure modes in life
test were selected radial direction loads. The test equipment
for spherical roller bearing is shown in Figure 2. The motor
rotates the specimen with the radial direction load applied by
hydraulic servo cylinders. The hydraulic cylinders are
controlled by the servo valve with response to the output
value of load cell. Therefore, the test equipment can realize
normal use conditions of spherical roller bearing. [3-5]
Figure 2. Test equipment for spherical roller bearing.
As shown in figure 3, the test jig is structured to support
both ends of the bearing shaft. The roller bearings more
durable than test specimen are adopted at both ends bearing
shafts.
Figure 3. Test jig for spherical roller bearing.
3. Failure Analysis and Test Items
The main failure modes of a spherical roller bearing are
deformation, fracture and crack caused by the repeated load
on the raceway surface of the inner and outer ring, and
spalling due to crack propagation of surface. This failure
mode is usually caused by bearing exposure to an excessive
load for an extensive period of time. The failure modes and
mechanisms analysis for spherical roller bearing are listed in
Table 1. [6-7].
Table 1. Analysis of failure modes and mechanisms.
Primary
components Function
Failure
modes
Failure
mechanisms
Outer ring, Inner
ring, Roller, Cage
Smooth
rotation
Fusion Wearing
Deformation Brinelling
Separation Crack
Fracture
Smearing
Spalling
Fretting
Crack Fatigue
Lubrication Reduced
friction
Lubricant
degradation
Thermal
destruction
Here the spalling is defined as subsurface chipping or
breaking which is the result of poor lubrication or surface
damage interrupts the lubricant film. Scores and scratches are
usually caused by hard particles being trapped in a bearing.
Test items are determined by test effectiveness score of
spherical roller bearings, and then test ranking is decided
according to the scores order. Test effectiveness rank is listed
in Table 2. In this study, the representative performance test
item is friction torque test which is used to confirm the spalling
phenomenon of bearing and also used for life test. As
environmental tests, the vibration and low temperature test are
selected by consideration of field using conditions of test
items.

132 Baek Ju Sung: Deduction of Reliability Parameter for Spherical Roller Bearing
Table 2. Table effectiveness rank.
components failure mechanisms Test items
Precision Friction torque Rigidity High Temp. Vibration Low Temp. Life
Outer ring, Wearing ▲ ● ▲
◎ Inner ring, Brinelling ▲ ●
▲
●
Roller, Crack ● ● ▲ ● ●
◎ Cage Smearing ● ● ● ▲ ● ▲ ▲
Spalling ● ● ● ● ● ● ◎ Fretting ● ● ● ▲
▲ ●
Fatigue ▲ ◎ ● ◎
◎ ●
Lubrication Thermal destruction ●
●
▲
test effectiveness rank 3 2 5 4 7 5 1
Table 3. Table effectiveness rank.
Test item Test method Failure criterion
Precision test Measurement tolerances of the inner and outer rings <0.01 mm
Maximum friction torque test Test load: 30% of dynamic load rating, Test speed: 1700 r/min Operating noise
< 85 dB(A)
Maximum friction torque
<110% of the initial value
Rigidity test Test load: Static load rating, measurement displacement
High temp. oil test Lubrication temp.: (120±2)°C
Vibration test Acceleration: 50 m/s2, Amplitude: 15 mm
Life test Test load: 30% of dynamic load rating, Test cycle: 1700 r/min
Test items were listed in table 3 to assess the reliability of
spherical roller bearing. Maximum friction torque test is
representative of the performance test.
Fault tree analysis (FTA) is performed to represent the
cause of spherical roller bearing failure logically. FTA is a
structured top down method to determine causes, lead to a
defined state of the spherical roller bearing. This method can
be expressed various combinations of fault cause compactly.
The bearing failure is caused faulty assembly, over load and
lack of lubrication of spherical roller bearing. Also, the faulty
assembly is caused misalignment and fitting. [8-9]
Figure 4. Fault tree analysis for spherical roller bearing.
4. No-Failure Life Test Time
The assurance life time of spherical roller bearing is
1.0×10⁶ cycles (B10 life) at 90% confidence level. The shape
parameter is 1.3. The calculation of no failure life time is
shown in equation (1).
β1
100)1ln(
)1ln(
−•−
•=pn
CLBt pn (1)
cycles63.1
1
6 102.22166352)1.01ln(8
)9.01ln(100.1 ×≅=
−•−•×=
Where, tn is no failure test time, B100p is the assurance life
time, p is the unreliability (if B10, p =0.1) and β is the shape
parameter.
After testing the eight specimens, if they work during
2.2×10⁶ cycles without failure, the life of spherical bearing is
guaranteed the work time 1.0×10⁶ cycles (B10 life) at 90%
confidence level. In order to increase the efficiency of the test
and reproduce the main failure mode in the actual use
conditions, the equivalent load is calculated as 30% of the
dynamic load rating. Equation (2) represents the rating life.
Attempting to estimate the fatigue life of an individual
bearing is not very practical because of the large number of
design parameters to consider in relation to the sensitivity of
the operating environment. Instead, statistical methods are
used to rate bearings based on the results of large groups of
the same type of bearing tested to failure under controlled
laboratory conditions to establish a fatigue life rating. This
rating, known as the B10 life, is defined as the number of
hours that 90% of the bearings operating at their rated load
and speed, can be expected to complete or exceed before
exhibiting the first evidence of fatigue. Standard equations
have been developed to extend the B10 rating to determine the

International Journal of Mechanical Engineering and Applications 2016; 4(3): 130-135 133
statistical rated life for any given set of conditions. These
equations are based on an exponential relationship of load to
life. [10-11]
m
eqP
CL
=10 (2)
Where, L10 is rating life, C is dynamic load rating. The
dynamic load rating is determined through tests based upon
the B10 life. This rating can be found in manufacturer’s
catalogs or engineering drawings. Pea is equivalent load. So,
the life test life of spherical roller bearing can be calculated
like followings.
10
3
test
test
C
L L
P
=
(3)
10
3
8
2,166,352 119,456,522 1.2 10
0.3
C
cycles
C
= × = ≅ ×
After testing the eight specimens, if they work for 1.2×10⁸
cycles without failure, the life of spherical bearing is
guaranteed to work time 1.0×10⁶ cycles (B10 life) at 90%
confidence level.
5. Test Result
The maximum friction torque of bearing is measured by
the torque measuring test. The spherical roller bearing is
connected to the torque measurement equipment on the
bearing testing machine. And 30% of dynamic load rating
applied at 1700 r/min. After the life test, the friction torque of
spherical roller bearing was determined to be 28 N.m. As test
result, Fig. 5 shows that the measured maximum friction
torque is 28 N.m.
The operating noise was measured as about 80 dB(A). Fig.
6 shows operating noise of spherical roller bearing. The
Maximum torque and operating noise is satisfied the test
criteria of spherical roller bearing.
Figure 5. Friction torque of spherical roller bearing.
Figure 6. Operating noise of spherical roller bearing.
Table 4. Analysis of failure modes and mechanisms.
Specimen No. Failure cycle Result Failure mode
S1 139,536,000 Fail Frictional torque and noise
exceeding
S2 222,773,100 Fail
S3 362,089,800 Fail
S4 366,723,660 Fail
S5 445,536,000 Fail
S6 445,536,000 Censored -
S7 445,536,000 Censored -
S8 445,536,000 Censored -
The cycle to failures obtained by conducting life test is
shown in Table 4. The specimen number S1 through S5 are
failed and S6 through S8 are not the cycle to failure, but
censoring life cycle
Figure 7. Spalling due to crack of roller surface.
Exp(Signal 1) - Input
Working : Input : 3D-time : Overall
0 2 4 6 8 10 12 14 16 18
20
30
40
50
60
70
80
90
100
110
120
[s] (Time)
[dB(A)/20.0u Pa] Exp(Signal 1) - Input
Working : Input : 3D-time : Overall
0 2 4 6 8 10 12 14 16 18
20
30
40
50
60
70
80
90
100
110
120
[s] (Time)
[dB(A)/20.0u Pa]

134 Baek Ju Sung: Deduction of Reliability Parameter for Spherical Roller Bearing
Through the failure analysis, it was confirmed the spalling
occurs on the edge of the roller. The spalling of the roller is
shown in Fig. 7.
6. MINITAB Analysis for Decision of
Reliability Parameters
6.1. Goodness-of-Fit Analysis of Life Data Distribution
To decide the most suitable life distribution for life data as
the first step of statistical analysis, we performed
goodness-of-fit examination about three kind of typical life
distribution such as Weibull distribution, Lognormal
distribution and Exponential distribution. The result is shown
in Fig. 8. Since the censoring data is included in the life data,
the maximum likelihood method was applied.
Anderson-Darling (hereinafter A-D) distribution goodness of
fit test was performed over a black, and this statistic is a value
that measures the difference between the corresponding points
of the illustrated points and whether those suitable linear
probability. Among the candidate having distribution it means
that the distribution is well suited to a less A-D statistic.
Figure 8. Goodness of fitness test.
An Figure 8 in the results goodness-of-fit, the A-D statistic
of Weibull distribution is 24.831, lognormal distribution is
24.857, and exponential distribution is 25.071. Therefore,
Weibull distribution of the most small A-D statistics is most
appropriate to the life distribution of the spherical bearing.
6.2. Deduction of Major Reliability Parameters
For selected Weibull distribution using the MINITAB
software, a shape of probability density function, Weibull
probability paper, reliability function, and hazard function are
approximatively shown in figure 9. The functions of the
Weibull distribution are follows
β
ηβ
βηβ
−−
−
t
et
tf
1
)( 0,0 >> ηβ (4)
Where, )(tf : probability density function, β :shape
parameter, η :scale parameter.
0( ) ( ) 1
tt
F t f x dx eη − = = −∫ (5)
( ) 1 ( )
t
R t F t eη
− = − = (6)
1
( )( )
( )
f t th t
R t
ββη η
− = =
(7)
Where, )(tF : unreliability function, )(tR : reliability
function, )(th : hazard function.
Figure 9. Summary of Weibull distribution.
In figure 10, we can deduce the values of reliability
parameters, as it were, the shape parameter β as 2.65, scale
parameter η as 457,963,175 cycles. And also, the mean time to
failure (MTTF) is 407,020,433 cycles, median value is
398,865,366 cycles, 10B and is 99,160,243 cycles. The
prediction results of major reliability parameters obtained
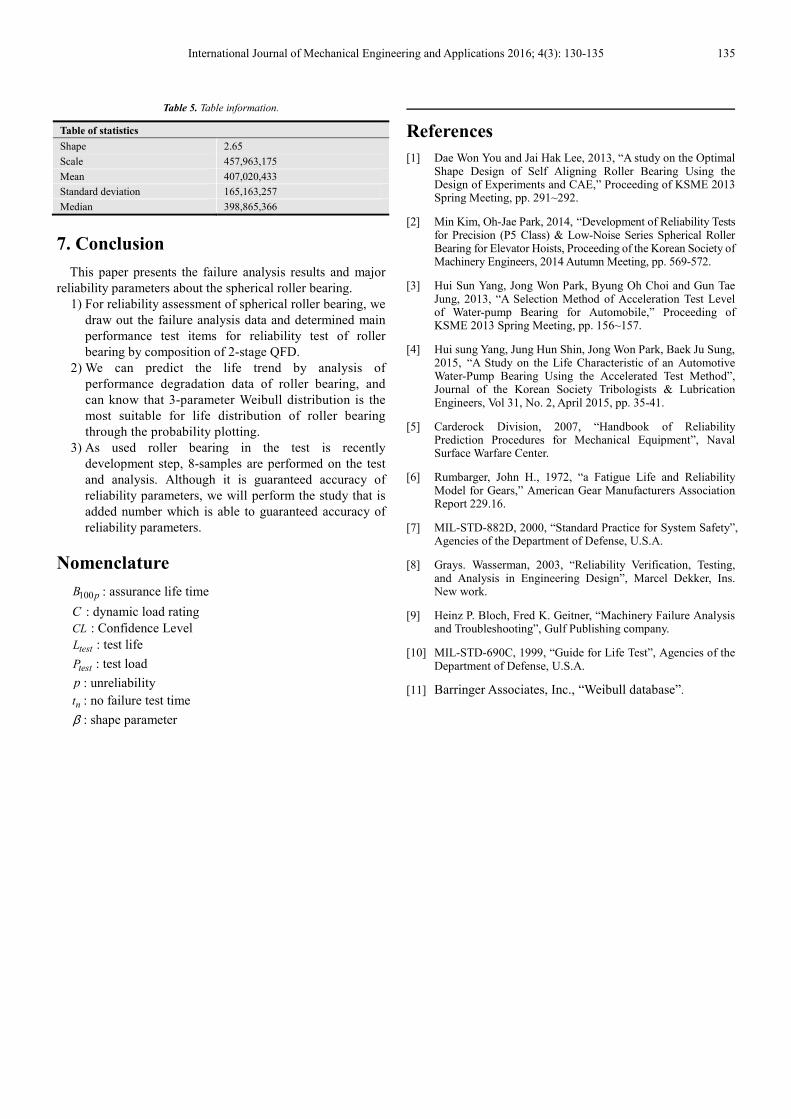
from this study are shown in Table 5.
Figure 10. Probability plot for cycles (Weibull-95% CI)g.
100000000010000000010000000
99
90
8070605040
30
20
10
5
3
2
1
CCCCyyyycccclllleeeessss
PP PPee eerr rr cc ccee eenn nntt tt
International Journal of Mechanical Engineering and Applications 2016; 4(3): 130-135 135
Table 5. Table information.
Table of statistics
Shape 2.65
Scale 457,963,175
Mean 407,020,433
Standard deviation 165,163,257
Median 398,865,366
7. Conclusion
This paper presents the failure analysis results and major
reliability parameters about the spherical roller bearing.
1) For reliability assessment of spherical roller bearing, we
draw out the failure analysis data and determined main
performance test items for reliability test of roller
bearing by composition of 2-stage QFD.
2) We can predict the life trend by analysis of
performance degradation data of roller bearing, and
can know that 3-parameter Weibull distribution is the
most suitable for life distribution of roller bearing
through the probability plotting.
3) As used roller bearing in the test is recently
development step, 8-samples are performed on the test
and analysis. Although it is guaranteed accuracy of
reliability parameters, we will perform the study that is
added number which is able to guaranteed accuracy of
reliability parameters.
Nomenclature
pB100 : assurance life time
C : dynamic load rating
CL : Confidence Level
testL : test life
testP : test load
p : unreliability
nt : no failure test time
β : shape parameter
References
[1] Dae Won You and Jai Hak Lee, 2013, “A study on the Optimal Shape Design of Self Aligning Roller Bearing Using the Design of Experiments and CAE,” Proceeding of KSME 2013 Spring Meeting, pp. 291~292.
[2] Min Kim, Oh-Jae Park, 2014, “Development of Reliability Tests for Precision (P5 Class) & Low-Noise Series Spherical Roller Bearing for Elevator Hoists, Proceeding of the Korean Society of Machinery Engineers, 2014 Autumn Meeting, pp. 569-572.
[3] Hui Sun Yang, Jong Won Park, Byung Oh Choi and Gun Tae Jung, 2013, “A Selection Method of Acceleration Test Level of Water-pump Bearing for Automobile,” Proceeding of KSME 2013 Spring Meeting, pp. 156~157.
[4] Hui sung Yang, Jung Hun Shin, Jong Won Park, Baek Ju Sung, 2015, “A Study on the Life Characteristic of an Automotive Water-Pump Bearing Using the Accelerated Test Method”, Journal of the Korean Society Tribologists & Lubrication Engineers, Vol 31, No. 2, April 2015, pp. 35-41.
[5] Carderock Division, 2007, “Handbook of Reliability Prediction Procedures for Mechanical Equipment”, Naval Surface Warfare Center.
[6] Rumbarger, John H., 1972, “a Fatigue Life and Reliability Model for Gears,” American Gear Manufacturers Association Report 229.16.
[7] MIL-STD-882D, 2000, “Standard Practice for System Safety”, Agencies of the Department of Defense, U.S.A.
[8] Grays. Wasserman, 2003, “Reliability Verification, Testing, and Analysis in Engineering Design”, Marcel Dekker, Ins. New work.
[9] Heinz P. Bloch, Fred K. Geitner, “Machinery Failure Analysis and Troubleshooting”, Gulf Publishing company.
[10] MIL-STD-690C, 1999, “Guide for Life Test”, Agencies of the Department of Defense, U.S.A.
[11] Barringer Associates, Inc., “Weibull database”.