decoupling of epitaxial graphene via gold …eprints.whiterose.ac.uk/99107/1/decoupling of...
TRANSCRIPT

This is a repository copy of Decoupling of epitaxial graphene via gold intercalation probed by dispersive Raman spectroscopy.
White Rose Research Online URL for this paper:http://eprints.whiterose.ac.uk/99107/
Version: Accepted Version
Article:
Pillai, P.B., DeSouza, M., Narula, R. et al. (4 more authors) (2015) Decoupling of epitaxial graphene via gold intercalation probed by dispersive Raman spectroscopy. Journal of Applied Physics, 117 (18). 183103. ISSN 0021-8979
https://doi.org/10.1063/1.4920931
[email protected]://eprints.whiterose.ac.uk/
Reuse
Unless indicated otherwise, fulltext items are protected by copyright with all rights reserved. The copyright exception in section 29 of the Copyright, Designs and Patents Act 1988 allows the making of a single copy solely for the purpose of non-commercial research or private study within the limits of fair dealing. The publisher or other rights-holder may allow further reproduction and re-use of this version - refer to the White Rose Research Online record for this item. Where records identify the publisher as the copyright holder, users can verify any specific terms of use on the publisher’s website.
Takedown
If you consider content in White Rose Research Online to be in breach of UK law, please notify us by emailing [email protected] including the URL of the record and the reason for the withdrawal request.

Decoupling of epitaxial graphene via gold intercalation probed by dispersive RamanspectroscopyP. B. Pillai, M. DeSouza, R. Narula, S. Reich, L. Y. Wong, T. Batten, and J. Pokorny Citation: Journal of Applied Physics 117, 183103 (2015); doi: 10.1063/1.4920931 View online: http://dx.doi.org/10.1063/1.4920931 View Table of Contents: http://scitation.aip.org/content/aip/journal/jap/117/18?ver=pdfcov Published by the AIP Publishing Articles you may be interested in Publisher's Note: 惇Structural consequences of hydrogen intercalation of epitaxial graphene on SiC(0001)敦 [Appl.Phys. Lett. 105, 161602 (2014)] Appl. Phys. Lett. 107, 189902 (2015); 10.1063/1.4935412 A temperature dependent measurement of the carrier velocity vs. electric field characteristic for as-grown and H-intercalated epitaxial graphene on SiC J. Appl. Phys. 113, 193708 (2013); 10.1063/1.4807162 Hafnium intercalation between epitaxial graphene and Ir(111) substrate Appl. Phys. Lett. 102, 093106 (2013); 10.1063/1.4793427 Raman study on the interlayer interactions and the band structure of bilayer graphene synthesized by alcoholchemical vapor deposition Appl. Phys. Lett. 99, 151916 (2011); 10.1063/1.3651325 Probing residual strain in epitaxial graphene layers on 4 H-SiC ( 000 1 ¯ ) with Raman spectroscopy Appl. Phys. Lett. 98, 051910 (2011); 10.1063/1.3551625
Reuse of AIP Publishing content is subject to the terms at: https://publishing.aip.org/authors/rights-and-permissions. Download to IP: 143.167.185.76 On: Wed, 27 Apr 2016
10:08:19
Decoupling of epitaxial graphene via gold intercalation probed by dispersiveRaman spectroscopy
P. B. Pillai,1,a) M. DeSouza,1,a) R. Narula,2 S. Reich,2 L. Y. Wong,3 T. Batten,3
and J. Pokorny4,51Semiconductor Materials and Device Group, Electronic and Electrical Engineering, University of Sheffield,Mappin Street, S1 3JD Sheffield, United Kingdom2Department of Physics, Freie Universit€at Berlin, Arnimallee 14, 14195 Berlin, Germany3Renishaw, Old Town, Wotton-under-Edge, GL12 7DW Gloucestershire, United Kingdom4Department of Materials Science and Engineering, Sir Robert Hadfield Building, Mappin Street,S1 3JD Sheffield, United Kingdom5Institute of Physics, Academy of Sciences of the Czech Republic, Na Slovance 2, 182 21 Praha 8,Czech Republic
(Received 3 January 2015; accepted 29 April 2015; published online 12 May 2015)
Signatures of a superlattice structure composed of a quasi periodic arrangement of atomic gold
clusters below an epitaxied graphene (EG) layer are examined using dispersive Raman
spectroscopy. The gold-graphene system exhibits a laser excitation energy dependant red shift of
the 2D mode as compared to pristine epitaxial graphene. The phonon dispersions in both the
systems are mapped using the experimentally observed Raman signatures and a third-nearest
neighbour tight binding electronic band structure model. Our results reveal that the observed
excitation dependent Raman red shift in gold EG primarily arise from the modifications of the
phonon dispersion in gold-graphene and shows that the extent of decoupling of graphene from
the underlying SiC substrate can be monitored from the dispersive nature of the Raman 2D modes.
The intercalated gold atoms restore the phonon band structure of epitaxial graphene towards free
standing graphene.VC 2015 AIP Publishing LLC. [http://dx.doi.org/10.1063/1.4920931]
I. INTRODUCTION
Graphene is a deceptively simple two-dimensional
arrangement of carbon atoms, which is the building material
of other graphitic forms of carbon.1 Its superior electronic
properties make it a promising candidate for future electronic
applications.2–4 However, the finite transmission probability
of electrons in graphene across potential barriers regardless
of their height and width, called Klein tunnelling,5 poses a
serious challenge in the applicability of this material to
digital electronics and photonics. This can be overcome by
inducing a controllable band gap in the material. However,
limitations in resolution of resist based electron beam lithog-
raphy of sub nanometre dimensions to induce such a
band-gap by quantum confinement poses significant techni-
cal challenges.6 On the other hand, the concept of self-
assembled superlattice structures offers a more realistic
option to realise electronic applications without complex
lithography.7 Large scale graphene superlattices have
recently been demonstrated by intercalating metal atoms
below epitaxial graphene (EG) or by the growth of graphene
on lattice mismatched metal substrates.8–10 Recently, gra-
phene/boron-nitride heterostructures have emerged as a very
promising system for band engineering of graphene.11
Theoretical investigations by Park et al.12 revealed that the
application of a periodic potential by suitable patterns results
in highly anisotropic charge carrier behaviour in graphene.
An experimental evidence for this was reported by
Yankowitz et al.10 They observed a rotation dependent
Moir�e pattern of graphene on hexagonal boron nitride
(h-BN), which acts as a periodic potential on the graphene
lattice, leading to the generation of new Dirac points in the
electronic spectrum and anisotropic charge carrier velocity.10
Similar to their observation, we have earlier reported a
superlattice structure of gold atoms below epitaxial graphene
which exhibits a unique standing wave pattern in its charge
density.8,13 These intercalated atomic clusters locally screen
the charge transfer from the substrate to graphene leading to
charge anisotropy in graphene.
Epitaxial graphene growth on the Si terminated SiC
surface results initially in a carbon rich buffer layer in which
every third carbon atom is covalently bonded to the underly-
ing Si atoms.14 The proximity of the buffer layer below
graphene imparts strong n-type doping and strain on the sub-
sequently grown monolayer graphene. Intercalating metal
atoms between the buffer layer and monolayer graphene has
been suggested as a suitable method to decouple the gra-
phene and to realize the formation of quasi free-standing
graphene on SiC.13,15 In the present study, it is shown via
Raman spectroscopy that the decoupling of graphene by
intercalated gold atoms can be understood by considering the
dispersive nature of the 2D modes. An excitation dependent
Raman red-shift observed in gold-intercalated epitaxial gra-
phene in comparison to pristine epitaxial graphene is investi-
gated by considering the contributions from strain, doping,
and phonon dispersion in graphene due to intercalated gold
atoms. Here, the term “pristine EG” is used to address epi-
taxial graphene prior to the deposition of gold and gold-EG
a)Authors to whom correspondence should be addressed. Electronic addresses:
[email protected] and [email protected].
0021-8979/2015/117(18)/183103/8/$30.00 VC 2015 AIP Publishing LLC117, 183103-1
JOURNAL OF APPLIED PHYSICS 117, 183103 (2015)
Reuse of AIP Publishing content is subject to the terms at: https://publishing.aip.org/authors/rights-and-permissions. Download to IP: 143.167.185.76 On: Wed, 27 Apr 2016
10:08:19
for gold intercalated EG. Spectroscopic features acquired at
different incident laser polarizations and dispersive micro
Raman measurements reveal that the origin of the excitation
dependent Raman red-shift observed in the case of gold-
intercalated epitaxial graphene can only be explained on the
basis of modification of their phonon band structure.
II. EXPERIMENTAND THEORY
Graphene samples were prepared in UHV by the anneal-
ing of n-doped SiC(0001) at 900K for several hours and sub-
sequent annealing at 1500K for 30min. The deposition of
gold on graphene was carried out at room temperature using
a homemade Knudsen cell calibrated using a quartz crystal
microbalance. The sample was further annealed at 1000K
for 5min. The intercalated areas of gold grow in size up to
several micrometers in subsequent annealing cycles.8,13
Raman spectra are recorded using a Renishaw inVia micro
Raman spectrometer working in back scattering geometry
using excitation wavelengths 514, 532, 633, and 785 nm. A
laser power of 3 mW is used with an objective of 100� magni-
fication and numerical aperture of 0.85. The sample surface to-
pography was recorded using an Omicron-Low Temperature
Scanning Tunneling Microscope (LTSTM) working at 77K.13
The electronic band structure in pristine and gold-EG are
deduced by fitting their experimentally reported Angle-
resolved photoemission spectroscopy (ARPES) band disper-
sion16 using a third nearest neighbor tight binding (3NN-TB)
model [next nano317]. The analytical expressions used in the
model are previously described by Reich et al.18
III. RESULTS AND DISCUSSION
Fig. 1(a) shows a 5� 5 nm2 STM image of gold interca-
lated graphene where the clusters appear as bright protru-
sions (image processing was carried out using WSxM.19).
The honeycomb structure is apparent on top of the clusters,
which implies that the clusters are intercalated below the
monolayer graphene. The inset of Fig. 1(a) is a 10� 10 nm2
image of the irregular distribution of clusters captured at a
higher bias voltage. The bottom of Fig. 1(a) represents a
schematic model which indicates the position of the gold
clusters (Au) as lying between the buffer layer (BL) and the
first layer of graphene (MG).13 Fig. 1(b) shows the experi-
mental Raman peaks corresponding to pristine EG at a laser
excitation of 2.41 eV. The resultant spectrum after subtract-
ing the contribution from the underlying SiC substrate is
shown as the curve at the top. A direct observation of the G
band in EG is obscured by the strong modes emanating from
the SiC substrate (between wavenumber 1400–2000 cm�1).
Hence, in the present study, only the 2D Raman modes are
considered. The number of graphene layers is also confirmed
from Raman spectra (see supplementary material, Fig. S1).
The excitation dependence of the 2D mode in the gold inter-
calated epitaxial graphene (red curves) is shown in Fig. 1(c).
The black curves at the bottom denote the reference pristine
epitaxied graphene with vertical lines indexing their maxi-
mum values. Care was taken to ensure Raman measurements
were collected from the same location on each sample. Fig.
1(d) shows the frequency dispersion of the 2D mode with
laser energy in pristine and gold EG samples. Fig. 1(e) shows
the Raman spectral map of the 2D peak position of gold-
intercalated graphene. Fig. 1(f) represents the Raman spec-
tral map for pristine EG obtained from a line scan data over
the range shown in the figure as a reference.
A closer look into the double resonant 2D Raman modes
of pristine EG and gold intercalated EG shown in Figs. 1(c)
and 1(d) reveals (a) an intriguing excitation dependent
Raman shift between the two (b) the gold intercalated EG
exhibits a steeper 2D dispersion as compared to the pristine
EG. The experimental value of the red shift changes from
approximately 3 cm�1 to 17 cm�1 as the excitation energy
changes from 2.41 eV to 1.58 eV. The error bar in Fig. 1(d)
corresponds to the uncertainty in the Lorentzian peak maxi-
mum for the 2D mode. From the laser energy dependence, a
2D peak dispersion value of 102 cm�1/eV and 124 cm�1/eV
is deduced for pristine and gold-EG, respectively. The origin
of the first and second order double resonant Raman mode in
graphene is well understood in the literature.20–24 It has been
identified that the phonon mode involved in the origin of the
2D mode in graphene is the transverse optical (TO) near the
K point of the Brillouin zone.20 As the excitation laser
energy increases, the incident photon excites electronic lev-
els farther from the K point and results in progressively
higher phonon momenta and correspondingly higher ener-
gies. This results in the energy dispersive behaviour of the
2D Raman mode in graphene.20 The three possible origins
for the observed variations in the Raman spectra between the
pristine and gold EG are (a) strain generated in gold-EG, (b)
doping in gold-EG, and (c) change in phonon dispersion in
gold-EG due to intercalated gold atoms. In Secs. III A–III C,
the dependence of each of these factors on the observed
Raman behaviour reported in Figs. 1(c) and 1(d) are
discussed.
A. Polarization dependent Raman spectroscopy androle of strain
Strain in graphene significantly alters the Raman modes
through a modification of the electronic and phonon band
structure.25–27 The influence of strain on the line shape and
frequency of the 2D Raman mode of graphene has been well
understood in the literature.25,28–30 Strain splits the 2D peak
in graphene into two components with the magnitude of
split depending on the direction of the strain in gra-
phene.29,30 The component of the 2D peak with a smaller
frequency is represented as 2D� and that with higher fre-
quency as 2Dþ. In the case of strained graphene, when the
incident laser polarisation is rotated with respect to the
strain direction, the spectral weight of the 2D mode shifts
from the 2D� component to the 2Dþ component. That is,
when the polarisation of the incident laser is parallel to the
strain direction, the 2D� component is dominant and when
perpendicular, 2Dþ component becomes dominant. The
separation between the two components depends on the
magnitude of strain.29,30
To evaluate the strain present in pristine EG and gold-
EG, we have conducted polarisation dependent Raman spec-
troscopy on these samples by using an excitation wavelength
183103-2 Pillai et al. J. Appl. Phys. 117, 183103 (2015)
Reuse of AIP Publishing content is subject to the terms at: https://publishing.aip.org/authors/rights-and-permissions. Download to IP: 143.167.185.76 On: Wed, 27 Apr 2016
10:08:19

of 532 nm and a half wave plate is introduced in the incident
laser path to rotate the polarisation. The relative angle
between the incident and analyser polarisation (b) is varied
in steps of 20� and the 2D mode is acquired using identical
experimental conditions in all cases. Fig. 2(a) shows the evo-
lution of the 2D peak in pristine EG when b is varied from
nearly parallel (190�) to crossed polarizations (90� or 270�)
(top to bottom). The normalized intensity of the 2D mode in
pristine EG is plotted with the relative angle b as shown in
Fig. 2(b). Yoon et al.31 in their report revealed a relation
connecting the intensity of the 2D Raman mode and the
relative angle between the incident and analyser polarisation
b as
Ib ¼Ijj
32 cos2bþ 1� �
; (1)
where Ijj is the intensity of the 2D is peak when incident and
scattered polarizations are parallel to each other. As expected
in the case of exfoliated graphene, the observed maximum
intensity in pristine EG when the incident and analyser polar-
isations are parallel is �3 times the minimum intensity
recorded when the two polarisations are perpendicular to
each other. The 2D peak shows no clear splitting or anisot-
ropy when the incident polarisation is rotated from the paral-
lel to the perpendicular directions and it can be fitted with a
single Lorentzian of width �40 cm�1 (not shown). This
value is different from that of exfoliated graphene29,30
(�32 cm�1) and the difference can be attributed to the
n-doping and strong interaction of graphene with the under-
lying SiC substrate. However, in the case of gold-EG, when
the incident polarization is rotated from the perpendicular to
FIG. 1. (a) Topographic atomic resolution STM images showing monolayer epitaxial graphene with gold atomic clusters intercalated below. Figure inset is an
STM image captured at higher bias (�0.37V), which shows the distribution of clusters below the graphene. The honeycomb structure of graphene is clearly
visible on top of these clusters. The bottom part of Fig. 1(a) shows a schematic model revealing the position of gold clusters as intercalated between the buffer
layer and the first layer of graphene. (b) Raman spectrum collected from (i) the SiC substrate (bottom curve), (ii) monolayer epitaxial graphene grown on SiC
substrate (middle curve), and (iii) the resultant spectrum obtained by subtracting the contribution from the substrate (top curve). Non-subtracted substrate fea-
tures are indicated by a “*” in the top curve. The positions of respective Raman modes are indexed as D, G, and 2D which are the defect induced D band, first
order-Raman G mode and double resonant two phonon-2D modes, respectively. (c) A comparison of pristine and gold intercalated EG 2D modes at various
laser excitation energies. The laser energy corresponding to each curve is indexed, and vertical dotted lines indicate the maximum in pristine epitaxial gra-
phene. (d) The 2D mode spectral dispersions in pristine (circles) and gold intercalated graphene (star) are shown together to reveal an excitation dependent red
shift between the two (e) and (f) Raman spectral map of the position of the 2D peak in gold-intercalated graphene and pristine EG, respectively, collected using
a laser energy of 2.32 eV.
183103-3 Pillai et al. J. Appl. Phys. 117, 183103 (2015)
Reuse of AIP Publishing content is subject to the terms at: https://publishing.aip.org/authors/rights-and-permissions. Download to IP: 143.167.185.76 On: Wed, 27 Apr 2016
10:08:19
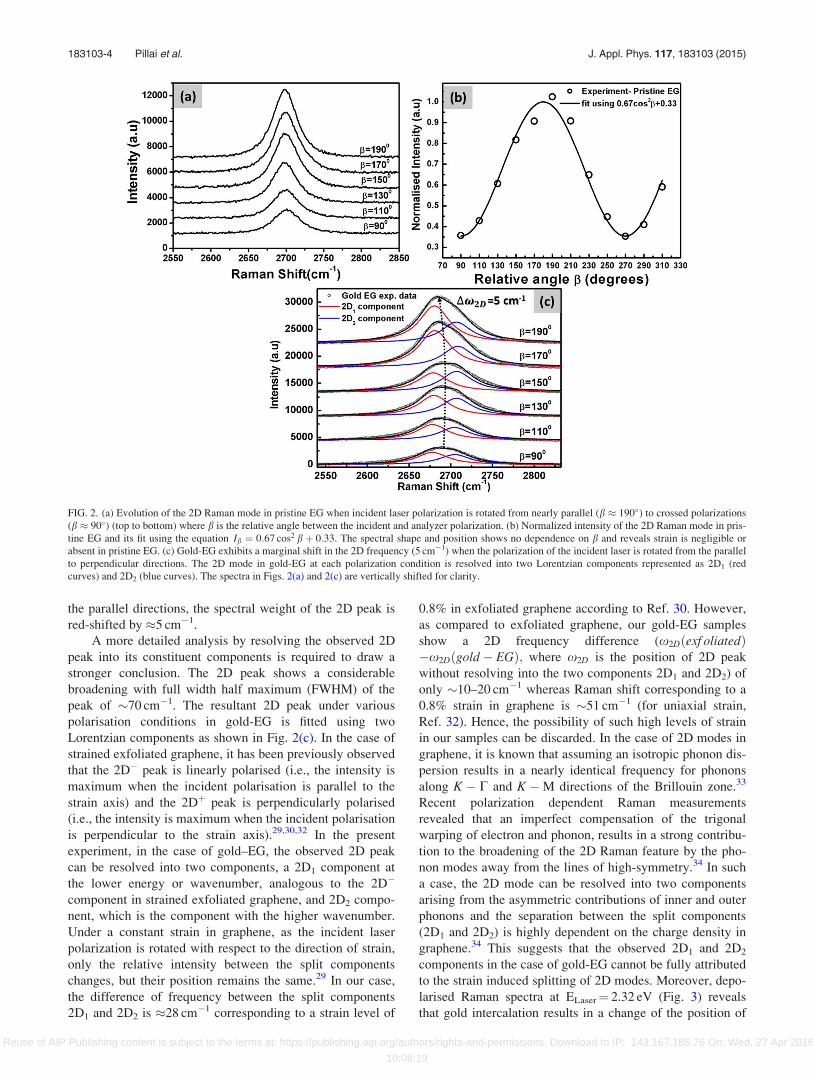
the parallel directions, the spectral weight of the 2D peak is
red-shifted by �5 cm�1.
A more detailed analysis by resolving the observed 2D
peak into its constituent components is required to draw a
stronger conclusion. The 2D peak shows a considerable
broadening with full width half maximum (FWHM) of the
peak of �70 cm�1. The resultant 2D peak under various
polarisation conditions in gold-EG is fitted using two
Lorentzian components as shown in Fig. 2(c). In the case of
strained exfoliated graphene, it has been previously observed
that the 2D� peak is linearly polarised (i.e., the intensity is
maximum when the incident polarisation is parallel to the
strain axis) and the 2Dþ peak is perpendicularly polarised
(i.e., the intensity is maximum when the incident polarisation
is perpendicular to the strain axis).29,30,32 In the present
experiment, in the case of gold–EG, the observed 2D peak
can be resolved into two components, a 2D1 component at
the lower energy or wavenumber, analogous to the 2D�
component in strained exfoliated graphene, and 2D2 compo-
nent, which is the component with the higher wavenumber.
Under a constant strain in graphene, as the incident laser
polarization is rotated with respect to the direction of strain,
only the relative intensity between the split components
changes, but their position remains the same.29 In our case,
the difference of frequency between the split components
2D1 and 2D2 is �28 cm�1 corresponding to a strain level of
0.8% in exfoliated graphene according to Ref. 30. However,
as compared to exfoliated graphene, our gold-EG samples
show a 2D frequency difference (x2Dðexf oliatedÞ�x2Dðgold � EGÞ; where x2D is the position of 2D peak
without resolving into the two components 2D1 and 2D2) of
only �10–20 cm�1 whereas Raman shift corresponding to a
0.8% strain in graphene is �51 cm�1 (for uniaxial strain,
Ref. 32). Hence, the possibility of such high levels of strain
in our samples can be discarded. In the case of 2D modes in
graphene, it is known that assuming an isotropic phonon dis-
persion results in a nearly identical frequency for phonons
along K � C and K �M directions of the Brillouin zone.33
Recent polarization dependent Raman measurements
revealed that an imperfect compensation of the trigonal
warping of electron and phonon, results in a strong contribu-
tion to the broadening of the 2D Raman feature by the pho-
non modes away from the lines of high-symmetry.34 In such
a case, the 2D mode can be resolved into two components
arising from the asymmetric contributions of inner and outer
phonons and the separation between the split components
(2D1 and 2D2) is highly dependent on the charge density in
graphene.34 This suggests that the observed 2D1 and 2D2
components in the case of gold-EG cannot be fully attributed
to the strain induced splitting of 2D modes. Moreover, depo-
larised Raman spectra at ELaser¼ 2.32 eV (Fig. 3) reveals
that gold intercalation results in a change of the position of
FIG. 2. (a) Evolution of the 2D Raman mode in pristine EG when incident laser polarization is rotated from nearly parallel (b � 190�) to crossed polarizations
(b � 90�) (top to bottom) where b is the relative angle between the incident and analyzer polarization. (b) Normalized intensity of the 2D Raman mode in pris-
tine EG and its fit using the equation Ib ¼ 0:67 cos2 bþ 0:33. The spectral shape and position shows no dependence on b and reveals strain is negligible or
absent in pristine EG. (c) Gold-EG exhibits a marginal shift in the 2D frequency (5 cm�1) when the polarization of the incident laser is rotated from the parallel
to perpendicular directions. The 2D mode in gold-EG at each polarization condition is resolved into two Lorentzian components represented as 2D1 (red
curves) and 2D2 (blue curves). The spectra in Figs. 2(a) and 2(c) are vertically shifted for clarity.
183103-4 Pillai et al. J. Appl. Phys. 117, 183103 (2015)
Reuse of AIP Publishing content is subject to the terms at: https://publishing.aip.org/authors/rights-and-permissions. Download to IP: 143.167.185.76 On: Wed, 27 Apr 2016
10:08:19

G and 2D modes in EG such that the ratio of the difference
in frequencies of the modes, Dx2D/DxG � 0.77, is signifi-
cantly different from strain induced changes in the Raman
modes where a ratio of 2.5 or more may be expected.35
B. Role of doping
It has been shown in Fig. 1(d) that the gold-EG exhibits
a steeper 2D mode dispersion as compared to pristine EG.
Following the report by Attaccalite et al.,36 electron or hole
doping may reduce the D or 2D peak dispersion value in gra-
phene by changing the dispersion of the TO phonon. The
higher value of the 2D mode dispersion in gold-EG can be
attributed to a reduction in the intrinsic n-doping present in
the sample. However, according to Das et al.,37 the 2D mode
in graphene shows less sensitivity to a variation of electron
doping in the range 0–2� 1013cm�2 and p-doping results in
unique blue shifted G and 2D modes contrary to the red
shifted peaks in the present experiment. Consistent with this
observation, Berciaud et al.34 also reported an unintentional
p-doping of graphene on a Si/SiO2 substrate, which results in
a blue shifted 2D peak with symmetrical broadening. To en-
visage the doping variations in pristine and gold EG samples
in the observed Raman shift rates, the carrier concentration
in graphene is evaluated as n EFð Þ ¼ 1p
EF
�hvF
h i2
, where EF is the
Fermi energy measured from the Dirac point. It has been
observed experimentally from ARPES that the Fermi level is
�0.29 eV and �0.23 eV away from the Dirac point in pris-
tine and gold-EG, respectively.16 (The samples studied in
ARPES and in the present study are prepared in the same set
up). However, there may be sample to sample variation in
doping level even grown in same furnace. To minimize this
variation, samples with identical properties as reported in
Ref. 16 are chosen in this study (see supplementary material,
Fig. S2). This implies an electron density of 5.4� 1012cm�2
(using vF ¼ 1� 106m/s) and 2.74� 1012cm�2 (using
vF ¼ 1.2� 106m/s) in pristine and gold-EG, respectively.
This implies a marginal reduction of the intrinsic n-doping in
epitaxial graphene as depicted above and cannot be consid-
ered as the observed red shift of 2D mode at the investigated
laser energies.
C. Electron and phonon dispersion in graphene
As discussed earlier, the 2D modes exhibit a significant
broadening in the case of gold-EG as compared to pristine
EG. In the case of isotropic electron and phonon dispersion,
the FWHM of the 2D mode is derived as33
C2D ¼ 4ffiffiffiffiffiffiffiffiffiffiffiffiffiffiffiffi
22=3 � 1p tphonon
vFceh; (2)
where tphonon(vFÞ is the phonon (Fermi) velocity and ceh is
the broadening parameter empirically derived by Venezuela
et al.,38 for laser energy ELaser � 1 eV as
ceh ¼ ð18:88jELaserj þ 6:802E2Laser ÞmeV: (3)
Hence, the theoretically expected dependence of C2D is
such that it decreases with laser energy (ELaser) as the reduc-
tion in ceh due to decrease in ELaser predominates over the
change oftphononvF
. However, similar to the case of suspended
graphene,34 the present experimental data also show a note-
worthy increase of C2D as laser energy decreases (Fig. 1(c)).
It has been shown earlier in graphene that the effects of tri-
gonal warping of electrons and phonons are opposite39 and
cancel out, resulting in a symmetric 2D mode with broaden-
ing, following Eq. (2). However, in the current case, the
effects of trigonal warping may not cancel each other, which
results in the broadening of the 2D mode in gold EG.
Moreover, considering the rate of shift of x2D with respect
to the photon frequency (xLaserÞ calculated from the
observed 2D mode dispersion as29
@x2D
@xLaser
¼ 2�phononvF
: (4)
Using the tF evaluated from ARPES for these samples,16 the
ratios of TO phonon and Fermi velocities in pristine and
gold EG are evaluated as 6:36� 10�3 and 7:745� 10�3,
respectively. These values depict approximately 22%
increase in the slope of the phonon dispersion in gold-EG in
comparison to pristine epitaxial graphene.
Poncharal et al. established that similar excitation
dependent Raman shift in 2D modes occurs because of
phonon band structure modifications in folded graphene.39
A similar excitation dependence was also reported due to
strain induced modifications of phonon and electron dis-
persion in graphene [supplementary material of Ref. 29].
Therefore, in this work, phonon dispersion as a probable
cause of Raman redshift in gold-EG is evaluated using the
3NN TB-band structure combined with the experimentally
observed Raman modes at various laser energies. The
3NN TB parameters have been fitted to the experimental
FIG. 3. (a) Depolarised Raman spectra
of G (a) and 2D (b) peak regions of
pristine and gold-EG using a laser
energy of 2.33 eV. The gold-EG shows
a G and 2D peak shift of �13 cm�1
and 10 cm�1, respectively, in compari-
son to its pristine counterpart. The
gold-EG spectra in Figs. 3(a) and 3(b)
are vertically shifted for clarity.
183103-5 Pillai et al. J. Appl. Phys. 117, 183103 (2015)
Reuse of AIP Publishing content is subject to the terms at: https://publishing.aip.org/authors/rights-and-permissions. Download to IP: 143.167.185.76 On: Wed, 27 Apr 2016
10:08:19

valence band dispersion observed by ARPES,16 as shown
in Table I.
Fig. 4(a) shows the two dimensional theoretical elec-
tronic structure obtained from the above approach. A weak
p-doping is present in gold intercalated EG, which corre-
sponds to an approximate energy shift of 60meV from the
Dirac energy of pristine-EG.16 The gold-EG exhibits a
steeper electronic dispersion compared to its pristine coun-
terpart which could arise either due to the reduced interac-
tion of graphene with the substrate or decoupling from the
buffer layer. In Fig. 4(b), the triangular contour around the K
point (represented by a red “þ” symbol) shows the electronic
energy contour corresponding to an experimentally used
laser excitation of 1.58 eV. (This electronic equi-energy con-
tour is obtained by considering the valence and conduction
bands separated by 1.58 eV symmetrically across the Dirac
energy.) Similarly, the contour around the K0 point
corresponds to valence and conduction band sections sepa-
rated by an energy value of ELaser� 2*xphonon, which repre-
sents the de-excited state obtained by the emission of a light
quanta of energy ELaser� 2*xphonon. Here, xphonon is the
energy of the 2D peak observed experimentally for a laser
excitation of ELaser¼ 1.58 eV. All possible phonon vectors qicorresponding to this 2D phonon transition are determined
by translating the contour around K, to an equivalent tangen-
tial position on the contour around K0, as illustrated by the
dotted arrow in Fig. 4(b).38 The evaluated phonon iso-energy
contours relevant to the experimentally used laser excitations
(1.58–2.41 eV) for pristine EG (circles) and gold EG (lines)
are shown in Fig. 4(c). Please note that these phonon con-
tours are derived from the 3NN TB electronic dispersion and
hence the number of data points corresponds to the data
points on the electronic contours from the TB theoretical dis-
persion. Fig. 4(d) shows the interpolated 3D surface of the
TO phonon branch in pristine EG, constructed from the pho-
non iso-energy contours corresponding to the observed 2D
mode energies at the various laser excitations using the mesh
grid function in MATLAB. Fig. 4(e) shows the calculated
TO phonon dispersion in pristine EG (black) and gold-EG
(red), respectively, along the K-M direction of the Brillouin
zone where q¼ 0 corresponds to the K point. The symbols in
Fig. 4(e) represent the experimentally measured Raman 2D
FIG. 4. (a) Third nearest neighbor tight binding (3NN-TB) band structure along the C-K-M direction calculated by fitting the ARPES valence band structure of
pristine and gold intercalated graphene reported in Ref. 16. (b) An Illustration of construction of all possible intervalley phonon momenta of transitions corre-
sponding to the 2D mode at an experimentally used laser energy of 1.58 eV. (c) Phonon equi-energy contours relevant to the experimentally used laser excita-
tions (1.58–2.41 eV) for pristine EG (circles) and gold EG (lines). (d) Interpolated 3D surface of the TO phonon branch in pristine EG, constructed from the
phonon iso-energy contours corresponding to the observed 2D mode energies at the various laser excitations. (e) The calculated phonon dispersion and fit of
the data along the K-M direction of the Brillouin zone in the case of pristine and gold EG.
TABLE I. TB parameters used in the model to fit the experimental valence
band dispersion for pristine and gold-EG reported in Ref. 16.
Sample e2p c0 (eV) s0 c1 (eV) s1 c2 (eV) s2
Pristine-EG �0.58 �2.8 0.1 �0.08 �0.06 �0.275 0.003
Gold-EG �0.59 �3.31 0.03 �0.1 �0.08 �0.35 �0.006
183103-6 Pillai et al. J. Appl. Phys. 117, 183103 (2015)
Reuse of AIP Publishing content is subject to the terms at: https://publishing.aip.org/authors/rights-and-permissions. Download to IP: 143.167.185.76 On: Wed, 27 Apr 2016
10:08:19

mode energies plotted against the calculated q vectors. The
lines are fit to the symbols using the expression
x qð Þ ¼ xk þkk
4v2Fq
2 � x2k
� �1=2; (5)
where kk is the dimensionless electron phonon coupling
(EPC), vF is the Fermi velocity and xk is the energy of the
TO phonon at the K point,40 which yields kk ¼ 0.0566 0.001
for pristine EG (where �F ¼ 6:2 eVA has been used obtained
as the slope of the electronic bands from ARPES16) and
for gold-EG a value for kk ¼ 0:05460:001 (using tF¼ 7:5 eVA) is obtained. The iTO phonon dispersion is
steeper in the case of gold-EG and the slope of the phonon
dispersions along the K-M direction is qualitatively consist-
ent with experimental data shown in (Fig. 1(d)). The appa-
rent difference between the two dispersions in Fig. 4(e) and
Fig. 1(d) may be explained by (1) the well-known inad-
equacy of the TB model to accurately predict trigonal warp-
ing in graphene at higher energies41,42 and (2) the 3NN TB
band structure model used here is approximated from the
two dimensional experimental valence band data for pristine
and gold EG along C-K-M direction16 and a more accurate
theoretical valence and conduction band dispersion along the
all the high symmetry points may be required.
To further rule out the modification of electronic struc-
ture alone as a probable cause for the observed laser energy
dependent Raman shift in the study, 2D Raman modes of
two systems whose electronic band structure resembles pris-
tine and gold–EG are simulated.43 Our calculations reveal
that modification of the electronic structure alone results in a
constant red-shift of the 2D mode of gold-EG compared to
pristine EG. This clearly indicates that the excitation depend-
ent Raman red shift in gold-EG can be understood only
when modifications of both electron phonon dispersion in
gold-EG are considered (supplementary material, Fig. S3).
D. Decoupling of epitaxial graphene
The intercalation of gold atoms between the buffer layer
and monolayer graphene reduces the interaction of the top
layer graphene with its substrate and locally screens the
charge transfer from the substrate. It is evident from the
steeper phonon dispersion in gold–EG that the no covalent
interaction between gold clusters and carbon atoms in mono-
layer graphene and covalent bonding exists only between
SiC and buffer layer C atoms. It has been known that a
charge transfer between the medium surrounding graphene
or hybridisation of the p-bands of graphene between
adsorbed species significantly reduces the Kohn anomaly
(i.e., non-analytic points in the phonon dispersion curves in
the vicinity of K and C points of the Brillouin zone, where a
steeper phonon dispersion is observed due to electron-
phonon interactions). This reduces the slope of the spectral
dispersion of the Raman 2D modes.44 However, the observed
increase in the phonon dispersion slope in the current case
indicates that the intercalated gold atoms favour a restoration
of the band structure of EG towards an ideal graphene band
structure. In the present study, the linear part of the phonon
dispersion is probed using laser energies in the range of
1.5–2.5 eV, the slope of the phonon dispersion could be
higher in the vicinity of the K point.
IV. CONCLUSION
In conclusion, a Raman study of pristine and gold inter-
calated epitaxial graphene system reveals a prevailing laser
excitation energy dependent red shift in the phonon modes
of Gold intercalated system. In order to understand this
behaviour, contributions from strain in graphene, doping,
and modification of the phonon dispersion due to intercalated
gold atoms are considered and finally reveal that the
observed behaviour can only be explained on the basis of a
modification of the phonon band structure in gold interca-
lated epitaxial graphene. Reduced charge transfer and inter-
action with the substrate favours restoration of electronic
bands in graphene intercalated with gold clusters towards
nearly free standing graphene and presents steeper slopes for
the iTO branch along the K-M direction. The experimental
data support the premise of strong modifications of the pho-
non band structure of gold intercalated graphene.
ACKNOWLEDGMENTS
This work as part of the European Science Foundation
EUROCORES Programme DEWINT was funded under
Contract No. ERAS-CT-2003-980409.
1A. C. Neto and N. M. Peres, Phys. World 19, 33 (2006).2F. Schwierz, Nat. Nanotechnol. 5, 487 (2010).3M. Sprinkle, M. Ruan, Y. Hu, J. Hankinson, M. Rubio-Roy, B. Zhang, X.
Wu, C. Berger, and W. A. de Heer, Nat. Nanotechnol. 5, 727 (2010).4S. Bae, H. Kim, Y. Lee, X. Xu, J.-S. Park, Y. Zheng, J. Balakrishnan, T.
Lei, H. R. Kim, Y. I. Song et al., Nat. Nanotechnol. 5, 574 (2010).5M. I. Katsnelson, K. S. Novoselov, and A. K. Geim, Nat. Phys. 2, 620
(2006).6M. J. Word, I. Adesida, and P. R. Berger, J. Vac. Sci. Technol., B 21, L12
(2003).7M. Yang, A. Nurbawono, C. Zhang, and Y. P. Feng, Appl. Phys. Lett. 96,
193115 (2010).8M. Cranney, F. Vonau, P. B. Pillai, E. Denys, D. Aubel, M. M. De Souza,
C. Bena, and L. Simon, Europhys. Lett. 91, 66004 (2010).9M. Gao, Y. Pan, C. Zhang, H. Hu, R. Yang, H. Lu, J. Cai, S. Du, F. Liu,
and H.-J. Gao, Appl. Phys. Lett. 96, 053109 (2010).10M. Yankowitz, J. Xue, D. Cormode, J. D. Sanchez-Yamagishi, K.
Watanabe, T. Taniguchi, P. Jarillo-Herrero, P. Jacquod, and B. J. LeRoy,
Nat. Phys. 8, 382 (2012).11Z.-G. Chen, Z. Shi, W. Yang, X. Lu, Y. Lai, H. Yan, F. Wang, G. Zhang,
and Z. Li, Nat. Commun. 5, 4461 (2014).12C.-H. Park, L. Yang, Y.-W. Son, M. L. Cohen, and S. G. Louie, Nat. Phys.
4, 213 (2008).13B. Premlal, M. Cranney, F. Vonau, D. Aubel, D. Casterman, M. M. De
Souza, and L. Simon, Appl. Phys. Lett. 94, 263115 (2009).14K. V. Emtsev, F. Speck, Th. Seyller, L. Ley, and J. D. Riley, Phys. Rev. B 77,
155303 (2008).15I. Gierz, T. Suzuki, R. T. Weitz, D. S. Lee, B. Krauss, C. Riedl, U. Starke,
H. H€ochst, J. H. Smet, C. R. Ast, and K. Kern, Phys. Rev. B 81, 235408
(2010).16M. N. Nair, M. Cranney, F. Vonau, D. Aubel, P. L. Fevre, A. Tejeda, F.
Bertran, A. Taleb-Ibrahimi, and L. Simon, Phys. Rev. B 85, 245421
(2012).17See www.wsi.tum.de/nextnano3 and www.nextnano.de for NEXTNANO3
device simulator.18S. Reich, J. Maultzsch, C. Thomsen, and P. Ordej�on, “Tight-binding
description of graphene,” Phys. Rev. B 66, 035412 (2002).19I. Horcas, R. Fern�andez, J. M. G�omez-Rodr�ıguez, J. Colchero, J. G�omez-
Herrero, and A. M. Baro, Rev. Sci. Instrum. 78, 013705 (2007).20C. Thomsen and S. Reich, Phys. Rev. Lett. 85, 5214 (2000).
183103-7 Pillai et al. J. Appl. Phys. 117, 183103 (2015)
Reuse of AIP Publishing content is subject to the terms at: https://publishing.aip.org/authors/rights-and-permissions. Download to IP: 143.167.185.76 On: Wed, 27 Apr 2016
10:08:19

21R. Saito, A. Jorio, A. G. Souza Filho, G. Dresselhaus, M. S. Dresselhaus,
and M. A. Pimenta, Phys. Rev. Lett. 88, 027401 (2001).22L. M. Malard, M. A. Pimenta, G. Dresselhaus, and M. S. Dresselhaus,
Phys. Rep. 473, 51 (2009).23F. Tuinstra, J. Chem. Phys. 53, 1126 (1970).24J. Maultzsch, S. Reich, and C. Thomsen, Phys. Rev. B 70, 155403 (2004).25R. Narula, N. Bonini, N. Marzari, and S. Reich, Phys. Rev. B 85, 115451
(2012).26S.-M. Choi, S.-H. Jhi, and Y.-W. Son, Phys. Rev. B 81, 081407 (2010).27M. Mohr, J. Maultzsch, and C. Thomsen, Phys. Rev. B 82, 201409
(2010).28O. Frank, M. Mohr, J. Maultzsch, C. Thomsen, I. Riaz, R. Jalil, K. S.
Novoselov, G. Tsoukleri, J. Parthenios, K. Papagelis et al., ACS Nano 5,
2231 (2011).29M. Huang, H. Yan, T. F. Heinz, and J. Hone, Nano Lett. 10, 4074 (2010).30D. Yoon, Y.-W. Son, and H. Cheong, Phys. Rev. Lett. 106, 155502
(2011).31D. Yoon, H. Moon, Y.-W. Son, B. H. Park, J. B. Kim, Y. Lee, and H.
Cheong, Nano Lett. 8, 4270 (2008).32T. Mohiuddin, A. Lombardo, R. Nair, A. Bonetti, G. Savini, R. Jalil, N.
Bonini, D. Basko, C. Galiotis, and N. Marzari, Phys. Rev. B 79, 205433
(2009).33D. M. Basko, Phys. Rev. B 78, 125418 (2008).
34S. Berciaud, X. Li, H. Htoon, L. E. Brus, S. K. Doorn, and T. F. Heinz,
Nano Lett. 13, 3517 (2013).35J. E. Lee, G. Ahn, J. Shim, Y. S. Lee, and S. Ryu, Nat. Commun. 3, 1024
(2012).36C. Attaccalite, L. Wirtz, M. Lazzeri, F. Mauri, and A. Rubio, Nano Lett.
10, 1172 (2010).37A. Das, S. Pisana, B. Chakraborty, S. Piscanec, S. K. Saha, U. V.
Waghmare, K. S. Novoselov, H. R. Krishnamurthy, A. K. Geim, A. C.
Ferrari et al., Nat. Nanotechnol. 3, 210 (2008).38P. Venezuela, M. Lazzeri, and F. Mauri, Phys. Rev. B 84, 035433 (2011).39P. Poncharal, A. Ayari, T. Michel, and J.-L. Sauvajol, Phys. Rev. B 78,
113407 (2008).40F. de Juan and H. Fertig, Phys. Rev. B 85, 085441 (2012).41A. Gr€uneis, J. Serrano, A. Bosak, M. Lazzeri, S. L. Molodtsov, L. Wirtz, C.
Attaccalite, M. Krisch, A. Rubio, F. Mauri, and T. Pichler, Phys. Rev. B
80, 085423 (2009).42A. Gr€uneis, C. Attaccalite, A. Rubio, D. V. Vyalikh, S. L. Molodtsov, J.
Fink, R. Follath, W. Eberhardt, B. B€uchner, and T. Pichler, Phys. Rev. B
79, 205106 (2009).43See supplementary material at http://dx.doi.org/10.1063/1.4920931 for the
simulated Raman spectrum by considering only the modification in the
electronic structure of graphene.44A. Allard and L. Wirtz, Nano Lett. 10, 4335 (2010).
183103-8 Pillai et al. J. Appl. Phys. 117, 183103 (2015)
Reuse of AIP Publishing content is subject to the terms at: https://publishing.aip.org/authors/rights-and-permissions. Download to IP: 143.167.185.76 On: Wed, 27 Apr 2016
10:08:19