deconvolution of isobaric interference in icp-ms by...
TRANSCRIPT
References
Deconvolution of Isobaric Interference in ICP-MS by Peak Shape Calibration Technology
Zhi Xing1, Ming Gu2, and Yongdong Wang2
1Department of Chemistry, Tsinghua University, Beijing, China; 2Cerno Bioscience, Danbury, CT
Results and Discussion
Conclusions
1. Wang, Y. et al ASMS Procedings Formula Determination and Relative Quantitation from Overlapping Ion Signals, 2009
2. Gu, M et al, Current Trends In Mass Spectro-metry 2008, www.spectroscopyonline.com
3. Erve, J. C. L. et al, JASMS. Spectral Accuracy of Molecular Ions in an LTQ/Orbitrap Mass Spectrometer and Implications for ElementalComposition Determination, 2009, 20, 2058.
4.Gu, M et al, RCM Accurate mass filtering of ion chromatograms for metabolite identification using a unit mass resolution liquid chromatography/mass spectrometry system, 2006, 20, 764.
6
For this application, As as a standard was used for both mass and peak shape calibration to enable highly accurate isotope pattern matching for mixture analysis by deconvolution.
MassWorks Calibration+Spectral Accuracy
Calibration Standards
Test Samples/Ions
MS
Inst
rum
ent
(ope
ratin
g in
pro
file/
raw
mod
e)
Standard formulaC19H22NO
Calibration Function
Apply Calibration Function
Peak detection and accurate mass determination
260.163 ± 0.002Da
Raw MS
Calibrated MSRaw MS
List of possible formulas
Formula Exact Mass Error (mDa)
C14H20N4O 260.1637 -0.5C12H18N7 260.1624 0.8C13H24O5 260.1624 0.8C16H22NO2 260.1651 -1.9C17H24S 260.1599 3.3…
CLIPS Match: Theoretical and Calibrated MS
[C16H22NO2]
Data Acquisition: All data were acquired in survey mode with a mass range from 0 to 260. The experiments were designed to focus on the studies of As and its isobaric interference ArCl. A total of three datasets were collected including pure As standards at 1, 10, and 100 ppt; As standard at 1 ppt with addition of solution containing [ Cl- ] at 10, 100, 1000, 2000, 5000, and 10000 ppm; and As standard at 10 ppt plus [ Cl- ] at 100, 1000, 2000, 5000, and 10000 ppm. The raw data of ICP-MS were exported into text data format for MassWorks to process.
MassWorks processing: All the data were calibrated through a new mass spectral calibration that not only calibrates the m/z axis but, more importantly, calibrates the mass spectral peak shape. With the theoretical mass spectral responses for the ion of interest and possible interference ions known exactly, a multiple linear regression can be applied to any measured mass spectral response after the above calibration to arrive at the relative concentrations of these ions including both the unknown and the interference.
Quantitation of As: A quantitation calibration curve was generated by As standards at 1, 10, and 100 ppt. Through the calibration, deconvoluted As at 1 and 10 ppt levels spiked with [ Cl- ] interference were quantified.
Introduction
Methods
Much of ICP-MS development in the last twenty years has centered around collision cells for the physical removal of interferences through reaction chemistry. While quite useful and effective in real world applications, the use of collision cells and the associated chemistry does compromise the analytical sensitivity. In addition, there are interferences that are difficult to remove through chemical reactions even after extensive method development. In this paper, we report a new approach to quantify analyte of interest at presence of interference. Based on peak shape calibration technology, this approach has proved to be very effective to deconvolute overlapped ion signals such as the mixtures of 14C/12C in drug metabolism studies, molecular ions and their fragments (M-H) in EI GC/MS, the parent ions and their oxidized products. Since most of the interference occurred in ICP-MS is known and can be expressed by a chemical formula, the deconvolution can be readily implemented through the mixture search by MassWorks. We will demonstrate the deconvolution with the analysis of the mixtures of As and the interference ArCl at different concentration levels.
With peak shape calibration performed with As standard, symmetrical and mathematical well defined peak shape can be obtained for all ICP-MS spectra for the mixtures of As spiked with [ Cl- ] and allows accurate spectral deconvolution and quantitation of the mixtures.
Low concentration samples at 1 ppt levels showed significant signal variation due to their poor S/N ratio. Their S/N ratio can be improved by decreasing scan range from 0-260 to 70-80 for As related deconvolution.
Current version of MassWorks can perform three components mixture analysis. In a future release, multiple components, virtually unlimited components can be performed with the spectral deconvulotion.
Overview
A new deconvulotion method based on mass spectral peak shape calibration was developed for mixture analysis of overlapped ICP-MS data
On a unit mass resolution quadrupole ICP-MS instrument, As at 1 and 10 ppt with the interference ArCl at a various concentrationlevels were accurately quantified through the deconvulotion by MassWorks.
This calibration is then applied to all the ICP-MS data files to perform spectral deconvulotion to obtain quantitative information of As at the presence of ArCl interference by CLIPS search. To take ArCl as an experimentally designed only interference into account, the formula of ArCl needed to be input for the deconvulotion as shown in Fig 2. Since the peak shape of the spectra was calibrated to known mathematic function (Fig 3a) through the calibration, the best match between theoretically composite As and ArCl spectra and experimental spectra has been achieved with spectral accuracy of over 98%. This high spectral accuracy indeed confirmed the overlapped spectra were due to the signals from only As and ArCl. Their relative contribution to the total signal is accurately calculated by spectral deconvolution in a sample with 10 ppt spiked with
Fig 3. Raw, Calibrated, and Calculated Spectra of m/z 75
- Raw MS- Calibrated MSa
- Calibrated MS- Theoretical MSb
Fig 2. CLIPS Search Parameters
Fig 1. Mass and Peak Shape Calibration with As Standard at 100 ppt
Net Formula
Mono Mass
Closest Centroid
∆M(mDa) ∆M(ppm) Spectral Accuracy
As 74.9216 74.9211 -0.5469 -7.3 98.9
- Raw MS- Calibrated MS
b
a
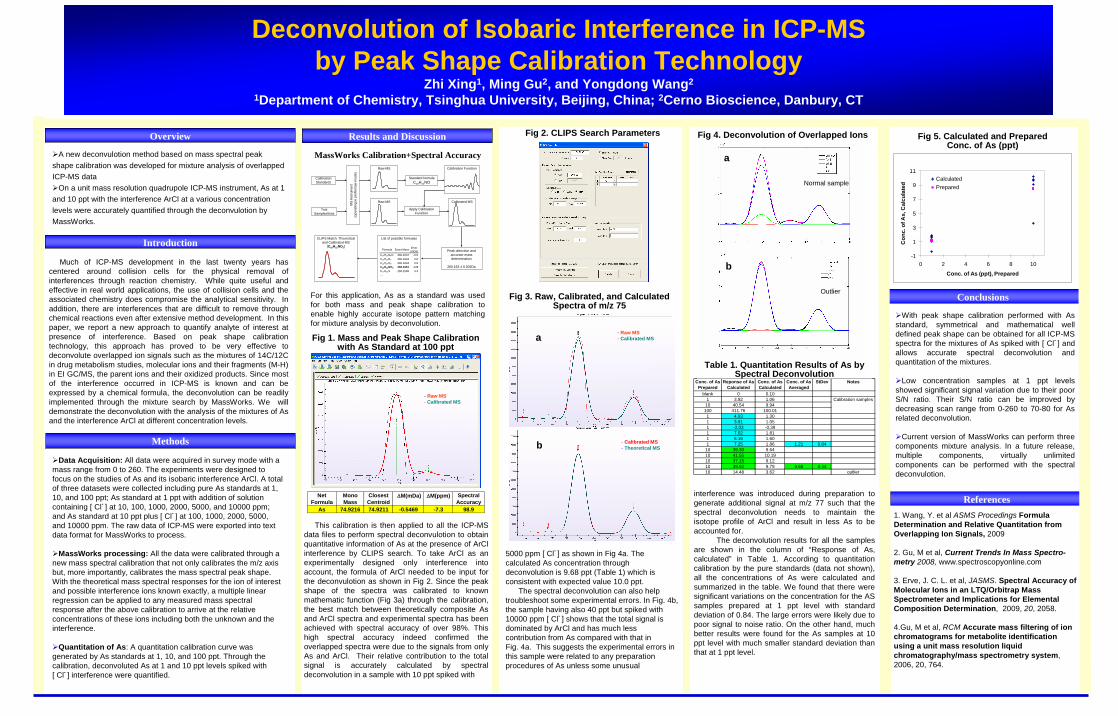
Fig 4. Deconvolution of Overlapped Ions
Normal sample
Outlier
Fig 5. Calculated and Prepared Conc. of As (ppt)
-1
1
3
5
7
9
11
0 2 4 6 8 10
Conc. of As (ppt), Prepared
Con
c. o
f As,
Cal
cula
ted
CalculatedPrepared
interference was introduced during preparation to generate additional signal at m/z 77 such that the spectral deconvolution needs to maintain the isotope profile of ArCl and result in less As to be accounted for.
The deconvolution results for all the samples are shown in the column of “Response of As, calculated” in Table 1. According to quantitation calibration by the pure standards (data not shown), all the concentrations of As were calculated and summarized in the table. We found that there were significant variations on the concentration for the AS samples prepared at 1 ppt level with standard deviation of 0.84. The large errors were likely due to poor signal to noise ratio. On the other hand, much better results were found for the As samples at 10 ppt level with much smaller standard deviation than that at 1 ppt level.
5000 ppm [ Cl- ] as shown in Fig 4a. The calculated As concentration through deconvolution is 9.68 ppt (Table 1) which is consistent with expected value 10.0 ppt.
The spectral deconvolution can also help troubleshoot some experimental errors. In Fig. 4b, the sample having also 40 ppt but spiked with 10000 ppm [ Cl- ] shows that the total signal is dominated by ArCl and has much less contribution from As compared with that in Fig. 4a. This suggests the experimental errors in this sample were related to any preparation procedures of As unless some unusual
Conc. of As Prepared
Reponse of As Calculated
Conc. of As Calculated
Conc. of As Averaged
StDev Notes
blank 0 0.101 3.92 1.06
10 40.54 9.94100 411.76 100.011 4.93 1.301 3.91 1.051 -2.03 -0.391 7.02 1.811 6.16 1.601 7.25 1.86 1.21 0.84
10 39.30 9.6410 41.55 10.1910 37.15 9.1210 39.92 9.79 9.68 0.4410 14.48 3.62 outlier
Calibration samples
Table 1. Quantitation Results of As by Spectral DeconvolutionTable 1. Quantitation Results of As by
Spectral Deconvolution