decoding the signaling of a gpcr heteromeric complex ... · heteromeric complex reveals a unifying...
TRANSCRIPT

Decoding the Signaling of a GPCRHeteromeric Complex Reveals a UnifyingMechanism of Action of Antipsychotic DrugsMiguel Fribourg,1,4 Jose L. Moreno,2 Terrell Holloway,2 Davide Provasi,1 Lia Baki,8 Rahul Mahajan,8 Gyu Park,8
Scott K. Adney,8 Candice Hatcher,8 Jose M. Eltit,8 Jeffrey D. Ruta,2 Laura Albizu,3 Zheng Li,1 Adrienne Umali,2
Jihyun Shim,7 Alexandre Fabiato,8 Alexander D. MacKerell Jr.,7 Vladimir Brezina,1,4,6 Stuart C. Sealfon,3,4,5,6
Marta Filizola,1 Javier Gonzalez-Maeso,2,3,6,* and Diomedes E. Logothetis8,*1Department of Structural and Chemical Biology2Department of Psychiatry3Department of Neurology4Department of Neuroscience5Center for Translational Systems Biology6Friedman Brain Institute
Mount Sinai School of Medicine, New York, NY 10029, USA7Pharmaceutical Sciences Department, University of Maryland School of Pharmacy, Baltimore, MD 21201, USA8Department of Physiology and Biophysics, Virginia Commonwealth University, School of Medicine, Richmond, VA 23298, USA
*Correspondence: [email protected] (J.G.-M.), [email protected] (D.E.L.)
DOI 10.1016/j.cell.2011.09.055
SUMMARY
Atypical antipsychotic drugs, such as clozapine andrisperidone, have a high affinity for the serotonin5-HT2A G protein-coupled receptor (GPCR), the2AR, which signals via a Gq heterotrimeric G protein.The closely related non-antipsychotic drugs, such asritanserin and methysergide, also block 2AR func-tion, but they lack comparable neuropsychologicaleffects. Why some but not all 2AR inhibitors exhibitantipsychotic properties remains unresolved. Wenow show that a heteromeric complex betweenthe 2AR and the Gi-linked GPCR, metabotropicglutamate 2 receptor (mGluR2), integrates ligandinput, modulating signaling output and behavioralchanges. Serotonergic and glutamatergic drugsbind the mGluR2/2AR heterocomplex, which thenbalances Gi- and Gq-dependent signaling. We findthat the mGluR2/2AR-mediated changes in Gi andGq activity predict the psychoactive behavioraleffects of a variety of pharmocological compounds.These observations provide mechanistic insightinto antipsychotic action that may advance thera-peutic strategies for disorders including schizo-phrenia and dementia.
INTRODUCTION
G protein-coupled receptors (GPCRs) are the most common
cellular targets for drugs used in the clinic (Rosenbaum et al.,
2009). Agonist binding is thought to induce distinct conforma-
C
tional changes that enable GPCRs to couple to and activate
specific heterotrimeric G proteins (Oldham and Hamm, 2008).
For example, 2AR is a Gq-coupled GPCR that responds to the
neurotransmitter serotonin (5-HT) (Gonzalez-Maeso and Seal-
fon, 2009), andmGluR2 is aGi-coupled, pertussis toxin-sensitive
GPCR that responds to the neurotransmitter glutamate (Glu)
(Moreno et al., 2009). Although considerable biochemical and
biophysical data are consistent with monomeric GPCRs binding
and activating G proteins (Ernst et al., 2007; Whorton et al.,
2007), several recent studies suggest that G protein coupling
in cell membranes involves the formation of homomeric and het-
eromeric GPCR complexes (Han et al., 2009; Lopez-Gimenez
et al., 2007; Carriba et al., 2008; Vilardaga et al., 2008). Oligo-
meric receptor complexes appear to exhibit distinct signaling
properties when compared to monomeric receptors (Urizar
et al., 2011; Milligan, 2009). The molecular mechanism(s)
responsible for such changes in pharmacology are poorly under-
stood, as is the physiological function of GPCR heteromeric
complexes.
Atypical antipsychotic drugs have a high affinity for the 2AR
(Meltzer et al., 1989; Meltzer and Huang, 2008) and are widely
used in the treatment of schizophrenia and other psychiatric
disorders (Ross et al., 2006). Interestingly, it has been recently
recognized that most clinically effective antipsychotic drugs
are, in fact, 2AR inverse agonists—ligands that preferentially
bind and stabilize a GPCR in an inactive conformational state
(Kenakin, 2002)—rather than simply neutral antagonists (Aloyo
et al., 2009; Egan et al., 1998; Weiner et al., 2001)—ligands
that compete for the same orthosteric binding site and prevent
the cellular responses induced by agonists and inverse agonists.
The mechanism underlying the antipsychotic effects of 2AR
inverse agonism has not yet been elucidated.
A new class of potential antipsychotic drugs acting as agonists
of mGluR2 recently received attention in preclinical (Woolley
ell 147, 1011–1023, November 23, 2011 ª2011 Elsevier Inc. 1011

et al., 2008) and clinical studies (Patil et al., 2007, Kinon et al.,
2011). Previous work demonstrated that mGluR2 and 2AR
form a specific heterocomplex in mammalian brain tissue (Gon-
zalez-Maeso et al., 2008; Rives et al., 2009). However, the
signaling properties of this receptor heterocomplex and its role
in transducing antipsychotic drug activity remain unclear. Here,
we compare G protein signaling coupled to the heteromeric
mGluR2/2AR complex with homomeric signaling through either
mGluR2 or 2AR. Our results provide insight into how Gi and Gq
signaling are integrated by this GPCR heteromer and uncover
a unifying mechanism of action of two families of antipsychotic
drugs that target themGluR2/2AR heteromeric complex. In addi-
tion, we provide a predictive metric for the anti- or propsychotic
effects of serotonergic and glutamatergic ligands.
RESULTS
Heteromeric Assembly of mGluR2 and 2AR EnhancesGlutamate-Elicited Gi Signaling and Reduces5-HT-Elicited Gq Signaling2AR andmGluR2 proteins colocalize inmouse cortical slices and
neuronal primary cultures (Figure 1A and Figure S1E available
online). In addition, the two receptors can be coimmunoprecipi-
tated from mouse frontal cortex (Figure 1B). To investigate the
signaling properties of the mGluR2/2AR heterocomplex, we
utilized a Xenopus oocyte heterologous expression system
(Barela et al., 2006). We expressed each of these GPCRs alone
or together and used inhibition of the IRK3 (Kir2.3) current to
monitor 2AR-elicited Gq activity (Figure 1C, left) (Du et al.,
2004) and activation of the GIRK4* (or Kir3.4*) current to monitor
mGluR2-elicited Gi activity (Figure 1C, right) (He et al., 1999,
2002) (see Experimental Procedures).
How do the signaling properties of the mGluR2/2AR hetero-
meric complex differ from those of the homomeric receptors?
We first quantified the Gi and Gq activities evoked by Glu and
5-HT, the endogenous ligands of the mGluR2 and 2AR recep-
tors, respectively, and compared these values to Gi and Gq
activities in the absence or presence of the heteromeric receptor
partner (Figures 1C–1E). Coexpression of mGluR2 with the 2AR
reduced 5-HT-elicited Gq activity by approximately 50%
(Figures 1C, left panel and 1D). In contrast, coexpression of
mGluR2 with the 2AR increased the Glu-elicited Gi activity by
nearly 200% (Figure 1C, right panel and 1E).
The metabotropic glutamate receptor 3 (mGluR3), which
shares a high degree of homology with mGluR2, does not form
a receptor heterocomplex with the 2AR. Exchanging the trans-
membrane (TM) domains of mGluR2 and mGluR3 either disrupts
(mGluR2D) or rescues (mGluR3D) mGluR2/2AR receptor com-
plex formation and 2AR-mediated cross-signaling (i.e., Gi sig-
naling) (Gonzalez-Maeso et al., 2008). mGluR2D activation does
not evoke the Gi and Gq signaling outputs associated with the
mGluR2/2AR heteromer, whereas mGluR3D activation induces
an increase in Gi- and decrease in Gq-dependent signaling
(Figures S1A–S1D). Each of the mGluR chimeras, when ex-
pressed as homomers, showed intact Gi signaling (Figures
S2A–S2C) and cell-surface localization (Figure S2D). Together
these findings suggest that the heteromeric receptor couples Gi
and Gq outputs to influence downstream signaling events.
1012 Cell 147, 1011–1023, November 23, 2011 ª2011 Elsevier Inc.
To summarize the difference between Gi and Gq signaling
evoked by the mGluR2/2AR heteromers, we developed a metric
called the balance index (BI). The BI combines the change in
Gi activity (DGi) and the change in Gq activity (DGq), such that
BI = DGi � DGq (Figure 1F). We used homomeric Gi and Gq
signaling levels to normalize the data and found that without
stimulation, the mGluR2/2AR complex yielded a BI of 1.45,
which we use as the reference BI level (BIr). We obtained the
largest BIr when expressing mGluR2/2AR mRNAs in a 1:2 ratio
(Figure S3D). As shown in Figure S3C, this ratio of mRNAs
yielded a cell-surface localization of receptor protein levels that
suggested a higher-order oligomeric complex between mGluR2
and 2AR (see Figures S3A and S3B).
Drugs that Bind 2AR Alter the Balance between Giand Gq SignalingWe next asked whether drugs bound to one receptor of the
heteromer could affect the other receptor’s signaling response
to its endogenous ligand. We first investigated the effects of
2AR ligands (a neutral antagonist, a strong agonist, and an
inverse agonist) on Glu-elicited Gi signaling by mGluR2. We
define DOI as a strong agonist because it evokes greater Gq sig-
naling through 2AR than the endogenous ligand, 5-HT (Figures
2A, 2B, and S4A). In control experiments, the strong agonist
(DOI), the neutral antagonist (methysergide), and the inverse
agonist (clozapine) (Weiner et al., 2001) worked as expected to
stimulate or reduce 5-HT-induced Gq signaling, respectively
(Figure 2A).
Occupancy of the 2AR by either methysergide, DOI, or cloza-
pine had different effects on Glu-elicited signaling through
mGluR2 (Figure 2B, blue bars). Although Glu-elicited Gi sig-
naling was not altered by 5-HT or methysergide, it was de-
creased back to baseline by DOI and increased by approxi-
mately 40% (240% greater than homomeric levels) by clozapine
(Figure 2B).
Using the results obtained for Gi (Figure 2B, blue bars) and Gq
signaling (Figures 2A and 2B, red bars), we calculated the BI
values for the three ligands in the presence of the endogenous
ligands (Figure 2C). The changes evoked by these three drugs
were abrogated by mGluR2D or mimicked by mGluR3D (see
Table S1), and they were present when the Gq pathway was
blocked by the regulator of G protein signaling subunit 2
(RGS2) (Figures S5D and S5E). The 2AR ligand with the largest
overall BI was the inverse agonist clozapine (BI = 2.30; 140%
increase in Gi and 100% decrease in Gq).
Could these ligands exert their effects by stabilizing different
conformations of the receptor complex? To address this ques-
tion, we investigated the conformational changes induced by
the three 2AR ligands in molecular models of 2AR alone or com-
plexed with mGluR2. To observe large conformational changes
in relatively short timescales, we used a combination of adia-
batic-biased molecular dynamics (ABMD) and metadynamics
simulations (see ‘‘Computational Methods’’ in Experimental
Procedures). This approach was recently validated on a proto-
typic GPCR (Provasi et al., 2011). First, we studied the effects
of methysergide, DOI, and clozapine on the activation free-
energy profile of a protomeric 2AR (see Figure 2D, top) and iden-
tified the most energetically favorable 2AR state for each ligand.

Figure 1. Heteromeric Assembly of 2AR and mGluR2 Enhances Glu-Induced Gi Signaling and Reduces 5-HT-Induced Gq Signaling
(A) Representative micrographs showing coexpression of endogenous 2AR (red) and mGluR2 (green) in mouse frontal cortex (left panels) and mouse cortical
primary neurons (right panels). Scale bar, 25 mm. See also Figure S1E. 2AR and mGlu2 colocalize and form a receptor complex in mouse frontal cortex.
(B) Mouse frontal cortex membrane preparations were immunoprecipitated (IP) with anti-2AR antibody. Immunoprecipitates were analyzed by western blot (WB)
with anti-mGluR2 antibody (lower blot). Mouse frontal cortex membrane preparations were also directly analyzed by WB with anti-2AR antibody (upper blot) or
anti-mGluR2 antibody (middle blot). 2AR-KO and mGluR2-KO mouse frontal cortex tissue samples were processed identically and used as negative controls.
Frontal cortex tissue samples from 2AR-KO and mGluR2-KO mice were also homogenized together (mixed) and processed identically for immunoprecipitation
and WB.
(C) Representative barium-sensitive traces of IRK3 currents obtained in response to 1 mM 5-HT in oocytes expressing 2AR alone, mGluR2 and 2AR together, or
mGluR2 alone (left). Representative barium-sensitive traces of GIRK4* currents obtained in response to 1 mMGlu in oocytes expressing mGluR2 alone, mGluR2
and 2AR together, or 2AR alone (right). Barium (Ba) inhibited IRK3 and GIRK4* currents and allowed for subtraction of IRK3- and GIRK4*-independent currents.
For illustrative purposes, traces with similar basal currents were chosen.
Summary bar graphs of (D) Gq activity measured as IRK3 current inhibition (mean ± standard error of the mean [SEM]) following stimulation with 5-HT and (E) Gi
activity measured as GIRK4* current activation (mean ± SEM) following stimulation with Glu. IRK3 current inhibition was measured relative to basal currents and
was normalized relative to that obtained by stimulating 2AR alone with 5-HT (100% or 1). GIRK4* current activation was measured relative to the basal currents
and was normalized relative to that obtained by stimulating mGluR2 alone with Glu (100% or 1).
(F) Calculation of the BI as the difference of the increase in Gi signaling in response to Glu from the mGluR2 homomeric level (DGi) and the decrease of Gq
signaling in response to 5-HT from the 2AR homomeric level (DGq). A reference BI (Bir = 1.45) was calculated for the mGluR2/2AR complex in response to 1 mM
Glu and 1 mM 5-HT using mean values (**p < 0.01, ***p < 0.001). Error bars depict standard error of the mean (SEM).
See also Figures S1, S2, and S3.
In agreement with known efficacies of these ligands, the cloza-
pine-bound 2AR conformation is inactive (i.e., 2RH1-like), the
DOI-bound 2AR conformation is active (i.e., 3P0G-like), and
the methysergide-bound conformation adopts an inactive state
C
that is structurally different from the inactive state stabilized by
clozapine.
To provide a structural context for the crosstalk between
2AR and mGluR2, we studied the effects of the three 2AR
ell 147, 1011–1023, November 23, 2011 ª2011 Elsevier Inc. 1013

Figure 2. Drugs that Target 2AR: Integrative Effects on Gi and Gq Signaling
(A) SummarybargraphsofGi activity (mean±SEM)measured in oocytesexpressingmGluR2/2AR following stimulationwith1mM5-HTaloneor togetherwith10mM
methysergide, 10 mMDOI, or 10 mM clozapine. Gq activity was normalized relative to that obtained by stimulation of 2AR alone with 5-HT (100% or 1, dotted line).
(B) Summary bar graphs of Gi activity (top) and Gq activity (bottom) (mean ± SEM) measured in oocytes expressing mGluR2/2AR following stimulation with 1 mM
Glu alone or together with 10 mM methysergide, 10 mM DOI, or 10 mM clozapine. Gi and Gq activity was normalized relative to the response to Glu and 5-HT,
respectively (100% or 1, dotted line).
(C) DGi referenced to the homomeric mGluR2 response to 1 mM Glu and DGq referenced to the homomeric 2AR response to 1 mM 5-HT together with 10 mM
methysergide, 10 mM DOI, or 10 mM clozapine (**p < 0.01, ***p < 0.01, n.s.: not significant). Data are mean ± SEM.
(D) Metadynamics-based mechanistic interpretation of functional crosstalk between 2AR and mGluR2. (Top) Activation profile of 2AR in the presence of different
ligands. Free energy of the 2AR bound to the inverse agonist clozapine (green), the neutral antagonist methysergide (purple), and the dominant agonist DOI
(orange), as a function of the position along the path connecting the inactive (s = 1) to the active (s = 8) states, is shown. (Bottom) Activation profile ofmGluR2 in the
presence of the different ligand-specific 2AR conformations. The three lines correspond to the activation free-energy profile of mGluR2 in dimeric complex
through a TM4-TM4 interface with 2AR bound to the inverse agonist clozapine (green line), a TM4,5-TM4,5 interface with 2AR bound to the neutral antagonist
methysergide (purple), and a TM4,5-TM4,5 interface with 2AR bound to the dominant agonist DOI (orange line). Themost energetically stable states are indicated
by a star, and the chemical structures of the three drugs are also shown.
ligands on mGluR2 conformations in the dimeric complex. Fig-
ure 2D (bottom) shows that when clozapine is bound to 2AR,
the mGluR2 equilibrium shifts toward an activated conformation
(i.e., 3DBQ-like), consistent with functional upmodulation of Gi
signaling. In contrast, when methysergide and DOI are bound to
2AR, mGluR2 is stabilized in inactive states (i.e., 1U19-like).
Although no significant energetic and structural differences
were noted between the TM regions of these inactive states,
the functional downmodulation of Gi signaling induced by DOI,
but notbymethysergide,maybeascribed todifferent interactions
between the receptor loop regions and the G protein, which are
1014 Cell 147, 1011–1023, November 23, 2011 ª2011 Elsevier Inc.
not taken into account in our simulations. The functional predic-
tions from this computational approach can be used to guide
structure-based rational discovery of novel ‘‘biased’’ drugs that
are capable of selectively activating specific signaling pathways.
Together, these results indicate that formation of the hetero-
mer enables modulation of the mGluR2-Gi response by 2AR
ligands. Whereas drugs such as the strong 2AR agonist DOI
can greatly stimulate Gq signaling and decrease Gi signaling
(henceforth referred to as dominant agonists), inverse agonists,
such as clozapine, have the opposite effect, abolishing Gq and
increasing Gi signaling.

Figure 3. Drugs that Target mGluR2: Integrative Effects on Gi and Gq Signaling
(A) Summary bar graphs of Gi activity (mean ± SEM) measured in oocytes expressing mGluR2/2AR following stimulation with 1 mM Glu alone or together with
10 mM eGlu, 10 mM LY37, or 10 mM LY34. Gi activity was normalized relative to that obtained by stimulation of mGluR2 alone with 5-HT (100% or 1, dotted line).
(B) Summary bar graphs of Gq activity (red) and Gi activity (blue) (mean ± SEM) measured in oocytes expressing mGluR2/2AR following stimulation with 1 mM
5-HT alone or together with 10 mM eGlu, 10 mM LY37, or 10 mMLY34. Gq and Gi activities were normalized relative to the response to 5-HT and Glu, respectively
(100% or 1, dotted line).
(C) DGi referenced to the homomeric mGluR2 response to 1 mM Glu and DGq referenced to the homomeric 2AR response to 1 mM 5-HT together with 10 mM
methysergide, 10 mM DOI, or 10 mM clozapine (**p < 0.01, ***p < 0.01, n.s.: not significant). Data are mean ± SEM.
See also Figures S4 and S5.
Drugs that Bind mGluR2 Alter the Balance between Giand Gq SignalingHow do drugs bound to the mGluR2 component of the hetero-
mer affect the 5-HT-elicited Gq signaling of the 2AR? Neutral
antagonist ethylglutamic acid (eGlu), the strong agonist (LY37)
(Figure S4B), and the inverse agonist (LY34) (Figure S4C) worked
as expected to reduce, stimulate, or abolish Glu-elicited Gi
signaling through mGluR2, respectively (Figure 3A). Consistent
with its inverse-agonist properties, LY34 not only completely
abolished Gi signaling but also reduced the basal Gi activity of
the mGluR2 receptor even in the absence of Glu (Figure S4C).
Occupancy of the mGluR2 receptor by each of the three
ligands influenced the 2AR signaling. Relative to the homomeric
2AR levels, formation of the complex reduced the extent of
Gq signaling by 50% (Figures 3B, 1D, and 1F). Although 5-HT-eli-
cited Gq signaling was unaffected by Glu or eGlu, it was further
decreased by LY37 and restored to near-homomeric levels by
LY34 (Figure 3B).
C
Using the data shown for Gi (Figures 3A and 3B, blue bars) and
Gq signaling (Figure 3B, red bars), we calculated the BI values for
the three ligands (Figure 3C). Aswith 2ARdrugs, the neutral antag-
onist eGlu only affected the mGluR2 side of signaling. The strong
agonist LY37, however, affected both types of signaling through
the complex and showed a dominant-agonist behavior as defined
previously. Furthermore, LY37, like DOI, cross-signaled and eli-
cited Gq signaling in the absence of Glu and 5-HT, respectively
(FiguresS4F andS4G). The inverse agonist LY34 had the opposite
two effects: it blocked Gi but also potentiated Gq signaling,
achieving almost 2AR homomeric levels (83%). All effects were
disrupted when replacing mGluR2 by mGluR2D or rescued by
mGluR3D (see Table S1), and they were present when the Gi
pathway was blocked by pertussis toxin (PTX) (Figures S5A–
S5C). The largest overall signaling difference between Gi and Gq
was obtained by the dominant agonist LY37 (BI = 2.10).
In summary, the formation of the heteromeric complex favors
Gi over Gq signaling by endogenous ligands. Dominant agonists
ell 147, 1011–1023, November 23, 2011 ª2011 Elsevier Inc. 1015

Figure 4. Use of BI to Classify Anti-/Propsychotic Propensity of
Drugs Targeting the mGluR2/2AR Complex
Correlation maps between the BI and percentage of Gi-Gq balance loss or
recovery for different drugs assuming a fractional occupancy of the heteromer
by the drug of 0.5 (see Experimental Procedures). BIs were calculated for
10 mM (BI10) (A) and 50 mM (BI50) (B) concentrations of the drugs together with
1 mM Glu and 1 mM 5-HT and placed accordingly in the horizontal axis. BIr =
1.45 corresponds to zero. Effects on the difference between Gi and Gq
signaling are shown for drugs with known antipsychotic effects like clozapine,
risperidone, and LY37, for ritanserin, an antidepressant, for neutral antagonists
methysergide and eGlu, for the psychedelic DOI, and for the propsychotic
LY34 (see also Table S1). Error bars depict SEM.
enhance signaling through the receptor they target as part of the
complex but inhibit signaling of the heteromeric receptor
partner. Inverse agonists inhibit signaling through the receptor
they target as part of the complex but enhance signaling of the
heteromeric receptor partner.
The BI Predicts the Anti- or Propsychotic Activityof Drugs Targeting mGluR2 or 2AROur results in Figures 2 and 3 indicate that although clozapine
and LY37 act on different receptors, both drugs act through
1016 Cell 147, 1011–1023, November 23, 2011 ª2011 Elsevier Inc.
the mGluR2/2AR complex to achieve a similar effect—an
increase in Gi activity with a concomitant decrease in Gq activity.
To test whether the psychoactive effects of specific drugs corre-
lated with differences in the levels of Gi and Gq activity that they
induced, we calculated BI values for multiple drugs. For mGluR2,
in addition to the dominant agonist LY37, we tested the neutral
antagonist eGlu and the inverse agonist LY34, a drug that has
been shown to increase locomotor activity and exploratory
behavior in mice and might be propsychotic (Bespalov et al.,
2007). For 2AR, besides the inverse agonist clozapine, we tested
the following: risperidone, another widely used atypical antipsy-
chotic like clozapine; ritanserin, an antidepressant also used
as an adjuvant therapeutic for schizophrenia; methysergide,
a neutral antagonist mainly used for migraines; and DOI, a prop-
sychotic drug with lysergic acid diethylamide (LSD)-like effects.
In the presence of endogenous ligands and absence of drugs,
the difference between Gi and Gq signaling is naturally kept in
a balance that favors Gi over Gq (BIr). We set the reference level
of the BI scale to BIr = 1.45 and compared the relative effect of
different drugs on the BI, assuming a 50% occupancy of the
receptor by the drug (see Gi-Gq recovery/loss calculation in
Experimental Procedures). Results from drugs that target
mGluR2 (blue icons), versus those that target 2AR (red icons),
are plotted in Figure 4.
Drugs with the most effective antipsychotic properties,
regardless of the receptor they target (2AR: clozapine, risperi-
done; mGluR2: LY37), show the highest BI values. In contrast,
drugs with the most effective propsychotic properties (2AR:
DOI; mGluR2: LY34) show the lowest BI values (Figure 4 and
Table S2). All of these drugs are either dominant agonists (anti-
psychotic for mGluR2 and propsychotic for 2AR) or inverse
agonists (antipsychotic for 2AR and propsychotic for mGluR2).
Inverse-Agonist Upmodulation Occurs in Mouse FrontalCortexTo study the relevance of mGluR2/2AR heteromer signaling
in vivo, we examined the pattern of G protein coupling in mouse
frontal cortex, a region that plays an important role in schizo-
phrenia and antipsychotic action (Gonzalez-Maeso and Sealfon,
2009). We first measured the mGluR2/2AR complex-dependent
upmodulation of Gi signaling by a 2AR inverse agonist.
Membrane preparations from mouse frontal cortex were incu-
batedwith the inverse agonist clozapine or the neutral antagonist
methysergide (Figures S4D and S4E), together with DCG-IV,
a selective mGluR2/3 agonist. Clozapine increased the DCG-
IV-mediated Gi signaling (Figure 5A), whereas methysergide
did not significantly affect Gi signaling (Figure 5B). Furthermore,
clozapine failed to increase the DCG-IV-mediated Gi signaling in
frontal cortex membrane preparations from 2AR knockout (KO,
Htr2a�/�) mice (Figure S6C; see also Figures S6A and S6B for
LY37-dependent activation of Gq in wild-type but not in
2AR-KO mouse frontal cortex).
We also tested the mGluR2 inverse-agonist upmodulation of
Gq signaling in cortical primary cultures. Stimulation of Gq
signaling in neurons is known to elicit a transient increase of
intracellular calcium via an IP3-mediated Ca2+ release from the
endoplasmic reticulum (ER) that can be recorded using fluores-
cent calcium-sensitive dyes (Pichon et al., 2010). As predicted,
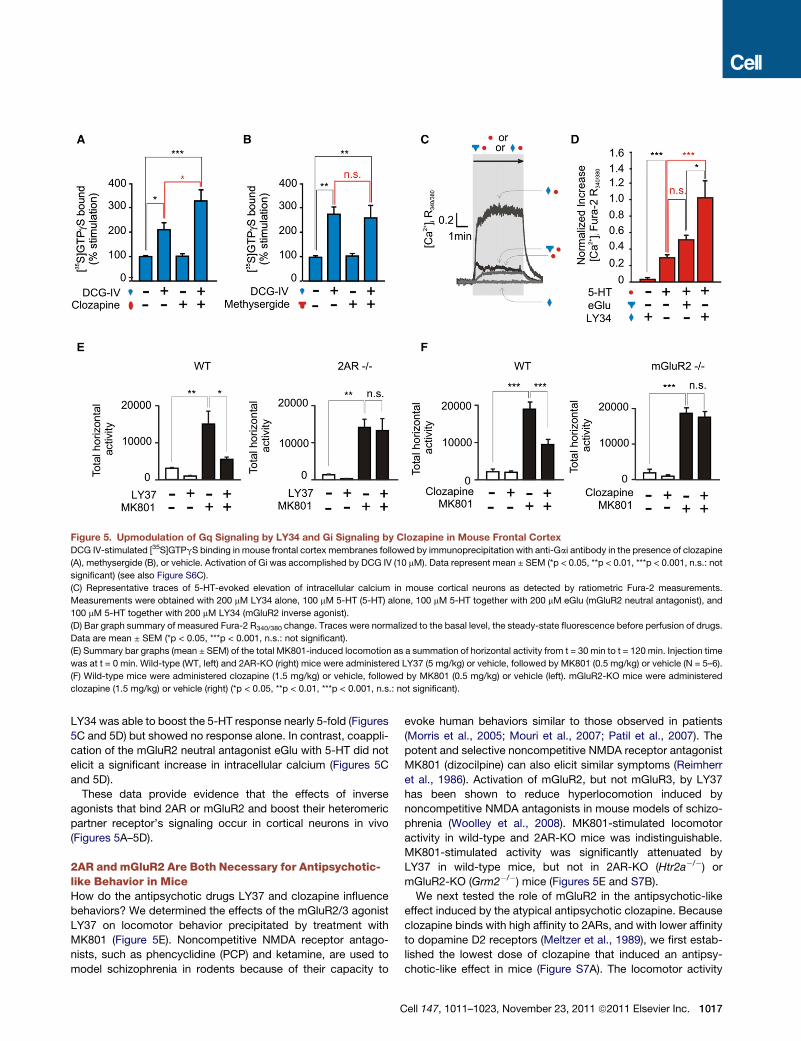
Figure 5. Upmodulation of Gq Signaling by LY34 and Gi Signaling by Clozapine in Mouse Frontal Cortex
DCG IV-stimulated [35S]GTPgS binding in mouse frontal cortex membranes followed by immunoprecipitation with anti-Gai antibody in the presence of clozapine
(A), methysergide (B), or vehicle. Activation of Gi was accomplished by DCG IV (10 mM). Data represent mean ± SEM (*p < 0.05, **p < 0.01, ***p < 0.001, n.s.: not
significant) (see also Figure S6C).
(C) Representative traces of 5-HT-evoked elevation of intracellular calcium in mouse cortical neurons as detected by ratiometric Fura-2 measurements.
Measurements were obtained with 200 mM LY34 alone, 100 mM 5-HT (5-HT) alone, 100 mM 5-HT together with 200 mM eGlu (mGluR2 neutral antagonist), and
100 mM 5-HT together with 200 mM LY34 (mGluR2 inverse agonist).
(D) Bar graph summary of measured Fura-2 R340/380 change. Traces were normalized to the basal level, the steady-state fluorescence before perfusion of drugs.
Data are mean ± SEM (*p < 0.05, ***p < 0.001, n.s.: not significant).
(E) Summary bar graphs (mean ± SEM) of the total MK801-induced locomotion as a summation of horizontal activity from t = 30 min to t = 120 min. Injection time
was at t = 0 min. Wild-type (WT, left) and 2AR-KO (right) mice were administered LY37 (5 mg/kg) or vehicle, followed by MK801 (0.5 mg/kg) or vehicle (N = 5–6).
(F) Wild-type mice were administered clozapine (1.5 mg/kg) or vehicle, followed by MK801 (0.5 mg/kg) or vehicle (left). mGluR2-KO mice were administered
clozapine (1.5 mg/kg) or vehicle (right) (*p < 0.05, **p < 0.01, ***p < 0.001, n.s.: not significant).
LY34 was able to boost the 5-HT response nearly 5-fold (Figures
5C and 5D) but showed no response alone. In contrast, coappli-
cation of the mGluR2 neutral antagonist eGlu with 5-HT did not
elicit a significant increase in intracellular calcium (Figures 5C
and 5D).
These data provide evidence that the effects of inverse
agonists that bind 2AR or mGluR2 and boost their heteromeric
partner receptor’s signaling occur in cortical neurons in vivo
(Figures 5A–5D).
2AR and mGluR2 Are Both Necessary for Antipsychotic-like Behavior in MiceHow do the antipsychotic drugs LY37 and clozapine influence
behaviors? We determined the effects of the mGluR2/3 agonist
LY37 on locomotor behavior precipitated by treatment with
MK801 (Figure 5E). Noncompetitive NMDA receptor antago-
nists, such as phencyclidine (PCP) and ketamine, are used to
model schizophrenia in rodents because of their capacity to
C
evoke human behaviors similar to those observed in patients
(Morris et al., 2005; Mouri et al., 2007; Patil et al., 2007). The
potent and selective noncompetitive NMDA receptor antagonist
MK801 (dizocilpine) can also elicit similar symptoms (Reimherr
et al., 1986). Activation of mGluR2, but not mGluR3, by LY37
has been shown to reduce hyperlocomotion induced by
noncompetitive NMDA antagonists in mouse models of schizo-
phrenia (Woolley et al., 2008). MK801-stimulated locomotor
activity in wild-type and 2AR-KO mice was indistinguishable.
MK801-stimulated activity was significantly attenuated by
LY37 in wild-type mice, but not in 2AR-KO (Htr2a�/�) or
mGluR2-KO (Grm2�/�) mice (Figures 5E and S7B).
We next tested the role of mGluR2 in the antipsychotic-like
effect induced by the atypical antipsychotic clozapine. Because
clozapine binds with high affinity to 2ARs, and with lower affinity
to dopamine D2 receptors (Meltzer et al., 1989), we first estab-
lished the lowest dose of clozapine that induced an antipsy-
chotic-like effect in mice (Figure S7A). The locomotor activity
ell 147, 1011–1023, November 23, 2011 ª2011 Elsevier Inc. 1017

Figure 6. Control of BI through a Drug Combination Approach
(A) BI calculations at 50 mMconcentrations of ligands. DGi referenced to the homomeric mGluR2 (1 ng of mRNA) response to 1 mMGlu and DGq referenced to the
homomeric 2AR (2 ng of RNA) response to 1 mM 5-HT and 1 mM Glu. Responses to a concentration of 50 mM clozapine, LY37, or LY37 together with clozapine
were measured in oocytes injected with 1 ng mGluR2 mRNA and 1 ng (left), 2 ng (center), and 3 ng (right) 2AR mRNA, respectively. Data are mean ± SEM.
(B) Summary bar graphs (mean ± SEM) of the total MK801-induced locomotion as a summation of horizontal activity from t = 30 min to t = 120 min. Injection time
was at t = 0min. mGluR2 heterozygotes (mGluR2+/�) (left) and 2AR heterozygotes (right) are shown. Mice were administered vehicle, clozapine (1.5 mg/kg), LY37
(5 mg/kg), or both LY37 and clozapine, followed by MK801 (0.5 mg/kg) (N = 5–6). (*p < 0.05, n.s.: not significant).
induced by MK801 was similar in wild-type and mGluR2-KO
mice. Notably, pretreatment with 1.5 mg/kg clozapine signifi-
cantly decreased the MK801-stimulated locomotion in wild-
type mice but not mGluR2-KO mice (Figure 5F), and this treat-
ment hadnoeffect on 2AR-KOmice (FigureS7C; seealsoFigures
S7A–S7C). Although our results are consistent with the absence
of antipsychotic-like behavioral effects of methysergide (com-
pare Figure 5F for clozapine with Figures S7D and S7E for meth-
ysergide), they do not exclude the possibility that the absence of
antipsychotic-like effects of LY37 in 2AR-KOmay be affected by
the lower expression of mGluR2 in 2AR-KO mice (Gonzalez-
Maeso et al., 2008; Moreno et al., 2011). Coinjection of LY37
and clozapine (1.5 mg/kg) did not affect the MK801-dependent
locomotor response in either mGluR2-KO or 2AR-KO mice
(data not shown). Together, these findings demonstrate that the
mGluR2-dependent antipsychotic-like behavioral response of
LY37 requires the expression of the 2AR, and that the corre-
sponding 2AR-dependent effect of clozapine requires the ex-
pression of mGluR2.
A Drug Combination Approach to Control Psychotic-likeBehaviorRecent preclinical findings suggest that coadministration of
suboptimal doses of atypical and Glu antipsychotics results in
1018 Cell 147, 1011–1023, November 23, 2011 ª2011 Elsevier Inc.
robust therapeutic-like behavioral effects and reduced
unwanted side effects (Uslaner et al., 2009). We postulated
that alterations in 2AR and mGluR2 expression levels in our
system (Figures 1F and S3D) may model the alterations in 2AR
and mGluR2 ratios observed in postmortem brain samples
from untreated schizophrenic patients (Gonzalez-Maeso et al.,
2008). We asked whether coadministration of clozapine (a 2AR
inverse agonist) with LY37 (a mGluR2 dominant agonist)
compensates for alterations in Gi-Gq balance caused by subop-
timal expression ratios of the two receptors. To this end, we in-
jected clozapine with LY37 and determined the BI. Figure 6A
shows the DGi and DGq values obtained in response to cloza-
pine, LY37, and LY37 together with clozapine. Coadministration
of the two drugs increased significantly the BI in both suboptimal
cases (left and right panels) compared to the optimal case
(middle panel). These results reveal that coadministration of
LY37 and clozapine can compensate for the loss in signaling
capacity that is likely to result from decreased mGluR2/2AR het-
eromeric formation, as cross-signaling is decreased in subop-
timal signaling receptor ratios.
Behavioral experiments showed that administration of
either clozapine or LY37 in mGluR2 or 2AR heterozygote
mice did not affect the MK801-dependent locomotor response
(Figure 6B). However, coadministration of both antipsychotics

Figure 7. Gi-Gq Balance Model of the Mechanism of Action of Antipsychotic and Psychedelic Drugs through the mGluR2/2AR Complex
Formation of the receptor complex establishes an optimal Gi-Gq balance in response to Glu and 5-HT (increase in Gi, decrease in Gq).
(A) Psychedelics (LY34 and DOI) invert the balance (strong Gi decrease, strong Gq increase).
(B) Disruption of the optimal balance in psychotic states (decrease in Gi, increase in Gq) can be compensated for by antipsychotics (LY37, clozapine, and
risperidone) that recover the Gi-Gq balance (increasing Gi and decreasing Gq).
in mGluR2 or 2AR heterozygotes significantly decreased the
MK801-stimulated locomotor activity (Figure 6B). These results
suggest that a combination of mGluR2 dominant agonists with
2AR inverse agonists is likely to synergize in vivo to achieve an
optimal signaling ratio in cases where a suboptimal Gi-Gq
signaling balance exists.
DISCUSSION
Previous work demonstrated that mGluR2 and 2AR form a func-
tional heteromeric complex through which hallucinogenic drugs
cross-signal to the Gi-coupled receptor (Gonzalez-Maeso et al.,
2008). It was not clear how the heteromeric complex signaled in
response to ligands binding to either receptor and whether the
differential pharmacology of this GPCR heteromer could be
considered widely as a tractable therapeutic target for psychotic
behavior. Our current study indicates that the mGluR2/2AR het-
eromer establishes a Gi-Gq balance in response to endogenous
ligands (e.g., Glu and 5-HT). We utilized a simple metric, the BI,
that quantifies the change in Gi (increase) and Gq (decrease)
signaling upon heteromerization relative to the homomeric
signaling levels.
The BI can be modulated either by dominant agonists that
take control over their counterpart receptors or by inverse
agonists that lift this control. This establishes a map between
the ligand input to the heteromer (e.g., agonist/agonist, dominant
agonist/agonist, neutral antagonist/agonist, inverse agonist/
agonist) and its signaling output in terms of how specific ligands
affect the BI. Our results are in agreement with results from
a GPCR complex of D2 receptor homomers coupled to a single
Gi protein subunit (Han et al., 2009). Our study further extends
C
these previous findings and demonstrates a signaling crosstalk
between the 2AR and mGluR2, which are individually coupled
to two different subtypes of G proteins (Gq andGi). Our data indi-
cate that signaling crosstalk through the mGluR2/2AR hetero-
complex may be a causal mechanism for the induction of cellular
and behavioral responses that differ from those of mGluR2 and
2AR homomers.
In our model (Figure 7), psychedelics invert the signaling
balance through the complex (Gi signaling decreases, whereas
Gq signaling increases, thus decreasing the BI), tipping the
balance from being in favor of Gi signaling (normal complex) to
being in favor of Gq signaling (propsychotic) (Figure 7A). Simi-
larly, disease states involving psychosis, such as schizophrenia,
would be expected to be associated with a variable disruption of
the Gi-Gq balance (i.e., decrease in Gi, increase in Gq, and
decrease in BI) (Figure 7B), consistent with the mGluR2 downre-
gulation and 2AR upregulation observed in untreated schizo-
phrenic patients (Gonzalez-Maeso et al., 2008). Such disruption
would be reversed by antipsychotics that recover the Gi-Gq
balance again in favor of Gi as in the normal complex (i.e.,
increasing Gi and decreasing Gq, thus increasing the BI) (Fig-
ure 7B). Because the Gi-Gq balance is the regulated variable
predicting psychotic state, it is not surprising that inverse
agonists on the 2AR side and strong agonists on the mGluR2
side are the most effective antipsychotics. The present study
also suggests a unifyingmechanism of action of atypical antipsy-
chotics and the new glutamate antipsychotics. Our findings
suggest inverse agonism as a common feature of 2AR ligands
with antipsychotic properties. We show that dysregulation of
an optimal ratio of mGluR2 to 2AR expression via injection of
different mRNA ratios greatly decreases BI values, and single
ell 147, 1011–1023, November 23, 2011 ª2011 Elsevier Inc. 1019

application of 2AR inverse agonists or mGluR2 dominant
agonists may not push the BI into the therapeutic range (see
Figure 4). Yet coadministration of the most effective mGluR2
and2ARdrugs yieldsBI values in the therapeutic range (Figure 6).
These findings in heterologous systems were paralleled in vivo
using heterozygous mice for 2AR or mGluR2: coinjection of
both clozapine and LY37 was needed to decrease the MK801-
dependent locomotor activity. In some schizophrenic
patients, atypical antipsychotics produce complete remission
of psychotic symptoms. However, two-thirds of schizophrenic
patients are considered treatment resistant, with persistent
psychotic and other symptoms despite the optimal use of avail-
able antipsychotic medications (Lieberman et al., 2005). The
absence of antipsychotic-like behavioral effect by injection of
either LY37 or clozapine in 2AR or mGluR2 heterozygous mice,
but not in the same mice coinjected with LY37 and clozapine,
points toward potential beneficial use of combination therapy
in treatment-resistant schizophrenia.
The metric (BI) that we provide allows quantification and
prediction of anti-/propsychotic effects of new drugs acting
through the mGluR2/2AR receptor heterocomplex. Although
long-term effects of drugs targeting mGluR2/2AR signaling are
not taken into account in the way we have estimated the BI
metric, the ability of this scale to predict appropriately the
most effective anti- and propsychotic drugs acting through the
receptor heterocomplex makes it a promising tool in predicting
the efficacy of new drugs. This metric, as well as structural
insights from ligand-specific heteromeric conformations, could
be used extensively for screening new compoundswith potential
antipsychotic effects.
Our results pave the way toward a new understanding of the
cellular signaling, function, and pharmacology of other hetero-
meric GPCRs that have been implicated as therapeutic targets
for the treatment of disease (Milligan, 2009). Provided that the
receptor complex signaling output can classify accurately the
behavior of drugs targeting the complex and used to treat
disease, the case of the mGluR2/2AR complex can serve as
a guiding example of development of therapeutic potency scales
that can be used to classify existing drugs and predict the
behavior of novel ones. Because the most effective antipsy-
chotic drugs targeting the mGluR2/2AR complex all gave the
highest BI values, it is likely that somehow signaling through
this complex is uniquely coupled to specific targets. The mech-
anism of such signaling specificity as well as the detailed actions
of Gi versus Gq signaling through the mGluR2/2AR complex,
aiming to achieve a homeostatic balance that ensures a normal
nonpsychotic state, are likely to become an active pursuit of
future studies.
EXPERIMENTAL PROCEDURES
Drugs, Molecular Constructs, Analysis of mGluR2 and 2AR Protein
Levels, and Surface Expression Assays
See Extended Experimental Procedures for details on all of these.
Expression of Recombinant Proteins in Xenopus Oocytes
Oocytes were isolated and microinjected with equal volumes (50 nl), as previ-
ously described (Lopes et al., 2002). In all two-electrode voltage-clamp exper-
iments (TEVC), oocytes were injected with 1 ng of mGluR2, 2 ng of
1020 Cell 147, 1011–1023, November 23, 2011 ª2011 Elsevier Inc.
mGluR2DTM4,5, 2 ng of mGluR3, 2 ng of mGluR3DTM4,5, 2 ng of 2AR, 2 ng
of GIRK4*, 2 ng of IRK3, 1 ng of PTX, or 4 ng of RGS2 and were maintained
at 18�C for 1–4 days before recording.
TEVC Recording and Analysis
Whole-cell currents were measured by conventional TEVC with a GeneClamp
500 amplifier (Axon Instruments, Union City, CA, USA), as previously reported.
A high-potassium (HK) solution was used to superfuse oocytes (96 mM KCl,
1 mM NaCl, 1 mM MgCl2, 5 mM KOH/HEPES, pH 7.4) to obtain a reversal
potential for potassium (EK) close to zero.
Inwardly rectifying potassium currents through GIRK4* and IRK3 were ob-
tained by clamping the cells at �80 mV. In order to isolate Gi, GIRK4* was co-
injected with RGS2 in order to eliminate the Gq component in the current.
Basal IRK3 and GIRK4* currents were defined as the difference between
inward currents obtained at�80mV in the presence of 3mMBaCl2 in HK solu-
tion and those in the absence of Ba2+ and measured for each trace. Current
inhibition and current activation were measured respectively and normalized
to basal current to compensate for size variability in oocytes.
Computational Methods
Molecular modeling: Because there are no available crystal structures of the
2AR or mGluR2 available to date, we generated initial molecular models of
these two receptors. Specifically, we built initial inactive conformations of
2AR or mGluR2 using a combination of homology modeling for the TM helices
and an ab initio loop prediction approach implemented in the Rosetta 2.2 code
(Wang et al., 2007) for the loop regions of the receptors. According to specific
structural and functional similarities, the b2-adrenergic (PDB 2RH1 (Cherezov
et al., 2007) or -rhodopsin (PDB 1U19 (Okada et al., 2004)) crystal structures
were used as structural templates for the homologymodeling of the TM regions
of 2AR or mGluR2, respectively. We generated activation pathways for each
receptor using the adiabatic-biased MD (ABMD) algorithm (Paci and Karplus,
1999) and a recently published simulation protocol (see Provasi et al., 2011 for
details). Free-energy values were calculated using a Monte Carlo scheme.
(see Extended Experimental Procedures for additional details.)
Experimental Animals
Experiments were performed on adult (8- to 12-week-old) male 129S6/SvEv
mice. 2AR-KO mice have been previously described (Gonzalez-Maeso et al.,
2007). mGluR2-KO mice were obtained from the RIKEN BioResource Center,
Japan (see reference Yokoi et al., 1996 for details) and backcrossed for at least
ten generations onto a 129S6/SvEv background. All subjects were offspring of
heterozygote breeding. For experiments involving genetically modified mice,
2ARwild-type or mGluR2 wild-type littermates were used as controls. Animals
were housed for 12 hr light/dark cycles at 23�Cwith food and water ad libitum.
The Institutional Animal Use and Care Committee approved all experimental
procedures at the Mount Sinai School of Medicine and Virginia Common-
wealth University.
Measurement of Intracellular Ca2+
Measurement of intracellular free calcium was performed as described in the
literature with minor modifications (Pichon et al., 2010) (see Extended Experi-
mental Procedures for details).
Coimmunoprecipitations and [3H]Ketanserin and [35S]GTPgS
Binding Assays
Mouse frontal cortex membrane preparations and binding assays were per-
formed as previously described with minor modifications (Gonzalez-Maeso
et al., 2008) (see Extended Experimental Procedures for details).
Cortical Primary Cultures and Immunocytochemistry
Mouse cortical primary neurons were cultured as previously reported (Gonza-
lez-Maeso et al., 2008).
(See Extended Experimental Procedures for details.)
Behavioral Studies
Locomotor and head-twitch behavioral studies were performed as previously
described (Gonzalez-Maeso et al., 2008). Motor function was assessed with

a computerized three-dimensional activity monitoring system (AccuScanIn-
struments). The activity monitor has 32 infrared sensor pairs, with 16 along
each side spaced 2.5 cm apart. The system determines motor activity on
the basis of the frequency of interruptions to infrared beams traversing the x,
y, and z planes. Total distance (cm) traveled and vertical activity were deter-
mined automatically from the interruptions of beams in the horizontal and
vertical planes, respectively.
Calculation of Gi-Gq Balance Recovery and Loss
The total Gi-Gq balance achieved by the mGluR2/2AR heteromer in the pres-
ence of a drug was calculated with the following equation:
Total balance= x BId +BIrð1� xÞ
where x is the fraction of heteromer that binds the drug, BId is the balance
index of the drug at a fixed concentration, and BIr is the reference balance
index of the complex (1.45).
In the absence of drug (x = 0), the total balance achieved will be BIr (1.45). If
the drug has aBId = BIr, the total Gi-Gq balance is alsoBIr (1.45) for any fraction
x of drug-bound heteromer.
In a state where themGluR2/2AR heteromer is signaling at aBI < BIr (disease
state), a drug with a BId > BIr will be able to compensate for the total Gi-Gq
balance loss and reestablish a total balance of 1.45 (BIr), if BId is sufficiently
large.
The Gi-Gq balance recovery (R) was calculated with the following equation:
R= 100,
��Total balance
BIr
�� 1
�
This value expressed as a percentage indicates the amount of Gi-Gq balance
that could be recovered by a drug with a balance index BId. It is determined by
the difference between the total balance achieved in the presence of the drug
compared to BIr. A positive Gi-Gq balance (total balance > BIr) indicates that
the drug is able to recover Gi-Gq balance (e.g., a drug with a BId of 2.3 with
a fractional occupancy x = 0.5 will have a total balance of 1.875, which will
allow recovery up to �30% loss from the reference level of 1.45). A negative
Gi-Gq balance (total balance < BIr) indicates that the drug induces a loss in
balance (e.g., a drug with a BId of 0.315 with a fractional occupancy x = 0.5
will have a total balance of 0.315, which will result in�80% loss from the refer-
ence level of 1.45).
In order to compare drugs, we established an arbitrary reference level of
fractional occupancy of the heteromer by the drug (x = 0.5). This allowed
us to establish the differences in the ability of the drugs to recover or lose
the Gi-Gq balance based on their BI at equal conditions. Changes in the frac-
tional occupancy used for comparison (e.g., x = 0.25) changed the magni-
tude but not the relative order in the classification of the drugs shown in
Figure 4.
Statistical Methods
Statistical significance of behavioral experiments involving four groups and
two treatments was assessed by two-factor ANOVA followed by Bonferroni’s
post-hoc test. Statistical significance of behavioral experiments involving one
treatment was assessed by Student’s t test.
Each electrophysiological experiment in Xenopus oocytes was performed in
two batches. Every group in each experiment was tested in both batches. Data
for both batches were compiled (n = 8–16), and one-way ANOVA tests applied
followed by a multiple comparison procedure using Tukey’s honestly signifi-
cant difference test.
Intracellular calcium measurements were performed in three different isola-
tions. Data for all isolations were compiled (n = 7–11), and one-way ANOVA
tests applied followed by amultiple comparison procedure using Tukey’s hon-
estly significant difference test.
[3H]ketanserin binding experiments were performed 3–5 times in duplicate/
triplicate. A one-site model versus a two-site model, as a better description of
the data, was determined by F test. [35S]GTPgSbinding experiments were per-
formed three times in triplicate. Two-way ANOVA tests were applied to the
compiled data followed by a Bonferroni’s post-hoc test.
C
SUPPLEMENTAL INFORMATION
Supplemental information includes Extended Experimental Procedures, seven
figures, and two tables and can be found with this article online at doi:10.1016/
j.cell.2011.09.055.
ACKNOWLEDGMENTS
The authors thank Sophia Gruszecki, Heikki Vaananen, Dr. Jian Yang, and Dr.
Basil Hanss for Xenopus oocyte isolation and are grateful to Dr. Kurt Hauser for
his support with the cortical primary neuronal cultures and Dr. J.A. Gingrich for
his gift of 5HT2A-KO mice. The authors are also thankful to Drs. M. Scott
Bowers, Louis J. De Felice, Frank Guarnieri (Virginia Commonwealth Univer-
sity), Lakshmi Devi (Mount Sinai School of Medicine), Jonathan Javitch
(Columbia University), George Liapakis (University of Crete, Greece), and Her-
bert Meltzer (Vanderbilt University) for critical feedback on the manuscript and
to members of the Logothetis lab for useful feedback throughout this project.
D.E.L. was partly supported for this work by NIH grant HL59949. J.G.-M. was
supported by NIH grant 5R01MH084894, as well as NARSAD, Dainippon Su-
mitomo Pharma, and the Maltz Family Foundation Award. M.F. was supported
byNIH grantsMH084894,MH091360, andDA026434. The computationswere
supported in part by the National Science Foundation through TeraGrid
advanced computing resources provided by the Texas Advanced Computing
Center under grant TG-MCB080109N. J.L.M. was the recipient of a postdoc-
toral fellowship fromMinisterio de Ciencia e Innovacion, Spain. R.M. was sup-
ported by NIH grant F30HL097582. J.M.E. was supported by NIH grants
SRC1DA02811202 and 1R01DA02694702.
Received: November 19, 2010
Revised: August 16, 2011
Accepted: September 30, 2011
Published: November 23, 2011
REFERENCES
Aloyo, V.J., Berg, K.A., Spampinato, U., Clarke, W.P., and Harvey, J.A. (2009).
Current status of inverse agonism at serotonin2A (5-HT2A) and 5-HT2C recep-
tors. Pharmacol. Ther. 121, 160–173.
Barela, A.J., Waddy, S.P., Lickfett, J.G., Hunter, J., Anido, A., Helmers, S.L.,
Goldin, A.L., and Escayg, A. (2006). An epilepsy mutation in the sodium
channel SCN1A that decreases channel excitability. J. Neurosci. 26, 2714–
2723.
Barducci, A., Bussi, G., and Parrinello, M. (2008). Well-tempered metadynam-
ics: a smoothly converging and tunable free-energy method. Phys. Rev. Lett.
100, 020603.
Bespalov, A., Jongen-Relo, A.L., van Gaalen, M., Harich, S., Schoemaker, H.,
and Gross, G. (2007). Habituation deficits induced by metabotropic glutamate
receptors 2/3 receptor blockade in mice: reversal by antipsychotic drugs. J.
Pharmacol. Exp. Ther. 320, 944–950.
Bonomi, D., Branduardi, G., and Bussi, C. (2009). PLUMED: A portable plugin
for free-energy calculations with molecular dynamics. Comput. Phys. Com-
mun. 180, 1961–1972.
Branduardi, D., Gervasio, F.L., and Parrinello, M. (2007). From A to B in free
energy space. J. Chem. Phys. 126, 054103.
Carriba, P., Navarro, G., Ciruela, F., Ferre, S., Casado, V., Agnati, L., Cortes,
A., Mallol, J., Fuxe, K., Canela, E.I., et al. (2008). Detection of heteromerization
of more than two proteins by sequential BRET-FRET. Nat. Methods 5,
727–733.
Cherezov, V., Rosenbaum, D.M., Hanson, M.A., Rasmussen, S.G., Thian, F.S.,
Kobilka, T.S., Choi, H.J., Kuhn, P., Weis, W.I., Kobilka, B.K., and Stevens, R.C.
(2007). High-resolution crystal structure of an engineered human beta2-adren-
ergic G protein-coupled receptor. Science 318, 1258–1265.
Du, X., Zhang, H., Lopes, C., Mirshahi, T., Rohacs, T., and Logothetis, D.E.
(2004). Characteristic interactions with phosphatidylinositol 4,5-bisphosphate
ell 147, 1011–1023, November 23, 2011 ª2011 Elsevier Inc. 1021

determine regulation of kir channels by diversemodulators. J. Biol. Chem. 279,
37271–37281.
Egan, C.T., Herrick-Davis, K., and Teitler, M. (1998). Creation of a constitutively
activated state of the 5-hydroxytryptamine2A receptor by site-directed muta-
genesis: inverse agonist activity of antipsychotic drugs. J. Pharmacol. Exp.
Ther. 286, 85–90.
Ernst, O.P., Gramse, V., Kolbe, M., Hofmann, K.P., and Heck, M. (2007).
Monomeric G protein-coupled receptor rhodopsin in solution activates its G
protein transducin at the diffusion limit. Proc. Natl. Acad. Sci. USA 104,
10859–10864.
Gonzalez-Maeso, J., and Sealfon, S.C. (2009). Psychedelics and schizo-
phrenia. Trends Neurosci. 32, 225–232.
Gonzalez-Maeso, J., Rodrıguez-Puertas, R., andMeana, J.J. (2002). Quantita-
tive stoichiometry of G-proteins activated by mu-opioid receptors in post-
mortem human brain. Eur. J. Pharmacol. 452, 21–33.
Gonzalez-Maeso, J., Weisstaub, N.V., Zhou, M., Chan, P., Ivic, L., Ang, R.,
Lira, A., Bradley-Moore, M., Ge, Y., Zhou, Q., et al. (2007). Hallucinogens
recruit specific cortical 5-HT(2A) receptor-mediated signaling pathways to
affect behavior. Neuron 53, 439–452.
Gonzalez-Maeso, J., Ang, R.L., Yuen, T., Chan, P., Weisstaub, N.V., Lopez-
Gimenez, J.F., Zhou, M., Okawa, Y., Callado, L.F., Milligan, G., et al. (2008).
Identification of a serotonin/glutamate receptor complex implicated in
psychosis. Nature 452, 93–97.
Han, Y., Moreira, I.S., Urizar, E., Weinstein, H., and Javitch, J.A. (2009). Allo-
steric communication between protomers of dopamine class A GPCR dimers
modulates activation. Nat. Chem. Biol. 5, 688–695.
He, C., Zhang, H., Mirshahi, T., and Logothetis, D.E. (1999). Identification of
a potassium channel site that interacts with G protein betagamma subunits
to mediate agonist-induced signaling. J. Biol. Chem. 274, 12517–12524.
He, C., Yan, X., Zhang, H., Mirshahi, T., Jin, T., Huang, A., and Logothetis, D.E.
(2002). Identification of critical residues controlling G protein-gated inwardly
rectifying K(+) channel activity through interactions with the beta gamma
subunits of G proteins. J. Biol. Chem. 277, 6088–6096.
Hof, P.R., et al. (2000). Comparative Cytoarchitectonic Atlas of the C57BL/6
and 129/Sv Mouse Brains (Amsterdam: Elsevier).
Kenakin, T. (2002). Efficacy at G-protein-coupled receptors. Nat. Rev. Drug
Discov. 1, 103–110.
Kinon, B.J., Zhang, L., Millen, B.A., Osuntokun, O.O., Williams, J.E., Kollack-
Walker, S., Jackson, K., Kryzhanovskaya, L., and Jarkova, N.; and the HBBI
Study Group. (2011). A multicenter, inpatient, phase 2, double-blind,
placebo-controlled dose-ranging study of LY2140023 monohydrate in
patients with DSM-IV schizophrenia. J. Clin. Psychopharmacol. 31, 349–355.
Lieberman, J.A., Stroup, T.S., McEvoy, J.P., Swartz, M.S., Rosenheck, R.A.,
Perkins, D.O., Keefe, R.S., Davis, S.M., Davis, C.E., Lebowitz, B.D., et al; Clin-
ical Antipsychotic Trials of Intervention Effectiveness (CATIE) Investigators.
(2005). Effectiveness of antipsychotic drugs in patients with chronic schizo-
phrenia. N. Engl. J. Med. 353, 1209–1223.
Lopes, C.M., Zhang, H., Rohacs, T., Jin, T., Yang, J., and Logothetis, D.E.
(2002). Alterations in conserved Kir channel-PIP2 interactions underlie chan-
nelopathies. Neuron 34, 933–944.
Lopez-Gimenez, J.F., Canals, M., Pediani, J.D., and Milligan, G. (2007). The
alpha1b-adrenoceptor exists as a higher-order oligomer: effective oligomeri-
zation is required for receptor maturation, surface delivery, and function.
Mol. Pharmacol. 71, 1015–1029.
Meltzer, H.Y., and Huang, M. (2008). In vivo actions of atypical antipsychotic
drug on serotonergic and dopaminergic systems. Prog. Brain Res. 172,
177–197.
Meltzer, H.Y., Matsubara, S., and Lee, J.C. (1989). Classification of typical and
atypical antipsychotic drugs on the basis of dopamine D-1, D-2 and serotonin2
pKi values. J. Pharmacol. Exp. Ther. 251, 238–246.
Milligan, G. (2009). G protein-coupled receptor hetero-dimerization: contribu-
tion to pharmacology and function. Br. J. Pharmacol. 158, 5–14.
1022 Cell 147, 1011–1023, November 23, 2011 ª2011 Elsevier Inc.
Moreno, J.L., Sealfon, S.C., and Gonzalez-Maeso, J. (2009). Group II metab-
otropic glutamate receptors and schizophrenia. Cell. Mol. Life Sci. 66, 3777–
3785.
Moreno, J.L., Holloway, T., Albizu, L., Sealfon, S.C., and Gonzalez-Maeso, J.
(2011). Metabotropic glutamate mGlu2 receptor is necessary for the pharma-
cological and behavioral effects induced by hallucinogenic 5-HT2A receptor
agonists. Neurosci. Lett. 493, 76–79.
Morris, B.J., Cochran, S.M., and Pratt, J.A. (2005). PCP: from pharmacology to
modelling schizophrenia. Curr. Opin. Pharmacol. 5, 101–106.
Mouri, A., Noda, Y., Enomoto, T., and Nabeshima, T. (2007). Phencyclidine
animal models of schizophrenia: approaches from abnormality of glutama-
tergic neurotransmission and neurodevelopment. Neurochem. Int. 51,
173–184.
Okada, T., Sugihara, M., Bondar, A.N., Elstner, M., Entel, P., and Buss, V.
(2004). The retinal conformation and its environment in rhodopsin in light of
a new 2.2 A crystal structure. J. Mol. Biol. 342, 571–583.
Oldham, W.M., and Hamm, H.E. (2008). Heterotrimeric G protein activation by
G-protein-coupled receptors. Nat. Rev. Mol. Cell Biol. 9, 60–71.
Paci, E., and Karplus, M. (1999). Forced unfolding of fibronectin type 3
modules: an analysis by biased molecular dynamics simulations. J. Mol.
Biol. 288, 441–444.
Patil, S.T., Zhang, L., Martenyi, F., Lowe, S.L., Jackson, K.A., Andreev, B.V.,
Avedisova, A.S., Bardenstein, L.M., Gurovich, I.Y., Morozova, M.A., et al.
(2007). Activation of mGlu2/3 receptors as a new approach to treat schizo-
phrenia: a randomized Phase 2 clinical trial. Nat. Med. 13, 1102–1107.
Pichon, X., Wattiez, A.S., Becamel, C., Ehrlich, I., Bockaert, J., Eschalier, A.,
Marin, P., and Courteix, C. (2010). Disrupting 5-HT(2A) receptor/PDZ protein
interactions reduces hyperalgesia and enhances SSRI efficacy in neuropathic
pain. Mol. Ther. 18, 1462–1470.
Provasi, D., Artacho, M.C., Negri, A., Mobarec, J.C., and Filizola, M. (2011).
Ligand-inducedmodulation of the free-energy landscape of g protein-coupled
receptors explored by adaptive biasing techniques. PLoS Comput. Biol. 7,
e1002193.
Reimherr, F.W., Wood, D.R., and Wender, P.H. (1986). The use of MK-801,
a novel sympathomimetic, in adults with attention deficit disorder, residual
type. Psychopharmacol. Bull. 22, 237–242.
Rives, M.L., Vol, C., Fukazawa, Y., Tinel, N., Trinquet, E., Ayoub, M.A., Shige-
moto, R., Pin, J.P., and Prezeau, L. (2009). Crosstalk between GABAB and
mGlu1a receptors reveals new insight into GPCR signal integration. EMBO
J. 28, 2195–2208.
Rosenbaum, D.M., Rasmussen, S.G., and Kobilka, B.K. (2009). The structure
and function of G-protein-coupled receptors. Nature 459, 356–363.
Ross, C.A., Margolis, R.L., Reading, S.A., Pletnikov, M., and Coyle, J.T. (2006).
Neurobiology of schizophrenia. Neuron 52, 139–153.
Urizar, E., Yano, H., Kolster, R., Gales, C., Lambert, N., and Javitch, J.A.
(2011). CODA-RET reveals functional selectivity as a result of GPCR heterome-
rization. Nat. Chem. Biol. 7, 624–630.
Uslaner, J.M., Smith, S.M., Huszar, S.L., Pachmerhiwala, R., Hinchliffe, R.M.,
Vardigan, J.D., and Hutson, P.H. (2009). Combined administration of an
mGlu2/3 receptor agonist and a 5-HT 2A receptor antagonist markedly atten-
uate the psychomotor-activating and neurochemical effects of psychostimu-
lants. Psychopharmacology (Berl.) 206, 641–651.
Vanommeslaeghe, K., Hatcher, E., Acharya, C., Kundu, S., Zhong, S., Shim, J.,
Darian, E., Guvench, O., Lopes, P., Vorobyov, I., and Mackerell, A.D., Jr.
(2010). CHARMM general force field: A force field for drug-like molecules
compatible with the CHARMM all-atom additive biological force fields. J.
Comput. Chem. 31, 671–690.
Vilardaga, J.P., Nikolaev, V.O., Lorenz, K., Ferrandon, S., Zhuang, Z., and
Lohse, M.J. (2008). Conformational cross-talk between alpha2A-adrenergic
and mu-opioid receptors controls cell signaling. Nat. Chem. Biol. 4, 126–131.
Wang, C., Bradley, P., and Baker, D. (2007). Protein-protein docking with
backbone flexibility. J. Mol. Biol. 373, 503–519.

Weiner, D.M., Burstein, E.S., Nash, N., Croston, G.E., Currier, E.A., Vanover,
K.E., Harvey, S.C., Donohue, E., Hansen, H.C., Andersson, C.M., et al.
(2001). 5-hydroxytryptamine2A receptor inverse agonists as antipsychotics.
J. Pharmacol. Exp. Ther. 299, 268–276.
Whorton, M.R., Bokoch, M.P., Rasmussen, S.G., Huang, B., Zare, R.N.,
Kobilka, B., and Sunahara, R.K. (2007). A monomeric G protein-coupled
receptor isolated in a high-density lipoprotein particle efficiently activates its
G protein. Proc. Natl. Acad. Sci. USA 104, 7682–7687.
C
Woolley,M.L., Pemberton, D.J., Bate, S., Corti, C., and Jones, D.N. (2008). The
mGlu2 but not the mGlu3 receptor mediates the actions of the mGluR2/3
agonist, LY379268, in mouse models predictive of antipsychotic activity.
Psychopharmacology (Berl.) 196, 431–440.
Yokoi, M., Kobayashi, K., Manabe, T., Takahashi, T., Sakaguchi, I., Katsuura,
G., Shigemoto, R., Ohishi, H., Nomura, S., Nakamura, K., et al. (1996). Impair-
ment of hippocampal mossy fiber LTD in mice lacking mGluR2. Science 273,
645–647.
ell 147, 1011–1023, November 23, 2011 ª2011 Elsevier Inc. 1023

Supplemental Information
EXTENDED EXPERIMENTAL PROCEDURES
Drugs5-hydroxytryptamine (serotonin, 5-HT), 1-(2,5-dimethoxy-4-iodophenyl)-2-aminopropane (DOI), and (+)-MK801 hydrogen maleate
(MK801) were purchased from Sigma-Aldrich. (1R,4R,5S,6R)-4-Amino-2-oxabicyclo[3.1.0]hexane-4,6-dicarboxylic acid
(LY379268; LY37), (2S)-2-Amino-2-[(1S,2S)-2-carboxycycloprop-1-yl]-3-(xanth-9-yl) propanoic acid (LY341495; LY34), methyser-
gide, clozapine, paliperidone (active compound of risperidone), ritanserin, (2S)-a-ethylglutamic acid (eGlu), and (2S,20R,30R)-2-(20,30-Dicarboxycyclopropyl) glycine (DCG-IV) were obtained from Tocris Cookson Inc. [35S]GTPgS and [3H]ketanserin were
purchased from PerkinElmer Life and Analytical Sciences, Inc.
Molecular ConstructsPCR amplification and subcloning of 2AR, mGluR2, mGluR3, mGluR2D (mGluR2 chimera containing TM helices 4 and 5 of the
mGluR3), and mGluR3D (mGluR3 chimera containing TM helices 4 and 5 of the mGluR2) into pcDNA3.1 was described previously
(Gonzalez-Maeso et al., 2008). The human 2AR, the human mGluR2, and the mGluR2D were digested with BamHI and NotI and
subcloned into the pXOOM vector. The human mGluR3 and the mGluR3D chimeras were digested with EcoRI and NotI and subcl-
oned into pXOOM (Gonzalez-Maeso et al., 2008). The human RGS2 (University of Missouri-Rolla, UMR) was PCR-amplified using the
primers RGS2/S (TTTTggatccATGCAAAGTGCTATGTTCTT) and RGS2/A (TTTTgcggccgcTCATGTAGCATGAGGCTCTG) and subcl-
oned into the BamHI and NotI sites of pXOOM. Constructs subcloned into the pGEMHE vector with the active point mutants of the
human Kir3.4, Kir3.4-S143T or Kir3.4*, Kir2.3 (IRK3) and Pertussis Toxin (PTX) subunit B were previously described (Vivaudou et al.,
1997).
Surface Labeling of OocytesWe engineered HA-tagged 2AR, mGluR2, mGluR3, mGluR2DTM4,5 and mGluR3DTM4,5 constructs as previously described (Gon-
zalez-Maeso et al., 2002) and used an ELISA-based chemiluminescence assay adapted for oocytes. Oocytes were blocked for 30–
60 min in experimental medium (ND96 with 1% bovine serum albumin (BSA)) at 4�C, labeled with 0.5 mg/ml rat monoclonal anti-HA
antibody (3F10; Boehringer Mannheim) (overnight at 4�C), extensively washed at 4�C, and incubated with 2 mg/ml HRP-coupled
secondary antibody (goat anti-rat) (in 1% BSA for 60 min). Cells were washed (experimental medium, 4�C) and transferred to
ND96 without BSA. Individual oocytes were placed in 100 ml SuperSignal ELISA (Pierce) and incubated at room temperature for
1 min. Chemiluminescence was quantitated in a TD-20E luminometer (Turner Designs, CA, USA). As a control, we used noninjected
oocytes.
Computational MethodsConformational Sampling of Ligand-free 2AR or mGluR2
We used the crystal structures of the G protein-interacting opsin (PDB 3DQB [Scheerer et al., 2008]) and the nanobody-stabilized
activated b2-adrenergic receptor (PDB 3PX0 [Rasmussen et al., 2011]) as target active conformations for mGluR2 and 2AR, respec-
tively. The CHARMM27 force-field (MacKerell et al., 1998) was used to describe the receptors (along with the CMAP backbone
energy correction (Mackerell et al., 2004)), as well as the lipids. All calculations were performed using NAMD 2.7 (Phillips et al.,
2005), enhanced with the Plumed plug-in (Bonomi et al., 2009). Briefly, we carried out multiple 10 ns-long ABMD simulations in
an explicit hydrated 1-palmitoyl-2-oleoyl-sn-glycero-3-phosphocholine (POPC)/10% cholesterol membrane bilayer with an elastic
constant of 0.1 kJ/nm2 for each system. The ligand-free sampled conformations of either 2AR or mGluR2 were grouped using
average linkage agglomerative hierarchical clustering based on the root mean square deviation (rmsd) of the TM domains, and
path collective variables for metadynamics simulations were derived using the maximum number of clusters k that would define
mono-dimensional paths for each receptor. To avoid rapid switching between clusters and to ensure all clusters were visited in
a sequential fashion by the conformations of a given trajectory, we considered a maximum number of clusters k = 8.
Ligand Parameterization and Docking
Clozapine, methysergide, DOI were parameterized based on the General CHARMM force-field optimization protocol (Vanomme-
slaeghe et al., 2010). These ligands were docked into the initial inactive model of 2AR, using a standard Autodock 4.0 (Morris
et al., 2009) protocol. Inferences from published experimental work on clozapine (Kanagarajadurai et al., 2009), methysergide
(Roth et al., 1997), or DOI (Braden et al., 2006) binding were considered to select the most accurate initial binding poses of these
ligands for further metadynamics simulations.
Metadynamics of Ligand-bound 2AR
Metadynamics simulations were performed on each ligand-bound 2AR systemwithin an explicit environment, using as reaction coor-
dinates path variables (Branduardi et al., 2007) describing the position along (s) and the distance from (z) the predetermined activation
trajectories of the 2AR. A bias was added to the system using thewell-temperedmetadynamics algorithm (Barducci et al., 2008), with
a deposition rate of 150 ps, an initial energy of the Gaussian bias of w = 0.1 kcal/mol, and a bias-factor of 10. Convergence of the
reconstructed free-energy was monitored by checking the height of the Gaussian bias contributions as a function of simulation
time, and the simulation was stopped after 150 ns.
Cell 147, 1011–1023, November 23, 2011 ª2011 Elsevier Inc. S1

Exploration of the Dimer Interfaces
To study which interfaces involving TM4 and/or TM5 helices are stabilized by the ligand-specific 2AR conformations, we carried out
all-atom Monte Carlo simulations with an implicit membrane model. Focus on these helices was based on inferences from the liter-
ature on several GPCR complexes, as well as both published (Gonzalez -Maeso et al., 2008) and unpublished data on 2AR and
mGluR2. The receptors were described using the same force field used in the metadynamics simulations (MacKerell et al., 1998;
Mackerell et al., 2004), whereas the effect of the membrane was approximated by the IMM1 implicit solvent model (Lazaridis
et al., 2003) Standard parameters were used, modeling the solvent as water, and the interior of the membrane as cyclohexane.
The free energy of different interfacial arrangements was calculated using aMonte Carlo scheme. A step consisted in the choice of
a putative new conformation obtained by rotating each receptor around the axis of its own helical bundle of a random angle (sampled
from a uniform distribution�30� % a, b% +30�), and increasing or decreasing the distance between the centers of mass of a random
distance (�2 A% d% +2 A). Proposed moves were rejected if the distance between the centers of mass increased over 35 A or if the
distance between the two TM4 helices increased over 20 A. A simulated annealing protocol was used to optimize the positions of the
side chains of the putative conformations obtained after the proposed moves, keeping the TM Ca fixed. The total energy in the new
conformation after the simulated annealing relaxationwas used to either accept or reject the proposedmove. The cycle was repeated
105 times, and the free energy was calculated as a function of the angles around the axis of the helix bundle of each protomer (a and
b), integrating the dependence on the distance.
Metadynamics of the mGluR2/2AR Complexes Interacting at Symmetric TM4/TM4 or TM4,5/TM4,5 Interfaces
Based on the results of the conformational sampling of the ligand-free receptors and of the interface exploration, we built 4 different
reference states for the symmetric TM4/TM4 interface of the clozapine-bound mGluR2/2AR complex, and 4 states for the symmetric
TM4,5/TM4,5 interface of the methysergide-bound and the DOI-bound mGluR2/2AR complex, one for each conformation sampled
along the activation pathway of mGluR2. These reference states were used to derive the path variables for threemetadynamics simu-
lations, a first one for the TM4/TM4 clozapine-boundmGluR2/2AR complex, a second one for the TM4,5/TM4,5methysergide-bound
mGluR2/2AR complex, and a third one for the TM4,5/TM4,5 DOI- bound mGluR2/2AR complex. We then reconstructed the free
energy of activation of mGluR2 in the presence of the three different dimeric arrangements with clozapine-bound, the methyser-
gide-bound and the DOI-bound 2AR. The parameters were the same as those used in the exploration of the 2AR conformational
ensemble described above.
Analysis of mGluR2 and 2AR Protein LevelsMembrane fractions from oocytes expressing HA-tagged mGluR2, myc-tagged 2AR or both, were prepared as described previously
(Michailidis et al., 2011). The pellets were resuspended with lysis buffer (0.5ml per oocyte), mixed with SDS-PAGE loading buffer,
boiled for 10 min, and analyzed by western Blotting, using anti-HA (rat monoclonal anti-HA antibody 3F10; Boehringer Mannheim)
and anti-myc (Myc-Tag 9B11MousemAb, Cell Signaling Technology) antibodies. Protein levels for mGluR2 and 2ARwere quantified
by densitometric scanning and expressed relative to mGluR2 or 2AR levels in oocytes injected with 1 ng of mGluR2 + 2ng of 2AR
mRNAs.
Measurement of Intracellular Ca2+
For measurement of intracellular free calcium, mouse cortical primary cultures were plated in coverslips and incubated for 1 hr with
10 mM fura-2 (Molecular Probes Inc., USA). A photometry based epifluorescencemicroscopy system (Ionoptix; Milton, MA; objective,
340; 0.9 numerical aperture) was used to detect the intracellular Ca2+ transient. A Hyperswitch (HSW400, Ionoptix; Milton, MA, USA)
with a galvanometer driven mirror was used to alternatively excite fura-2 at wavelengths 340 and 380 nm at 2.5 Hz, and the Ca2+
transient was estimated as the ratio (f340/f380) of the emissions at 510 nm. Imaging was obtained using Ion Wizard fluorescence
analysis software version 4.4. Experiments were performed on days 6, 7, and 8 after isolation. Image pairs were collected integrating
a region of interest covering the whole cell at 2.5 Hz and filtered using a low-pass filter with a time constant t = 1 s to reduce noise.
Intracellular calcium concentration [Ca2+]i was expressed as a 340/380 nm ratio and its increase was normalized to the basal 340/
380 nm ratio level before perfusion of the drug.
[3H]Ketanserin and [35S]GTPgS Binding AssaysMembrane preparations were incubated for 60 min at 37�C. Nonspecific binding was determined in the presence of 10 mM methy-
sergide. [35S]GTPgS binding experiments were initiated by the addition of membranes containing 35 mg of protein to an assay buffer
(20mMHEPES, 3mMMgCl2, 100mMNaCl, 0.2mMascorbic acid and 0.5 nM [35S]GTPgS) supplemented with 0.1 mMor 10 mMGDP
for Gaq/11 and Gai, respectively, and containing the indicated concentration of ligands. Nonspecific binding was determined in the
presence of 100 mMGTPgS. Reactions were incubated for 30 min at 30�C, and were terminated by the addition of 0.5 ml of ice-cold
buffer, containing 20 mM HEPES, 3 mMMgCl2, 100 mM NaCl and 0.2 mM ascorbic acid. The samples were centrifuged at 16,000 g
for 15min at 4�C, and the resulting pellets were re-suspended in solubilization buffer (100mMTris, 200mMNaCl, 1mMEDTA, 1.25%
Nonidet P40) plus 0.2%SDS. Sampleswere preclearedwith Pansorbin (Calbiochem), followed by immunoprecipitationwith antibody
against Gaq/11or Gai1,2,3 (Santa Cruz Biotechnology). Finally, the immunocomplexes were washed twice with solubilization buffer,
and bound [35S]GTPgS was measured by liquid-scintillation spectrometry.
S2 Cell 147, 1011–1023, November 23, 2011 ª2011 Elsevier Inc.

Coimmunoprecipitation in Mouse Frontal CortexTissue samples of mouse frontal cortex were homogenized using a Teflon-glass grinder (10 up-and-down strokes at 1,500 rpm) in
1ml of homogenization buffer (50mMTris-HCl, pH 7.4), supplemented with 0.25M sucrose. The crude homogenate was centrifuged
at 1,0003 g for 5 min at 4�C, and the supernatant was recentrifuged at 40,0003 g for 15 min at 4�C. The resultant pellet (P2 fraction)
was washed twice in homogenization buffer and recentrifuged in similar conditions. Aliquots of 1 mg of protein were stored at�80�Cuntil coimmunoprecipitation assay. The protein pellets were resuspended in 1ml RIPA buffer (150mMNaCl, 5 mMEDTA, 0.8%SDS,
1%Triton X-100, 50mMHEPES; pH 7.4, supplemented with protease inhibitors), and rotated at 4�C for 60min. After centrifugation at
14,000 rpm for 15 min, 900 ml of the supernatant were rotated with 40 ml of protein A/G beads (Santa Cruz Biotechnology, Inc.) at 4�Cfor 60 min. After centrifugation at 14,000 rpm for 1 min, 400 ml of the supernatant were incubated overnight with 4 ml of anti-2AR anti-
body (Abcam, ab16028) and 40 ml of protein A/G beads at 4�C. Beads were thenwashed three timeswith RIPA buffer. Equal amounts
of protein were resolved by SDS-polyacrylamide gel electrophoresis. Detection of proteins by immunoblotting using using anti-2AR
and anti-mGluR2 (Abcam, ab15672) antibodies was conducted using the ECL system according to the manufacturer’s instructions.
Cortical Primary Cultures and ImmunocytochemistryFor cortical primary cultures, micewere sacrificed at the embryonic day (E) 15 stage. Themediawas removed and the cells were fixed
with 3% formaldehyde in PBS for 15 min. The coverslips were washed with 33 2 ml PBS before being treated for 10 min with 0.3%
Triton X-100 to permeabilize the cell membrane to antibodies. Coverslips were further washed with PBS and incubated in PBS con-
taining 3% horse serum and 1% bovine serum albumin (blocking buffer) to reduce nonspecific binding. Primary antibodies anti-2AR
and anti-mGluR2 (see above) were incubated for 60 min at room temperature. After washing with blocking buffer (33 2 ml), the cells
were incubated with the secondary antibodies Alexa 488-conjugated goat anti-rabbit (Invitrogen, A11011) and Alexa 568-conjugated
goat anti-mouse (Invitrogen, A11001) for 60 min at room temperature. After washing (PBS, 6 3 2 ml), the coverslips were dried and
treated with antifade before being fixed onto glass slides.
For immunochemistry in brain section, mice were deeply anesthetized with with ketamine/xylazine. Transcardiac perfusion was
performed with 10 ml PBS, followed by 30 ml of freshly prepared 4% paraformaldehyde (PFA) in PBS at room temperature. Brains
were removed and immersion-fixed in 4% PFA in 1 ml at 4�C for 60 min and stored at 30% sucrose in PBS at 4�C for an additional
12 hr before to obtain the frontal cortex section. The slides were further washed with PBS and incubated in PBS containing 0.2% Tx-
100 and 5% bovine serum albumin to permeabilize the cells. Primary antibodies anti-2AR and anti-mGluR2 (see above) were incu-
bated for overnight at 4�C. After washing with PBS the slices were incubated with the secondary antibodies Alexa 488-conjugated
goat anti-rabbit (Invitrogen, A11011) and Alexa 568-conjugated goat anti-mouse (Invitrogen, A11001) for 60min at room temperature.
After washing (PBS, 6 3 2 ml), the slices were mounted onto coverslips treated with antifade. Sections incubated with secondary
antibody alone exhibited background immunofluorescence (data not shown). Tissue samples were examined by upright epifluores-
cence microscopy (Zeiss Axioplan 2IE).
SUPPLEMENTAL REFERENCES
Barducci, A., Bussi, G., and Parrinello, M. (2008). Well-tempered metadynamics: a smoothly converging and tunable free-energy method. Phys. Rev. Lett. 100,
020603.
Bonomi, D., Branduardi, G., and Bussi, C. (2009). PLUMED: A portable plugin for free-energy calculations with molecular dynamics. Comput. Phys. Commun.
180, 1961–1972.
Braden, M.R., Parrish, J.C., Naylor, J.C., and Nichols, D.E. (2006). Molecular interaction of serotonin 5-HT2A receptor residues Phe339(6.51) and Phe340(6.52)
with superpotent N-benzyl phenethylamine agonists. Mol. Pharmacol. 70, 1956–1964.
Branduardi, D., Gervasio, F.L., and Parrinello, M. (2007). From A to B in free energy space. J. Chem. Phys. 126, 054103.
Gonzalez-Maeso, J., Rodrıguez-Puertas, R., and Meana, J.J. (2002). Quantitative stoichiometry of G-proteins activated by mu-opioid receptors in postmortem
human brain. Eur. J. Pharmacol. 452, 21–33.
Hof, P.R., et al (2000). Comparative Cytoarchitectonic Atlas of the C57BL/6 and 129/Sv Mouse Brains (Amsterdam: Elsevier).
Kanagarajadurai, K., Malini, M., Bhattacharya, A., Panicker, M.M., and Sowdhamini, R. (2009). Molecular modeling and docking studies of human 5-hydroxytryp-
tamine 2A (5-HT2A) receptor for the identification of hotspots for ligand binding. Mol. Biosyst. 5, 1877–1888.
Lazaridis, T. (2003). Effective energy function for proteins in lipid membranes. Proteins 52, 176–192.
MacKerell, A.D., Bashford, D., and Bellot, M. (1998). All-atom empirical potential for molecular modeling and dynamics. J. Phys. Chem. 102, 3586–3616.
Mackerell, A.D., Jr., Feig, M., and Brooks, C.L., 3rd. (2004). Extending the treatment of backbone energetics in protein force fields: limitations of gas-phase
quantum mechanics in reproducing protein conformational distributions in molecular dynamics simulations. J. Comput. Chem. 25, 1400–1415.
Michailidis, I.E., Rusinova, R., Georgakopoulos, A., Chen, Y., Iyengar, R., Robakis, N.K., Logothetis, D.E., and Baki, L. (2011). Phosphatidylinositol-4,5-bisphos-
phate regulates epidermal growth factor receptor activation. Pflugers Arch. 461, 387–397.
Morris, B.J., Cochran, S.M., and Pratt, J.A. (2005). PCP: from pharmacology to modelling schizophrenia. Curr. Opin. Pharmacol. 5, 101–106.
Phillips, J.C., Braun, R., Wang, W., Gumbart, J., Tajkhorshid, E., Villa, E., Chipot, C., Skeel, R.D., Kale, L., and Schulten, K. (2005). Scalable molecular dynamics
with NAMD. J. Comput. Chem. 26, 1781–1802.
Rasmussen, S.G., DeVree, B.T., Zou, Y., Kruse, A.C., Chung, K.Y., Kobilka, T.S., Thian, F.S., Chae, P.S., Pardon, E., Calinski, D., et al. (2011). Crystal structure of
the b2 adrenergic receptor-Gs protein complex. Nature 477, 549–555.
Cell 147, 1011–1023, November 23, 2011 ª2011 Elsevier Inc. S3

Roth, B.L., Shoham,M., Choudhary,M.S., and Khan, N. (1997). Identification of conserved aromatic residues essential for agonist binding and secondmessenger
production at 5-hydroxytryptamine2A receptors. Mol. Pharmacol. 52, 259–266.
Scheerer, P., Park, J.H., Hildebrand, P.W., Kim, Y.J., Krauss, N., Choe, H.W., Hofmann, K.P., and Ernst, O.P. (2008). Crystal structure of opsin in its G-protein-
interacting conformation. Nature 455, 497–502.
Vanommeslaeghe, K., Hatcher, E., Acharya, C., Kundu, S., Zhong, S., Shim, J., Darian, E., Guvench, O., Lopes, P., Vorobyov, I., and Mackerell, A.D., Jr. (2010).
CHARMM general force field: A force field for drug-like molecules compatible with the CHARMM all-atom additive biological force fields. J. Comput. Chem. 31,
671–690.
Vivaudou,M., Chan, K.W., Sui, J.L., Jan, L.Y., Reuveny, E., and Logothetis, D.E. (1997). Probing the G-protein regulation of GIRK1 andGIRK4, the two subunits of
the KACh channel, using functional homomeric mutants. J. Biol. Chem. 272, 31553–31560.
S4 Cell 147, 1011–1023, November 23, 2011 ª2011 Elsevier Inc.

Figure S1. The Increase in Gi Signaling and Decrease in Gq Signaling Depend on Heterocomplex Formation, Related to Figure 1
Bar graph summary of IRK3 current inhibition (left) and GIRK4* current activation (right) (mean ± SEM) in oocytes expressing 2AR alone or 2AR together with
mGluR2 (A), mGluR2D (B), mGluR3 (C), ormGluR3D (D). IRK3 current inhibition andGIRK4* current activation weremeasured and normalized as in Figures 1D and
1E, respectively. Currents were obtained in response to 1 mM of the endogenous ligand serotonin (5-HT) and 1 mM of endogenous ligand glutamate (Glu).
Coexpression of mGluR2Dwith 2AR did not result in a significant decrease in Gq signaling in response to 5-HT or a significant increase in Gi signaling in response
to Glu (C) when compared to the group coexpressing mGluR2 and 2AR (A). Similarly, both effects were absent for mGluR3 (B), but present for mGluR3D (D) (**p <
0.01; ***p < 0.001; n.s., not significant). The Nissl staining of the coronal cortex was taken from themouse brain atlas with the author’s permission (Hof et al., 2000).
(E) Representative epifluorescencemicrographs showing coexpression of endogenous 2AR (red) andmGluR2 (green) inmouse frontal cortex sections. Scale bar,
100 mm.
Cell 147, 1011–1023, November 23, 2011 ª2011 Elsevier Inc. S5

Figure S2. Expression Levels of mGluR2, mGluR2D, mGluR3, and mGluR3D, Related to Figure 1
(A) Representative GIRK4* barium-sensitive traces obtained in response to 1 mM glutamate. mGluR2, mGluR2D, mGluR3D, and mGluR3Dwere functional as Gi-
coupled GPCRs.
(B) Statistical summary of basal current (mean ± SEM) (***p < 0.001).
(C) Statistical summary of glutamate agonist-induced current (mean ± SEM). GIRK4* current activation was measured and normalized as in Figure 1D. Current
activation for mGluR2 (1), mGluR3 (2), mGluR2D (3), and mGluR3D (4) were similar compared with noninjected (5) (***p < 0.001).
(D) Data summary (mean ± SEM) of measured receptor membrane expression levels. Expression was measured with surface labeled receptors and quantitated
with a chemiluminescence assay. Chemiluminescence intensity is expressed in logarithmic units and normalized to the background noninjected intensity level.
Expression levels were similar for all constructs (1, 2, 3, and 4) compared to noninjected (5) (***p < 0.001; n.s, not significant).
S6 Cell 147, 1011–1023, November 23, 2011 ª2011 Elsevier Inc.

Figure S3. Changes in Injected 2ARmRNA Alter Expression Levels of the Complex in the Membrane and the Difference in Gi to Gq Signaling,
Related to Figure 1
(A) Western blot analysis of the membrane fraction of oocytes, injected with 1 ng of HA-taggedmGluR2 RNA (mGluR2), or 2 ng of myc-tagged 2AR RNA (2AR), or
1 ng of HA-tagged mGluR2 RNA plus various amounts of 2AR RNA (mGluR2/2AR RNA ratios are shown on top of each lane).
(B) Summary of densitometry data for mGluR2 (left) and 2AR (right) from experiments such as the one shown in (A), normalized relative to mGluR2 (left) or 2AR
(right) protein levels in oocytes injected with 1 ng of mGluR2 + 2 ng of 2ARmRNAs. Data are from 1–4 independent experiment (see numbers on top of each bar).
‘‘mGluR2’’ indicates homomeric expression of 1 ng mGluR2 mRNA and ‘‘2AR’’ indicates homomeric expression of 2 ng of 2AR mRNA.
(C) Expression levels of mGluR2 (blue filled bars) and 2AR (red filled bars) in the membrane. Data summary (mean ± SEM) of measured receptor membrane
expression levels (as were shown in Figure S2D) for oocytes injected with 1 ng of mGluR2mRNA and 1 ng, 2 ng, and 3 ng of 2ARmRNA, respectively. Expression
was measured with surface-labeled receptors and quantitated with a chemiluminescence assay. Chemiluminescence was normalized to the signal obtained in
oocytes injected with 1 ng of mGluR2 alone (empty blue bars). For reference, the levels corresponding to oocytes injected with 1 ng, 2 ng, and 3 ng of 2AR alone
are also depicted (empty red bars). All signal levels were at least 500 times higher than background.
(D) Changes in injected 2AR mRNA alter the Gi and Gq balance. DGi and DGqmeasured in oocytes injected with 1 ng mGluR2 mRNA and 1 ng, 2 ng, and 3 ng of
2AR mRNA, respectively. DGi is referenced to the homomeric mGluR2 (1 ng or mRNA) response to 1 mM glutamate. (Left) DGq is referenced to multiple ho-
momeric 2AR responses to 1 mM serotonin corresponding to 1 ng, 2 ng, and 3 ng of injected 2AR mRNA. (Right) DGq is referenced to one single homomeric
response to 1 mM serotonin corresponding to 2 ng injected 2AR mRNA. Data are mean ± SEM.
Cell 147, 1011–1023, November 23, 2011 ª2011 Elsevier Inc. S7

Figure S4. Homomeric and Heteromeric Dose-Response Curves for DOI, LY37, and LY34, Related to Figure 3
(A) Dose-response curve showing normalized Gq activation elicited by DOI in oocytes expressing 2AR. Gq-mediated IRK3 current inhibition was measured and
normalized as in Figure 1D (EC50 = 3.6 3 10�7 ± 1.05 3 10�7).
(B) Dose-response curve showing normalized Gi activation elicited by LY37 in oocytes expressing mGluR2. Gi-mediated GIRK4* current stimulation was
measured and normalized as in Figure 1E (EC50 = 1.3 3 10�7 ± 6.4 3 10�9).
(C) LY34 behaves as an inverse agonist. Dose-response curve showing normalized Gi inhibition elicited by LY34 in oocytes expressing mGluR2. Gi-mediated
GIRK4* current inhibition was measured and normalized as in Figure 1E. Gi inhibition is shown indicating LY34 inverse agonism (IC50 = 8.23 10�5 ± 1.73 10�6).
(D and E) Clozapine, and not methysergide, behaves as an inverse agonist in mouse frontal cortex membrane preparations. [3H]Ketanserin binding displacement
curves by clozapine (D) or methysergide (E) in the absence (black) and in the presence (red) of 10 mMGTPgS. Clozapine displacing [3H]ketanserin binding: pKi-high
control, �8.01 ± 0.1; pKi-low control, �5.64 ± 0.4; fraction high, 0.77 ± 0.06; pKi GTPgS, �8.07 ± 0.05 (F [3,78] = 4.99, p < 0.01). Methysergide displacing [3H]
ketanserin binding: pKi control, �7.16 ± 0.08; pKi GTPgS, �7.15 ± 0.07 (F [3,88] = 0.05, p = 0.98).
(F) Dose-response curves showing cross signaling with LY37 in the absence of serotonin (5) (EC50 = 9.34 3 10�7 ± 1.13 3 10�7), dominant-agonist effect with
LY37 (4) (EC50 = 8.353 10�7 ± 3.373 10�8), and inverse-agonist effect with LY34 (2) (EC50 = 8.23 10�5 ± 1.63 10�6) and serotonin signaling. The Gq response
by heteromer formation is indicated by the dashed lines [from (1) to (3)] (see also Figures S6A and S6B for LY37 effects in 2AR-KO mice).
(G) Dose-response curves showing cross signaling with DOI in the absence of glutamate (5) (EC50 = 9.493 10�7 ± 4.33 10�7), dominant-agonist effect with DOI
(4) (EC50 = 3.72 3 10�7 ± 8.45 3 10�8), and inverse-agonist effect with clozapine (1) (EC50 = 2.02 3 10��5 ± 7.10 3 10�6) of Glu signaling. The Gi response by
heteromer formation is indicated by the dashed lines [from (3) to (2)].
Data are mean ± SEM.
S8 Cell 147, 1011–1023, November 23, 2011 ª2011 Elsevier Inc.

Figure S5. LY37 and LY34 Effects on Gq Activity Are PTX Insensitive but RGS Sensitive, Related to Figure 3
(A) Representative GIRK4* barium-sensitive current traces in oocytes expressing mGluR2 alone or mGluR2 together with PTX.
(B) Bar graph summary of normalized Gi activity (mean ± SEM) elicited by glutamate (1 mM) in the presence and absence of PTX. GIRK4* current activation was
measured and normalized as in Figure 1E.
(C and D) Bar graph summary of Gq activity (mean ± SEM) in response to 5-HT (1 mM) alone, or together with LY37 (10 mM) or LY34 (10 mM), measured in oocytes
expressing mGluR2, 2AR, and PTX (C) or RGS2 (D). IRK3 current inhibition was measured and normalized as in Figure 1D.
(E) Bar graph summary of Gi activity (mean ± SEM) measured in oocytes expressing mGluR2, 2AR, and RGS2. GIRK4* current activation was measured and
normalized as in Figure 1E.
Cell 147, 1011–1023, November 23, 2011 ª2011 Elsevier Inc. S9

Figure S6. Biochemical Studies in 2AR-KO Mouse Frontal Cortex: LY37-Mediated Gi Activation Is Unaffected, whereas Gq Activation and
Upmodulation of mGluR2-Dependent Gi Signaling by Clozapine Are Abolished, Related to Figure 5
(A and B) LY37-stimulated [35S]GTPgSbinding inwild-type (WT) and 2AR-KOmouse frontal cortexmembrane preparations followed by immunoprecipitationwith
anti-Gai (A) or anti-Gaq (B) antibodies after treatment with vehicle or 10 mM LY37. Data are mean ± SEM (*p < 0.05; ***p < 0.001; n.s., not significant).
(C) DCG IV-stimulated [35S]GTPgS binding in 2A-KOmouse frontal cortex membranes followed by immunoprecipitation with anti-Gai antibody in the presence or
clozapine or vehicle. Data are mean ± SEM (*p < 0.05; n.s., not significant). (Compare with Figure 5A in wild-type mice.)
S10 Cell 147, 1011–1023, November 23, 2011 ª2011 Elsevier Inc.

Figure S7. Dose-Response Effect of Clozapine in the Locomotor Response Induced by MK801, Related to Figure 5
(A) Left panel depicts representative time courses of MK801-induced locomotionmeasured in 5min block. Mice were administered clozapine (1.5 or 10mg/kg) or
vehicle followed by MK801 (0.5 mg/kg). Time of injection is indicated by arrow. The right panel shows bar graph summaries of the total of MK801-induced
locomotion as a summation of horizontal activity from t = 30 min to t = 120 min. Mice were administered clozapine (at the indicated dose) or vehicle followed by
MK801 (0.5 mg/kg). Data are mean ± SEM (n = 5-20); (*p < 0.05; **p < 0.01; n.s., not significant).
(B and C) Data summary of the total MK801-induced locomotion as a summation of horizontal activity from t = 30 min to t = 120min. mGluR2-KO (B) and 2AR-KO
mice (C) were administered clozapine at 10 mg/kg (cyan), and we compared the response to that of LY37 (purple), or clozapine at 1.5 mg/kg (purple), or vehicle
(red), followed by MK801. Data are mean ± SEM (n = 4–10); (*p < 0.05; **p < 0.01; n.s., not significant).
(D and E) Methysergide does not modulate the locomotor response induced by MK801 but abolishes the head-twitch response induced by DOI. (D) Mice were
administered methysergide (3 mg/kg) or vehicle, followed by MK801 (0.5 mg/kg) or vehicle. Data are mean ± SEM (n = 4–6) (*p < 0.05; n.s., not significant). (E)
Head-twitch response was determined in mice injected with DOI (2 mg/kg) 15 min after being injected with methysergide (3 mg/kg). Data are mean ± SEM (n = 5
per group). ***p < 0.001. These data suggest that although methysergide binds as a neutral antagonist to 2AR and blocks the behavioral responses induced by
2AR agonists, it does not induce antipsychotic-like effects.
Cell 147, 1011–1023, November 23, 2011 ª2011 Elsevier Inc. S11

Table S1. Cross-Signaling, DownModulation, and Upmodulation Depend on
Heterocomplex Formation, Related to Figure 2
Summary of GIRK4* current activation (Gi) and IRK3 current inhibition (Gq) (mean ± SD) in
oocytes expressing 2AR alone or 2AR together with mGluR2, mGluR2, mGluR3, or
mGluR3. IRK3 current inhibition and GIRK4* current activation were measured and
normalized as in Figure 1, D and E respectively. Currents were obtained in response to 1 M
of the endogenous ligand serotonin (5-HT) and 1 M of endogenous ligand glutamate (Glu).
For Gq values were obtained in response to 1 M of the endogenous ligand serotonin (5-HT),
1 M serotonin together with 50 M LY34, serotonin 1 M together with 50 M LY37, or 50
M LY37 alone. For Gi values were obtained in response to 1 M of the endogenous ligand
glutamate (Glut), 1 M glutamate together with 50 M clozapine, serotonin 1 M together with
50 M DOI, or 50 M DOI alone. Gq: 5-HT, 5-HT + LY34, and 5-HT + LY37 treatments were
significantly different for mGluR2/2AR and mGluR3/2AR (p<0.05). Gi: Glu, Glu + Clozapine,
and Glu + DOI treatments were only significantly diffferent for mGluR2/2AR and
mGluR3/2AR (p<0.005).
Gi mGluR2 / 2AR mGluR3 / 2AR
5-HT
5-HT + LY34
5-HT + LY37
LY37
Gq mGluR2 / 2AR mGluR3 / 2AR
Glu
Glu + Clozapine
Glu + DOI
DOI
mGluR2 / 2AR mGluR3 / 2AR
0.43 ± 0.04 1.02 ± 0.23 0.98 ± 0.14 0.65 ± 0.26
0.83 ± 0.18 1.07 ± 0.17 0.98 ± 0.16 1.00 ± 0.13
0.23 ± 0.03 1.00 ± 0.05 0.87 ± 0.31 0.23 ± 0.14
0.26 ± 0.14 0.02 ± 0.01 0.021 ± 0.01 0.11 ± 0.06
mGluR2 / 2AR mGluR3 / 2AR
1.98 ± 0.87 0.94 ± 0.27 1.07 ± 0.17 2.30 ± 0.68
2.80 ± 0.37 1.23 ± 0.32 0.90 ± 0.11 2.97 ± 0.29
0.99 ± 0.22 1.23 ± 0.24 1.07 ± 0.32 1.12 ± 0.37
0.35 ± 0.18 0.01 ± 0.00 0.01 ± 0.00 0.37 ± 0.16

Table S2. Balance Index Calculations, Related to Figure 4
Balance Index (BI) Calculations for clozapine, risperidone, LY37, methysergide, eGlu, LY34
and DOI at 10 M (BI10) and 50 M concentration (BI50).
Clozapine 1.32 -0.98 2.3 1.68 -0.98 2.66
Risperidone 1.36 -0.82 2.18 1.69 -0.9 2.59
LY37 1.45 -0.65 2.1 1.55 -0.77 2.32
Ritanserin 1.12 -0.77 1.89 1.17 -0.85 2.02
Methysergide 0.96 -0.80 1.76 0.95 -0.82 1.77
eGlu 0.54 -0.44 0.98 0.39 -0.45 0.84
LY34 -1.02 -0.20 -0.82 -1.07 -0.17 -0.9
DOI -0.01 0.95 -0.96 -0.01 1.39 -1.4
Gi Gq BI 10 Gi Gq BI 50