declaration - .: national power training institute · web viewsummer training report o n...
TRANSCRIPT

SUMMER TRAINING REPORT
On
ANALYSIS OF OPPORTUNITTY IN INTEGRATED TURNKEY SOLAR PV PROJECTS-
A study of financial modelling and project viabilityAt
LARSEN AND TOUBRO Ltd., CHENNAI
AUGUST-2013Under the guidance of
Mr. MILAN KUMAR
Sr. General Manager and Head – EDRC
Mr. RAJEEV B AGARWAL
Business Acquisition Head for Integrated Mega Solar PV farms
Dr. MANISHA RANI
Sr. Fellow NPTI Faridabad
Prepared by
DHEERAJ CHAWLA
Roll no. 103
MBA - Power Management, Class: 2012-14
Centre for Advanced Management and Power Studies (CAMPS)
NATIONAL POWER TRAINING INSTITUTE (NPTI), Faridabad
Submitted to
MAHARISHI DAYANAND UNIVERSITY, ROHTAK
AUG,2013
Page | I

DECLARATION
I, Dheeraj Chawla , student of MBA-Power Management (2012-14) at National Power Training
Institute, Faridabad hereby declare that the Summer Training Report entitled
“ANALYSIS OF OPPORTUNITY IN INTEGRATED TURNKEY SOLAR PV
PROJECTS
A study of financial modeling and project viability”
is an original work and the same has not been submitted to any other institute for the award of
any other degree.
A seminar presentation of the Training Report was made on 1st August and the suggestions
approved by the faculty were duly incorporated.
Presentation In charge
COUNTERSIGNED
DIRECTOR/PRINCIPAL OF INSTITUTE
Signature of the Candidate
Page | II
CERTIFICATE
Page | III

ACKNOWLEDGEMENT
I have no words to express my sincere gratitude to all the people who had been associated with
me in some way or the other and helped me avail this opportunity for my summer Internship
on the topic “Analysis of opportunity in integrated turnkey Solar PV projects-A study of
financial modeling and project viability”.
I express my heartily thanks to Mr. Milan Kumar (Senior General Manager and Head,
EDRC ) for providing me the opportunity to work on such an insightful project.
I acknowledge with gratitude and humanity my indebtedness to my Summer Internship guide Mr. Rajeev Agarwal ( Business Acquisition Head for Integrated Mega Solar PV farms) for providing me excellent guidance and motivation under whom I completed my summer internship.
I would like to take the opportunity to thanks Mr. Prateek, Mr. Vineet, Mr. Dinesh for their
guidance and support throughout the course of my project.
I would also like to thanks Mr. Bhatt Gurudutt ( NPTI 10 th Batch) for his valuable guidance
throughout the course of my project.
I would like to thank my Project In-charge Dr. Manisha, (Senior Fellow) Faridabad for his
support and guidance throughout the course of summer internship.
A special thanks to Mrs. Indu Maheswari, Dy. Director, NPTI for her guidance throughout my
summer internship.
I would like to thank Mr. J.S.S. Rao, Principal Director (NPTI), Mrs. Manju Mam, Dy.
Director, NPTI and all faculty members for arranging my internship at L&T and being
a constant source of motivation and guidance throughout the course of my internship.
Thank you for all for being there for me always.
Dheeraj Chawla
Page | IV

EXECUTIVE SUMMARY
Solar energy technology in India is gaining swift acceptance. According to white paper released by FICCI “India is the Saudi Arabia of renewable energy, if properly utilized”. India is well-placed to benefit from the successful development of the solar energy
industry. The growth in the Indian solar market is driven by central and state incentives and
individual solar policies rolled out by states. The country has an aggressive nation-wide policy in
place and states have been pro-active in promoting solar by way of separate state-level policies
and incentives. Such strong support from the government has created confidence among banks
such that they can offer financing options for solar power projects. Moreover, India is also one of
the few markets that are moving away from a policy driven to a parity driven scenario. With
increasing costs of conventional power, solar is already viable for certain consumers in many parts
of the country. Hence, with a robust framework of solar policies and an environment conducive to
the development of solar, the Indian solar market provides a huge untapped potential for solar.
India is facing an acute energy deficit of 10-13%. Industrial and commercial electricity prices have
risen by nearly 11% p.a. from 2000 to 2010. Rising grid electricity prices, frequent power
interruptions, costly diesel backup electricity and falling costs of solar energy, have made solar PV
an attractive technology. Here project include analysis of state policies of different state hence as
EPC point of view to motivate developer to invest in the state and sign PPA.
PROJECT: ANALYIS OF OPPORTUNITY IN INTEGRATED TURNKEY SOLAR PV
PROJECTS-A study of financial modeling and project viability
The report covers the analysis of financial viability and bankability of solar PV projects under
REC route and Preferential/Open access route. The report starts with analysis comprehensive
analysis on state policy of Gujarat,Tamilnadu and Andhra Pradesh and project viability under
possible routes. The power purchase agreement is the main key of project execution. This report
gives the practical scenario of power purchase agreement under state policy of Gujarat, Tamilnadu
and Andhra Pradesh. It further provides the background of the projects from which power
Page | V

purchase is proposed. It analyzes each business model of PPA and analyze through policies of
different state through different routes (REC/FIT/Third party or open access).
Analysis of Financial Modeling of Solar PV
Financial model helps the developer to explore in detail the financial benefits and costs associated
with the investment. This facilitates the identification of key variables affecting the project value
and enables financing decisions.
This model is 360% ‘GO-NO-GO’ financing model.
Investor point of view: The investment is said to be reasonable investment if project
Internal rate of return is greater than weighted average cost of capital.
IRR > WACC (Acceptable)
Developer point of view: Developer is keen to know about equity internal rate of return,
because projects are usually financed with equity and debt. Hence developer decision is to
implement project or not depends upon equity internal rate of return.
EPC point of view: EPC is the main key to success of solar plant. With the help of
financial model an EPC provider understands the need of developer and tailored his model
and negotiate, if profitable.
Single model for all possible routes: This model is carefully designed to see the market
scenario of solar business models and helpful to all developers, lenders or any third party
who has freedom to do sensitivity analysis without limitation of preference of route.
Govt. point of view: Tariff calculation and to access the project economics, this all come
from precise financial modeling.
Lender point of view: lender will invest in project if they come to know the capability of
the project to cover debt, Hence they are focused on debt service coverage ratio (DSCR).
DSCR = Cash flow available before debt services / debt service requirement
Managerial point of view: Financial modeling is a need of an hour for successful manager.
He has the ability to play with numbers.
Page | VI

It is used for “WHAT IF ANALYSIS”. It is a model top show what will happen if this
parameters going to change in future and how to overcome.
It is used for decision making whether project would be accepted or not.
It is used for measurement of risk in advance and prepares strategies to prevent risk.
Corporate finance: To assist in deciding the best capital/corporate structure of a
company.
Project financing: if borrowing money, banks will usually wants to see a model, which
shows the borrower will be able to meet the repayments, and stay within the covenants set
by the bank.
A generalized financial model for Solar PV power plant has been developed with flexibility to
vary inputs like Time of PPA signed ( one may choose PPA period 20 year or 25 year or any
other as per agreement), time taken for construction, EPC cost, capital cost, interest rates, capacity
utilization factor (CUF), tax rates etc. The model is universal model for any solar business model,
that is single model is applicable either one go through REC route or Preferential Tariff or Open
Access. Looking at the uncertainty regarding price of RECs post-2017 (i.e. current Control
Period), model has been developed with a flexibility to vary REC price also. Eventually financial
indicators like IRR and DSCR have been calculated to know the project feasibility at different
level of inputs. The model developed in is based on assumption as provided by L&T. The report is
meant for investors, project developers and EPC players.
Page | VII

LIST OF ABBREVIATION
APPC Average Power Purchase cost
ARR Annual Revenue Requirement
BOOT Build, Own, Operate and Transfer
CEA Central Electricity Authority
CERC Central Electricity Regulatory Commission
CFA Central Financial Assistance
COD Commercial Operation Date
CDM Clean Development Mechanism
CSP Concentrated Solar Plant
DISCOM Distribution Companies
DPR Detailed Project Report
DSCR Debt Service Coverage Ratio
DSM Demand Side Management
EA, 2003 Electricity Act, 2003
EPC Engineering, Procurement and Construction
EPS Electric Power Survey
ERC Electricity Regulatory Commission
FIT Feed In Tariff
FICCI Federation Of Indian Chambers Of Commerce & Industry
GENCO Generation Company
GOI Government of India
ICB International Competitive Bidding
IDC Interest during Construction
IPP Independent Power Producer
Page | VIII

IRR Internal Rate Of Return
JNNSM Jawaharlal Nehru National Solar Mission
JV Joint Venture
L&T Larsen And Toubro
MOA Memorandum of Agreement
MNRE Ministry of New and Renewable Energy
MYT Multi Year Tariff
NAPCC National Action Plan for Climate Change
NPTI National Power Training Institute
NSM National Solar Mission
O&M Operation and Maintenance
PAF Plant Availability Factor
PLF Plant Load Factor
PPA Power Purchase Agreement
RFP Request for Proposal
REC Renewable Energy Certificate
ROE Return on Equity
RPO Renewable Purchase Obligation
RPSSGP Rooftop PV & Small Solar Power Generation Programme
SBD Standard Bid Document
SERC State Electricity Regulatory Commission
VGF Viability Gap Funding
WACC Weighted Average Cost Of Capital
Page | IX

WEIGHTS AND MEASURES
BU (billion unit) − Unit of energy, equal to 1 X 10⁹units
MWh (megawatt-hour) − Unit of energy, equal to 1 X 10³ units
MW (megawatt) – Unit of power, equal to 1 X 10⁶watts
GW (gigawatt) − Unit of power, equal to 1 billion (109) watts
Conversion:
1 million = 1x10⁶
1 billion = 1x10⁹
1 lakh = 1x10⁵
1 crore = 1x10⁷
Page | X

BANKING SECTOR DATA INDIA1
MAT (Minimum Alternative Tax)- 20.1% 2
Corporate Tax- 32.45%3
Repo Rate- 7.25% (Previous 7.5%)
SLR (Statutory Liquidity Ratio)- 23%
CRR-(Cash Reserve Ratio) - 4% (Previous 4.25%)
Marginal Standing Facility Rate- 8.25% (Previous 4.25%)
Bank Rate- 8.25% (Previous 8.5%)
Base Rate- 9.7% -10.25%
Interest on Loan 300bps + SBI Base Rate
Interest on Working Capital 350bps+SBI Base Rate
1 Source :Reserve Bank of India by May 2013 www.rbi.org.in2 MAT (18.5%) + Surcharge( 5%) + Education Cess( 3%) = 20.1%3 Basic Tax (30%) +Surcharge(5%)+education Cess(3%)=32.45%
Page | XI

LIST OF TABLES
Table 1: Various projects of L&T....................................................................................................17
Table 2:Plan For JNNSM.................................................................................................................24
Table 4: Grid data across states, source CERC tariff order, CEA report.........................................34
Table 5: Solar policies, Source Bridge to India...............................................................................43
Table 6: EPC VS Project IRR, Equity IRR, DSCR in Tamilnadu CUF 19%..................................54
Table 7: EPC VS Project IRR, Equity IRR, DSCR in Tamilnadu CUF 20%..................................54
Table 8: EPC VS Project IRR, Equity IRR, DSCR in Tamilnadu CUF 21%..................................54
Table 9: EPC VS Project IRR, Equity IRR, DSCR in AP CUF19%...............................................55
Table 10 : EPC VS Project IRR, Equity IRR, DSCR in AP CUF 20%...........................................55
Table 11: EPC VS Project IRR, Equity IRR,DSCR in AP CUF 21%.............................................55
Table 12: EPC VS Project IRR, Equity IRR, DSCR in GUJARAT CUF 19%...............................56
Table 13 : EPC VS Project IRR, Equity IRR, DSCR in GUJARAT CUF 20%..............................56
Table 14: EPC VS Project IRR, Equity IRR,DSCR in GUJARAT CUF21%.................................56
Page | XII

LIST OF FIGURES
Figure 1: Installed capacity till june 2013..........................................................................................3
Figure 2: L&T Organizational Profile Review................................................................................15
Figure 3:RE Attributes.....................................................................................................................25
Figure 4:Research Methodology......................................................................................................27
Figure 5: Conical diagram of solar PPA's........................................................................................28
Figure 6:Power Purchase Mechanism..............................................................................................31
Figure 7: Seesaw analysis of Gujarat...............................................................................................37
Figure 8: Seesaw diagram of analysis of AP...................................................................................39
Figure 9: Seesaw diagram of analysis of Tamilnadu.......................................................................42
Figure 10 : Flow diagram PPA process...........................................................................................44
Figure 11 :Cost estimate per project phase......................................................................................46
Figure 12 : Standard project finance model.....................................................................................52
Figure 13: Risk scenario & Conclusion...........................................................................................58
Figure 14: Scenario analysis 1 MW Solar PV(IRR , DSCR calculation REC route and Preferential
or Open access )...............................................................................................................................59
Page | XIII

TABLE OF CONTENTS
DECLARATION...............................................................................................................................II
CERTIFICATE................................................................................................................................III
ACKNOWLEDGEMENT...............................................................................................................IV
executive summary............................................................................................................................V
LIST OF ABBREVIATION.........................................................................................................VIII
WEIGHTS AND MEASURES.........................................................................................................X
BANKING SECTOR DATA INDIA..............................................................................................XI
LIST OF TABLES.........................................................................................................................XII
LIST OF FIGURES.......................................................................................................................XIII
Chapter 1. : INTRODUCTION.....................................................................................................1
1.1. Renewable energy in India..................................................................................................1
1.1.1. Evolution and potential................................................................................................1
1.1.2. Current scenario...........................................................................................................3
1.1.3. Need for renewable energy in India.............................................................................4
1.1.4. Promotion of renewable energy...................................................................................4
1.2. Why solar???.......................................................................................................................8
Page | XIV

1.2.1. Economic Advantages..................................................................................................9
1.2.2. Fiscal Advantages........................................................................................................9
1.2.3. Technical Advantages..................................................................................................9
1.3. Power purchase agreement................................................................................................10
1.4. Financial modeling............................................................................................................11
1.4.1. Advantages.................................................................................................................11
1.4.2. Applications...............................................................................................................11
1.5. Need of PPA......................................................................................................................12
1.6. Need of financial modeling...............................................................................................12
1.7. Objective of Report...........................................................................................................13
1.8. Scope of work....................................................................................................................14
1.9. Organization profile review...............................................................................................15
1.9.1. Larsen and Toubro:....................................................................................................15
1.9.2. Critical assessment of organization............................................................................17
1.9.3. Suggestion and Recommendation to LNT.................................................................19
Chapter 2. : LITERATURE REVIEW, REGULATORY FRAMEWORK & RESEARCH
METHODOLOGY...........................................................................................................................20
2.1. Literature review...............................................................................................................20
2.2. Policy design and Regulatory framework of RE...............................................................22
2.2.1. Central Government...................................................................................................22
2.2.2. Central regulatory electricity commission (CERC)...................................................25
Page | XV

2.2.3. State regulatory electricity commission (SERC).......................................................26
2.3. Research methodology......................................................................................................27
Chapter 3. : ANALYSIS OF PPA...............................................................................................28
3.1. Solar PPA market models:................................................................................................28
3.1.1. PPA with Preferential Tariff......................................................................................29
3.1.2. PPA with APPC + REC.............................................................................................29
3.1.3. PPA with open access................................................................................................30
3.1.4. PPA financing model:................................................................................................31
3.1.5. Viability gap funding ................................................................................................32
Chapter 4. ANALYSIS OF DIFFERENT STATE SOLAR POLICY........................................34
4.1. Basic models of state policies:..........................................................................................35
4.1.1. Gujarat solar policy....................................................................................................36
4.1.2. Andhra Pradesh solar policy......................................................................................38
4.1.3. Tamilnadu solar policy...............................................................................................40
4.2. Overview of solar policies.................................................................................................43
Chapter 5. FINANCIAL ANALYSIS OF PROJECT.................................................................44
5.1. Financial modeling............................................................................................................44
5.2. Cost estimates....................................................................................................................44
5.3. Development of project model..........................................................................................46
5.4. Analysis of financial indicators.........................................................................................47
5.5. Sensitivity analysis............................................................................................................53
Page | XVI
5.6. Risk analysis......................................................................................................................53
Chapter 6. SUMMARY...............................................................................................................54
6.1. Finding and Conclusion.....................................................................................................54
6.2. Recommendation:..............................................................................................................60
6.3. Bibliography......................................................................................................................61
Chapter 7. : CURRENT SOLAR NEWS....................................................................................62
Chapter 8. : APPENDIX & FINANCIAL SHEET......................................................................64
Page | XVII

CHAPTER 1. : INTRODUCTION
1.1. Renewable energy in India
1.1.1. Evolution and potential
According to white paper released by FICCI in Dec 2012, “India is the Saudi Arabia of
renewable energy resources, if properly utilized.”
India has tremendous energy needs and an increasing difficulty in meeting those needs through
traditional means of power generation. On July 30th and 31st, 2012 the world's largest blackout,
The Great Indian Outage, stretching from New Delhi to Kolkata occurred. This blackout, due to
failure of the northern power grid, caused nearly 700 million people — twice the population of
the United States — to be without electricity.
A grid failure of such magnitude has thrown light onto India's massive demand for electricity,
together with its struggle to generate as much power as it needs. India is aiming to expand its
power-generation capacity by 44 percent over the next five years but recent problems indicate
the scale of the challenge. Even before the blackout, in June of 2012, the country's power
generation fell short by 5.8 percent when confronted with a peak-hour demand of 128 GW,
according to Government data.
For economic as well as environmental reasons India needs to shift to non-polluting renewable
sources of energy to meet future demand for electricity. Renewable energy is the most attractive
investment because it will provide long-term economic growth for India. A favorable renewable
energy policy could create millions of new jobs and an economic stimulus of at least US$1 trillion,
and perhaps much more if all indirect economic (ripple) effects are included. "India is the Saudi
Arabia of renewable energy sources and if properly utilized, India can realize its place in the
world as a great power," Rifkin says.4
4 Source: paper released by FICCI http://www.ficci.com/pressrelease/856/FICCI-press-jan-17-megatrends.pdf
Page | 1

A number of facts and factors make the Indian renewable energy market exciting for
entrepreneurs and investors. Here are some highlights:
1. India is the most developed renewable energy market in South Asia, with annual revenues of
about USD 185 billion.
2. It is the third most attractive country to invest in renewable energy, according to Ernst &
Young.
3. The overall demand-supply gap in the energy sector is expanding due to an increase in the
population’s standard of living. The demand-supply gap in power is currently at 10.3 percent and
is one of the key drivers of renewable energy.
4. The utilization of renewable energy sources is still relatively low in India, thus presenting
excellent business potential.
5. India rank 4th in renewable energy market potential according to E&Y5
6. India has been attracting over USD 3 billion investment every year in renewable sector
7. The country is emerging as one of the largest potential sources of Certified Emission
Reduction (CER) and Renewable Energy Certificates (REC).
5Source : http://articles.economictimes.indiatimes.com/2012-11-07/news/34970855_1_renewable-energy-tonnes-of-oil-equivalent-global-economy
Page | 2

1.1.2. Current scenario
Page | 3

Figure 1: Installed capacity till june 2013
1.1.3. Need for renewable energy in India
Among all the prominent solar markets, India is one of the most attractive markets for the
development of solar. Unlike many of its counterparts, India is an energy deficient country,
which requires an immediate solution that caters to its energy needs. The power deficit in India
continues to increase with every passing year. India has abundant solar resource and capacity
addition using solar power can be the fastest among all other alternatives. It provides the
optimum solution to India’s power problems. The country has an aggressive nation-wide policy
in place and states have been pro-active in promoting solar by way of separate state-level
policies and incentives. Such strong support from the government has created confidence among
banks such that they can offer financing options for solar power projects. Moreover, India is also
one of the few markets that are moving away from a policy driven to a parity driven scenario.
With increasing costs of conventional power, solar is already viable for certain consumers in
many parts of the country. Hence, with a robust framework of solar policies and an environment
conducive to the development of solar, the Indian solar market provides a huge untapped
potential for solar.
1.1.4. Promotion of renewable energy
1. Foreign Direct Investment (‘FDI’)
The growth of clean energy sector in India is immense. India permits FDI up to 100 per cent in
the sector under the automatic route in Renewable Energy Generation and Distribution projects
subject to the provisions of the Electricity Act, 2003 i.e. no prior approval of regulatory
authorities required.6 There has been Foreign Direct Investment (FDI) inflow to the tune of
6 Source: Website - Overseas Indian Facilitation Centre http://www.oifc.in/Sectors/Infrastructure/Power
Page | 4

Rs.8569 Crores (US$ 1756 million) in the renewable energy sector during the last three years (as
on 31.12.2012)7
2. Feed in tariff
FIT is a preferential tariff set by different SERCs based on the guidelines of CERC in their
respective states for encouraging the developers to participate in developing Renewable based
generation power plants. Under the preferential tariff, the regional or national electric grid
utilities are obliged to buy renewable electricity (electricity generated from renewable sources,
such as solar, wind, biomass, hydropower, etc.), at the price determined by regulators using cost-
plus approach. This approach enables development different RE sources and investors to obtain a
reasonable return on their investments. It typically includes guaranteed grid access and long-term
contract for the electricity produced. The purchase prices are methodologically based on Cost-
plus approach. E.g. Gujarat Electricity Regulatory Commission (GERC) offers levelized tariff of
INR 9.28 / kWh, for megawatt-scale solar PV power projects availing accelerated depreciation,
and INR 10.37 / kWh for similar projects not availing accelerated depreciation.8
3. Tax holiday under the domestic income tax law
Earlier Undertakings engaged in generation or generation and distribution of power have been
offered a 10-year tax holiday for renewable energy plants if it begins to generate power before 31
March 2013, Now by this budget 2013-14 Sunset date for being eligible to claim tax holiday by
power generating, distributing or transmitting companies extended by one more year to 31 March
2014.9 However, they have to pay a minimum alternative tax at the rate of approximately 20
percent, which can be offset in future years.
7 Source:Website-http://panchabuta.com/2013/03/13/renewable-energy-sector-sees-foreign-direct-investment-inflow-of-rs-85-69-billion-over-last-three-years/8 Source: GERC Solar Tariff Order 2012 http://www.gercin.org/renewablepdf/Solar%20Tariff%20Order%201%20of%202012.pdf9 Source: KPMG report on budget 2013-14http://www.kpmg.com/IN/en/services/Tax/.../KPMG-Budget-2013.pdf
Page | 5

4. Renewable Purchase Obligation
The RPOs are imposed on “Obligatory Entities” – distribution licensees, captive consumers and
open-access consumers – to consume certain % of their total energy consumption through
renewable energy sources. They can buy RECs from the market equivalent to the short fall in
their RE purchase.
The legislative support for RPO comes from section 86 (1) (e) of the Electricity Act,-2003 which
says: “to promote co–generation and generation of electricity through renewable sources of
energy by providing suitable measures for connectivity with the grid and sale of electricity to any
persons, and also specify, for purchase of electricity from such sources, a percentage of the total
consumption of electricity in the area of a distribution licensee”
5. Accelerated Depreciation (AD)
AD allows investors, mostly setting up capacity for captive use, to take advantage of up to 80%
of the project cost.
Depreciation is an expense. Expense lowers income, which lower the tax payable.
However, as the same amount of depreciation will be taken on an asset overall, accelerated only
meaning a larger amount is taken quicker...in later years the benefit reverses...that is the amount
of book (or non accelerated depreciation) is higher than the accelerated one, and less tax expense
is received. Hence, the difference is to lower taxable income at first and increase it
later...providing cash (less tax) sooner, and requiring more cash later. So the time value of the
cash savings sooner is the real benefit.
6. Institutional Support
MNRE is trying to open out more channels to broaden the move in reach and help market mode
through other partners. MNRE has set up a Solar Energy Centre near Delhi with the state-of-art
Page | 6

facilities for testing of solar thermal and solar photovoltaic materials, devices and systems. For
market development and financing of renewable energy projects, a separate financing institution
called the Indian Renewable Energy Development Agency (IREDA) has been set up as a public
sector undertaking.
7. CDM Benefits
The Clean Development Mechanism (CDM) is an arrangement under the Kyoto Protocol
allowing industrialized countries with a GHG reduction commitment to invest in projects that
reduce emissions in developing countries as an alternative to more expensive emission
reductions in their own countries. Under the CDM, a developed country can invest in a GHG
mitigation project in a developing country. Developed country would get credit, while
developing country would get capital and clean technology. With 795 registered projects, of the
3,930 projects registered with UNFCCC, India ranks second in the number of certified emission
reduction (CER) credits, after China. 10
8. Tax and Financial Incentive
Tax cost forms a substantial part of the overall EPC Project cost which ranges from 10 percent to
20 percent of the total renewable energy project cost. Considering the special focus on renewable
energy, the Central Government has given various incentives on setting up the renewable energy
power project which includes exemption from customs and excise duties on specific goods
required for setting up the renewable energy projects.
However, these exemptions are subject to fulfillment of prescribed conditions and compliances
to be undertaken by the EPC contractor or IPP. Furthermore, some of the state governments have
provided the incentives in the form of levy of VAT at reduced rate (i.e. 5 percent) whereas the
other states levies VAT @ 12.5 percent.11
10 "Carbon credits likely to fetch INR 4,775 Cr in ’12" THE FINANCIAL EXPRESS (March 28, 2012) http://www.financialexpress.com/news/carbon-credits-likely-to-fetch-r4-775-cr-in-12/929349/
11 Source: “Taxes and Incentives for Renewable Energy” by KPMG International (2012, June)
Page | 7

9. REC Mechanism12
Renewable Energy Certificate (REC) mechanism is a market based instrument to promote
renewable energy and facilitate compliance of renewable purchase obligations (RPO). It is
aimed at addressing the mismatch between availability of RE resources in state and the
requirement of the obligated entities to meet the renewable purchase obligation (RPO). Later
part of report contains detail description of REC mechanism.
10. Other Measures
Apart from the above mentioned all state governments have come up with various policies to
promote generation from RE sources in their respective states. Again, programs like Jawaharlal
Nehru National Solar Mission (JNNSM) and Viability gap funding (VGF) with objectives of
achieving grid parity and meeting village energy requirement are also launched in country.
1.2. Why solar???
A photovoltaic plant is not only an ethical choice to reduce CO2 emissions and to generate green
energy for a better environment and future, but is also a guaranteed investment opportunity with
economic, fiscal and technical advantages.
1.2.1. Economic Advantages
Solar irradiation is a free source guaranteed by its inexhaustibility
Greatly reduce or eliminate expensive electrical bills
Hedge against the volatility of rising utility rates
Solar energy selling at higher tariff through PPA for 25 years, assures interesting profit
and high IRR (Internal Return Rate)12 Source: Renewable energy certificate registry of Indiahttps://www.recregistryindia.nic.in/index.php/general/publics/faqs
Page | 8

Many States support several types of photovoltaic incentive programs (i.e. Feed in Tariff,
Renewable Energy Certificate)
Avoid pollution penalties (Renewable Purchase Obligation RPO)
After the payback time the energy is completely free
1.2.2. Fiscal Advantages
The Solar PV plant cost is eligible for 80% accelerated depreciation advantage in very
first year that leads to Income benefit of 28%.
Solar PV plants are eligible for 30% subsidy under off grid program of
MNRE,Government of India.
To promote solar power various incentive provide by all state government.
Investor can go for REC and CDM benefit.
1.2.3. Technical Advantages
The system reduces dependency on grid power in day time and can provide power in
night time through secondary storage system (battery).
Since the PV plant is a static system, it is a relatively quick and easy to build
Limited failure events and related maintenance costs because is composed by few
mechanic components.
Solar PV systems have a useful life over 25 years
Solar cells make no noise while collecting energy. There are no other renewable energy
sources that are completely silent.
Page | 9

1.3. Power purchase agreement
A power purchase agreement (PPA) is a legal contract between an electricity generator, one
who is looking for sale of electricity generated, and one or more Power purchaser(s). A PPA
plays a critical role for both the generator, in terms of securing a long-term stream of
revenue for the project through the sale of the electricity generated by the project, and the
purchaser, in terms of securing a reliable and firm supply of electricity. It is a key instrument
of project finance.The PPA is often regarded as the central document in financing a
power project because it defines the revenue terms for the project and credit quality.
PPA involves two parties :
i. Seller : Under a PPA, a seller is the owner of the generation unit.
ii. Buyer : Under a PPA, a buyer is generally utility that purchase power to meet
demand of its consumers.
While price terms are often thought of as the most important element of a PPA, typically
PPAs include many vital provisions addressing issues such as the length of the agreement,
the commissioning process, the purchase and sale of energy, metering and accounting, Force
majeure conditions, curtailment agreements, transmission issues, milestones and defaults,
credit, insurance and environmental attributes or credits.
In India, Ministry of Power issues Standard documents which provide the framework for
PPA.
Page | 10

1.4. Financial modeling
Financial modeling is the task of building abstract representation (a model) of real world
financial situation. This is the mathematical model designed to represent portfolio of business
project or any other investment.
It is task of making blueprint of real life phenomenon.
1.4.1. Advantages
It makes financial forecasting automatic and saves the financial manager’s time and efforts
performing a tedious activity.
Financial planning model helps in examining the consequences of alternative financial
strategies.
1.4.2. Applications
It establishes the relationship between financial variables and targets, and facilitates the
financial forecasting and planning process.
The financial model can be improved by including many more financial variables e.g. assets
as current assets and fixed assets, borrowings as long term and short term borrowing
components.
1.5. Need of PPA
It is appropriate where projected revenue of project uncertain and so guarantee as to
quantity purchased and price paid are required to make project viable.
Protection from cheaper or subsidized competition.
Purchaser wishes to secure security of supply and seller wants secure revenue. Hence WIN-
WIN situation.
Page | 11

One of the key benefit is that by clearly defining output of generating asset and credit of its
associated revenue streams, PPA can be used by provider to raise non- recourse financing.
1.6. Need of financial modeling
Financial modeling is building the model of real life situations. it calculate range of project value
indicator in order to allow developer, lenders, investors & relevant govt. bodies to access the
project economics.13
Investor point of view: The investment is said to be reasonable investment if project
internal rate of return is greater than weighted average cost of capital.
.IRR > WACC (Acceptable)
Developer point of view: Developer is keen to know about equity internal rate of return,
because projects are usually financed with equity and debt. Hence developer decision is to
implement project or not depends upon equity internal rate of return.
Govt. point of view: Tariff calculation and to access the project economics, this all come
from precise financial modeling.
Lender point of view: lender will invest in project if they come to know the capability of
the project to cover debt, Hence they are focused on debt service coverage ratio (DSCR).
DSCR = Cash flow available before debt services / debt service requirement
Managerial point of view: Financial modeling is a need of an hour for successful
manager. He has the ability to play with numbers.
It is used for “WHAT IF ANALYSIS”. It is a model top show what will happen if this
parameters going to change in future and how to overcome.
It is used for decision making whether project would be accepted or not.
13 Source :International Finance Corporation ,Member Of World Bank. www1.ifc.org/wps/wcm/connect/.../SOLAR%2BGUIDE%2BBOOK.pdf
Page | 12

It is used for measurement of risk in advance and prepares strategies to prevent risk.
Corporate finance: To assist in deciding the best capital/corporate structure of a
company.
Project financing: if borrowing money, banks will usually wants to see a model, which
shows the borrower will be able to meet the repayments, and stay within the covenants
set by the bank.
1.7. Objective of Report
The objective of this report is to study analysis of opportunity in integrated turnkey solar PV
projects and critically examine the financial viability and bankability of solar power projects on
focus group. Here focus group include three pioneer states in terms of their policies (Andhra
Pradesh, Tamilnadu and Gujarat). In addition, To prepare a 360 degree financial model which
satisfied the need of all (developers, lenders, govt, EPC provider, consumer etc)
LNT as EPC turnkey solution provider, hence the main work is to do SWOT analysis of state
policy of focus group so to motivate the developer to invest in project. To do a SWOT analysis,
it is ought to be understood problems precisely and incisively. An ill-defined problem leads to
ambiguous and ineffective solutions. Thus this study is carried out to
Study of state policies of focus group.
Bankability of project under various states government.
Critically examine the regulations and identify loose-ends in it.
Financial analysis with the help of detailed Financial Modelling.
Motivate Developer to invest in project and help them to sign PPA.
Study effect of change in input parameters (sensitivity analysis) on various financial
indicators and cash flows.
Finally to regulation point of view to study Tariff petition.
Page | 13

1.8. Scope of work
This project involves comprehensive analysis of state policies of focus group. It deals with all the
technical, economic and regulatory issues related to SPP development. The differences in
policies/procedures followed in different states and bankability of solar project under each state
policy. This report covers financial modeling of a solar power project which can be a guideline
for checking financial viability of a SPP. Main focus is to motivate or assist developer to
invest in project after financial analysis and regulatory framework for each state policy.
The financial model is developed to understand the effect of change in input parameters like
CUF, project cost etc. on various financial indicators and cash flows.
Page | 14

1.9. Organization profile review
Figure 2: L&T Organizational Profile Review
1.9.1. Larsen and Toubro:
L&T Construction a subsidiary of the Larsen & Toubro conglomerate also undertakes solar
projects. In April ’12, L&T commissioned India's largest solar photo voltaic-based power plant
(40 MWp) owned by Reliance Power at Jaisalmer, Rajasthan from concept to commissioning in
Page | 15
L&T Solar

129 days. In 2011, L&T entered into a partnership with Sharp for EPC (engineering,
procurement and construction) in megawatt solar project and plan to construct about 100 MW in
the next 12 months in most of the metros. L&T Infra Finance, promoted by the parent L&T
Ltd, is also active in the funding of solar projects in India.
MICROGRID & ROOF TOP SOLAR PHOTOVOLTAIC POWER SYSTEMS
SSize
Type Location Commissioned
17520 kWp
Grid Connected
RooftopIndia’s largest Rooftop Solar PV Project at
Punjab, IndiaUnder
Construction
2 500 kWp Hybrid For Rajasthan Rajya Vidyut Prasaran NigamLimited at Phagi, Rajasthan
UnderConstruction
370 kWp
Grid Connected
Rooftop TC3, L&T Construction HQ CampusUnderconst.
4 100 kWpGrid
Connected Rooftop
TTD, Tirumala Jun 13
5100 kWp Microgrid Honourable CM’s Residence at Patna, Bihar
Apr-13
640 kWp
Grid Connected
Rooftop Admin, L&T KancheepuramApr-13
750 kWp
Grid Connected
Rooftop TLT, L&T KancheepuramApr-13
844 kWp
Grid Connected
Rooftop L&T Special Steel & Heavy Forgings, HaziraOct-12
925 kWp
Grid Connected
Rooftop TC3 SS, L&T Construction HQ CampusApr-12
Page | 16
10 140 kWp
Grid Connected
Rooftop TCTC, L&T Construction HQ CampusFeb-12
11 30 kWp
Grid Connected
Rooftop Railway CDC, L&T KancheepuramDec-11
129 kWp
Grid Connected
Rooftop CRR SS, L&T Construction HQ Campus Aug-11
13 16 kWp
Grid Connected
Rooftop Infotech SS, L&T Construction HQ Campus Aug-11
1495 kWp
Hybrid with Battery Backup
Construction Skills Training Institute, L&T Dadri Sep-10
15156 kWp
Grid Connected
Rooftop EDRC, L&T Construction HQ CampusDec-09
16 91 kWp
Grid Connected
Rooftop Infotech 2, L&T Construction HQ CampusDec-09
17 10 kWp
Grid Connected
Rooftop Infotech 2, L&T Construction HQ CampusDec-09
18116 kWp
Grid Connected
Rooftop Infotech 1, L&T Construction HQ CampusOct-09
1934 kWp
Grid Connected
Rooftop CRR, L&T Construction HQ CampusOct-09
Total 9146 kWp
Table 1: Various projects of L&T
1.9.2. Critical assessment of organization
Strengths
Core Team of expert professionals.
Excellent work Culture
Knowledge management
Intellectual capital
Page | 17

Reporting performance
Technical expertise
Strong and sound top management.
Established brand name, strong customer base and widespread network to boost System
integration business.
Weakness
Relatively new in solar business
‘I’ type of behavior.
Pass the bucket type of behavior in some departments.
L&T is not an aggressive risk taker
Opportunity
Global shift towards Renewable energy
Liberalizing Government perspective towards RE generators
Young and talented workforce of India
More stress on renewable energy
Strong balance sheet and background to capture bigger solar market.
Opportunity to grab the market if it reduced its EPC cost
Threats
Competition from other players
Lack of manufacturing of solar panels, so LNT EPC rate always on top
High degree of openness may lead to information leakage
Loss of efficient employees after completion of deputation tenure or contract of the
employees.
Page | 18

1.9.3. Suggestion and Recommendation to LNT
In order to motivate the employees, the management should look to the monetary as
well as the non-monetary performance based incentives and benefits.
Monetary benefit should be provided to trainees and interns
L&T is known as Turnkey EPC provider, hence to make this point relevant l&T should
start special department to become more independent. Till now many department under
EPC cycle is outsourced by L&T ( like Financial modeling)
Flexible timing on assignment bases should be given more preference.
Lack of online portal specific to solar. Developer face many problems regarding the
same.
Page | 19

CHAPTER 2. : LITERATURE REVIEW, REGULATORY FRAMEWORK & RESEARCH METHODOLOGY
2.1. Literature review
Literature has been prepared by authors all around the world explaining whole procedure wind
power project development or a part of the mighty procedure. The papers/journals reviewed
before preparation of this report, and a brief about them is explained here.
Crow (2001) in his study on PPA stated that PPAs are considered as the most important contract
underlying the construction and operation of a power plant usually drawn at the implementation
phase of IPP projects, as there can be no project if PPA is not reached. It is also an extremely
complex and politically sensitive issue, since it is the PPA which ultimately governs the
price of electricity delivered to end users. The other project agreements including those
covering Engineering,Procurement,Construction, lending, operations and maintenance, can be
negotiated only after the PPA is concluded.
John Besant Jones (2008) in his study of Regulatory Review of Power Purchase Agreement
stated that Power Purchase Agreements are central to the health of power sectors,
particularly in countries that have opted for single-buyer market structure The capital cost of
electricity generating plants often constitutes a large share of the final cost of power
delivered to the consumers. In addition in the case of Thermal generation fueled by import ed oil,
input fuel cost have experienced major escalations because of large increase in world oil prices.
If the the risk allocation and sale price in the PPA are one sided, the bulk supply price of power
that results from the PPA may turn out to be very high and economically unsustainable.
Javadi and Javadinasab (2011) during study of Power Purchasing Agreements in Modern Power
System stated that the PPA is often regarded as the central document in the
development of independent electricity generating assets (power plants), and is a key to
obtaining project financing for the project. Under the PPA model, the PPA provider would
secure funding for the project, maintain and monitor the energy production, and sell the
Page | 20

electricity to the host at a contractual price for the term of the contract. The term of a PPA
generally lasts between 5 and 25 years. In some renewable energy contracts, the host has the
option to purchase the generating equipment from the PPA provider at the end of the term, may
renew the contract with different terms, or can request that the equipment be removed. One of
the key benefits of the PPA is that by clearly defining the output of the generating assets (such as
a solar electric system) and the credit of its associated revenue streams, a PPA can be used by
the PPA provider to raise non-recourse financing from a bank or other financing counterparty.
Rahmat Azmi (2011) stated that Power Purchasing Agreements (PPAs) are the contracts between
Generation Companies (GENCOs) and Independent System Operator. After restructuring
in power system, lack of motivations for Independent Power Producers (IPPs) to
partnership in power generation and long term maintaining energy have affect the long horizon
expansion planning. In this area, long term contracts can help the market entities to hedging
their risks in satisfying the future demands and ensuring the return of their investment
cost. From an IPP point of view, clarifying the rate of return of investment has an important
role in his financial decision making. In competitive power market, each GENCO would offer
in the market and some of them could exercise market power in power market. One of the
proposed ways to controlling the market power is PPA. The PPAs are also guarantied the
renewable resource planning which need high capital investment.
2.2. Policy design and Regulatory framework of RE
2.2.1. Central Government
The Electricity Act, June 200314
Sections 3(1)states that the Central Government shall, from time to time, prepare and
publish the National Electricity Policy and Tariff Policy, in consultation with the state 14 Source: www.powermin.nic.in/acts.../electricity_act2003/preliminary.htm
Page | 21
governments and authority for development of the power system based on optimal
utilization of resources such as coal, natural gas, nuclear substances or material, hydro and
renewable sources of energy.
Section 4states that the Central Government shall, after consultation with the state
governments, prepare and notify a national policy, permitting stand-alone systems
(including those based on renewable sources of energy and other non-conventional sources
of energy) for rural areas.
Section 61(h & i) state that the appropriate commission shall, subject to the provision of
this Act, specify the terms and conditions for the determination of tariff, and in doing so,
shall be guided by the following, namely, the promotion of cogeneration and generation of
electricity from renewable sources of energy; and the National Electricity Policy and Tariff
Policy.
Section 86(1)(e) Section 86(1) and 86(1)(e) state that the state commissions shall discharge
the following functions, namely, promote cogeneration and generation of electricity from
renewable sources of energy by providing, suitable measures for connectivity with the grid
and sale of electricity to any person, and also specify, for purchase of electricity from such
sources, a percentage of the total consumption of electricity in the area of a distribution
license.
National Electricity Policy, Feb 2005 15
The National Electricity Policy 2005 stipulates that progressively the share of electricity
from non-conventional sources would need to be increased; such purchase by distribution
companies shall be through competitive bidding process; considering the fact that it will
take some time before non-conventional technologies compete, in terms of cost, with
conventional sources, the commission may determine an appropriate deferential in prices to
promote these technologies.
15 Source: www.powermin.nic.in/whats_new/national_electricity_policy.htm
Page | 22

National Tariff Policy, Jan 200616
The Tariff Policy announced in January 2006 has the following provisions:
Pursuant to provisions of section 86 (1) (e) of the Act, the Appropriate Commission shall fix
a minimum percentage for purchase of energy from such sources taking into account
availability of such resources in the region and its impact on retail tariffs. Such percentages
for purchase of energy should be made applicable for the tariffs to be determined by the
SERCs latest by April 01, 2006.
It will take some time before non-conventional technologies can compete with conventional
sources in terms of cost of electricity. Therefore, procurement by distribution companies
shall be done at preferential tariffs determined by the Appropriate Commission.
Such procurement by Distribution Licensees for future requirements shall be done, as far as
possible, through competitive bidding process under Section 63 of the Act within suppliers
offering energy from same type of non-conventional sources. In the long-term, these
technologies would need to compete with other sources in terms of full costs.
The Central Commission should lay down guidelines within three months for pricing non-
firm power, especially from non-conventional sources, to be followed in cases where such
procurement is not through competitive bidding.
National Action Plan For Climate change, Jun 2008 17
National Solar Mission: To achieve the target of 20,000 MW by 2022 by 3 phase. This
approach under prevailing conditions is not an easy job, in short the mission needs
supporting policies and incentives to achieve the target. The NAPCC aims to promote the
development and use of solar energy for power generation and other uses with the ultimate
objective of making solar competitive with fossil-based energy options. The plan includes:
16 Source : powermin.nic.in/whats_new/pdf/Tariff_Policy.pdf17 Source : pmindia.gov.in/climate_change_english.pdf
Page | 23

Table 2:Plan For JNNSM
National Rural Electrification Policy, 2006 18
Section 3.1 states “For villages/habitations where grid connectivity would not be feasible or
not cost effective, off-grid solutions based on stand-alone systems may be taken up for
supply of electricity. Where these also are not feasible and if only alternative is to use
isolated lighting technologies like solar photovoltaic, these may be adopted. However, such
remote villages may not be designated as electrified.”
2.2.2. Central regulatory electricity commission (CERC)
Renewable energy certificate mechanism, Jan 2010
“Renewable Energy Certificate is a market based instrument which enables the
obligated entities to meet their Renewable Purchase Obligation (RPO). Pertinently,
the renewable purchase obligation is the obligation mandated by the State Electricity
Regulatory Commission (SERC) under the Electricity Act, to purchase a minimum
level of renewable energy out of the total consumption in the area of a distribution
licensee. The REC mechanism also aims at encouraging competition and eventually
mainstreaming renewable energy sources”.
18 Source : powermin.nic.in/whats_new/pdf/RE%20Policy.pdf
Page | 24
RE generators will have two options – either to sell the renewable energy at preferential
tariff fixed by the concerned Electricity Regulatory Commission or to sell the electricity
component and environmental attributes separately
Figure 3:RE Attributes
RECs can be traded in the Power Exchanges approved by Central Electricity Regulatory
Commission (CERC).
States can now buy RECs to fulfill their RPO nationally from any RE generator in the
country.
The Central Agency (the National Load Dispatch Centre has been designated as Central
Agency) will issue the REC to RE generators
One REC will be equivalent to 1 MWh of electricity injected into the grid.
The REC will be exchanged only in the Power Exchanges approved by CERC within the
band of a minimum and a maximum price to be determined by CERC. CERC has already
notified the price band (provided in the table below).
The distribution companies, Open Access consumer, Captive Power Plants (CPPs) will
have the option of purchasing the REC to meet their Renewable Purchase Obligations
(RPO).
Page | 25

There will also be compliance auditors to ensure compliance of the requirements of REC
by the participants of the scheme.
Voluntary Purchasers like NGOs, the Corporate Sector, and Individual Purchasers etc.
may also purchase REC in order to meet their Corporate Social Responsibility or to
support the environment.
2.2.3. State regulatory electricity commission (SERC)
Mandatory RPO by states 2004-10
Renewable Purchase Obligation refers to the obligation imposed by law on some entities
to either buy electricity generated by specified ‘green’ sources, or buy, in lieu of that,
‘renewable energy certificates (RECs)’ from the market. The ‘obligated entities’ are mostly
electricity distribution companies and large consumers of power. RECs are issued to
companies that produce green power, who opt not to sell it at a preferable tariff to
distribution companies. Under this policy the state discoms obligated to pay some percentage of
their consumption from renewable sources.
2.3. Research methodology
Research process
First step is to analysis of state policies (Andhra, Tamilnadu, and Gujarat) to check
out which state policy is best for solar PPA. Check whether it is bankable to sign PPA.
Page | 26

Figure 4:Research Methodology
Second step is to sum out key point of policies and with the help of financial
modeling check financial viability of project via sensitivity analysis.
Third is to insist or motivate investor to do project in that location by signing power
purchase agreement ( main focus from L&T point of view)
CHAPTER 3. : ANALYSIS OF PPA
3.1. Solar PPA market models:
Page | 27
Viability Gap
Funding

Figure 5: Conical diagram of solar PPA's
3.1.1. PPA with Preferential Tariff
PPA with a DISCOM is a very basic option which can assure guaranteed ROI over a longer
duration. This can be a benchmark to evaluate other options against.
Page | 28

A feed-in tariff (FiT) or preferential tariff is a policy mechanism designed to encourage the
development of renewable energy (RE) sources and help them move toward grid parity. It
typically includes three key provisions
Guaranteed grid access
Long-term contract for the electricity produced
Purchase prices that are methodologically based on the actual cost of renewable energy
generation and tend towards grid parity. This is also known as Cost-plus approach.
Under the preferential tariff, the regional or national electric grid utilities are obliged
to buy renewable electricity (electricity generated from renewable sources, such as
solar, wind, biomass, hydropower, etc), at the price determined by regulators using c
ost-plus approach. This approach enables development different RE sources and
investors to obtain a reasonable return on their investments.
3.1.2. PPA with APPC + REC
Sale to DISCOM at Average Power Purchase Cost can assure a guaranteed return with an
additional income from GBI(as per state policies), but the tariff is low when compared to the
preferential tariff. This drop in tariff can be compensated by additional revenue from RECs.
Eligibility of REC benefit:
It has got accreditation from State Nodal Agency
It does not have any PPA for the capacity related to such generation with distribution
licensee at preferential tariff (state regulated tariff),
Page | 29

It sells electricity generated either to the distribution licensee at price not exceeding
average pooled cost of power purchase (APCPP) of the distribution licensee for last year,
or
To any other licensee or to an open access consumer at mutually agreed price, or through
Power Exchange.
Captive RE Generators are also eligible for REC if they are not availing promotional
Wheeling or promotional banking and not getting any electricity tax/duty exemption
from the state.
3.1.3. PPA with open access
Third Party Sale or Open Access involves higher risk and other applicable charges as well. The
charges may include Transmission Loss, Transmission Charges, and wheeling Charges.
Cross Subsidy charges may also be eligible and will have a considerable effect on the price if
implemented. The advantage with Third party Sale/ Open access is that the tariff may be
comparatively higher and the generator is allowed to avail RECs as well. Electricity can be sale
to obligated entity (grey electricity + green electricity).This is the best way by developer
generate more return as per present market scenario.
Page | 30

Figure 6:Power Purchase Mechanism
3.1.4. PPA financing model:
A solar PPA is a financing arrangement that allows businesses or government agencies to
purchase solar electricity with no upfront capital cost. To achieve this, a “host” organization
provides unused rooftop, land, or parking lot space as the location for a solar installation. A
third party PPA provider pays for the cost of the solar installation and assumes all responsibility
for the ownership, operation, and maintenance after the solar project is complete. As the host
organization, you enter into an agreement to purchase the solar electricity produced by the
system owned by the PPA provider at a predetermined rate per kilowatt-hour, the same unit of
measurement on your standard utility bill. A well-structured PPA allows corresponding reduce
Page | 31

in electricity costs immediately and realize increased savings over time as grid electricity prices
rise. Once the PPA contract period expires (typically after 15 - 20 years), we can purchase the
system at a reduced price, initiate another PPA, or have the solar installation removed.
3.1.5. Viability gap funding 19
It is a Backward looking process.
Ministry of New and Renewable Energy has proposed to fund solar energy projects under phase-
II of the Jawaharlal Nehru National Solar Mission (JNNSM) through viability gap funding
(VGF). So far, the government has been supporting the solar power projects through Generation
Based Incentives (GBI) and bundling scheme wherein solar energy was bundled with
conventional energy.
The proposal for Viability Gap Funding (VGF) Scheme for large size solar power projects under
Batch-1 of Phase-II of Jawaharlal Nehru National Solar Mission (JNNSM) envisages the
following main provisions:
Coverage: Solar PV projects of total 750 MW capacity to be set up on Build-Own-Operate
basis, with minimum project capacity of 10 MW.
Tariff for power purchase: @ Rs.5.45/ unit fixed for 25 years, (With AD @Rs4.95/unit).
VGF support: Up to 30% of project cost or Rs.2.5 crore/ MW whichever is less, based on bids.
Developers’ equity contribution: At least Rs.1.5 Crore/MW. The balance amount can be raised
as loan from any source.
19Source : Press Information Bureau, Govt. of Indiahttp://pib.nic.in/newsite/PrintRelease.aspx?relid=94876
Page | 32

This scheme is, however, still under finalization
VGF in solar sector brings its own set of advantages and disadvantages. With upfront availability
of part of capital, cost of project financing would be lower. Further, it allows a project
developer to sell electricity to any off the obligated entities. Other than the discoms,
a developer can sell its electricity to open access and captive consumers including the
commercial and industrial consumers who are willing to pay much higher tariffs in different
parts of the country.
As per disadvantage it has been observed that, VGF does not incentivise project developers to
build and operate most efficient power plants. Under VGF mechanism, a large part of the
funding is done upfront at the beginning of the project. In addition, Accelerated depreciation
(AD) can also be availed. Under the mechanism a developer may bid aggressively to win
the projects and after availing the incentives, may try and sell the project to another investor.
Though to tackle this problem, MNRE has proposed a phased disbursal of subsidy over a period
of a year. But for plants with operational life of about 25 years, this would do little to maximise
the operational efficiency throughout the life span of projects. Developers would
be happily deploying the sub-standard equipments resulting in reduced plant life.
Payment security had been considered the differentiating factor for JNNSM in comparison to the
other RE policies. JNNSM would buy the electricity generated at a pre-determined tariff over 25
years, thus instilling a level of confidence in the financing community to fund these projects.
However, under the VGF mechanism, NVVN will no longer be the off-taker of power. To bid
for the projects, a developer will first have to identify the buyers of their generated electricity.
The banks in India will have to do their due-diligence on each kind of buyers. The financial
condition of the electricity discoms is well known and bankability of PPA with private
parties is also an issue.
Page | 33

CHAPTER 4. ANALYSIS OF DIFFERENT STATE SOLAR POLICY20
Table 3: Grid data across states, source CERC tariff order, CEA report
20 Source: SERC Tariff order, CEA reports
Page | 34

4.1. Basic models of state policies:
Page | 35

4.1.1. Gujarat solar policy21
A state specific policy dedicated to solar was first envisioned by Gujarat in 2009. The outlines
were given under the policy titled “Solar Power Policy -2009”. The policy was the first solar
specific policy introduced in the country predating the National Solar Mission.
The Gujarat Solar Policy is operative till 31st March 2014.Any Solar Power Generator (SPG)
commissioned during the operative period shall become eligible for incentives declared under
this policy for a period of 25 years.
The current policy is in operation till 2014 and had an initial target of 500 MW. But ultimately,
958.5 MW22 of solar power projects were allocated in the state. Only 14% of the allocated
capacity was commissioned by the completion deadline of December 31st 2011. However, as of
May 2013, a capacity of 824.09 MW has been commissioned under the Gujarat policy. This has
largely been possible due to the workable tariffs and government support for financial closures of
projects.
Gujarat is the only policy in the country which has a fixed tariff, and does not follow the
reverse bidding mechanism. In its tariff order released in January 2012 it fixed different tariffs
for the next three years. The tariffs decrease every year as compared to the previous year. The
state is already fulfilling its RPO and is currently a power surplus state. Thus, the state has no
immediate plans to announce new allocations. Any new projects under a new policy would be
led by the REC mechanism. But the REC mechanism as it currently stands with its short term
price visibility might not be the most viable option for the state which is only looking at solar
from a long term perspective
21 Source Gujrat Solar policymnre.gov.in/.../Gujarat%20Solar%20Power%20Policy%202009.pdf22 Source Bridge to India, june 2013
Page | 36

SOLAR PROJECT FEASIBILITY STUDY GUJRAT
Figure 7: Seesaw analysis of Gujarat
Page | 37
Losses
beard by
developer

4.1.2. Andhra Pradesh solar policy23
The Andhra Pradesh state solar policy was released on September 26 th 2012. The operating period
of the policy extends to 2017 and applies to all grid connected solar projects that sell directly to a
third party or through the REC mechanism. In order to incentivize projects, the state has removed
all wheeling and transmission charges and allowed banking within the time frame of a year
(except between February and June or within a single day). The policy also includes exemption
from Cross Subsidy Surcharges and Electricity Duty, and a refund on Value Added Taxes (VAT)
on all components of the plant and on stamp duty and registration charges on the purchase of
land. RECs can be availed under the policy over and above the other incentives. Andhra Pradesh
invited bids for 1,000 MW projects shortly after releasing its solar power policy. The time
durations for financial closure were increased to 210 days from 60 days and the plant commission
deadline was extended to 12 months from signing the PPA instead of the original six months..
The projects were to be allocated based on lowest bids at each interconnection location.
23 Source: Andhra solar policymnre.gov.in/.../Andhra%20Pradesh%20Solar%20Policy%202012.pd
Page | 38

SOLAR PROJECT FEASIBILITY STUDY ANDHRA PRADESH
Figure 8: Seesaw diagram of analysis of AP
Page | 39
4.1.3. Tamilnadu solar policy24
The Tamil Nadu Solar Policy 2012 was announced in October 2012. The policy aims to achieve
an ambitious installation target of 3 GW by 2015. The policy aims to achieve this capacity
addition from: 350 MW of rooftop installations, 1,500 MW of utility-scale projects and 1,150 MW
of projects under the REC mechanism.
In a first-of-its-kind state policy, Tamil Nadu will provide a Generation Based Incentive (GBI) for
rooftop solar power through net-metering in which power producers will have to install a separate
meter to measure power generation. A capacity of 50 MW is proposed to be added through this
process. The remaining 300 MW under the rooftop installations is expected to come from
government buildings and other government schemes for rural and urban lighting.
For a target of 1,500 MW of utility scale projects till 2015, the policy targets an installation of
1,000 MW from the fulfillment of SPO. These obligations have been mandated at 3% till
December 2013 and 6% from 2014 onwards on various power consumers such as Special
Economic Zones (SEZs), IT parks, industrial consumers guaranteed with 24/7 power supply,
colleges, telecom towers, residential schools and all buildings with a built up area of more than
20,000 square meters. Obligated entities can fulfill their SPOs by doing one of the following:
generate own solar power, buy solar power from a third party within Tamil Nadu, buy RECs or
buy solar power from the state distribution companies at the solar tariff. The realization of this
target is dependent on the enforcement of these SPOs by the local authorities. Any provision of
penalty for not meeting such obligations is not highlighted in the policy document. The remaining
500 MW of utility scale projects is expected to come up using a GBI based on a reverse bidding
process. The guidelines for the process are expected to be released separately. There is also a
provision for solar parks to come up in 24 districts of the state in a phased manner to
accommodate these utility scale projects. The Tamil Nadu government has estimated that through
the implementation of the SPO mechanism 500 MW of solar power will be installed for direct use
24 Source : TANGEDOwww.tangedco.gov.in/solarnews.php
Page | 40

of or third party sale to SPO obligated entities. This provides an opportunity for project developers
to enter into private PPAs for the sale of solar power to those obligated entities that do not regard
solar power as part of their core business or that do not have the financial liquidity to set up a solar
power plant to fulfill their SPO. For example, many commercial consumers will not be equipped
with the infrastructure, space or technical knowledge to set up large solar power plants themselves
and on site. Therefore, they will often choose to buy power from private power producers by
signing a PPA with them.
The remaining 1,15 MW of the policy target is expected to come up using the existing REC
mechanism. Unlike the recently announced Andhra Pradesh solar policy, the Tamil Nadu solar
policy does not provide any significant incentive for REC projects to come up in the state. These
installations are expected to be driven in sync with the national REC.
Tamil Nadu issued an expression of interest for 1,000 MW on January 4 th 2013 and received 92
applications for 104 projects, totaling a capacity of only 499 MW. This was the first time a public
tender for FiT based allocation The lowest bid was Rs. 5.97(€ 0.09/$ 0.12)/kWh (at an annual
escalation of 5% for the first 10 years of the 20 year PPA). As this was deemed unworkable by
many project developers the state decided to provide a ‘workable tariff’ of Rs. 6.48 (€ 0.10/$
0.13)/kWh (at an annual escalation of 5% for the first 10 years of the 20 year PPA) at which
developers would be comfortable singing a PPA.
At this tariff, a capacity of 690 MW has been tied up for. New interests that have come in after the
bidding process have helped take the capacity up to this level. The key reason for the unexpected
increase in capacity is the new interest for two projects of 100 MW each.
SOLAR PROJECT FEASIBILITY STUDY TAMILNADU
Page | 41

Figure 9: Seesaw diagram of analysis of Tamilnadu
Page | 42

4.2. Overview of solar policies
Table 4: Solar policies, Source Bridge to India
Page | 43

CHAPTER 5. FINANCIAL ANALYSIS OF PROJECT25
5.1. Financial modeling
Figure 10 : Flow diagram PPA process
5.2. Cost estimates
Detailed cost estimates are needed for determining the economic merit of a project, appraising its
financial implications and arranging finance for it. The estimates are made to a reasonable
approximation in the pre-feasibility phase and they are then refined, on the basis of more extensive
investigations, in the feasibility phase. Various costs are explained here.
25 source: International Finance corporationwww1.ifc.org/wps/wcm/connect/.../SOLAR%2BGUIDE%2BBOOK.pdf
Page | 44

a. Initial costs
i. Feasibility study
ii. Development
b. Construction costs
i. Engineering cost
ii. Equipment cost
iii. Balance of plant system cost
iv. Grid connectivity cost
v. Owner’s
vi. Contingency costs
c. Annual costs
i. Loan cost – (interest and principal repayment)
ii. O&M cost
iii. Land lease & resource rental (if applicable)
iv. Property taxes
v. Insurance premium
vi. General & administrative costs
Contingencies- A contingency allowance should be included to account for unforeseen
annual expenses. Generally, the contingency allowance is calculated based on an
estimate percentage of all other annual costs.
Page | 45

Figure 11 :Cost estimate per project phase
5.3. Development of project model
A financial model is the most critical element of the financial assessment process. Most financial
models are structured in a similar way and have the following features (whether created as a
project specific spread-sheet model or using an off-the-shelf project finance package):
I. Assumptions – All of the input variables to the model are usually kept together in one
worksheet. Assumptions may be based on expert knowledge, forecasts, technical
performance specifications, contract prices or other sources. The source of each assumption
needs to be clearly identified so that investors can assess whether the assumption is
reasonable.
II. Calculations – The input variables are combined in a number of calculations, including tax,
depreciation/amortisation, loan balance and interest payments, and revenue and operating
costs.
III. Outputs – In general, the outputs of a financial model will include:
Cash flow statement
Page | 46

Profit and loss
Balance sheet; and
Key financial indicators such as debt and interest ratios, debt service coverage ratio,
NPV and IRR
5.4. Analysis of financial indicators
Financial indicators are the mathematical tools which help the finance manager to take a decision
about whether to accept the project or reject the project. One or more of the following financial
indicators are used to check the viability of the project.
Cash flow – To determine if the project is economically viable a cash-flow evaluation of the
project should be done. The cash-flow analysis looks at overall project revenues and expenses
on a year by year basis over the life of the project.
Benefit-cost ratio (BCR) - It is the ratio between discounted total benefits and costs.
Net present value (NPV) - The NPV of an investment proposal may be defined as the sum of
the present values of all the cash inflows less the sum of present values of all the cash
outflows associated with a proposal.
Net present value (NPV) is a standard method for the financial appraisal of long-term
projects. Used for capital budgeting, and widely throughout economics, it measures the
excess or shortfall of cash flows, in present value (PV) terms, once financing charges are met.
By definition, NPV = Present value of net cash flows.
Each cash inflow/outflow is discounted back to its PV. Then they are summed. Therefore
Page | 47
Where
t - The time of the cash flow
n - The total time of the project
r - The discount rate
Ct - the net cash flow (the amount of cash) at time t.
C0 - the capital outlay at the beginning of the investment time (t = 0)
The discount rate
Choosing an appropriate discount rate is crucial to the NPV calculation. A good practice of
choosing the discount rate is to decide the rate which the capital needed for the project could
return if invested in an alternative Venture.
Relationship between the NPV and the discount rate
For some professional investors, their investment funds are committed to target a specified
rate of return. In such cases, that rate of return should be selected as the discount rate for the
NPV calculation. In this way, a direct comparison can be made between the profitability of
the project and the desired rate of return.
NPV > 0 the investment would add value to the firm the project should be accepted
NPV < 0 the investment would subtract value from the firm the project should be rejected
NPV = 0 the investment would neither gain nor lose value for the firm we should be
indifferent in the decision whether to accept or reject the project. This project adds no
monetary value. Decision should be based on other criteria, e.g. strategic positioning or other
factors not explicitly included in the calculation.
Page | 48

Internal rate of return (IRR) – It is also called hidden rate of return.the IRR of a proposal is
defined as the discount rate which produces a zero NPV i.e., the IRR is the discount rate
which will equate the present value of cash inflows with the present value of cash outflows.
The IRR is also known as Marginal Rate of Return or Time Adjusted Rate of Return. Like the
NPV, the IRR is also based on the discounting techniques.
Payback period- The payback period is defined as the number of years required for the
proposals cumulating cash inflows to be equal to its cash outflows.
Debt service coverage ratio (DSCR) - The DSCR is the total net operating income divided
by the debt service. The higher this ratio is, the easier it is to borrow money for the property.
The phrase is also used in corporate finance and may be expressed as a minimum ratio that is
acceptable to a lender; it may be a loan condition, a loan covenant, or a condition of default.
In corporate finance, it is the amount of cash flow available to meet annual interest and
principal payments on debt, including sinking fund payments.
In commercial real estate finance, this is the main measure to determine if a property will be
able to sustain its debt based on cash flow. Most banks will lend to a 1.2 DSCR, but at times
with more aggressive practices you begin to see this number decreasing. A DSCR below 1.0
on a property indicates that there is not enough cash flow to even cover the loan.
In general, it is calculated by:
DSCR = Net Operating Income / Total Debt service
PAT+DEPRICIATION+INTEREST ON LOAN+LEASE RENTALS
DSCR = --------------------------------------------------------------------------------
INTEREST ON LOAN + REPAYMENT OF LOAN
Page | 49

Typically, most commercial banks require the ratio of 1.15 - 1.35 times (net operating
income or NOI / loan amount) to ensure cash flow sufficient to cover loan payments is
available on an ongoing basis.
Weighted Average Cost of Capital (WACC)
The weighted average cost of capital (WACC) is used in finance to measure a firm's cost
of capital. This has been used by many firms in the past as a discount rate for financed
projects, as the cost of financing (capital) is regarded by some as a logical discount rate
(required rate of return) to use. Weighted Average Cost of Capital is the return a firm must
earn on existing assets to keep its stock price constant and satisfy its creditors and owners.
Corporations raise money from two main sources: equity and debt. Thus the capital
structure of a firm comprises three main components: preferred equity, common equity and
debt (typically bonds and notes). The WACC takes into account the relative weights of
each component of the capital structure and presents the expected cost of new capital for a
firm.
The weighted average cost of capital is defined by:
Where
c = weighted average cost of capital %
y = required or expected rate of return on equity, or cost of equity %
b = required or expected rate of return on borrowings, or cost of debt %
Page | 50

tc = corporate tax rate %
D = total debt and leases currency
E = total equity and equity equivalents currency
K = total capital invested in the going concern currency
Or in other words:
WACC = (weight of preferred equity × cost of preferred equity) + (Weight of common
equity× cost of common equity) + (Weight of debt × cost of debt × (1 − tax rate))
Page | 51

Figure 12 : Standard project finance model
Page | 52

5.5. Sensitivity analysis
If a project appears to be financially viable, based on analysis of the relevant financial indicators
using conservative or at least central case assumptions, then a more detailed sensitivity analysis
will be undertaken. The objective of the sensitivity analysis is to establish which of the input
assumptions to the financial model has the greatest impact on the financial outcome. It is
important to understand both which variable can have the greatest impact, and which is most
likely to have the greatest impact, either singly or in combination with other variables. The
sensitivity analysis is related to the next stage, risk assessment and management, since many of
the key sensitivities can be contractually hedged to reduce the risk to the lender. For example, key
supply and purchase contracts may be fixed by volume and price.
5.6. Risk analysis
It is a technique to identify and assess factors that may jeopardize the success of a project or
achieving business goal. This technique also helps to define preventive measures to reduce the
probability of these factors from occurring and identify counter measures to successfully deal with
these constraints when they develop to avert possible negative effects on the viability of the
project.
Page | 53

CHAPTER 6. SUMMARY
6.1. Finding and Conclusion
TAMILNADU: Preferential Tariff INR 6.48/unit with 5% escalation for ten years26.
CASE 1: IF CUF =19%
EPC COST L&T INR LAKH/MW
PROJECT IRR%
EQUITY IRR%
DSCR LEVELISED COST OF TARIFF (INR/KWH)
650 10 14 0.90 8.46700 9 12 0.85 8.96750 8 11 0.80 9.46
Table 5: EPC VS Project IRR, Equity IRR, DSCR in Tamilnadu CUF 19%
CASE 2: IF CUF=20%
EPC COST L&TINR LAKH/MW
PROJECT IRR%
EQUITY IRR%
DSCR LEVELISED COST OF TARIFF (INR/KWH)
650 10 16 0.95 8.05700 10 14 0.89 8.52750 9 12 0.84 9.00
Table 6: EPC VS Project IRR, Equity IRR, DSCR in Tamilnadu CUF 20%
CASE3: IF CUF= 21%
EPC COST L&TINR LAKH/MW
PROJECT IRR%
EQUITY IRR%
DSCR LEVELISED COST OF TARIFF (INR/KWH)
650 11 17 1 7.67700 10 15 0.94 8.12750 10 14 0.89 8.58
Table 7: EPC VS Project IRR, Equity IRR, DSCR in Tamilnadu CUF 21%
26 Source : www.eai.in/club/users/aathmika/blogs/1145
Page | 54

ANDHRA PRADESH: Preferential Tariff INR 6.49/unit without escalation27
CASE 1: IF CUF =19%
EPC COST L&T INR LAKH/MW
PROJECT IRR%
EQUITY IRR%
DSCR LEVELISED COST OF TARIFF (INR/KWH)
650 5 7 0.78 8.42700 4 5 0.73 8.92750 4 4 0.69 9.42
Table 8: EPC VS Project IRR, Equity IRR, DSCR in AP CUF19%
CASE 2: IF CUF=20%
EPC COST L&TINR LAKH/MW
PROJECT IRR%
EQUITY IRR%
DSCR LEVELISED COST OF TARIFF (INR/KWH)
650 6 8 0.82 8.00700 5 7 0.78 8.48750 5 5 0.73 8.95
Table 9 : EPC VS Project IRR, Equity IRR, DSCR in AP CUF 20%
CASE3: IF CUF= 21%
EPC COST L&TINR LAKH/MW
PROJECT IRR%
EQUITY IRR%
DSCR LEVELISED COST OF TARIFF (INR/KWH)
650 7 10 0.86 7.63700 6 8 0.82 8.08750 5 7 0.77 8.53
Table 10: EPC VS Project IRR, Equity IRR,DSCR in AP CUF 21%
GUJARAT: let us assume Preferential Tariff INR 6.89/unit with 5% escalation 28
27 Source : http://articles.economictimes.indiatimes.com/2013/apr/0128 Source : ASSSUMED TARIFF*
Page | 55

CASE 1: IF CUF =19%
EPC COST L&T INR LAKH/MW
PROJECT IRR%
EQUITY IRR%
DSCR LEVELISED COST OF TARIFF (INR/KWH)
650 11 16 0.96 8.47700 10 14 0.90 8.97750 9 13 0.85 9.47
Table 11: EPC VS Project IRR, Equity IRR, DSCR in GUJARAT CUF 19%
CASE 2: IF CUF=20%
EPC COST L&TINR LAKH/MW
PROJECT IRR%
EQUITY IRR%
DSCR LEVELISED COST OF TARIFF (INR/KWH)
650 11 17 1.01 8.06700 11 16 0.95 8.53750 10 14 0.90 9.01
Table 12 : EPC VS Project IRR, Equity IRR, DSCR in GUJARAT CUF 20%
CASE3: IF CUF= 21%
EPC COST L&TINR LAKH/MW
PROJECT IRR%
EQUITY IRR%
DSCR LEVELISED COST OF TARIFF (INR/KWH)
650 12 19 1.05 7.68700 11 17 1 8.14750 11 15 0.95 8.59
Table 13: EPC VS Project IRR, Equity IRR,DSCR in GUJARAT CUF21%
NOTE: All above calculation done by taking reference of financial modeling
Conclusion 1:
Page | 56

As per the table 6 to table 14 shown above it is conclude that Project IRR, Equity IRR, DSCR is
very much dependent upon two main input that is capacity utilization factor and EPC cost as per
L&T,
In Tamilnadu there is best option to have PPA as per developer point of view because of power
deficit state,infact TANGEDO offer very good preferential tariff INR 6.48Rs/KWh with 5%
escalation for first 10 years,hense after 10 year it is seen from financial modeling that preferential
tariff became nearly INR 10/KWh.but there is problem related to TANGEDO due to junk crediti
rating.but as per finding I adviced to developer to invest in.(because TANGEDO already prepared
an Escrow account INR 1500crore as security).Infact there is great opportunity for private
developer to invest in the state and sell electricity to obligated entity who are unable to build there
own plant.This is the best way that developer enjoy the speial feature SPO imposed by Tamlnadu
Govt.
In Andhra Pradesh there is best option to go through REC mechanisum or Third party/Open
accesss sale because of incentives (No CSS,No Wheeling Charges,No Transmission
charges,Banking facility,VAT excemption,NO ED and many more I have alraedy discussed in my
report ) given by AP Govt.
In Gujarat,if there is any announcement of policy addition in future then this is the best option to
agreement with gujrat discom due to credit worthiness of discom and good preferential tariff
provided to developer till in Gujrat Solar history .I assumed as Preferential tariff INR 6.8/KWh
with escalation 5% up to 10 years.Project giving very good rate of return.
Let us have conclude by taking risk analysis of target group
Page | 57

TILL NO POLICY ON ADDITION OF NEW CAPACITYRISKYTANGEDO NOT BANKABLE
PPA WITH APDISCOM LESS PREFEREBLE
Figure 13: Risk scenario & Conclusion
Page | 58
GUJARATTAMILNADU

Conclusion 2: Electricity sell to APPC is less preferable because the REC mechanism comes with
the risk of uncertainty of REC pricing. While there is a fixed REC floor price of RS 9,300 (€143)
per REC (equivalent to 1MWh), there is some uncertainty on the pricing post 2017.So it is very
riskier for developers to invest in project because of REC benefits. With REC floor price INR
9300(2012-17) and APPC price INR 3.17 with escalation of 5% up to 10 years the IRR comes to
be only 2%29.DSCR is even less than 0.5.
Assumptions: Project cost = 800 lakh/MW;
APPC price INR 3.09/unit with 5% escalation up to 10 years;
REC price cap =INR 9300/MWh (2013-17), INR 4650/MWh (2017-22),after that zero
Preferential Tariff = INR 6.38/unit with 5% escalation up to 10 years.
Figure 14: Scenario analysis 1 MW Solar PV(IRR , DSCR calculation REC route and Preferential or Open access )
Equity IRR (%) Project IRR(%) DSCR0
2
4
6
8
10
12
14
16
4
2
0.49
14
10
0.9
With APPC + REC RouteWith Prefrential Tariff
29 Source : Financial Modeling Sheet
Page | 59

6.2. Recommendation:
From the detailed study of the project it can be understood that there is too much diversity in
various states with regard to Preferential feed in tariff, incentives provided, charges for open
access, APPC (escalation or without escalation),source assessment etc. Hence, the planning and
feasibility study becomes cumbersome for the developer and EPC players. For example, financial
feasibly has to be conducted using different FiTs for different states. Because of completely
different procedures/policies for different states, it is quite difficult for developer to understand all
possible scenarios. Even more complex problem related with REC price band episode.
In order to make project viable and increase the confidence of investor, The Govt. should increase
the time frame of REC price band.
A Vintage Based Multiplier Mechanism is recommended. In this mechanism the solar REC
projects commissioned in the period 2012-2017 will be issued a multiplicative factor. This factor
would be equal to the fall in CAPEX from 2012 to 2017. This factor would be used to issue
additional RECs. Assuming that the capital cost falls by 50% in 2017, every REC issued in 2012
would be worth two RECs in 2017.
I will recommend from analysis that present scenario of REC route is riskier option till regulatory
will not give any regulations to Strengthen REC framework or the long term REC price band as
already done by UK .
Page | 60

6.3. Bibliography
Reports and Publications
1. Reports by “BRIDGE TO INDIA”
2. “Guide to ELECTRICITY LAWS in India” by Raj Singh Niranjan.
3. “Taxes and incentives for renewable energy” published in June 2012 by KPMG
International.
4. “UTILITY SCALE SOLAR POWER PLANTS – A Solar guide to Developers and Investors”
published in Feb 2012 by IFC (World Bank Group)
5. Financial Management by I.M. Pandey
Websites1. Ministry Of Power
http://powermin.nic.in/2. Ministry of New and Renewable Energy
http://www.mnre.gov.in/3. Central Electricity Regulatory Commission
http://www.cercind.gov.in/4. Central Electricity Authority
http://www.cea.nic.in/5. Renewable Energy Certificate Registry of India
https://www.recregistryindia.in/6. Power System Operation Corporation India Ltd.
http://www.nldc.in/7. Indian Renewable Agency Development Agency
http://www.ireda.gov.in/8. NTPC Vidyut Vyapar Nigam Ltd.
http://nvvn.co.in/9. Press Information Bureauhttp://pib.nic.in/newsite/mainpage.aspx
Page | 61

CHAPTER 7. : CURRENT SOLAR NEWS
Solar Tariff Cut Will Curb Investment, Warns SBI
(Tuesday, July 30, 2013 Gujarat )
Backtracking on contracts is damaging for a new industry set to gain investor confidence.
India-Nigeria Join Hands For A Solar Power Project
(Tuesday, July 23, 2013 )
Initially a Project Monitoring Unit (PMU) will be set up by the Indian government which will look
at the potential segments of work flow.
Punjab CM Requests PM To Restore Subsidy On Solar Pumps
(Wednesday, July 17, 2013 )
With the subsidy being reduced to 30 per cent of the installation cost, farmers found it harder to
balance the requirement.
MNRE Will Not Accept Applications For Channel Partners
(Tuesday, July 16, 2013 )
Channel partner for the Decentralized –Off grid solar programme.The existing partners will be
eligible for renewal.
Gujarat Seeks Tariff Cuts In Solar PV Plants
(Tuesday, July 16, 2013 )
Modi Government is seeking for ways to back out from the high tariffs that it had contracted to
nearly 1,000 MW solar plants.
100 MW Solar PV Project By Reliance Gets Carbon Credits
(Wednesday, July 10, 2013 )
With the present registered capacity, Reliance is now the world’s largest capacity with more than
12,000 MW under its belt.
Page | 62

Gujarat To Lower PV Power Tariffs
(Monday, July 08, 2013 )
The state government is citing excess of profits for the power plant manufacturers. A petition for
the same was submitted by the Gujarat Urja Vikas Nigam Limited which is a state run agency and
the bulk of the power consumer.
India Set To Impose Anti-Dumping Duties On Solar Cell Exporters
(Thursday, July 04, 2013)
The justification pleaded by the domestic firms has sufficient prima facie and the evidence point
out the necessity to launch an anti-dumping investigation.
AP Gets Bid For 418 MW Solar Projects
(Wednesday, July 03, 2013 )
The managing director and chairman of AP Transco, Hiralal Samaria said that it is important to
expedite the process of solar panel installation in order to bridge the gap between demand and
supply and meet the requirement of customers. Purchase Price was INR 6.49Rs/KWh.
Bihar Proposes For 100 MW Solar Power Plants
(Saturday, June 29, 2013 )
To apply for the project, a developer should post a fee of Rs 2 lakh or $3,300 apart from the bid
processing fees and further a deposit of Rs 20 lakhs for every MW they bid on.
Solar Credits Drop To Floor Price In India
(Thursday, June 27, 2013 )
Clean energy was sold at Rs 9.300 ($154 approx)
Page | 63

CHAPTER 8. : APPENDIX & FINANCIAL SHEET30
The Financial Sheet is based upon data inputs provided by L&T
Single axis Tracker. Make: Indian, proven. L&T has signed MOU of 10 MWp
True PLF over DC capacity = 21.24 %
1st year generation = 1.861 mil units per MWp; Losses considered: 0%
Degradation = Standard, as received from module manufacturers
Land required per MWp = 5.5 acres
Total all-inclusive Operational expenses for base year = 1.11% of ‘Total Project Cost
excluding IDC’
Operational Expenses considered for 20 years, @ 5% p.a. escalation
Inverter replacement cost for 10MWp = Rs 1.03 Cr after 14 yrs
Construction period = 6 months
Project Cost = LSTK EPC + Land + development + Evacuation Infrastructure
Project Cost = INR 8.72 Cr per MWp
11.50 % interest on rupee term, for 70% debt. Zero exim loan
Repayment: 12 yrs of structured payments;
For IRR
PPA duration = 20 yrs
Tariff: Year 1 - Rs 6.48 per unit; 5 % escalation for first 10 yrs; then flat till year 20
30 Source : https://mail.google.com/mail/u/0/?shva=1#inbox/1403419d15454c6c
Page | 64

USER INPUT VALUE UNIT press '0' for preferential tariff (0 /1)below ASSUMPTION AND INPUTSLIFE OF PLANT 20 YEARS press '1' for rec route --> 0CAPACITY OF PLANT 10 MW PROJECT COST UNIT TOTALCUF 21.24% % EPC(L&T) 800 LAKH/MW 8000PERFORMANCE FACTOR(loss dependent) 100% % LAND 30 LAKH/MW 300AUX CONSUMPTION 0.25% % DEVELOPMENT COST 22 LAKH/MW 220TOTAL UNIT GENERATED 186.06 LAKHS UNIT IDC 107.78NET UNIT GENERATED 186.06 LAKHS UNIT 8520UNIT SALE AFTER AUX CONSUMPTION 185.60 LAKHS UNIT TOTAL PROJECT COST 8627.78PROJECT COST 8627.78 LAKHS.INTERST ON LOAN 11.50% %TERM LOAN 10 YEARSINTERST ON WORKING CAPITAL 12.00% % INTERST BOXO&M EXPENSE 93.72 LAKH/MW/YEAR SBI BASE RATE 8.50% %TOTAL O&M 93.72 LAKH/MW. ADD SBI+300BPS 3% %MAT 20.01% % INTERST ON LOAN 11.50% %CORPORATE TAX 5.00% %ROE POST TAX 16% %ROE PRE TAX FOR LOAN TERM 20.00% % SBI BASE RATE 8.50% %ROE PRE TAX AFTER LAON TERM 16.84% % ADD 350BPS+SBI 3.50% %DERATION 0.77% PER YEAR INTERST ON WC 12.00% %ROE TENURE 10 YEARS
CAPITAL STRUCTURE TAXATIONDEBT 70% %EQUITY 30% % BASIC TAX 30% %TOTAL DEBT 6039.45 LAKHS ADD SURCHARGE 5% %TOTAL EQUITY 2588.33 LAKHS VALUE AFTER SURCHARGE 31.50% %
ADD EDUCATION CESS 3% %DEPRICIATION TABLE CORPORATE TAX 32.45% %BOOK DEPRICIATION ON ASSETS 5.28% %
MINIMUM ALT TAX 18.50% %AS PER IT ACT MAX DEPRICIATION 80% % ADD SURCHARGE 5% %
VALUE AFTER SURCHARGE 19.43% %AS PER COMPANY ACT ALLOWED 90% % ADD EDUCATION CESS 3% %FOR FIRST 12 YEARS 5.83% % MAT 20.01% %FOR REST 3.17% %
TAXATION SCHEDUILE80 IA BENEFIT YES 10 YEARS
INVERTER REPLACEMENT YEAR 14.00 YEAR. DEPRICIATION ALLOWED 80% FIRST YEARINVERTER REPLACEMENT EXPENCE 10.01 LAKHS/MW MAT START YEAR 5 YEARSTOTAL INVERTER REPLACEMENT COST 100.1 MAT END YEAR 15 YEAR.
CONSTRUCTION SCHEDULEWACC 12.44750000% START DATE 01-Oct-13PRESENT VALUE OF ANNUITY FACTOR 7.26 TIME 6 MONTHS
APPC/PFIT SCHEDULE COD 01-Apr-14SELL POWER AT APPC/PREFERENTIALAPPC PRICE/PREFERENTIAL TARIFF 6.48 RS/UNIT O&M SCHEDULEAVERAGE ESCALATION(2-10) 5% %PER YEAR O&M LAKH/YEAR/MW 93.72
O& ESCALATION % 5.00%MAINTENCE AND SPARES 15% OF O&M
REC SCHEDULEREC PRICE (2013-17) 9300 RS/MWh
Page | 65
1 2 3 4 5 6
IDC 01-Oct-13 01-Nov-13 01-Dec-13 01-Jan-14 01-Feb-14 01-Mar-14
CAPITAL AVAILABLE % 100% 90.00% 80.00% 65.00% 45.00% 20.00%CAPITAL REQUIRED % 10% 10% 15% 20% 25% 20%CAPITAL REQUIRED INR LAKHS 800.00 800.00 1200.00 1600.00 2000.00 1600.00EQUITY EXHAUST INR LAKHS 800.00 800.00 988.33 0.00 0.00 0.00DEBT COMPONENT INR LAKHS 0.00 0.00 211.67 1600.00 2000.00 1600.00CUMULATIVE DEBT INR LAKHS 0.00 0.00 211.67 1811.67 3811.67 5411.67INTERST INR LAKHS 0.00 0.00 2.03 17.36 36.53 51.86
TOTAL IDC 107.78
ALL UNITS IN LAKHS DEPRICIATION
YEAR 1 2 3 4 5 6 7 8 9 10 11 12 13 14 15 16 17 18 19 20START DATE 1-Apr-14 1-Apr-15 1-Apr-16 1-Apr-17 1-Apr-18 1-Apr-19 1-Apr-20 1-Apr-21 1-Apr-22 1-Apr-23 1-Apr-24 1-Apr-25 1-Apr-26 1-Apr-27 1-Apr-28 1-Apr-29 1-Apr-30 1-Apr-31 1-Apr-32 1-Apr-33END DATE 31-Mar-15 31-Mar-16 31-Mar-17 31-Mar-18 31-Mar-19 31-Mar-20 31-Mar-21 31-Mar-22 31-Mar-23 31-Mar-24 31-Mar-25 31-Mar-26 31-Mar-27 31-Mar-28 31-Mar-29 31-Mar-30 31-Mar-31 31-Mar-32 31-Mar-33 31-Mar-34BOOK DEPRICIATION 5.28%PROJECT COST 8627.7805LAND IS NOT DEPRICIATED
HENSE DEPRICIABLE AMOUNT8327.7805 LAKHS
DEPRICIATION AS COMPANY ACT
DEPRICIATION LIMIT 90% %DEPRICIATION FOR LOAN TERM5.83% %DEPRICIATION FOR REST 3.17% % INVERTER TO BE REPLACEDLOAN TERM 10 YEARS
DEPRICIATION 485.51 485.51 485.51 485.51 485.51 485.51 485.51 485.51 485.51 485.51 263.99 263.99 263.99 263.99 263.99 263.99 263.99 263.99 263.99 263.99CUMULATIVE DEPRICIATION485.51 971.02 1456.53 1942.04 2427.55 2913.06 3398.57 3884.08 4369.59 4855.10 5119.09 5383.08 5647.07 5911.06 6175.05 6439.04 6703.03 6967.02 7231.01 7495.00REPLACEMENT 0 0 0 0 0 0 0 0 0 0 0 0 100.1 0 0 0 0 0 0 0DEPRICIABLE AMOUNT 485.51 485.51 485.51 485.51 485.51 485.51 485.51 485.51 485.51 485.51 263.99 263.99 163.89 263.99 263.99 263.99 263.99 263.99 263.99 263.99CUMULATIVE DEPRICIATION485.51 971.02 1456.53 1942.04 2427.55 2913.06 3398.57 3884.08 4369.59 4855.10 5119.09 5383.08 5546.97 5810.96 6074.95 6338.94 6602.93 6866.92 7130.91 7394.90DEPRICIATION AS IT ACTTOTAL DEPRICIATION ALLOWED100% % 10 LAKH/MWpDEPRICIATION LIMIT 1 80% WRITE DOWN METHOD
DEPRICIATION IT ACT(FIRST YEAR)6902.2244
Page | 66

INPUT VALUE UNIT APPC PRICEESCALATION 5% %
ESTIMATE YEAR 10 YEARS
YEAR 1 2 3 4 5 6 7 8 9 10 11 12 13 14 15 16 17 18 19 20START DATE 1-Apr-14 1-Apr-15 1-Apr-16 1-Apr-17 1-Apr-18 1-Apr-19 1-Apr-20 1-Apr-21 1-Apr-22 1-Apr-23 1-Apr-24 1-Apr-25 1-Apr-26 1-Apr-27 1-Apr-28 1-Apr-29 1-Apr-30 1-Apr-31 1-Apr-32 1-Apr-33END DATE 31-Mar-15 31-Mar-16 31-Mar-17 31-Mar-18 31-Mar-19 31-Mar-20 31-Mar-21 31-Mar-22 31-Mar-23 31-Mar-24 31-Mar-25 31-Mar-26 31-Mar-27 31-Mar-28 31-Mar-29 31-Mar-30 31-Mar-31 31-Mar-32 31-Mar-33 31-Mar-34
APPC(RS/KWH) 6.48 6.804 7.1442 7.50141 7.8764805 8.270304525 8.6838198 9.11801074 9.5739113 10.052607 10.0526068 10.052607 10.052607 10.05261 10.052607 10.0526068 10.052607 10.052607 10.05261 10.052607ADD TX + WHEELING + CSS 2.1 2.1 2.1 2.1 2.1 2.1 2.1 2.1 2.1 2.1 2.1 2.1 2.1 2.1 2.1 2.1 2.1 2.1 2.1 2.1ADD TX + WHEELING + CSS 0 0 0 0 0 0 0 0 0 0 0 0 0 0 0 0 0 0 0 0TOTAL LENDED COST(CUSTOMER COST) 8.58 8.904 9.2442 9.60141 9.9764805 10.37030453 10.78382 11.2180107 11.673911 12.152607 12.1526068 12.152607 12.152607 12.15261 12.152607 12.1526068 12.152607 12.152607 12.15261 12.152607
INPUT VALUE UNIT WORKING CAPITALO&M EXPENSE 93.72 LAKHS/YEARO&M ESCALATION 5.00% % AUX CONSPN 0.25% %INTERST ON WC 12.00% % DERATION FACTR 0.77% %UNIT GENERATED FOR SALE 186.06MAINTENCE AND SPARES 15% OF O&MUNIT GENERATED AFTER DERATION 186.06 184.63 183.21 181.80 180.40 179.01 177.63 176.26 174.91 173.56 172.22 170.90 169.58 168.27 166.98 165.69 164.42 163.15 161.89 160.65UNIT AFTER AUX CONSUMPTION 185.60 184.17 182.75 181.34 179.95 178.56 177.19 175.82 174.47 173.12 171.79 170.47 169.16 167.85 166.56 165.28 164.01 162.74 161.49 160.25TOTAL REVENUE GENERATED 1202.67 1253.08 1305.60 1360.33 1417.35 1476.75 1538.65 1603.14 1670.34 1740.35 1726.95 1713.65 1700.46 1687.37 1674.37 1661.48 1648.69 1635.99 1623.39 1610.89
YEAR 1 2 3 4 5 6 7 8 9 10 11 12 13 14 15 16 17 18 19 20START DATE 1-Apr-14 1-Apr-15 1-Apr-16 1-Apr-17 1-Apr-18 1-Apr-19 1-Apr-20 1-Apr-21 1-Apr-22 1-Apr-23 1-Apr-24 1-Apr-25 1-Apr-26 1-Apr-27 1-Apr-28 1-Apr-29 1-Apr-30 1-Apr-31 1-Apr-32 1-Apr-33END DATE 31-Mar-15 31-Mar-16 31-Mar-17 31-Mar-18 31-Mar-19 31-Mar-20 31-Mar-21 31-Mar-22 31-Mar-23 31-Mar-24 31-Mar-25 31-Mar-26 31-Mar-27 31-Mar-28 31-Mar-29 31-Mar-30 31-Mar-31 31-Mar-32 31-Mar-33 31-Mar-34
O&M EXPENSE (LAKHS) 93.72 98.41 103.33 108.49 113.92 119.61 125.59 131.87 138.47 145.39 152.66 160.29 168.31 176.72 185.56 194.84 204.58 214.81 225.55 236.83ONE MONTH O&M 7.81 8.20 8.61 9.04 9.49 9.97 10.47 10.99 11.54 12.12 12.72 13.36 14.03 14.73 15.46 16.24 17.05 17.90 18.80 19.74TWO MONTHS RECIEVABLE 200.45 208.85 217.60 226.72 236.22 246.13 256.44 267.19 278.39 290.06 287.83 285.61 283.41 281.23 279.06 276.91 274.78 272.67 270.57 268.48MAINTENACE AND SPARES 14.06 14.76 15.50 16.27 17.09 17.94 18.84 19.78 20.77 21.81 22.90 24.04 25.25 26.51 27.83 29.23 30.69 32.22 33.83 35.52TOTAL WORKING CAPITAL 222.31 231.81 241.71 252.04 262.80 274.04 285.75 297.96 310.70 323.98 323.45 323.01 322.68 322.46 322.36 322.38 322.52 322.79 323.19 323.74INTERST ON WC 26.68 27.82 29.01 30.24 31.54 32.88 34.29 35.76 37.28 38.88 38.81 38.76 38.72 38.70 38.68 38.69 38.70 38.73 38.78 38.85
Page | 67

INTEREST ON LOANINPUT VALUE UNITLOAN AMOUNT 6039.446367 LAKHSINTEREST ON LAON 11.50% %LAON TERM 10 YEARSTOTL INSTALLMENT 120VALUE OF EACH INSTALLMENT50.32871972 LAKHS
YEAR 1 2 3 4 5 6 7 8 9 10START DATE 1-Apr-14 1-Apr-15 1-Apr-16 1-Apr-17 1-Apr-18 1-Apr-19 1-Apr-20 1-Apr-21 1-Apr-22 1-Apr-23END DATE 31-Mar-15 31-Mar-16 31-Mar-17 31-Mar-18 31-Mar-19 31-Mar-20 31-Mar-21 31-Mar-22 31-Mar-23 31-Mar-24LOAN REPAYMENT
APRIL INSTALLMENT 1 50.33 50.33 50.33 50.33 50.33 50.33 50.33 50.33 50.33 50.33MAY INSTALLMENT 2 50.33 50.33 50.33 50.33 50.33 50.33 50.33 50.33 50.33 50.33JUNE INSTALLMENT 3 50.33 50.33 50.33 50.33 50.33 50.33 50.33 50.33 50.33 50.33JULY INSTALLMENT 4 50.33 50.33 50.33 50.33 50.33 50.33 50.33 50.33 50.33 50.33AUGUSTINSTALLMENT 5 50.33 50.33 50.33 50.33 50.33 50.33 50.33 50.33 50.33 50.33SEPTEMBERINSTALLMENT 6 50.33 50.33 50.33 50.33 50.33 50.33 50.33 50.33 50.33 50.33OCTOBERINSTALLMENT 7 50.33 50.33 50.33 50.33 50.33 50.33 50.33 50.33 50.33 50.33NOVEMBERINSTALLMENT 8 50.33 50.33 50.33 50.33 50.33 50.33 50.33 50.33 50.33 50.33DECEMBERINSTALLMENT 9 50.33 50.33 50.33 50.33 50.33 50.33 50.33 50.33 50.33 50.33JANUARYINSTALLMENT 10 50.33 50.33 50.33 50.33 50.33 50.33 50.33 50.33 50.33 50.33FEBRUARYINSTALLMENT 11 50.33 50.33 50.33 50.33 50.33 50.33 50.33 50.33 50.33 50.33MARCHINSTALLMENT 12 50.33 50.33 50.33 50.33 50.33 50.33 50.33 50.33 50.33 50.33
TOTAL YEARLY 603.94 603.94 603.94 603.94 603.94 603.94 603.94 603.94 603.94 603.94CUMULATIVE 603.94 1207.89 1811.83 2415.78 3019.72 3623.67 4227.61 4831.56 5435.50 6039.45
APRIL OUTSTANDING 1 6039.45 5435.50 4831.56 4227.61 3623.67 3019.72 2415.78 1811.83 1207.89 603.94MAY OUTSTANDING 2 5989.12 5385.17 4781.23 4177.28 3573.34 2969.39 2365.45 1761.51 1157.56 553.62JUNE OUTSTANDING 3 5938.79 5334.84 4730.90 4126.96 3523.01 2919.07 2315.12 1711.18 1107.23 503.29JULY OUTSTANDING 4 5888.46 5284.52 4680.57 4076.63 3472.68 2868.74 2264.79 1660.85 1056.90 452.96AUGUSTOUTSTANDING 5 5838.13 5234.19 4630.24 4026.30 3422.35 2818.41 2214.46 1610.52 1006.57 402.63SEPTEMBEROUTSTANDING 6 5787.80 5183.86 4579.91 3975.97 3372.02 2768.08 2164.13 1560.19 956.25 352.30OCTOBEROUTSTANDING 7 5737.47 5133.53 4529.58 3925.64 3321.70 2717.75 2113.81 1509.86 905.92 301.97NOVEMBEROUTSTANDING 8 5687.15 5083.20 4479.26 3875.31 3271.37 2667.42 2063.48 1459.53 855.59 251.64DECEMBEROUTSTANDING 9 5636.82 5032.87 4428.93 3824.98 3221.04 2617.09 2013.15 1409.20 805.26 201.31JANUARYOUTSTANDING 10 5586.49 4982.54 4378.60 3774.65 3170.71 2566.76 1962.82 1358.88 754.93 150.99FEBRUARYOUTSTANDING 11 5536.16 4932.21 4328.27 3724.33 3120.38 2516.44 1912.49 1308.55 704.60 100.66MARCHOUTSTANDING 12 5485.83 4881.89 4277.94 3674.00 3070.05 2466.11 1862.16 1258.22 654.27 50.33
APRIL INTERST ON LOAN 1 57.88 52.09 46.30 40.51 34.73 28.94 23.15 17.36 11.58 5.79MAY INTERST ON LOAN 2 57.40 51.61 45.82 40.03 34.24 28.46 22.67 16.88 11.09 5.31JUNE INTERST ON LOAN 3 56.91 51.13 45.34 39.55 33.76 27.97 22.19 16.40 10.61 4.82JULY INTERST ON LOAN 4 56.43 50.64 44.86 39.07 33.28 27.49 21.70 15.92 10.13 4.34AUGUSTINTERST ON LOAN 5 55.95 50.16 44.37 38.59 32.80 27.01 21.22 15.43 9.65 3.86SEPTEMBERINTERST ON LOAN 6 55.47 49.68 43.89 38.10 32.32 26.53 20.74 14.95 9.16 3.38OCTOBERINTERST ON LOAN 7 54.98 49.20 43.41 37.62 31.83 26.05 20.26 14.47 8.68 2.89NOVEMBERINTERST ON LOAN 8 54.50 48.71 42.93 37.14 31.35 25.56 19.77 13.99 8.20 2.41DECEMBERINTERST ON LOAN 9 54.02 48.23 42.44 36.66 30.87 25.08 19.29 13.50 7.72 1.93JANUARYINTERST ON LOAN 10 53.54 47.75 41.96 36.17 30.39 24.60 18.81 13.02 7.23 1.45FEBRUARYINTERST ON LOAN 11 53.05 47.27 41.48 35.69 29.90 24.12 18.33 12.54 6.75 0.96MARCHINTERST ON LOAN 12 52.57 46.78 41.00 35.21 29.42 23.63 17.85 12.06 6.27 0.48
TOTAL INTEREST 662.70 593.25 523.80 454.34 384.89 315.44 245.98 176.53 107.07 37.62
Page | 68
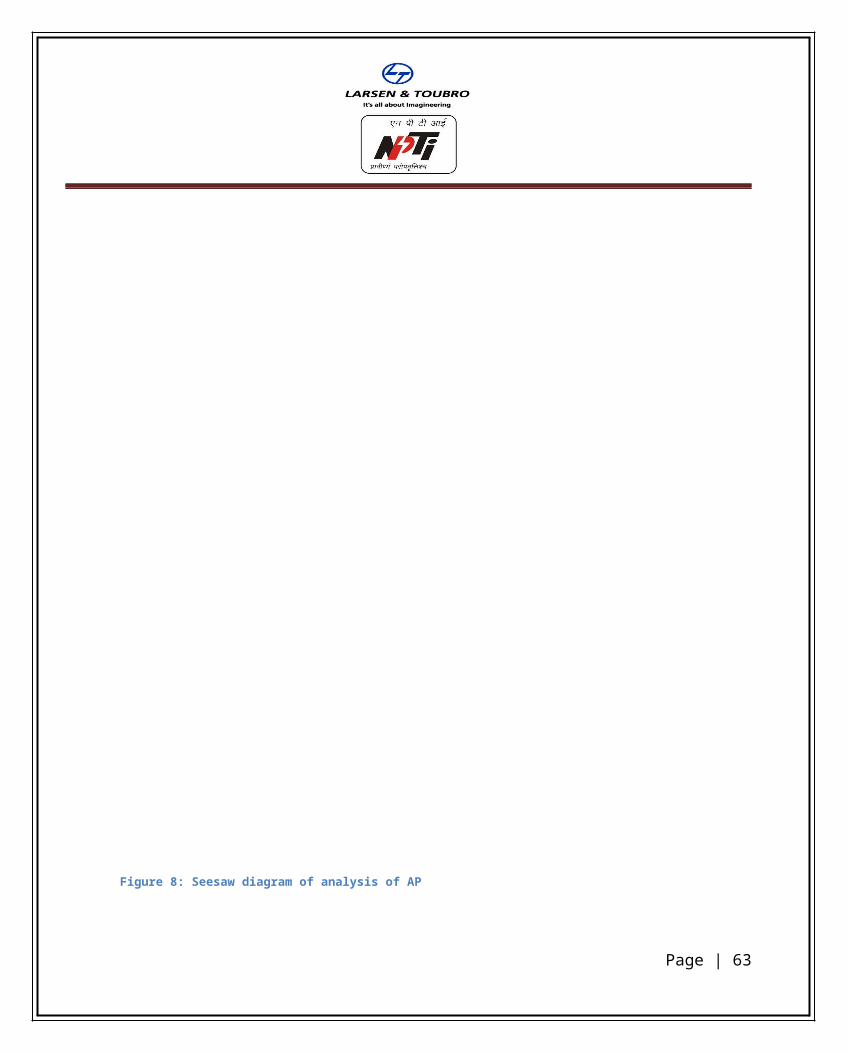
TARIFFINPUT VALUE UNITNET GENERATION 186.0624 LAKH UNITSDISCOUNT RATE 12.45% %ANNUITY FACTOR 7.264749794DERATE FACTOR 0.77% PER YEARAUX CONSUMPTION 0.25% %
YEAR 1 2 3 4 5 6 7 8 9 10 11 12 13 14 15 16 17 18 19 20START DATE 1-Apr-14 1-Apr-15 1-Apr-16 1-Apr-17 1-Apr-18 1-Apr-19 1-Apr-20 1-Apr-21 1-Apr-22 1-Apr-23 1-Apr-24 1-Apr-25 1-Apr-26 1-Apr-27 1-Apr-28 1-Apr-29 1-Apr-30 1-Apr-31 1-Apr-32 1-Apr-33END DATE 31-Mar-15 31-Mar-16 31-Mar-17 31-Mar-18 31-Mar-19 31-Mar-20 31-Mar-21 31-Mar-22 31-Mar-23 31-Mar-24 31-Mar-25 31-Mar-26 31-Mar-27 31-Mar-28 31-Mar-29 31-Mar-30 31-Mar-31 31-Mar-32 31-Mar-33 31-Mar-34
NET GENERATION 186.06 184.63 183.21 181.80 180.40 179.01 177.63 176.26 174.91 173.56 172.22 170.90 169.58 168.27 166.98 165.69 164.42 163.15 161.89 160.65AFTER AUX CONSUMPTION 185.60 184.17 182.75 181.34 179.95 178.56 177.19 175.82 174.47 173.12 171.79 170.47 169.16 167.85 166.56 165.28 164.01 162.74 161.49 160.25
FIXED COST COMPONENTS
INTEREST ON LOAN 662.70 593.25 523.80 454.34 384.89 315.44 245.98 176.53 107.07 37.62 0 0INTEREST ON WC 26.68 27.82 29.01 30.24 31.54 32.88 34.29 35.76 37.28 38.88 38.81 38.76 38.72 38.70 38.68 38.69 38.70 38.73 38.78 38.85ROE 517.72 517.72 517.72 517.72 517.72 517.72 517.72 517.72 517.72 517.72 435.93 435.93 435.93 435.93 435.93 435.93 435.93 435.93 435.93 435.93O&M EXPENSE 93.72 98.41 103.33 108.49 113.92 119.61 125.59 131.87 138.47 145.39 152.66 160.29 168.31 176.72 185.56 194.84 204.58 214.81 225.55 236.83DEPRICIATION 485.51 485.51 485.51 485.51 485.51 485.51 485.51 485.51 485.51 485.51 263.99 263.99 263.99 263.99 263.99 263.99 263.99 263.99 263.99 263.99
TOTAL FIXED COST 1786.33 1722.70 1659.35 1596.31 1533.57 1471.16 1409.09 1347.38 1286.05 1225.12 891.39 898.97 906.95 915.34 924.16 933.44 943.20 953.46 964.25 975.60
VARIABLE COST COMPONENT
FUEL COST
TOTAL COST 1786.33 1722.70 1659.35 1596.31 1533.57 1471.16 1409.09 1347.38 1286.05 1225.12 891.39 898.97 906.95 915.34 924.16 933.44 943.20 953.46 964.25 975.60
COST OF GENERATION (RS/KWH) 9.62 9.35 9.08 8.80 8.52 8.24 7.95 7.66 7.37 7.08 5.19 5.27 5.36 5.45 5.55 5.65 5.75 5.86 5.97 6.09LEVELISED COST OF ELECTRICITY 7.90
YEARLY DEPENDENT METHODDISCOUNT FACTOR 1.00 0.89 0.79 0.70 0.63 0.56 0.49 0.44 0.39 0.35 0.31 0.28 0.24 0.22 0.19 0.17 0.15 0.14 0.12 0.11LEVELISED GENERATION 177.44
LEVELISED FIXED COST 1411.36BEST METHOD
LEVELISED COST OF ELECTRICITY (MAX) 7.95
Page | 69
INPUT VALUE UNIT GREEN REVENUECER PRICE 0.4 EUROEURO PRICE 78.23 RSCER IN INR 31.292 INR/TONNE OF CO2UNFCC ADAPTATION FEE 2% %ESTIMATION BENEFIT 10 YEARSREVENUE RETAINED 100% IST YEARINCREMENTAL SHARE OF BENIFICIARY 10% PER YEARMIN RETAINED REVENUE 50% %TOTAL CERS 1460.00 PER LAKH UNITSREC FLOOR PRICE INR 9300 UP TO 2017AFTER 2017 (ASSUMED 50% DECREASE) 4650.00 UP TO 2022B/W 2022-2027 INR 2325.00AFTER 2027 0.00
YEAR 1 2 3 4 5 6 7 8 9 10 11 12 13 14 15 16 17 18 19 20START DATE 1-Apr-14 1-Apr-15 1-Apr-16 1-Apr-17 1-Apr-18 1-Apr-19 1-Apr-20 1-Apr-21 1-Apr-22 1-Apr-23 1-Apr-24 1-Apr-25 1-Apr-26 1-Apr-27 1-Apr-28 1-Apr-29 1-Apr-30 1-Apr-31 1-Apr-32 1-Apr-33END DATE 31-Mar-15 31-Mar-16 31-Mar-17 31-Mar-18 31-Mar-19 31-Mar-20 31-Mar-21 31-Mar-22 31-Mar-23 31-Mar-24 31-Mar-25 31-Mar-26 31-Mar-27 31-Mar-28 31-Mar-29 31-Mar-30 31-Mar-31 31-Mar-32 31-Mar-33 31-Mar-34
NET GENERATION LAKH UNITS 185.60 184.17 182.75 181.34 179.95 178.56 177.19 175.82 174.47 173.12 171.79 170.47 169.16 167.85 166.56 165.28 164.01 162.74 161.49 160.25CER AVAILED 270971.98 268885.49 266815.07 264760.60 262721.94 260698.98 258691.60 256699.67 254723.09 252761.72TOTAL CER INCOME 211.98 210.35 208.73 207.12 205.53 203.94 202.37 200.82 199.27 197.74LESS UNFCC CHARGE 207.74 206.14 204.55 202.98 201.42 199.87 198.33 196.80 195.28 193.78 0.00REVENUE RETAINED 207.74 185.53 184.10 182.68 181.28 179.88 179.88 179.88 179.88 179.88
1.00 0.90 0.80 0.70 0.60 0.50 0.50 0.50 0.50 0.50
REC MARKET TREND 1726.05 1726.05 1726.05 1726.05 836.75 836.75 836.75 836.75 836.75 402.51 402.51 402.51 402.51 402.51
TOTAL REC + CER 1933.80 1911.58 1910.15 1908.74 1018.03 1016.63 1016.63 1016.63 1016.63 582.39 402.51 402.51 402.51 402.51 0.00 0.00 0.00 0.00 0.00 0.00
TOTAL BENEFIT PER UNIT 10.42 10.38 10.45 10.53 5.66 5.69 5.74 5.78 5.83 3.36 2.34 2.36 2.38 2.40 0.00 0.00 0.00 0.00 0.00 0.00
Page | 70

PROFIT AND LOSS ACCOUNTINPUT VALUE UNITMAT 20.01% %TAX HOLIDAY 10 YEARSYEAR 1 2 3 4 5 6 7 8 9 10 11 12 13 14 15 16 17 18 19 20START DATE 1-Apr-14 1-Apr-15 1-Apr-16 1-Apr-17 1-Apr-18 1-Apr-19 1-Apr-20 1-Apr-21 1-Apr-22 1-Apr-23 1-Apr-24 1-Apr-25 1-Apr-26 1-Apr-27 1-Apr-28 1-Apr-29 1-Apr-30 1-Apr-31 1-Apr-32 1-Apr-33END DATE 31-Mar-15 31-Mar-16 31-Mar-17 31-Mar-18 31-Mar-19 31-Mar-20 31-Mar-21 31-Mar-22 31-Mar-23 31-Mar-24 31-Mar-25 31-Mar-26 31-Mar-27 31-Mar-28 31-Mar-29 31-Mar-30 31-Mar-31 31-Mar-32 31-Mar-33 31-Mar-34
TOTAL UNIT GENERATED(LAKHS UNIT) 185.60 184.17 182.75 181.34 179.95 178.56 177.19 175.82 174.47 173.12 171.79 170.47 169.16 167.85 166.56 165.28 164.01 162.74 161.49 160.25GREY REVENUE(LAKHS INR) 1202.67 1253.08 1305.60 1360.33 1417.35 1476.75 1538.65 1603.14 1670.34 1740.35 1726.95 1713.65 1700.46 1687.37 1674.37 1661.48 1648.69 1635.99 1623.39 1610.89REC+CER RENENUE(LAKHS INR) 0.00 0.00 0.00 0.00 0.00 0.00 0.00 0.00 0.00 0.00 0.00 0.00 0.00 0.00 0.00 0.00 0.00 0.00 0.00 0.00TOTAL REVENUE (LAKHS INR) 1202.67 1253.08 1305.60 1360.33 1417.35 1476.75 1538.65 1603.14 1670.34 1740.35 1726.95 1713.65 1700.46 1687.37 1674.37 1661.48 1648.69 1635.99 1623.39 1610.89
LESS O&M +INSURANCE 93.72 98.41 103.33 108.49 113.92 119.61 125.59 131.87 138.47 145.39 152.66 160.29 168.31 176.72 185.56 194.84 204.58 214.81 225.55 236.83
EBDITA (INR LAKHS) 1108.95 1154.67 1202.28 1251.83 1303.43 1357.14 1413.06 1471.27 1531.87 1594.96 1574.29 1553.36 1532.15 1510.64 1488.81 1466.64 1444.11 1421.18 1397.85 1374.07
LESS DEPRICIATION (COMPANY ACT) 485.51 485.51 485.51 485.51 485.51 485.51 485.51 485.51 485.51 485.51 263.99 263.99 263.99 263.99 263.99 263.99 263.99 263.99 263.99 263.99
EBITA 623.44 669.16 716.77 766.33 817.92 871.63 927.55 985.76 1046.36 1109.45 1310.30 1289.37 1268.16 1246.65 1224.82 1202.65 1180.12 1157.19 1133.86 1110.08
LESS INTERST ON LOAN 662.70 593.25 523.80 454.34 384.89 315.44 245.98 176.53 107.07 37.62 0 0LESS INTERST ON WC 26.68 27.82 29.01 30.24 31.54 32.88 34.29 35.76 37.28 38.88 38.81 38.76 38.72 38.70 38.68 38.69 38.70 38.73 38.78 38.85TOTAL INTERST 689.38 621.07 552.80 484.59 416.43 348.32 280.27 212.28 144.36 76.50 38.81 38.76 38.72 38.70 38.68 38.69 38.70 38.73 38.78 38.85
EBTA (65.94) 48.10 163.97 281.74 401.49 523.31 647.28 773.48 902.00 1032.95 1271.49 1250.61 1229.44 1207.96 1186.14 1163.97 1141.41 1118.46 1095.07 1071.23
LESS AMORTIZATION
EBT OR PBT (65.94) 48.10 163.97 281.74 401.49 523.31 647.28 773.48 902.00 1032.95 1271.49 1250.61 1229.44 1207.96 1186.14 1163.97 1141.41 1118.46 1095.07 1071.23
Page | 71

INPUT VALUE UNIT TAXATIONMAT 20.01% %TAX HOLIDAY 10 YEARCORPORATE TAX 5.00% %MAT ALLOWED(IST YR) 80% %
TAXATION SCHEDUILE80 IA BENEFIT YES 10 YEARSDEPRICIATION ALLOWED 80.00% FIRST YEARMAT START YEAR 5 YEARSMAT END YEAR 15 YEAR.
YEAR 1 2 3 4 5 6 7 8 9 10 11 12 13 14 15 16 17 18 19 20START DATE 1-Apr-14 1-Apr-15 1-Apr-16 1-Apr-17 1-Apr-18 1-Apr-19 1-Apr-20 1-Apr-21 1-Apr-22 1-Apr-23 1-Apr-24 1-Apr-25 1-Apr-26 1-Apr-27 1-Apr-28 1-Apr-29 1-Apr-30 1-Apr-31 1-Apr-32 1-Apr-33END DATE 31-Mar-15 31-Mar-16 31-Mar-17 31-Mar-18 31-Mar-19 31-Mar-20 31-Mar-21 31-Mar-22 31-Mar-23 31-Mar-24 31-Mar-25 31-Mar-26 31-Mar-27 31-Mar-28 31-Mar-29 31-Mar-30 31-Mar-31 31-Mar-32 31-Mar-33 31-Mar-34
PBT (65.94) 48.10 163.97 281.74 401.49 523.31 647.28 773.48 902.00 1032.95 1271.49 1250.61 1229.44 1207.96 1186.14 1163.97 1141.41 1118.46 1095.07 1071.23
ADD DEPRICIATION (COMPANY ACT) 485.51 485.51 485.51 485.51 485.51 485.51 485.51 485.51 485.51 485.51 263.99 263.99 263.99 263.99 263.99 263.99 263.99 263.99 263.99 263.99
OPENING VALUE 8627.78 1725.56 345.11 69.02 13.80 2.76 0.55 0.11 0.02 0.00 0.00 0.00 0.00 0.00 0.00 0.00 0.00 0.00 0.00 0.00LESS DEPRICIATION AS IT ACT 6902.22 1380.44 276.09 55.22 11.04 2.21 0.44 0.09 0.02 0.00 0.00 0.00 0.00 0.00 0.00 0.00 0.00 0.00 0.00 0.00
CLOSING VALUE 1725.56 345.11 69.02 13.80 2.76 0.55 0.11 0.02 0.00 0.00 0.00 0.00 0.00 0.00 0.00 0.00 0.00 0.00 0.00 0.00
TAXABLE INCOME (6482.66) (846.84) 373.39 712.03 875.96 1006.61 1132.34 1258.90 1387.50 1518.46 1535.48 1514.60 1493.43 1471.95 1450.13 1427.96 1405.41 1382.45 1359.06 1335.22
TAXABLE INCOME AFTER LOSSES CARRIED OUT (6482.66) (7329.49) (6956.11) (6244.08) (5368.12) (4361.51) (3229.16) (1970.26) (582.76) 1518.46 1535.48 1514.60 1493.43 1471.95 1450.13 1427.96 1405.41 1382.45 1359.06 1335.22
TAX HOLIDAYS (80 IA)
CORPORATE TAX 0.00 0.00 0.00 0.00 0.00 0.00 0.00 0.00 0.00 0.00 0.00 0.00 0.00 0.00 72.51 71.40 70.27 69.12 67.95 66.76MAT (13.19) 9.62 32.81 56.37 80.33 104.70 129.51 154.76 180.47 206.67 254.40 250.22 245.98 241.68 237.32 232.88 228.37 223.78 219.10 214.33
TAX MAX OF ABOVE TAXES 0.00 9.62 32.81 56.37 80.33 104.70 129.51 154.76 180.47 206.67 254.40 250.22 245.98 241.68 237.32 232.88 228.37 223.78 219.10 214.33
MAT SET OFF 13.19 (9.62) (32.81) (56.37) (80.33) (104.70) (129.51) (154.76) (180.47) (206.67) (254.40) (250.22) (245.98) (241.68) (164.81) (161.49) (158.10) (154.66) (151.15) (147.57)
MAT PEREOD 6 7 8 9 10 11 12 13 14 15MAT PAID 104.70 129.51 154.76 180.47 206.67 254.40 250.22 245.98 241.68 237.32
SET OFF UNDER MAT 16 17 18 19 20 21 22 23 24 25 26 27 28 29 30 31 32 33 34 35MAT SET OFF (161.49) (158.10) (154.66) (151.15) (147.57) 0.00 0.00 0.00 0.00 0.00 0.00 0.00 0.00 0.00 0.00 0.00 0.00 0.00 0.00 0.00
MAT OPENING BALANCE 2005.71 2167.19 2325.29 2479.95 2631.10 2778.66 2778.66 2778.66 2778.66 2778.66 2778.66 2778.66 2778.66 2778.66 2778.66 2778.66 2778.66 2778.66 2778.66 2778.66ADJUSTMENT (161.49) (158.10) (154.66) (151.15) (147.57) 0.00 0.00 0.00 0.00 0.00 0.00 0.00 0.00 0.00 0.00 0.00 0.00 0.00 0.00 0.00CLOSING BALANCE 2167.19 2325.29 2479.95 2631.10 2778.66 2778.66 2778.66 2778.66 2778.66 2778.66 2778.66 2778.66 2778.66 2778.66 2778.66 2778.66 2778.66 2778.66 2778.66 2778.66
NET SET OFF 1 2 3 4 5 6 7 8 9 10 11 12 13 14 15 16 17 18 19 20-- -- -- -- -- -- -- -- -- -- -- -- -- -- -- (161.49) (158.10) (154.66) (151.15) (147.57)
TAX PAID 0.00 9.62 32.81 56.37 80.33 104.70 129.51 154.76 180.47 206.67 254.40 250.22 245.98 241.68 237.32 232.88 228.37 223.78 219.10 214.33
PAT (65.94) 38.47 131.16 225.37 321.16 418.61 517.77 618.72 721.53 826.28 1017.09 1000.39 983.46 966.27 948.82 931.08 913.04 894.68 875.97 856.90
Page | 72

INPUT VALUE UNIT PROJECT IRRINTERST RATE 11.50% %DISCOUNT RATE 12.45% %REINVESTING RATE 80% %YEAR 1 2 3 4 5 6 7 8 9 10 11 12 13 14 15 16 17 18 19 20START DATE 1-Apr-14 1-Apr-15 1-Apr-16 1-Apr-17 1-Apr-18 1-Apr-19 1-Apr-20 1-Apr-21 1-Apr-22 1-Apr-23 1-Apr-24 1-Apr-25 1-Apr-26 1-Apr-27 1-Apr-28 1-Apr-29 1-Apr-30 1-Apr-31 1-Apr-32 1-Apr-33END DATE 31-Mar-15 31-Mar-16 31-Mar-17 31-Mar-18 31-Mar-19 31-Mar-20 31-Mar-21 31-Mar-22 31-Mar-23 31-Mar-24 31-Mar-25 31-Mar-26 31-Mar-27 31-Mar-28 31-Mar-29 31-Mar-30 31-Mar-31 31-Mar-32 31-Mar-33 31-Mar-34
4/1/2013 4/1/2014 4/1/2015 4/1/2016 4/1/2017 4/1/2018 4/1/2019 4/1/2020 4/1/2021 4/1/2022 4/1/2023 4/1/2024 4/1/2025 4/1/2026 4/1/2027 4/1/2028 4/1/2029 4/1/2030 4/1/2031 4/1/2032 4/1/2033PAT (65.94) 38.47 131.16 225.37 321.16 418.61 517.77 618.72 721.53 826.28 1017.09 1000.39 983.46 966.27 948.82 931.08 913.04 894.68 875.97 856.90 ADD DEPRICIATION 485.51 485.51 485.51 485.51 485.51 485.51 485.51 485.51 485.51 485.51 263.99 263.99 263.99 263.99 263.99 263.99 263.99 263.99 263.99 263.99ADD INTERST ON LOAN 662.70 593.25 523.80 454.34 384.89 315.44 245.98 176.53 107.07 37.62 0 0ADD INTERST ON WC 26.68 27.82 29.01 30.24 31.54 32.88 34.29 35.76 37.28 38.88 38.81 38.76 38.72 38.70 38.68 38.69 38.70 38.73 38.78 38.85less CHANGE IN WC (222.31) (231.81) (241.71) (252.04) (262.80) (274.04) (285.75) (297.96) (310.70) (323.98) (323.45) (323.01) (322.68) (322.46) (322.36) (322.38) (322.52) (322.79) (323.19) (323.74)
CASH FLOW AVAILABLE 886.64 913.24 927.76 943.43 960.29 978.40 997.81 1018.55 1040.70 1064.31 996.45 980.13 963.49 946.49 929.13 911.38 893.22 874.62 855.55 836.00
PROJECT IRR(8627.78) 886.64 913.24 927.76 943.43 960.29 978.40 997.81 1018.55 1040.70 1064.31 996.45 980.13 963.49 946.49 929.13 911.38 893.22 874.62 855.55 836.00
9%8%
9.09%
EQUITY IRRPAT (65.94) 38.47 131.16 225.37 321.16 418.61 517.77 618.72 721.53 826.28 1017.09 1000.39 983.46 966.27 948.82 931.08 913.04 894.68 875.97 856.90ADD DEPRICIATION 485.51 485.51 485.51 485.51 485.51 485.51 485.51 485.51 485.51 485.51 263.99 263.99 263.99 263.99 263.99 263.99 263.99 263.99 263.99 263.99LESS REPAYMENT 603.94 603.94 603.94 603.94 603.94 603.94 603.94 603.94 603.94 603.94 0 0 0 0 0 0 0
CASH FLOW AVAILABLE (184.38) (79.96) 12.72 106.93 202.73 300.17 399.34 500.29 603.10 707.85 1281.08 1264.38 1247.45 1230.26 1212.81 1195.07 1177.03 1158.67 1139.96 1120.89
EQUITY IRR(2588.33) (184.38) (79.96) 12.72 106.93 202.73 300.17 399.34 500.29 603.10 707.85 1281.08 1264.38 1247.45 1230.26 1212.81 1195.07 1177.03 1158.67 1139.96 1120.89
14%12%
13.75%
Page | 73

BALANCE SHEETYEAR 1 2 3 4 5 6 7 8 9 10 11 12 13 14 15 16 17 18 19 20START DATE 1-Apr-14 1-Apr-15 1-Apr-16 1-Apr-17 1-Apr-18 1-Apr-19 1-Apr-20 1-Apr-21 1-Apr-22 1-Apr-23 1-Apr-24 1-Apr-25 1-Apr-26 1-Apr-27 1-Apr-28 1-Apr-29 1-Apr-30 1-Apr-31 1-Apr-32 1-Apr-33END DATE 31-Mar-15 31-Mar-16 31-Mar-17 31-Mar-18 31-Mar-19 31-Mar-20 31-Mar-21 31-Mar-22 31-Mar-23 31-Mar-24 31-Mar-25 31-Mar-26 31-Mar-27 31-Mar-28 31-Mar-29 31-Mar-30 31-Mar-31 31-Mar-32 31-Mar-33 31-Mar-34
ASSETS
GROSS FIXED ASSETS 8327.7805 8327.7805 8327.7805 8327.7805 8327.7805 8327.7805 8327.7805 8327.7805 8327.7805 8327.7805 8327.7805 8327.780524 8327.7805 8327.7805 8327.7805 8327.7805 8327.7805 8327.7805 8327.7805 8327.7805ACCUMULATED DEPRICIATION 485.5096 971.01921 1456.5288 1942.0384 2427.548 2913.0576 3398.5672 3884.0768 4369.5864 4855.096 5119.0867 5383.077331 5647.068 5911.0586 6175.0493 6439.0399 6703.0305 6967.0212 7231.0118 7495.0025NET FIXED ASSETS 7842.2709 7356.7613 6871.2517 6385.7421 5900.2325 5414.7229 4929.2133 4443.7037 3958.1941 3472.6845 3208.6938 2944.703193 2680.7126 2416.7219 2152.7313 1888.7406 1624.75 1360.7593 1096.7687 832.77805LAND 300 300 300 300 300 300 300 300 300 300 300 300 300 300 300 300 300 300 300 300
LONG TERM ASSETS 8142.2709 7656.7613 7171.2517 6685.7421 6200.2325 5714.7229 5229.2133 4743.7037 4258.1941 3772.6845 3508.6938 3244.703193 2980.7126 2716.7219 2452.7313 2188.7406 1924.75 1660.7593 1396.7687 1132.7781
CASH AND BANK BALANCE -184.3755 -264.3361 -251.6113 -144.6776 58.050686 358.22406 757.56037 1257.8476 1860.9466 2568.7942 3849.8762 5114.257107 6361.7034 7591.9653 8804.7757 9999.8498 11176.884 12335.555 13475.518 14596.409
SHORT TERM ASSETS -184.3755 -264.3361 -251.6113 -144.6776 58.050686 358.22406 757.56037 1257.8476 1860.9466 2568.7942 3849.8762 5114.257107 6361.7034 7591.9653 8804.7757 9999.8498 11176.884 12335.555 13475.518 14596.409
TOTAL ASSETS 7957.8954 7392.4252 6919.6404 6541.0645 6258.2832 6072.947 5986.7737 6001.5513 6119.1407 6341.4787 7358.57 8358.9603 9342.416 10308.687 11257.507 12188.59 13101.634 13996.314 14872.287 15729.187
-603.9446 -603.9446 -603.9446 -603.9446 -603.9446 -603.9446 -603.9446 -603.9446 -603.9446 -603.9446 0 0 0 0 0 0 0 0 0 0LIABILITY
SHAREHOLDER EQUITY 2588.3342 2588.3342 2588.3342 2588.3342 2588.3342 2588.3342 2588.3342 2588.3342 2588.3342 2588.3342 2588.3342 2588.334157 2588.3342 2588.3342 2588.3342 2588.3342 2588.3342 2588.3342 2588.3342 2588.3342ACCUMULATED RESERVE AND SURPLUS-65.94044 -27.46601 103.69381 329.06252 650.22585 1068.8343 1586.6056 2205.3278 2926.8619 3753.1445 4770.2359 5770.626143 6754.0818 7720.3531 8669.1728 9600.2563 10513.3 11407.98 12283.953 13140.853OUTSTANDING DEBT 5435.5017 4831.5571 4227.6125 3623.6678 3019.7232 2415.7785 1811.8339 1207.8893 603.94464 0 0 0 0 0 0 0 0 0 0 0
7957.8954 7392.4252 6919.6404 6541.0645 6258.2832 6072.947 5986.7737 6001.5513 6119.1407 6341.4787 7358.57 8358.9603 9342.416 10308.687 11257.507 12188.59 13101.634 13996.314 14872.287 15729.187
Page | 74
DEBT SERVICE COVERAGE RATIO
YEAR 1 2 3 4 5 6 7 8 9 10START DATE 1-Apr-14 1-Apr-15 1-Apr-16 1-Apr-17 1-Apr-18 1-Apr-19 1-Apr-20 1-Apr-21 1-Apr-22 1-Apr-23END DATE 31-Mar-15 31-Mar-16 31-Mar-17 31-Mar-18 31-Mar-19 31-Mar-20 31-Mar-21 31-Mar-22 31-Mar-23 31-Mar-24
PRINCIPAL PAYMENT 603.94464 603.94464 603.94464 603.94464 603.94464 603.94464 603.94464 603.94464 603.94464 603.94464INTERST PAYMENT 662.70342 593.24978 523.79615 454.34252 384.88888 315.43525 245.98162 176.52798 107.07435 37.620718Total Debt Service 1266.6481 1197.1944 1127.7408 1058.2872 988.83352 919.37989 849.92625 780.47262 711.01899 641.56535Cumulative Debt Service 1266.6481 2463.8425 3591.5833 4649.8704 5638.7039 6558.0838 7408.0101 8188.4827 8899.5017 9541.067Post-tax Cashflow before Debt Service 886.63712 913.24272 927.76082 943.42902 960.29348 978.40221 997.80509 1018.554 1040.7029 1064.3078Cumulative Cashflow Available for Debt Service 886.63712 1799.8798 2727.6406 3671.0697 4631.3631 5609.7654 6607.5704 7626.1245 8666.8273 9731.1352
DSCR 0.699987 0.7305174 0.7594535 0.7894993 0.8213524 0.855397 0.8919494 0.9313233 0.9738554 1.0199211
AVERAGE DSCR 0.8473256
MINIMUM DSCR 0.699987
Page | 75

INPUTUSER INPUT VALUE UNIT
CUF 21% %PROJECT COST 8627.78 LAKHS INRCAPACITY OF PLANT 10 MW
OUTPUTOUTPUT VALUE UNIT
COST OF GENERATION 7.954200739 INRPROJECT IRR 9% %EQUITY IRR 14% %MIN DSCR 0.70AVERAGE DSCR 0.85LCOE 7.954200739 RS/KWH
Page | 76