deciphering fashion sensibility using community detectiondeciphering fashion sensibility using...
TRANSCRIPT
Deciphering Fashion Sensibility Using CommunityDetection
Sagar Arora∗, Amber Madvariya∗, Divya Alok, Sumit BorarMyntra Designs, Pvt. Ltd
Bengaluru, India
{sagar.arora,amber.madvariya,divya.alok,sumit.borar}@myntra.com
ABSTRACTMyntra is one of the leading fashion e-commerce portal inIndia. As a leading fashion e-tailer with high repeat rates, itis incumbent on us to understand our users better over timeand provide an unparalleled fashion buying experience. Inorder to do that effectively, it is imperative to understandfashion tastes of an individual that underpins an individual’sfashion choices and use it to enhance the e-store experience.In the first part of the paper we have described the method-ology to encode fashion tastes in a product relationship graph(using the clickstream data) and it’s usage in an applicationleading to better user engagement. The latter part detailson partitioning of the graph using Louvain Algorithm andcreation of fashion sensibilities which can be thought of ascommonly occurring fashion tastes over our user cohorts.We show that graph communities are able to capture theuser’s fashion taste better than typical content based homo-geneous communities. As a validation of the approach, wewould be testing the time invariance of fashion sensibilitiesover our users.
1. INTRODUCTIONE-commerce is often considered to have infinite virtual shelfspace; serving millions of products to customers. Specifi-cally, the advent and growth of fashion industry pose strik-ing challenges to render relevant products to user. The rapidpace at which industry is growing, with a huge catalogue ofproducts necessitates personalisation. Users tend to browsesignificantly large set of products before purchasing; espe-cially due to the fact that their fashion need state is not asconcrete and specific as in other domains like movies, books,electronics etc. Hence, personalisation becomes an impor-tant lever to cater to diverse users’ need, allowing for betterproduct discovery and customer experience.
In Myntra, there are around 1.5M distinct products in thecatalogue, and are rapidly increasing everyday. On an av-erage 50 products are browsed before the first click. Every-day millions of users visit the portal and have hundreds ofmillions of list impressions1. This raises a challenge to de-cipher user’s fashion sensibilities to enable better, efficientand faster product discovery via personalisation and driveconversions.
∗Both authors have contributed equally1Cumulative number of views on the catalogued products
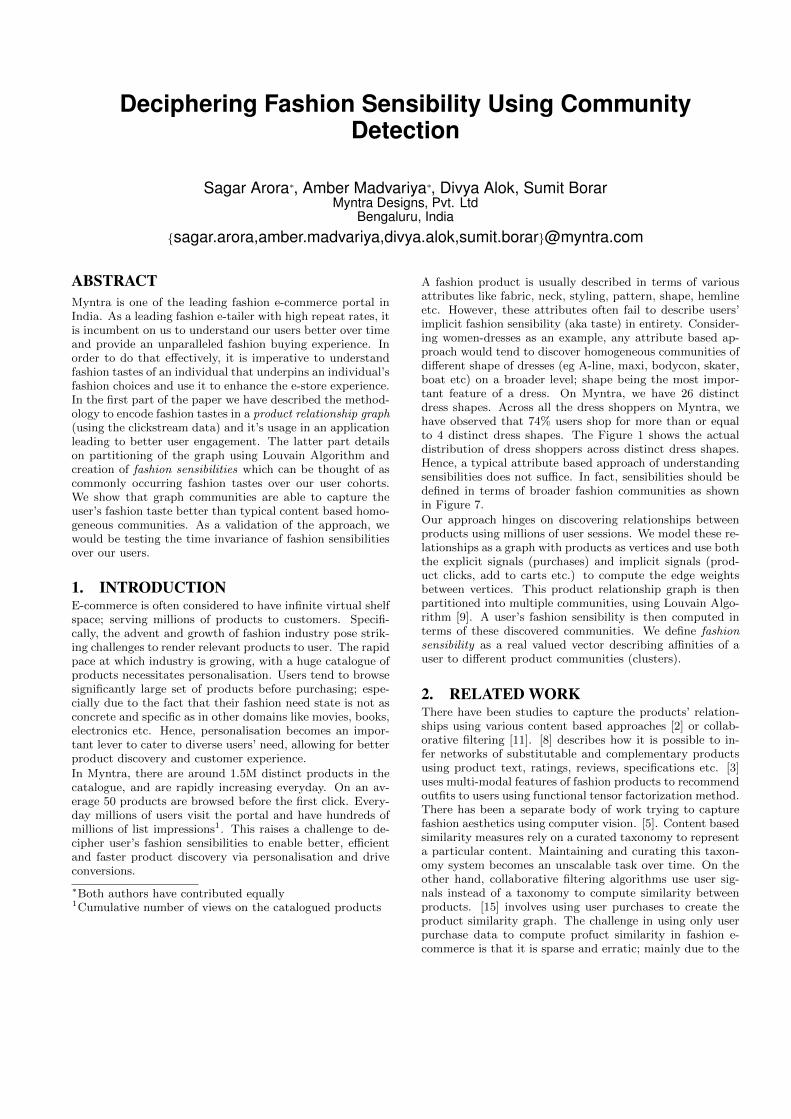
A fashion product is usually described in terms of variousattributes like fabric, neck, styling, pattern, shape, hemlineetc. However, these attributes often fail to describe users’implicit fashion sensibility (aka taste) in entirety. Consider-ing women-dresses as an example, any attribute based ap-proach would tend to discover homogeneous communities ofdifferent shape of dresses (eg A-line, maxi, bodycon, skater,boat etc) on a broader level; shape being the most impor-tant feature of a dress. On Myntra, we have 26 distinctdress shapes. Across all the dress shoppers on Myntra, wehave observed that 74% users shop for more than or equalto 4 distinct dress shapes. The Figure 1 shows the actualdistribution of dress shoppers across distinct dress shapes.Hence, a typical attribute based approach of understandingsensibilities does not suffice. In fact, sensibilities should bedefined in terms of broader fashion communities as shownin Figure 7.
Our approach hinges on discovering relationships betweenproducts using millions of user sessions. We model these re-lationships as a graph with products as vertices and use boththe explicit signals (purchases) and implicit signals (prod-uct clicks, add to carts etc.) to compute the edge weightsbetween vertices. This product relationship graph is thenpartitioned into multiple communities, using Louvain Algo-rithm [9]. A user’s fashion sensibility is then computed interms of these discovered communities. We define fashionsensibility as a real valued vector describing affinities of auser to different product communities (clusters).
2. RELATED WORKThere have been studies to capture the products’ relation-ships using various content based approaches [2] or collab-orative filtering [11]. [8] describes how it is possible to in-fer networks of substitutable and complementary productsusing product text, ratings, reviews, specifications etc. [3]uses multi-modal features of fashion products to recommendoutfits to users using functional tensor factorization method.There has been a separate body of work trying to capturefashion aesthetics using computer vision. [5]. Content basedsimilarity measures rely on a curated taxonomy to representa particular content. Maintaining and curating this taxon-omy system becomes an unscalable task over time. On theother hand, collaborative filtering algorithms use user sig-nals instead of a taxonomy to compute similarity betweenproducts. [15] involves using user purchases to create theproduct similarity graph. The challenge in using only userpurchase data to compute profuct similarity in fashion e-commerce is that it is sparse and erratic; mainly due to the

short life cycle of products and the breadth of the catalogueavailable.
Our earlier work [1] focussed on decoding the fashion con-text using word embeddings [10]. This considers session2 asa proxy to context and embed all fashion attributes, prod-ucts and even sessions to a common space. The approachused was to consider each session as a document and theattributes of all products clicked in the session as words.Skip gram model is trained to learn embeddings of all prod-ucts’ attributes; which are further aggregated (centroid) tolearn embeddings of all products and sessions. Our anotherwork [12] futher attempts to model the impulsive behaviourof users in fashion ecommerce by employing a deep GatedRecurrent Neural Network. While both our previous bodyof work focused more on learning the embeddings and usingthose to decode the user’s context in-session (using only thecurrent session’s context), this work focusses on decipheringthe long-term and broad fashion sensibility of users. Thisworks uses the entire user’s history on platform to modelthe fashion sensibility.
Figure 1: Percentage of users by distinct shapes of dressesbought
3. METHODOLOGYThis section describes the approach to create the productrelationship graph, carve out communities from it and usethese communities to decipher fashion sensibilities of usersas shown in figure 2.
Figure 2: System design showing various components anddata flow
Hereafter, we will use the following terminology.
2Session refers to products clicked by a user within a 30minute window
Let U be the set of all users, P be the set of all products,and A be the set of all categories (eg Men-Tshirts, Men-Jeans, Women-Tops, Women-Dresses etc.). Further, let mbe the number of users and n be the number of products.
Let Eup = {Ec, Eb, Ew, Ep} be the set of all possible events(user-products interactions) where Ec = click event, Eb =add to bag event, Ew = add to wish list event and Ep = pur-chase event. It is worth mentioning that we just consider theevent of highest priority for a given user and product withpriorites defined as:
Ec < Eb < Ew < Ep (1)
We also define the importance score3 of an event e as
we =
1, if e = Ec
∑Ec∑Eb, if e = Eb
∑Ec∑Ew
, if e = Ew
∑Ec∑Ep, if e = Ep
(2)
3.1 Product Relationship GraphWe construct the undirected weighted graph G = (V,E)with V = P and E be the edges denoting the similaritybetween two products. Considering eij as the interactionevent of user Ui with product Pj , Ui is represented by avector ui of length n such that
uij =
we, if eij ∈ Eup
0, otherwise
(3)
We create a sparse user-product matrix of size m×n whereeach row represents a user and each column represents aproduct. On this matrix, we apply non-negative matrix fac-torization [6] to learn the latent d-dimensional embeddingsfor each user (vu) and product (vp). We use these latentembeddings to calculate the edge weight between vertices inthe graph. The edge weight between products pi and pj isthen defined as Eij = vpi · vpj where Eij ∈ E
The product relationship graph G formed after calculatingedge weights contains edges across all categories in A i.e.there are edges both within and across categories. However,it is observed that intra-category edge weights are muchhigher than inter-category edge weights.
3.2 Community DetectionFor the purpose of finding communities within the graph,we remove all inter category edges and preserve only intracategory edges. Hence, the graph G after pruning, splits intosub-graphs Gi = (Vi, Ei) with each sub-graph representinga category and Vi represents the set of products within thatcategory.
Now, for each subgraph Gi, we run louvain algorithm tomaximise the modularity [9] and discover communities S =
3The importance scores are computed using past 1 monthdata of the platform.

{1, 2, ....Si} for ith category. The resulting partitioning en-sures that each product gets mapped to only one category.
3.3 Fashion SensibilityLet C =
⋃S be the set of communities across all categories.
We define fashion sensibility of user Ui as a real valued vec-tor of size | C | with each dimension referring to long termfashion affinity to corresponding community. The affinity iscalculated as cumulative sum of user’s events correspondingto a given community weighted by an exponential time decayfactor (half life as 1 year). Considering all events e = {Eij}as the interactions of each user Ui with products of commu-nity Cj , fashion sensibility F of Ui (for community Cj ) iscomputed as
Fj =∑
eεUi,Cj
w(e)× αt where αt = e−t ln 2365 (4)
t denotes the days elapsed since the event occurred.
4. EXPERIMENTS AND RESULTSFor all our experiments, we use the clickstream data of usersfor the last 1 year. We consider 100M sessions aggregatedper user across 1.5M distinct products from 100 distinct cat-egories. To calculate the values of wEc , wEb , wEw and wEp ,we aggregate the value of Ec, Eb, Ew, Ep over data fromthe past month. From these values and equation 2, we havewEc = 1, wEb = 11.45, wEw = 26.17 and wEp = 66.15.
4.1 Product Relationship GraphWe use the entire 100M sessions to create the product graphG. The graph has 1.5M vertices corresponding to each prod-uct and 93.7M edges. We evaluated the graph qualitativelybased on the inputs from our stylists and also used the graphfor recommending similar products on our platform as shownin Figure 3.
Figure 3: Similar Products Feature on Platform
4.1.1 Qualitative ResultsThis section shows nearest products to different query prod-ucts sorted by the edge weights (within different categories).For each query product, we consider the subgraph Gi of therequired category and inspect the nearest products. Fig-ure 6(a) shows similar dresses and tops to a fashion-forwardedgy dress. Users who prefer an off shoulder dress wouldalso prefer cropped tops. Figure 6(b) shows similar jeansand shirts to a distressed and torned jeans. The similarshirts are either denim/biker shirts or printed. Both the ex-amples reflect that users share a common fashion sensibilityacross categories.
4.1.2 Similar Products A/B Test
Figure 4: Average CTR over a period of 3 weeks
For the A/B test, we render the similar products on theproduct details page of the query product as shown in Fig-ure 3. We test the similar products generated by productrelationship graph against the similar products generatedby attribute similarity in an A/B test. We have consideredattribute based similarity as the baseline approach whereineach product is represented in terms on its attributes andthe relationship is defined in terms of its cosine similaritywith other products. We render similar products generatedby the product relationship graph G to randomly sampled50% of our total traffic and render attribute based similarproducts to the rest of the traffic (both test and control sethave 1M users). We recorded the number of list impressionsand the number of clicks for both the approaches over a pe-riod of three weeks. Figure 4 shows the CTR (click throughrate defined as ratio of clicks to impressions) recorded dur-ing this test period for both the approaches averaged overeach day of the week. From the test, we observe that graphbased similar products show an improvement of 58.4% inaverage CTR over attribute based similar products with ap-value[14] of 6.6*10−6.
4.2 Community DetectionWe computed 100 subgraphs Gi, corresponding to distinctcategories from the product relationship graph G. On eachsubgraph, we ran Louvain algorithm to compute the com-munities. The Table 1 shows the structural properties ofsubgraph, final modularity and number of communities dis-covered for top categories.
We also got the communities validated by fashion stylists.Each community was tagged on various dimensions like prod-uct sensibility (basic, moderate fashion quotient, high fash-

Table 1: Communities of Top Article TypesCategory No.
ofnodes
No. ofedges
No.ofCom-mu-ni-ties
GraphMod-ular-ity
No.of At-tributeClus-ters
Men-Tshirts
111590 9985252 16 0.3998 14
Men-Shirts
102220 16459493 11 0.4015 8
Men-Jeans
27740 6014500 7 0.3009 9
Men-CasualShoes
36003 5729011 9 0.3662 6
Women-Dresses
44909 12934782 6 0.2908 5
Women-Tops
88536 19058706 10 0.3456 7
Women-Kurtas
76494 19329855 10 0.2802 8
Women-Heels
30642 4214382 6 0.2743 4
ion quotient), brands (long tail, emerging, top), occasion(casual , party, work etc), colour palette (light, dark, bright,mixed bag etc) and other special features. The Figure 7shows some sample products from few communities of Women-Dresses. The tags for each community have been manuallycurated by the experts. We can observe that each commu-nity refers to some broader fashion sensibility, rather than acollection of textual attributes like dress shape.
We compare the performance of these communities againstattribute based product groups. We form these productgroups by representing each product, within a category, asa vector of it’s attributes and then applying k-means clus-tering[7] on these product vectors. The product attributesinclude brand, fabric, color, fit, occasion and other physicalattributes like neck, sleeves, pattern etc. We calculate thevalue of k for each article type (shown in the third columnof Table 2) using the elbow method[13]
Figure 5: Distribution of count of communities with nonzero affinities across users in Men-Jeans.
Table 2: Sensibilities for Top Article TypesCategory Average
Com-mu-nitiesperUser
AverageClus-tersperUser
JaccardIndex(Prod-uctGraph)
JaccardIndex(At-tributes)
Men-Tshirts
2.892 4.135 0.3411 0.0988
Men-Shirts 2.362 3.560 0.4690 0.1786Men-Jeans 1.964 2.766 0.5017 0.3087Men-CasualShoes
2.065 1.848 0.4969 0.3264
Women-Dresses
2.661 3.317 0.6394 0.3629
Women-Tops
3.127 5.526 0.4917 0.1923
Women-Kurtas
2.962 3.686 0.4247 0.3446
Women-Heels
2.036 2.139 0.6104 0.3178
4.3 Fashion SensibilityTo compute fashion sensibility, we consider 12 months ofactivity for each user i.e. from 1 January 2016 to 31 De-cember 2016. To analyze the variation in fashion sensibilityof users, we split this 12 month period into 4 quarters foreach user. After filtering users who have ordered less than 2products in each quarter, we are left with 350k users froman initial randomly sampled set of 2M users. We computeusers’ sensibility towards each community within a specificcategory (e.g. Men-Jeans). Figure 5 shows the distributionof count of distinct communities with non zero sensibilitiesacross users in Men-Jeans. We observe that 74.1% of usershave a sensibility in less than or equal to 3 distinct communi-ties. Also from Table 2, where the second column representsthe number of communities with non zero sensibility aver-aged across users for different categories and column threerepresents the same metric for attribute based clusters, it isevident that user sensibilities towards product relationshipgraph based communities are more cohesive as compared toattribute based clusters, with the exception of Men-CasualShoes. Hence, graph based communities are able to capturethe broad fashion taste of users as compared to attributebased clusters.
In another experiment to analyse the coherency in users’sensibilities across time, we compute the set of communitieswith non zero sensibilities for every quarter (for a specificcategory). We denote the set of communities for each quar-ter as {Q1, Q2, Q3, Q4} and calculate the jaccard index[4]between them for each user, using the following equation
J =|Q1 ∩Q2 ∩Q3 ∩Q4||Q1 ∪Q2 ∪Q3 ∪Q4|
(5)
We repeat the above experiment for attribute based groupsand compare the jaccard index obtained from both the ap-proaches. The fourth and fifth column of Table 2 lists thejaccard index for each article type averaged across users forboth product graph communities and attribute based clus-

(a)
(b)
Figure 6: Comparison of adjacent products to a) Edgy, fash-ion forward and off-shoulder dress and b) Distressed andTorn Jeans
(a) Classics
(b) Quirky
(c) Trend-Setters
(d) Sophisticated
(e) Experimental
Figure 7: Sample Communities from Women-Dresses

ters. From the table, it is evident that the jaccard index forproduct graph based communities is higher than attributebased clusters in each category. Hence, graph based com-munities result in sensibilities which are more coherent w.r.ttime; hence allowing better insights into long term user be-haviour.
5. CONCLUSIONSWe showed how we construct the product relationship graphusing collaborative filtering on the entire user history of allusers. The product graph was used in a similar recommen-dation product setting and it showed improvements in keycustomer metrics. We also showed how typical content basedapproaches fail to discover long term fashion sensibilities.Instead, the product relationship graph when partitionedusing Louvain algorithm forms more coherent communitiesaligned to long term fashion sensibilities. We also learnt thefashion sensibilities of users across article types and demon-strated that sensibilities are quite coherent w.r.t. time.
6. REFERENCES
[1] S. Arora and D. Warrier. Decoding fashion contextsusing word embeddings.
[2] M. Balabanovic and Y. Shoham. Fab: content-based,collaborative recommendation. Communications of theACM, 40(3):66–72, 1997.
[3] Y. Hu, X. Yi, and L. S. Davis. Collaborative fashionrecommendation: a functional tensor factorization ap-proach. In Proceedings of the 23rd ACM internationalconference on Multimedia, pages 129–138. ACM, 2015.
[4] P. Jaccard. Etude comparative de la distribution flo-rale dans une portion des alpes et des jura. Bull SocVaudoise Sci Nat, 37:547–579, 1901.
[5] J. Jia, J. Huang, G. Shen, T. He, Z. Liu, H. Luan,and C. Yan. Learning to appreciate the aesthetic ef-fects of clothing. In Proceedings of the Thirtieth AAAIConference on Artificial Intelligence, AAAI’16, pages1216–1222. AAAI Press, 2016.
[6] D. D. Lee and H. S. Seung. Algorithms for non-negativematrix factorization. In Advances in neural informationprocessing systems, pages 556–562, 2001.
[7] S. Lloyd. Least squares quantization in pcm. IEEEtransactions on information theory, 28(2):129–137,1982.
[8] J. McAuley, R. Pandey, and J. Leskovec. Inferring net-works of substitutable and complementary products. InProceedings of the 21th ACM SIGKDD InternationalConference on Knowledge Discovery and Data Mining,KDD ’15, pages 785–794, New York, NY, USA, 2015.ACM.
[9] P. D. Meo, E. Ferrara, G. Fiumara, and A. Provetti.Generalized louvain method for community detectionin large networks. CoRR, abs/1108.1502, 2011.
[10] T. Mikolov, K. Chen, G. Corrado, and J. Dean. Effi-cient estimation of word representations in vector space.arXiv preprint arXiv:1301.3781, 2013.
[11] B. Sarwar, G. Karypis, J. Konstan, and J. Riedl.Item-based collaborative filtering recommendation al-gorithms. In Proceedings of the 10th international con-ference on World Wide Web, pages 285–295. ACM,2001.
[12] A. Tamhane, S. Arora, and D. Warrier. Modelingcontextual changes in user behaviour in fashion e-commerce. In Advances in Knowledge Discovery andData Mining - 21st Pacific-Asia Conference, PAKDD2017, Jeju, South Korea, May 23-26, 2017, Proceed-ings, Part II, pages 539–550, 2017.
[13] R. L. Thorndike. Who belongs in the family? Psy-chometrika, 18(4):267–276, 1953.
[14] B. L. Welch. The generalization ofstudent’s’ problemwhen several different population variances are in-volved. Biometrika, 34(1/2):28–35, 1947.
[15] J. Zheng, X. Wu, J. Niu, and A. Bolivar. Substitutesor complements: another step forward in recommenda-tions. In J. Chuang, L. Fortnow, and P. Pu, editors,EC, pages 139–146. ACM, 2009.