deception in context: coding nonverbal cues, situational ...oro.open.ac.uk/52989/1/52989.pdf · in...
TRANSCRIPT

Deception in Context: Coding Nonverbal Cues, Situational
Variables and Risk of Detection
Abstract
There are many situations in which deception may arise and understanding the behaviors
associated with it are compounded by various contexts in which it may occur. This paper sets
out a coding protocol for identifying cues to deception and reports on three studies, in which
deception was studied in different contexts. The contexts involved manipulating risks (i.e.,
probability) of being detected and reconnaissance, both of which are related to terrorist
activities. Two of the studies examined the impact of changing the risks of deception
detection, whilst the third investigated increased cognitive demand of duplex deception tasks
including reconnaissance and deception. In all three studies, cues to deception were analyzed
in relation to observable body movements and subjective impressions given by participants.
In general, the results indicate a pattern of hand movement reduction by deceivers, and
suggest the notion that raising the risk of detection influences deceivers’ behaviors.
Participants in the higher risk condition displayed increased negative affect (found in
deceivers) and tension (found in both deceivers and truth-tellers) than those in lower risk
conditions.
Keywords: nonverbal cues, deception detection, cognitive load, reconnaissance
Manuscript
1 2 3 4 5 6 7 8 9 10 11 12 13 14 15 16 17 18 19 20 21 22 23 24 25 26 27 28 29 30 31 32 33 34 35 36 37 38 39 40 41 42 43 44 45 46 47 48 49 50 51 52 53 54 55 56 57 58 59 60 61 62 63 64 65

1. INTRODUCTION
Behavioral cues related to deception include both verbal and nonverbal markers (DePaulo et
al., 2003; Vrij, 2008) exhibited by deceivers who deliberately conceal their intent (e.g.,
Kirchhuebel & Howard, in press; Lawson et al., in press). The study of these factors is
complex and compounded by the various contexts in which these behaviors may occur (Vrij,
2008), as well as individual differences (e.g., personality traits) that may influence
fundamental psychological processes of deception (Vrij, 2008) and perceptions of risk of
being detected (Rhodes & Pivik, 2011). Previous research has revealed three fundamental
processes of deception: emotion, cognitive effort, and attempted behavioral control (Vrij,
2008; Zuckerman et al., 1981). Nonverbal and verbal deception cues are linked to these
psychological processes underlying acts of deception.
While it has been argued that nonverbal cues are not as stable as some verbal indicators
(e.g., Vrij & Granhag, 2012), cues presented by deceivers are determined to some extent by
the context in which they occur. For example, a terrorist may not have to speak to anyone
when passing through a public space, thus only nonverbal cues may be available to be
assessed by others. We considered that the contextual variables such as risk of being detected
could not only influence decisions of deception (Sip et al., 2010), but also alter the cues
presented by deceivers. Given the possible effect of contextual variables, we conducted three
studies in different deception contexts (see details in section 1.2). In addition, research in the
field of deception cues is still at the exploratory stage and the current approaches point
towards research assessing deception cues from different channels (DePaulo & Bond, 2012;
Porter & ten Brinke, 2010). With this in mind, it is useful to gain further understanding of
nonverbal cues via the present research that focuses on cues that are observable to other
1 2 3 4 5 6 7 8 9 10 11 12 13 14 15 16 17 18 19 20 21 22 23 24 25 26 27 28 29 30 31 32 33 34 35 36 37 38 39 40 41 42 43 44 45 46 47 48 49 50 51 52 53 54 55 56 57 58 59 60 61 62 63 64 65
people, so as to assess what nonverbal deception cues could be spotted where detailed
behavioral analyses are not feasible. Such cues should ideally be observed from a distance, as
it is not always possible to approach suspects in public crowded spaces.
It has been argued that no single cue can reliably identify deception due to the lack of
developed coding schemes that have generated poor results in previous studies (Vrij, 2008).
Therefore, in the current research, a coding protocol (detailed in section 2) was developed as
an elaboration of a previous scheme related to cues identified across different sections of the
body (Vrij et al., 1996). Impressions given by deceivers based on the fundamental processes
of deception (e.g., negative affect in relation to negative emotions) were also coded and
analyzed.
1. 1. Psychological Processes Underlying Deception
In the literature, there are many nonverbal cues related to the underlying psychological
processes of deception. Some are negative emotions such as fear or guilt, whilst others are
positive emotions, such as excitement, relief and pride (Ekman, 1992; Ekman & Frank, 1993;
Porter & ten Brinke, 2008). There are macro negative emotional cues such as reduced hand
and arm movements during speech (Vrij, 2008) and positive cues such as smiling (Memon et
al., 2003).
The process of lying may require extra cognitive effort as liars suppress true
information whilst forming lies and remembering false information (Langleben et al., 2002;
Spence et al., 2001; Vrij et al., 2008; Walczyk et al., 2005). Liars also need to monitor their
own behavior (Vrij & Mann, 2005) and their target’s reactions (Burgoon et al., 2008), which
places a high demand on the liar’s cognitive processing (Carrión et al., 2010). Visible cues to
1 2 3 4 5 6 7 8 9 10 11 12 13 14 15 16 17 18 19 20 21 22 23 24 25 26 27 28 29 30 31 32 33 34 35 36 37 38 39 40 41 42 43 44 45 46 47 48 49 50 51 52 53 54 55 56 57 58 59 60 61 62 63 64 65
cognitive effort are, for instance, fewer hand and/or arm movements (Ekman, 1997; Memon
et al., 2003), less blinking (Bagley & Manelis, 1979), more gaze aversion (Ekman, 1997;
Doherty-Sneddon & Phelps, 2005). Attempted behavioral control varies at an individual level
and can be influenced by emotional demands and cognitive load. However, deliberate
behavioral self-regulation can sometimes make a liar’s behavior appear contrived, tense, and
over-controlled (DePaulo & Kirkendol, 1989; Vrij, 2008).
1. 2. Cues to Deception and Contextual Variables
Cues related to the fundamental processes of emotion, cognitive effort, and attempted
behavioral control are not consistently presented by liars. For example, fewer hand or arm
movements can be an indication of cognitive overload (Ekman, 1997; Memon et al, 2003),
negative emotions (Vrij, 2008), or an intention to deceive (Lawson et al, in press). Therefore,
it is widely believed that no single cue can reliably identify deception (DePaulo et al., 1985;
Vrij, 2008; Vrij et al., 2001). In addition, according to Interpersonal Deception Theory (IDT)
(Buller & Burgoon, 1996) liars adjust their behavior and may try to avoid ‘dishonest’
behaviors (Burgoon et al., 1996), which increases the difficulty to spot deception cues
reliably. The inconsistencies of the psychological processes involved in deception supports
the view that deception cues may vary in different contexts (Vrij, 2008). Therefore, we
consider context as a crucial factor in detecting deception cues. We investigated deceptive
behavior in different forms and situations so as to broaden the established understanding of
nonverbal deception cues.
Given that context can determine deceivers’ behavior, we investigated deception-
related behaviors in settings that are relevant in the fields of terrorism prevention, criminal
1 2 3 4 5 6 7 8 9 10 11 12 13 14 15 16 17 18 19 20 21 22 23 24 25 26 27 28 29 30 31 32 33 34 35 36 37 38 39 40 41 42 43 44 45 46 47 48 49 50 51 52 53 54 55 56 57 58 59 60 61 62 63 64 65
investigation and promotion of public safety. The present research sought to investigate
situations both inside and outside traditional laboratory settings, where participants usually
remain seated throughout experiments with an interviewer. Three studies were designed to
assess deception in different contexts:
Lying in front of peers in a semi public space (a classroom).
Lying during interaction with another person in a private space (in a laboratory).
Lying and reconnaissance whilst passing through a security control point in a public
space (the corridor of a building).
The first goal of the present research was to investigate observable nonverbal cues in relation
to deception. We did not target specific cues, but tested a number of nonverbal body
movements across body sections, as observed by people using the coding protocol, as
specified in section 2. This is due to the fact that nonverbal cues are unstable and inconsistent
across contexts. In addition, we investigated impressions given by deceivers, based on the
fundamental processes of deception.
From the above approach, four general hypotheses assessing nonverbal cues related to
deception were proposed. Hypothesis 1, deceivers will present different amounts of
observable body movements, as compared to truth-tellers. Hypothesis 2, impressions related
to emotional process of deception (e.g., negative and/or positive affect) will be presented by
deceivers as compared to truth-tellers. Hypothesis 3, impressions related to cognitive effort of
deception will be presented by deceivers as compared to truth-tellers. Hypothesis 4,
impressions related to attempted behavioral control processes of deception will be presented
by deceivers as compared to truth-tellers.
1 2 3 4 5 6 7 8 9 10 11 12 13 14 15 16 17 18 19 20 21 22 23 24 25 26 27 28 29 30 31 32 33 34 35 36 37 38 39 40 41 42 43 44 45 46 47 48 49 50 51 52 53 54 55 56 57 58 59 60 61 62 63 64 65
Deception cues can be influenced by contextual variables such as the degree of stakes
of deception (i.e., the extent of the positive or negative consequence of deception) (e.g.,
Hartwig et al., 2006; ten Brinke & Porter, 2012) and task complexity (Lancaster et al., 2012;
Vrij et al., 2011). Contextual variables can introduce variance with regard to specific
deception cues. When faced with higher stakes, liars tend to illustrate more behavioral
reductions and signs of increased cognitive activity (i.e., they appear to be ‘thinking hard’)
(Porter & ten Brinke, 2010; Vrij & Mann, 2001). Considering that deceiving is often a risk-
taking behavior, factors that influence it could be related to those that influence risk-taking
behavior as well. According to cognitive psychologists, people who engage in risk-taking
behaviors do not only consider the extent of the negative outcome if they are detected (in
relation to stakes), but also weigh the probability of being detected (Breakwell, 2007; Sip et
al., 2010). The probability of deception detection is therefore important as well as the extent
of the consequences of deception (i.e., stakes). Both of these may influence the involvement
of the underlying psychological processes of deception such as fear and cognitive effort. In
the present paper, we refer to the risk of deception detection in describing the probability of
being detected. Therefore, our research manipulated the degree of risk in order to assess how
it might influence deception cues.
In Study 1, this was achieved through the introduction of evaluated and non-evaluated
deception conditions, since introducing evaluation of truthfulness increases the possibility of
being detected. In Study 2, the degree of risk was manipulated by altering the evaluators: that
is, evaluations performed by security staff were designed to elicit a higher level of risk of
deception detection, compared to evaluations performed by a lay person. Given the
discussion above, we proposed that higher risks might result in a higher extent of
1 2 3 4 5 6 7 8 9 10 11 12 13 14 15 16 17 18 19 20 21 22 23 24 25 26 27 28 29 30 31 32 33 34 35 36 37 38 39 40 41 42 43 44 45 46 47 48 49 50 51 52 53 54 55 56 57 58 59 60 61 62 63 64 65

involvement of psychological processes. We therefore propose another two general
hypotheses (regardless of specific cues) in testing the effect of risks of deception detection.
Hypothesis 5, there will be a greater extent of observable nonverbal cue(s) (either body
movement(s) and/or impression(s)) exhibited in deceivers when the risk of detection is
higher, compared to lower risk levels. Hypothesis 6, the extent of such observable cues will
be positively correlated with the level of risk of deception detection; the higher the risk the
more cues will be observed.
Deceiving does not usually happen as a single event but often entails multiple
deceptions resulting in increased cognitive effort to remember scripts, control behavior and
monitor the target’s responses (Vrij, 2008). It has been found that increasing cognitive
loading can elicit deception cues (e.g., Lancaster et al., 2012; Vrij et al., 2009). In order to
investigate this, in Study 3, a duplex lying and reconnaissance task was designed to provide
higher levels of task difficulty than single deception tasks. From this, a final hypothesis was
developed. Hypothesis 7, deceivers performing a reconnaissance task in addition to lying will
display more observable nonverbal cues than deceivers performing only one task.
Demographic characteristics (age, gender, and cultural differences) related to individual
differences may influence nonverbal (Vrij, 2008) and risk taking behavior (Byrnes et al.,
1999; Rhodes & Pivik, 2011). They are not the focus of this study, but they were included as
covariates in the data analysis so as to prevent a significant influence on the results.
2. A CODING PROTOCOL FOR IDENTIFYING CUES TO DECEPTION
Across all three studies, behavior data were collected and edited into video clips. There were
337 clips in total (32 clips in Study 1, 210 clips in Study 2, and 95 clips in Study 3) that were
1 2 3 4 5 6 7 8 9 10 11 12 13 14 15 16 17 18 19 20 21 22 23 24 25 26 27 28 29 30 31 32 33 34 35 36 37 38 39 40 41 42 43 44 45 46 47 48 49 50 51 52 53 54 55 56 57 58 59 60 61 62 63 64 65

then assessed using a coding system based on the nonverbal cues literature (DePaulo, et al,
2003; Vrij, et al., 1996; Vrij, 2008) (Table I). The specific movements coded were slightly
different according to study settings (e.g., participants were seated in Study 2, but were
standing/walking in Studies 1 and 3). Hand and arm data were scrutinized in more detail
(Table II).
TABLE I ABOUT HERE
TABLE II ABOUT HERE
Three raters (MSc and PhD students in social sciences at a UK university) subjectively coded
10% of the video clips, taken as a random sample, for inter-rater reliability test purposes. A
selection criterion for inter rater reliability (Cronbach’s alpha > .70) was applied across
Studies 1, 2 and 3 for each body section and impression category. Since adequate values for
inter-rater reliability tests were obtained, numerical data obtained from the three raters were
averaged and combined under each item with the remaining video clips that were then rated
by two of the three raters. The raters were blind to the experimental conditions and
hypotheses and coded the frequency and duration of movements across the body sections
using separate 7-point scales ranging from 1 = exists (frequency) or brief (duration) to 7 =
always (frequency) or whole session (duration).
As introduced in sections 1 and 1.2, detailed categorizations of impressions given by
participants were also coded (Table III). In Studies 1 and 2, raters coded impressions elicited
by participants in the video using a 5-point Likert scale ranging from 1 = not at all to 5 = to a
great extent. The rating scheme was extended by using a 7-point scale across the same
1 2 3 4 5 6 7 8 9 10 11 12 13 14 15 16 17 18 19 20 21 22 23 24 25 26 27 28 29 30 31 32 33 34 35 36 37 38 39 40 41 42 43 44 45 46 47 48 49 50 51 52 53 54 55 56 57 58 59 60 61 62 63 64 65
descriptors in Study 3 to increase the sensitivity of the data.
TABLE III ABOUT HERE
Two filtering steps were performed on the dependent variables before data analyses were
conducted:
In order to filter out movements that seldom occurred in the participant pool,
descriptive statistics were obtained and movement variables that were shown by fewer
than 30% of the participants were excluded from the data analysis.
As the cut-off point filtered out different variables across the three studies, the
common items of dependent variables in the three studies were retained.
A series of Analysis of Covariance (ANCOVA) were conducted within each study for
movement and impression variables. Bonferroni corrections were employed to reduce the
chance of Type I errors (Field, 2005) and demographic information including age, gender,
nationality (western and non-western) were assessed as covariates. The missing values in
body movement variables were coded as ‘0’, representing the ‘absent’ status of movements.
3. STUDY 1: LYING IN FRONT OF PEERS
3.1. Method
3.1.1. Participants.
For this study, 34 University students were recruited. Participants with invalid data
(e.g., incomplete/unclear video footages) were excluded. Valid data from 32 participants (17
1 2 3 4 5 6 7 8 9 10 11 12 13 14 15 16 17 18 19 20 21 22 23 24 25 26 27 28 29 30 31 32 33 34 35 36 37 38 39 40 41 42 43 44 45 46 47 48 49 50 51 52 53 54 55 56 57 58 59 60 61 62 63 64 65

males, 15 females, Mage = 22.86 years, SD = 3.89) were included in the analyses. To
participate, students were required to have normal, or corrected to normal, vision and hearing,
normal ability of body movement and communication.
3.1.2. Apparatus.
The experiment, conducted by three researchers, took place in a University lecture
room. An envelope for each participant contained an instruction sheet, an evaluation sheet,
and a token. The token was a small card with one of nine possible combinations of its
features based on three colors (e.g., red, blue or yellow) and three shapes (e.g., heart, square
or triangle). A short self-rating manipulation check questionnaire assessing e.g., levels of
nervousness, perception of levels of task difficulty and motivation, and a demographic
information completion sheet (e.g., age, gender and nationality) were included. Two high-
definition video cameras were used to record behaviors. Each participant received a
confectionery reward for completing the study.
3.1.3. Design and procedure.
In this study the independent variables of deception and degree of risks were
manipulated in a 2 (veracity) × 2 (risk level) between-subjects design and participants were
randomly assigned to the four groups. Veracity was manipulated by instructing participants to
deceive or tell truth about the color and shape of the token they received. Risk levels were
manipulated by whether or not asking peers of the participants to evaluate whether the
participants were being deceptive about the token they had. Upon receiving an envelope
containing task instructions and a token, participants were instructed not to expose the token
1 2 3 4 5 6 7 8 9 10 11 12 13 14 15 16 17 18 19 20 21 22 23 24 25 26 27 28 29 30 31 32 33 34 35 36 37 38 39 40 41 42 43 44 45 46 47 48 49 50 51 52 53 54 55 56 57 58 59 60 61 62 63 64 65

during the experiment. Each participant stood at the front of the classroom and gave a short
presentation to the audience, including their student number, name, a curious fact about
themselves (e.g., “I run five miles every day”) and a description of their token containing its
color and shape (e.g., “I have a blue triangle”). The content of the presentation, as related to
participants themselves, was designed with the purpose of enhancing motivation to perform
well by introducing self identity-related tasks (DePaulo et al., 2003).
The group ‘deceiver & evaluated’ (DE) lied about the token and were evaluated by their
peers. Then the group ‘truth-teller & evaluated’ (TE) performed the task and did not lie about
the token but were also evaluated by their peers. Participants in these two groups were told
that the overall group ranking was to be announced later to the class members; however, this
was designed purely as a mechanism to manipulate the level of risk involved in the evaluated
presentations. Groups of ‘deceiver & non-evaluated’ (DN) and ‘truth-teller & non-evaluated’
(TN) participated similarly as DE and TE but were not evaluated by their peers. After their
presentations, participants completed the questionnaire pack together with the manipulation
check questions and then received their confectionery reward for their participation.
Behavioral data were recorded using video cameras and transferred into numerical data
through the coding processes.
3.2. Results
ANCOVAs were conducted for all dependent variables, Bonferroni corrections were
performed (six tests ran in total, Corrected α = .01). Age, gender and nationality
(western/non-western) were retained as covariates. Based on the coding of video data, the
results of ANCOVAs for the significant dependent variables are presented in Table IV. Inter
1 2 3 4 5 6 7 8 9 10 11 12 13 14 15 16 17 18 19 20 21 22 23 24 25 26 27 28 29 30 31 32 33 34 35 36 37 38 39 40 41 42 43 44 45 46 47 48 49 50 51 52 53 54 55 56 57 58 59 60 61 62 63 64 65

rater reliability for the significant dependent variables in the overall coding are Cronbach’s α
= .70 (hand holding); and α = .64 (hand/arm).
TABLE IV ABOUT HERE
By controlling for the covariates including age, gender and nationality (see details in Table
IV), a significant effect of veracity emerged for holding of hands: F(1, 21) = 4.75, p < .05, ηp2
= .18, with Cohen’s d = 0.83. This illustrated that hand holding was higher for liars (M =
4.74, SE = 1.13) than truth-tellers (M = 1.36, SE = 1.05). Holding of hands was classified
under hand/arm movements and indicated movement reduction and moderately tense
behavior (Mehrabian, 1968). These findings support Hypothesis 1, that deceivers would
present different amounts of observable body movements, when compared to truth-tellers.
There was a trend towards significance for hand/arm movements for the evaluation
variable (risk of detection): F(1, 21) = 4.29, p = .051, ηp2
= .17, Cohen’s d = -0.80. The
evaluation condition yielded fewer hand/arm movements (M = 2.19, SE = 1.12) than the non-
evaluation condition (M = 5.90, SE = 1.39). As decreased limb movement is one of the
recognized cues to deception, this finding leads to further consideration of Hypothesis 5, that
there will be a greater extent of observable nonverbal cue(s) (either body movement(s) and/or
impression(s)) exhibited in deceivers when the risk of detection is higher, compared to lower
risk levels. Nonetheless, the finding of a trend of effect for risk across veracity conditions
indicates that the same magnification effect applies for truth-tellers as well. No covariates
were statistically significant in relation to level of risk.
1 2 3 4 5 6 7 8 9 10 11 12 13 14 15 16 17 18 19 20 21 22 23 24 25 26 27 28 29 30 31 32 33 34 35 36 37 38 39 40 41 42 43 44 45 46 47 48 49 50 51 52 53 54 55 56 57 58 59 60 61 62 63 64 65

3.3. Discussion
This study revealed that risk (i.e., probability of deception detection) might have a similar
effect as deception in altering nonverbal behavior (e.g. a reduction in hand movements). The
finding suggests that not only the stakes (i.e., the extent of consequences of deception) as
found in previous studies, but also risks (i.e., the possibility of being detected) might magnify
the effect on deceivers’ behaviors. However, similar to stakes, enhancing risks can lead to
misjudgment as to whether or not someone is lying, since truth-tellers under higher risks can
present similar reduced hand movements as deceivers. In addition, it is unknown whether
there are individual differences in perceiving risk levels of deception detection. To further
understanding these questions, Study 2 used a within-subjects design to compare behavior
exhibited by the same person across different conditions of veracity and risks of deception
detection. Different levels of risks (low, moderate, and high) were assessed to investigate if
the extent of cues presented by the same individual were affected by increased risk levels.
4. STUDY 2: LYING DURING INTERACTION WITH ANOTHER PERSON
4.1. Method
4.1.1. Participants.
For this study, 40 University students were recruited. Participants with invalid data
(e.g., incomplete/unclear video footages) were excluded. Valid data from 35 participants (7
males, 28 females, Mage = 27.40 years, SD = 7.91) were included in the analyses. To
participate, students were required to have normal, or corrected to normal, vision and hearing,
normal ability of body movement and communication.
1 2 3 4 5 6 7 8 9 10 11 12 13 14 15 16 17 18 19 20 21 22 23 24 25 26 27 28 29 30 31 32 33 34 35 36 37 38 39 40 41 42 43 44 45 46 47 48 49 50 51 52 53 54 55 56 57 58 59 60 61 62 63 64 65

4.1.2. Apparatus.
Each participant received a folder containing either one article (about education) or two
articles (one about education and another about deception). The same covariate and
manipulation check questions were used from Study 1. Two high-definition video cameras
were used to record behaviors. This study was conducted by three researchers, two of whom
took on the roles of confederates (e.g., ‘student’ and ‘security guard’). Each participant
received a £5 voucher as well as a confectionery reward for completing the study.
4.1.3. Design and Procedure.
In this study the independent variables of deception and risk were manipulated in a 2
(veracity) × 3 (level of risk) within-subjects design, and the assignment of the six conditions
was counterbalanced. Participants either deceived or told truth about the articles they had in
each condition. The level of risk of deception detection was manipulated with the
confederates engaging in face-to-face evaluations regarding the veracity of participant
statements about the article. There are three levels of the risk variable, the lowest, moderate,
and highest risk of being detected.
In the deception conditions participants were provided with a folder containing two
written articles and instructed to conceal and lie about having the deception article throughout
the tasks. The deception article gave a non-detailed introduction of deception. It did not
include any information about nonverbal cues of deception, in order to prevent influencing
participants’ nonverbal behavior. Participants were first left alone in the room to read the
articles whilst their behavior was video recorded (condition ‘deceiving & alone’ = lowest
risk). This condition involved no social interaction and therefore there was the lowest risk of
1 2 3 4 5 6 7 8 9 10 11 12 13 14 15 16 17 18 19 20 21 22 23 24 25 26 27 28 29 30 31 32 33 34 35 36 37 38 39 40 41 42 43 44 45 46 47 48 49 50 51 52 53 54 55 56 57 58 59 60 61 62 63 64 65
being detected amongst the three levels of the risk variable. In this section, participants’
behavior was analyzed so as to identify whether they demonstrated any specific cues in
relation to deception. This was based on previous work (Lawson et al., in press), which
indicated that individuals intending to lie would behave differently to those intending to tell
the truth. Although no statement was involved, deceivers were experiencing concealed
intention of deceiving whereas truth-tellers were not. After five minutes, a confederate who
assumed the appearance of a student entered the room and interacted with the participant
(condition ‘deceiving & layperson’ = moderate risk). During this phase of the experiment the
participant was encouraged to act normally and not to draw attention to him/herself or raise
suspicions of having the deception article. After five minutes the student left and a ‘security
guard’ entered the room and conducted a mock security interview (condition ‘deceiving &
security guard’ = highest risk). The participants were instructed that the guard was skilled in
deception detection and had the authority to remove them from the study if they were caught
lying. For experimental consistency, the guard interviewed all participants and purposefully
‘failed’ to detect any deceptive cues in any participants.
In the truth-telling conditions (‘truth-telling & alone’, ‘truth-telling & layperson’, and
‘truth-telling & security guard’) the task was identical to the deception conditions except that
participants did not have the deception article and thus did not have to lie about it to the
confederates. Since truth-tellers would still be evaluated in two of the sections, we
intentionally removed the deception article from what they would be reading so as to prevent
the impact of the deception contents on truth-tellers (e.g., the deception contents might lead
to task-irrelevant nervousness while being asked about deception during the security
interview). The time between the sessions ranged from one to two minutes. After each set of
1 2 3 4 5 6 7 8 9 10 11 12 13 14 15 16 17 18 19 20 21 22 23 24 25 26 27 28 29 30 31 32 33 34 35 36 37 38 39 40 41 42 43 44 45 46 47 48 49 50 51 52 53 54 55 56 57 58 59 60 61 62 63 64 65
three conditions participants completed the manipulation check questions. They then
completed the covariate battery followed by a debrief session and were given a £5 voucher
and an extra confectionery reward for their participation. Behavioral data were recorded
using video cameras and transferred into numerical data through the coding processes.
4.2. Results
Repeated-measures ANCOVAs were conducted for all dependent variables, Bonferroni
corrections were performed (12 tests ran in total, Corrected α = .00). Covariates of age,
gender and nationality (western/non-western) were retained in the tests. The results of
ANCOVAs for the significant dependent variables are presented in Table V. Inter rater
reliability for the significant dependent variables in the overall coding are Cronbach’s α = .64
(hand holding); α = .65 (negative affect); and α = .81 (tension).
TABLE V ABOUT HERE
By controlling for the covariates including age, gender and nationality the results revealed no
significant effects of deception for either movement or impression variables. Hand holding
movements were significant for risks, F(2, 56) = 3.46, p < .05, ηp2
= .11. The risk level 1(i.e.,
alone in room) (M = 3.66, SE = 0.27), 95% CI [3.10, 4.22] and level 2 (i.e., with layperson)
(M = 5.93, SE = 0.71), 95% CI [4.47, 7.38]; and level 3 (i.e., with confederate security guard)
(M = 7.23, SE = 0.72), 95% CI [5.76, 8.70]. The results showed a significant main effect of
risks on hand holding, where such movements were increased in the two conditions with
social interactions (level 2 & level 3), compared to the condition when participants were
1 2 3 4 5 6 7 8 9 10 11 12 13 14 15 16 17 18 19 20 21 22 23 24 25 26 27 28 29 30 31 32 33 34 35 36 37 38 39 40 41 42 43 44 45 46 47 48 49 50 51 52 53 54 55 56 57 58 59 60 61 62 63 64 65

alone (level 1). However, the difference between level 2 and level 3 did not reach the
significance level, according to Bonferroni corrected post-hoc tests (paired t-test).
A significant main effect of risks emerged in the impression of negative affect
(unpleased impression), F(2, 56) = 4.24, p < .05, ηp2
= .13. There was greater negative affect
associated with higher risk levels with 95% CI [1.55, 1.85] for level 1 (M = 1.70, SE = 0.07),
95% CI [1.67, 1.98] for level 2 (M = 1.82, SE = 0.08), and 95% CI [1.84, 2.21] for level 3 (M
= 2.03, SE = 0.09). The subsequent Bonferroni corrected post-hoc test showed a significant
difference of negative affect between level 1 and level 3, t(34) = -3.10, p < .01; and level 2
and level 3, t(34) = -2.60, p = .01. However, such significant difference was only found in
deceivers and even then not between level 2 and level 3. The impression of tension was
mainly influenced by risks as well, F(1.63, 45.52) = 3.92, p < .05, ηp2
= .12, level 1(M = 2.56,
SE = 0.06), 95% CI [2.43, 2.69], level 2 (M = 2.78, SE = 0.10), 95% CI [2.58, 2.97], and level
3 (M = 3.18, SE = 0.06), 95% CI [3.05, 3.30]. Tension impression was significantly different
between level 1 and level 3, as well as level 2 and level 3. The subsequent Bonferroni
corrected post-hoc tests showed a significant difference of tension impression between level 1
and level 2, t(34) = -3.37, p < .01, in truth-tellers but not in deceivers.
These findings of the main effect of risk partially support Hypothesis 5, that there will
be a greater extent of observable nonverbal cue(s) (either body movement(s) and/or
impression(s)) exhibited in deceivers when the risk of detection is higher, compared to lower
risk levels. The significant difference in the extent of nonverbal cues between levels of risks
was not found in all comparisons. Therefore the results did not completely support
Hypothesis 6, that the extent of such observable cues would be positively correlated with the
level of risk of deception detection; the higher the risk the more cues that would be observed.
1 2 3 4 5 6 7 8 9 10 11 12 13 14 15 16 17 18 19 20 21 22 23 24 25 26 27 28 29 30 31 32 33 34 35 36 37 38 39 40 41 42 43 44 45 46 47 48 49 50 51 52 53 54 55 56 57 58 59 60 61 62 63 64 65

Notably, although the findings suggest that higher risks can lead to increased nonverbal cues
presented by deceivers than in lower risk conditions, a main effect of risk combines both
deceivers and truth-tellers.
4.3. Discussion
Study 2 revealed a main effect of risk that led to reduction in hand movements (hand holding
is categorized as a reduced hand movement). Hand movements significantly decreased while
participants engaged in interaction with confederates compared with when they were alone.
However, it is possible that engaging in conversation changed participants’ hand holding
movements irrespective of the risk variable. Study 2 also showed that impressions of negative
affect and tension increases under higher risks. Deceivers showed significant increased
negative affect in the highest risk condition, compared with the two lower risk conditions.
Truth-tellers did not show a similar pattern of negative affect. In addition, there was also a
significant increase in extent of tension impression in the highest risk condition. However,
both deceivers and truth-tellers were influenced, suggesting that risk has strong influences on
tension impression regardless of deception. The difference of such nonverbal cues was not
significantly different between risk level 1 and level 2. However, the highest risk of detection
(i.e., evaluated by a security confederate) did significantly influence nonverbal cues,
compared to the other two lower risk levels.
Given the literature suggesting that increased cognitive loading can enhance the
detectability of deception indicators (Vrij & Granhag, 2012), Study 3 was designed to assess
dual deception tasks in order to increase cognitive loading in individuals. This was done to
investigate if cognitive loading can be more effective in magnifying the difference between
1 2 3 4 5 6 7 8 9 10 11 12 13 14 15 16 17 18 19 20 21 22 23 24 25 26 27 28 29 30 31 32 33 34 35 36 37 38 39 40 41 42 43 44 45 46 47 48 49 50 51 52 53 54 55 56 57 58 59 60 61 62 63 64 65

deceivers and truth-tellers than risk of detection. The tasks took the form of simulating a
security identity check as well as a reconnaissance task that could be conducted by terrorists,
in order to investigate cues that could be observed in such contexts.
5. STUDY 3: LYING AND RECONNAISSANCE WHILST PASING THROUGH A
SECURITY CONTROL POINT
5.1. Method
5.1.1. Participants.
For this study, 100 University students were recruited. Participants with invalid data
(e.g., incomplete/unclear video footages) were excluded. Valid data from 94 participants (22
males, 72 females, Mage = 26.53 years, SD = 8.66) were included in the analyses. To
participate, students were required to have normal, or corrected to normal, vision and hearing,
normal ability of body movement and communication.
5.1.2. Apparatus.
The experiment was conducted in the corridor of a university main building. Each
participant placed an adhesive label over their name on their university ID card. The same
covariate and manipulation check questions were used from Study 1 and Study 2. Two high-
definition video cameras were used to record behaviors. This study was conducted by three
researchers, one of whom took on the role of a ‘security guard’. Each participant received a
£5 voucher as well as a confectionery reward for completing the study.
5.1.3. Design and Procedure.
1 2 3 4 5 6 7 8 9 10 11 12 13 14 15 16 17 18 19 20 21 22 23 24 25 26 27 28 29 30 31 32 33 34 35 36 37 38 39 40 41 42 43 44 45 46 47 48 49 50 51 52 53 54 55 56 57 58 59 60 61 62 63 64 65

In this study the independent variables of duplex deception were manipulated in a 2
(deception about identity) × 2 (reconnaissance) between-subjects design. Participants were
randomly assigned to one of the four groups. Deception about identity was manipulated by
instructing participants to either lie or tell the truth about their name. The reconnaissance task
was manipulated by instructing participants to either covertly memorize objects in the
environment (e.g., how many chairs in the room) or not to memorize objects. The context of
this study aimed to simulate a public security checkpoint scenario and typical reconnaissance
activities conducted in public spaces.
Participants were asked to pass through a security door set up at the entrance of an
office. While monitoring the security door a confederate security guard asked for and
checked each person’s name on the label of their student ID card. Groups of ‘deceiver &
reconnaissance’ and ‘deceiver & no-reconnaissance’ put a fake name on the label of their
student ID card and lied about their real names. These groups were informed that they would
lose entitlement to an extra reward if they were caught lying; this was not applicable for the
truth tellers. For experimental consistency, the guard interviewed all participants and
purposefully ‘failed’ to detect deceptive cues in any participants. The ‘deceiver &
reconnaissance’ group also covertly memorized the notable objects while passing through the
space. After completing the deception task, they were required to identify observed objects on
a list and then complete the questionnaire pack.
The ‘truth-teller & reconnaissance’ group followed the same process but told truth
about their names. The ‘truth-teller & no-reconnaissance’ group neither lied about their
names nor performed the reconnaissance task. When the study was completed, the researcher
debriefed and rewarded each of the participants with a £5 voucher and an extra confectionery
1 2 3 4 5 6 7 8 9 10 11 12 13 14 15 16 17 18 19 20 21 22 23 24 25 26 27 28 29 30 31 32 33 34 35 36 37 38 39 40 41 42 43 44 45 46 47 48 49 50 51 52 53 54 55 56 57 58 59 60 61 62 63 64 65

for their participation. Behavioral data were recorded using video cameras and transferred
into numerical data through the coding processes.
5.2. Results
ANCOVAs were conducted for all dependent variables, and Bonferroni corrections
were performed (six tests ran in total, Corrected α = .01). Age, gender and nationality
(western/non-western) were retained as covariates in the tests. The results of ANCOVAs for
the significant dependent variables are presented in Table VI. Inter rater reliability for the
significant dependent variables in the overall coding are Cronbach’s α = .84 (trunk); α = .94
(hand/arm); α = .88 (positive affect); and α = .74 (eye/eye brow).
TABLE VI ABOUT HERE
By controlling for the covariates including age, gender and nationality there was a trend
towards significance in deception with trunk movements: F(1, 85) = 3.82, p = .054, ηp2
= .05,
Cohen’s d = - 0.41, revealing that liars presented fewer trunk movements (M = 1.69, SE =
0.25) than truth-tellers (M = 2.40, SE = 0.25). A similar trend of decreased hand and arm
movements emerged, F(1, 85) = 3.85, p = .053, ηp2
= .04, Cohen’s d = - 0.41, with fewer such
movements for deceivers (M = 2.41, SE = 0.45) than truth-tellers (M = 3.68, SE = 0.45).
These findings indicate a trend of decreases in limb movements providing support towards
Hypothesis 1, that deceivers would present different amounts of observable body movements,
when compared to truth-tellers. Subjective impressions of positive affect were significantly
influenced by deception, F(1, 85) = 5.94, p < .05, ηp2
= .07, Cohen’s d = 0.51. Liars displayed
1 2 3 4 5 6 7 8 9 10 11 12 13 14 15 16 17 18 19 20 21 22 23 24 25 26 27 28 29 30 31 32 33 34 35 36 37 38 39 40 41 42 43 44 45 46 47 48 49 50 51 52 53 54 55 56 57 58 59 60 61 62 63 64 65
more positive affect (M = 3.01, SE = 0.16) compared to truth-tellers (M = 2.45, SE = 0.16)
supporting Hypothesis 2, that more impressions related to emotional process of deception
(either negative and/or positive affect) would be presented by deceivers than truth-tellers.
Eye/eyebrow movements were significantly influenced by reconnaissance, F(1, 85) =
5.68, p < .05, ηp2
= .06, Cohen’s d = 0.51. Covert information collection conditions yielded
more eye/eyebrow movements (M = 3.79, SE = 0.15) than conditions where there were no
reconnaissance activities (M = 3.28, SE = 0.15).
5.3. Discussion
The trend for hand movement reduction found in this study reflected the similar findings in
Studies 1. In addition, positive affect was observed as an indicator associated with the
underlying emotion process. The replicated trend of hand movement reduction suggests it
might be a consistent cue across the two contexts assessed in Studies 1 and 3. The only cue
found in relation to reconnaissance was the increased eye/eyebrow movements. However,
this is considered a task-related result since participants looked around as part of the
reconnaissance activity. This does not support Hypothesis 7, that deceivers performing a
reconnaissance task in addition to lying would display more observable nonverbal cues than
deceivers performing only one task. The failure to find significant cues in relation to the dual
deception tasks suggests that nonverbal cues we have investigated might not be as sensitive
as verbal cues (e.g., as found in Vrij et al., 2011) in relation to cognitive loading. Hypotheses
3 and 4 were not supported by any of the three studies.
6. GENERAL DISCUSSION
1 2 3 4 5 6 7 8 9 10 11 12 13 14 15 16 17 18 19 20 21 22 23 24 25 26 27 28 29 30 31 32 33 34 35 36 37 38 39 40 41 42 43 44 45 46 47 48 49 50 51 52 53 54 55 56 57 58 59 60 61 62 63 64 65
The present research consisted of three studies assessing different deception contexts. The
contexts ranged from a private space to a public space, involving both manipulations such as
risks of deception detection and reconnaissance, and contexts that cannot be manipulated
(e.g., passersby as an audience when the deception is conducted in a public space). In
addition to investigating deception that can happen in regular life (Study 1), we simulated
deception tasks that may occur in specific instances and could violate public safety (e.g.,
deceiving a member of security staff in Study 2 and the reconnaissance task in Study 3) in
order to compare the findings from such different settings.
The findings (shown as either significant or a trend of significance) from Studies 1 and
3 in relation to deception suggest the involvement of the fundamental psychological
processes related to deception. The trend in trunk and limb movement reductions indicates
nonverbal cues in relation to negative emotions (Vrij, 2008), cognitive overload (Ekman,
1997; Memon et al., 2003), and behavioral control (Meservy et al., 2005; Vrij et al., 1997),
whereas the increased positive affect observed in liars provides evidence of positive emotions
associated with deception (Memon et al., 2003). In addition, the present research indicates
that the deception cue of limb reduction is found for situations under which deceivers are
standing (in Study 1) or moving around (in Study 3) and therefore extends the traditional
paradigm of using seated participants with an interviewer in laboratory settings.
The findings in Studies 1 and 2 suggest that reduction in hand movements related to the
cognitive effort and attempted behavioral control processes might be magnified when the
level of risks are raised. However, since there is no significant difference in Study 1 and
across levels of risks in Study 2, this needs to be assessed in future studies. Nonetheless,
Study 2 partially supports our proposition that risks can enhance differences in nonverbal
1 2 3 4 5 6 7 8 9 10 11 12 13 14 15 16 17 18 19 20 21 22 23 24 25 26 27 28 29 30 31 32 33 34 35 36 37 38 39 40 41 42 43 44 45 46 47 48 49 50 51 52 53 54 55 56 57 58 59 60 61 62 63 64 65

behavior between deceivers and truth-tellers. The difference in nonverbal cues was not
significant across the three levels of risks, but the extent of impression of tension was greater
in the highest risk (security evaluation) level than the other two lower risk levels. This might
be due to the fact that higher risks place greater self-regulation demands on a person,
subsequently leading to depletion in self-regulation. The self-depletion results in one’s failure
of regulating such behaviors properly (Carver & Scheier, 1998; Muraven & Baumeister,
2000). Notably, the cues associated with induced risks were also presented by truth-tellers,
suggesting a need for future research endeavoring to solve the dilemma of discriminating
liars from truth-tellers who might behave like deceivers (DePaulo, 1992; Ofshe & Leo,
1997). Similarly, the impression of negative affect was also significantly increased in the
highest risk level, compared to the other two levels. This trend was only significant in
deceivers, suggesting a possible solution to discriminate deceivers from truth-tellers by
observing the extent of negative affect across risk levels. However, since the results did not
show a robust difference across all three levels, further studies are needed for testing this
nonverbal impression. Nonetheless, the findings about the significant increase in nonverbal
cues in the highest risk overwhelming the other levels suggest that a security check (as
simulated in Study 2) might influence deceivers’ and/or truth-tellers’ behavior. We thus
suggest this should be brought to the attention of security/public safety practitioners.
In relation to the controlled covariates, age and gender were found to be significantly
related to reduction in hand movement whilst telling lies. Age also influenced tension
impressions related to risks. An explanation is that age and gender can influence nonverbal
behavior exhibited by individuals and in line with evidence of age and cultural influences on
nonverbal behavior (Vrij, 2008; Vrij & Winkel, 1991), our result suggests that the effect of
1 2 3 4 5 6 7 8 9 10 11 12 13 14 15 16 17 18 19 20 21 22 23 24 25 26 27 28 29 30 31 32 33 34 35 36 37 38 39 40 41 42 43 44 45 46 47 48 49 50 51 52 53 54 55 56 57 58 59 60 61 62 63 64 65

such variables should not be neglected in future research and failing to take these into
account may adversely impact the validity of results.
This research may have limitations regarding the stakes of deception introduced in
experiments, which are not as dramatic as those in real life deception situations such as
terrorist activities. However, the risk assessed in this study concerns the probability of being
detected. Participants were aware that the confederate they met in the highest risk level was
good in detecting lies. This had introduced a higher probability of detection than the other
two levels (either no evaluator or no evaluation was performed). A further limitation is that in
Study 2, deceivers read an extra article about deception. Although the article did not include
information about nonverbal cues to deception, it might still have had an effect on the
psychological processes that deceivers experienced and thus might indirectly influence
deceivers’ behavior. Researchers conducting future deception studies might want to consider
such potential effects while designing their own experimental materials. The ecological
validity of lies performed in laboratory studies is a recognized limitation in deception
research (Koning et al., 2011). Nevertheless, when deception tasks in laboratories are
assigned to participants, the cognitive processes still influence behavioral control and shapes
behavior (Hadar et al., 2012; Ito et al., 2012; Kozel et al., 2005).
No significant deception cues were found in Study 2 whilst in the other studies these
were apparent. This was possibly because participants were seated throughout this study,
reducing the presence of visible nonverbal cues (e.g., trunk movements). If this is upheld in
more studies there is evidence from these findings that it is important to consider a range of
situational variables including the context where deception happens. The nonverbal cues
assessed in the present research could be observed by people without relying on any detection
1 2 3 4 5 6 7 8 9 10 11 12 13 14 15 16 17 18 19 20 21 22 23 24 25 26 27 28 29 30 31 32 33 34 35 36 37 38 39 40 41 42 43 44 45 46 47 48 49 50 51 52 53 54 55 56 57 58 59 60 61 62 63 64 65

techniques. However, the nonverbal cues found in these studies require further testing in in
order to investigate if such differences could be identified easily.
7. CONCLUSIONS
Taken as a whole, the findings demonstrate and contribute to both theory and practice by
extending the existing evidence base with regard to deception-related behaviors across three
situations. This work is another step forward in identifying more clearly the difference
between deceivers and truth-tellers in settings other than interview situations. The
implications of this research could be important for security stakeholders in many settings as
they continually strive to make improvements to methods of deception detection. A focus on
observable nonverbal cues could benefit security officials who are not able to directly interact
with suspect individuals and who do not use detailed behavioral analysis when a judgment of
deception is needed immediately. In addition, the present research provides evidence of
nonverbal deception cues, and sheds light on effective manipulations, which may further help
to increase deception detection accuracy.
ACKNOWLEDGEMENTS
This research was supported by a grant from Engineering and Physical Sciences Research
Council (EPSRC: EP/H02302X/1). The authors would also like to thank Ms Christin
Kirchhuebel for her valuable aid during the data collection process; Dr. Manuchehr
Soleimani, and the IT services teams from the University of Bath and the University of East
London for providing resources for the experiments.
1 2 3 4 5 6 7 8 9 10 11 12 13 14 15 16 17 18 19 20 21 22 23 24 25 26 27 28 29 30 31 32 33 34 35 36 37 38 39 40 41 42 43 44 45 46 47 48 49 50 51 52 53 54 55 56 57 58 59 60 61 62 63 64 65

REFERENCES
Bagley, J., and Manelis, L. (1979). Effect of awareness on an indicator of cognitive load.
Percept. Motor Skill., 49: 591--594.
Breakwell, G. M. (2007). The Psychology of Risk. Cambridge University Press, Cambridge,
England.
Buller, D. B., and Burgoon, J. K., (1996). Interpersonal deception theory. Commun. Theor. 6:
203--242.
Burgoon, J. K., Blair, J. P., and Strom, R. E. (2008). Cognitive biases and nonverbal cue
availability in detecting deception. Hum. Commun. Res. 34: 572--599.
Burgoon, J. K., Bulkr, D. B., Ebesu, A. S., White, C. H., and Rockwell, P. A. (1996). Testing
interpersonal deception theory: Effects of suspicion on communication behaviors and
perceptions. Commun. Theor. 6: 243--267.
Byrnes, J. P., Miller, D. C., and Schafer, W. D. (1999). Gender differences in risk taking: A
meta-analysis. Psychol. Bull. 125: 367--383.
Carrión, R. E., Keenan, J. P., and Sebanz, N. (2010). A truth that's told with bad intent: An
ERP study of deception. Cognition. 114: 105--110.
1 2 3 4 5 6 7 8 9 10 11 12 13 14 15 16 17 18 19 20 21 22 23 24 25 26 27 28 29 30 31 32 33 34 35 36 37 38 39 40 41 42 43 44 45 46 47 48 49 50 51 52 53 54 55 56 57 58 59 60 61 62 63 64 65
Carver, C. S., and Scheier, M. F. (1998). On the Self-regulation of Behavior. Cambridge
University Press, Cambridge, England.
DePaulo, B. M. (1992). Nonverbal behavior and self-presentation. Psychol. Bull. 111: 203--
243.
DePaulo, B. M., and Bond Jr, C. F. (2012) Beyond accuracy: Bigger, broader ways to think
about deceit. J. Appl. Res. Memory Cognition. 1: 120--121.
DePaulo, B. M., and Kirkendol, S. E. (1989). The motivational impairment effect in the
communication of deception. In Yuille, J.C. (Ed.), Credibility assessment, Kluwer, Dordrecht,
the Netherlands, pp. 51--70.
DePaulo, B. M., Lindsay, J. J., Malone, B. E., Muhlenbruck, L., Charlton, K., and Cooper, H.
(2003). Cues to deception. Psychol. Bull. 129: 74--118.
DePaulo, B. M., Stone, J. L., and Lassiter, G. D. (1985). Deceiving and detecting deceit. In B.
R. Schenker (Ed.), The self and social life, McGraw-Hill, New York, NY, pp. 323--370.
Doherty-Sneddon, G., and Phelps, F. G. (2005). Gaze aversion: A response to cognitive or
social difficulty? Mem. Cognition. 33: 727--733.
Ekman, P. (1992). Telling Lies: Clues to Deceit in The Marketplace, Politics, and Marriage.
1 2 3 4 5 6 7 8 9 10 11 12 13 14 15 16 17 18 19 20 21 22 23 24 25 26 27 28 29 30 31 32 33 34 35 36 37 38 39 40 41 42 43 44 45 46 47 48 49 50 51 52 53 54 55 56 57 58 59 60 61 62 63 64 65
(2nd ed.). WW Norton, New York, NY.
Ekman, P. (1997). Deception, lying and demeanor. In Halpern, D. F. and Voiskunskii, A.
(Eds.), States of mind: American and post-soviet perspectives on contemporary issues in
psychology. Oxford University Press, New York; Oxford, pp. 93--105.
Ekman, P., and Frank, M. G. (1993). Lies that fail. In Lewis, M., and Saarni, C., (Eds.), Lying
and deception in everyday life, The Guilford Press, New York, NY, pp. 184--200.
Field, A. (2005). Discovering statistics using SPSS: And sex, drugs and rock'n'roll. (2nd ed.).
SAGE Publications, London, England.
Granhag, P. A., and Strömwall, L. A. (2002). Repeated interrogations: Verbal and non-verbal
cues to deception. Appl. Cognitive Psych. 16: 243--257.
Hadar, A. A., Makris, S., and Yarrow, K. (2012). The truth-telling motor cortex: Response
competition in M1 discloses deceptive behaviour. Biol. Psychol. 89: 495--502.
Hartwig, M., Granhag, P. A., Strömwall, L. A., and Kronkvist, O. (2006). Strategic use of
evidence during police interviews: When training to detect deception works. Law Human
Behav. 30: 603--619.
Ito, A., Abe, N., Fuji, T., Hayashi, A., Ueno, A., Mugikura, S., Takahashi, S. and Mori, E.
1 2 3 4 5 6 7 8 9 10 11 12 13 14 15 16 17 18 19 20 21 22 23 24 25 26 27 28 29 30 31 32 33 34 35 36 37 38 39 40 41 42 43 44 45 46 47 48 49 50 51 52 53 54 55 56 57 58 59 60 61 62 63 64 65

(2012). The contribution of the dorsolateral prefrontal cortex to the preparation for deception
and truth-telling. Brain Res. 1464: 43--52.
Kirchhuebel, C. and Howard, D. M. (in press). Detecting suspicious behaviour using speech:
Acoustic correlates of deceptive speech – An exploratory investigation. Appl. Ergon.
doi.:http://dx.doi.org/10.1016/j.apergo.2012.04.016
Koning, L., Steinel, W., Beest, I. v., and Dijk, E. V. (2011). Power and deception in ultimatum
bargaining. Organ. Behav. Hum. Dec. 115: 35--42.
Kozel, F. A., Johnson, K. A., Mu, Q., Grenesko, E. L., Laken, S. J., and George, M. S. (2005).
Detecting deception using functional magnetic resonance imaging. Biol. Psychiat. 58: 605--
613.
Lancaster, G. L. Vrij, A., Hope, L., and Waller, B. (2012). Sorting the liars from the truth
tellers: The benefits of asking unanticipated questions on lie detection. Appl. Cognitive
Psychol. 27: 107--114.
Langleben, D. D., Schroeder, L., Maldjian, J. A., Gur, R. C., McDonald, S., Ragland, J. D.,
O’Brien, C. P., Childress, A. R. (2002). Brain activity during simulated deception: An event-
related functional magnetic resonance study. NeuroImage. 15: 727--732.
Lawson, G., Stedmon, A. W., Zhang, K., Eubanks, D. L., and Frumkin, L. A. (in press). The
1 2 3 4 5 6 7 8 9 10 11 12 13 14 15 16 17 18 19 20 21 22 23 24 25 26 27 28 29 30 31 32 33 34 35 36 37 38 39 40 41 42 43 44 45 46 47 48 49 50 51 52 53 54 55 56 57 58 59 60 61 62 63 64 65

effects of self-awareness on body movement indicators of the intention to deceive. Appl.
Ergon. doi.: 10.1016/j.apergo.2012.04.018
Mehrabian, A. (1968). Some referents and measures of nonverbal behavior. Behav. Res.
Meths. 1: 203--207.
Memon, A. A., Vrij, A., and Bull, R. (2003). Psychology and law: Truthfulness, accuracy and
credibility (2nd ed.). John Wiley, Chichester, England.
Meservy, T. O., Jensen, M. L., Kruse, J., Burgoon, J. K., Nunamaker Jr., J. F., Twitchell, D. P.,
Tsechpenakis, G., Metaxas, D. N. (2005). Deception detection through automatic,
unobtrusive analysis of nonverbal behavior. IEEE Intel. Syst. 20: 36--43.
Muraven, M., and Baumeister, R. F. (2000). Self-regulation and depletion of limited
resources: Does self-control resemble a muscle? Psychol. Bull. 126: 247--259.
Ofshe, R. J., and Leo, R. A. (1997). The decision to confess falsely: Rational choice and
irrational action. Denver U. Law Rev. 74: 979--1112.
Porter, S., and ten Brinke, L. (2008) Reading between the lies: Identifying concealed and
falsified emotions in universal facial expressions. Psychol. Sci. 19: 508--514.
Porter, S., ten Brinke, L. (2010) The truth about lies: What works in detecting high-stakes
1 2 3 4 5 6 7 8 9 10 11 12 13 14 15 16 17 18 19 20 21 22 23 24 25 26 27 28 29 30 31 32 33 34 35 36 37 38 39 40 41 42 43 44 45 46 47 48 49 50 51 52 53 54 55 56 57 58 59 60 61 62 63 64 65

deception? Legal Criminol. Psych. 15: 57--75.
Rhodes, N., and Pivik, K. (2011). Age and gender differences in risky driving: The roles of
positive affect and risk perception. Accident Anal. Prev. 43: 923--931.
Sip, K. E., Lynge, M., Wallentin, M., McGregor, W. B., Frith, C. D., and Roepstorff, A.
(2010). The production and detection of deception in an interactive game. Neuropsychologia.
48: 3619--3626.
Spence, S. A., Farrow, T. F., Herford, A. E., Wilkinson, I. D., Zheng, Y., and Woodruff, P. W.
(2001). Behavioural and functional anatomical correlates of deception in humans.
NeuroReport. 12: 2849--2853.
ten Brinke, L., Porter, S. (2012). Cry me a river: Identifying the behavioral consequences of
extremely high-stakes interpersonal deception. Law Human Behav. 36: 469--477.
Villar, G., Arciuli, J., and Mallard, D. (2012). Use of “um” in the deceptive speech of a
convicted murderer. Appl. Psycholinguist. 33: 83--95.
Vrij, A. (2008). Detecting lies and deceit: Pitfalls and opportunities (2nd ed.). John Wiley,
Chichester, England.
Vrij, A., and Granhag, P. A. (2012) Eliciting cues to deception and truth: What matters are the
1 2 3 4 5 6 7 8 9 10 11 12 13 14 15 16 17 18 19 20 21 22 23 24 25 26 27 28 29 30 31 32 33 34 35 36 37 38 39 40 41 42 43 44 45 46 47 48 49 50 51 52 53 54 55 56 57 58 59 60 61 62 63 64 65

questions asked. J. Appl. Res. Memory Cognition. 1: 110--117.
Vrij, A., and Mann, S. (2001). Telling and detecting lies in a high-stake situation: The case of
a convicted murderer. Appl. Cognitive Psych. 15: 187--203.
Vrij, A., and Mann, S. (2005). Police use of nonverbal behavior as indicators of deception. In
R. E. Riggio and R. S. Feldman (Eds.), Applications of nonverbal communication, Lawrence
Erlbaum Associates, Mahwah, NJ, pp. 63--94.
Vrij, A., and Winkel, F. W. (1991). Cultural patterns in Dutch and Surinam nonverbal
behavior: A analysis of simulated police/citizen encounters. J. Nonverbal Behav. 15: 169--
184.
Vrij, A., Edward, K., and Bull, R. (2001). Stereotypical verbal and nonverbal responses while
deceiving others. Pers. Soc. Psychol. B. 27: 899--909.
Vrij, A., Leal, S., Granhag, P. A., Mann, S., Fisher, R. P., Hillman, J., and Sperry, K. (2009).
Outsmarting the liars: The benefit of asking unanticipated questions. Law Human Behav. 33:
159--166.
Vrij, A., Leal, S., Mann, S., and Fisher, R. (2011). Imposing cognitive load to elicit cues to
deceit: Inducing the reverse order technique naturally. Psychol. Crim. Law. 18: 579--594.
1 2 3 4 5 6 7 8 9 10 11 12 13 14 15 16 17 18 19 20 21 22 23 24 25 26 27 28 29 30 31 32 33 34 35 36 37 38 39 40 41 42 43 44 45 46 47 48 49 50 51 52 53 54 55 56 57 58 59 60 61 62 63 64 65

Vrij, A., Mann, S. A., Fisher, R. P., Leal, S., Milne, R., and Bull, R. (2008). Increasing
cognitive load to facilitate lie detection: The benefit of recalling an event in reverse order.
Law Human Behav. 32: 253--265.
Vrij, A., Semin, G. R., and Bull, R. (1996). Insight into behavior displayed during deception.
Hum. Commun. Res. 22: 544--562.
Vrij, A., Winkel, F. W., Akehurst, L., (1997). Police officer’s inccorect beliefs about
nonverbal indicators of deception and its consequences. In J. F. Nijboer and J. M. Reijntjes
(Eds.), Proceedings of the first world conference on new trends in criminal investigation and
evidence. Koninklijke Vermande, Lelystad, the Netherlands, pp. 221--238.
Walczyk, J. J., Schwartz, J. P., Clifton, R., Adams, B., Wei, M., and Zha, P. (2005). Lying
person-to-person about life events: A cognitive framework for lie detection. Pers. Psychol.
58: 141--170.
Zuckerman, M., DePaulo, B. M., and Rosenthal, R. (1981). Verbal and nonverbal
communication of deception. In L. Berkowitz (Ed.), Advances in experimental social
psychology, Academic Press, New York, NY, Vol 14, pp. 1--59.
1 2 3 4 5 6 7 8 9 10 11 12 13 14 15 16 17 18 19 20 21 22 23 24 25 26 27 28 29 30 31 32 33 34 35 36 37 38 39 40 41 42 43 44 45 46 47 48 49 50 51 52 53 54 55 56 57 58 59 60 61 62 63 64 65
CAPTIONS
Table I. Coding of nonverbal cues - Body sections excluding hand/arm
Table II. Coding of nonverbal cues - Hand/arm
Table III. Coding of nonverbal cues – Impressions
Table IV. ANCOVA results for Study 1a
Table V. ANCOVA results for Study 2a
Table VI. ANCOVA results for Study 3a
Captions

Table I
Body sectionsa
Variable namea
(movements)
Coding Details
(frequency/length)
Head Head movement
(all studies)
All types (e.g. nod, shake, turn, tilt, etc)
Eye Aversion/shifts
(all studies)
Brief change of gaze direction
Staring at other places
(Study 1 and 2)
Fixed gaze direction
Staring at folder
(Study 2)
Fixed gaze in the direction of the folder
Eye contact aversion
(Study 3)
Avoiding eye contact with passersby
Eye/eyebrow
(all studies)
Other eye movements to those above
Trunk
Indirect orientation while
standing
(Study 1)
Tilting at waist while being spoken to
Lean towards other people
while seated (Study 2)
Body moving toward people being talked to
Lean back while seated
(Study 2)
Body moving away from people being talked
to
Position shift
(Study 2)
Changes to the way of sitting that involve
multiple body parts
Sway
(Study 3)
Waist moving slowly or rhythmically from
side to side
Foot/Leg Feet and legs
(all studies)
Movements of legs and feet together
Foot only
(all studies)
Movements of feet without moving legs
Leg only
(all studies)
Movements of legs without moving feet
Note. aBody sections/movements in Bold were included in the analysis (according to the
filtering steps stated in section 2).
Table1

Table II
Body sectionsa
Variable namea
(movements)
Coding Details
(frequency/length)
Hands/arms
Hands and arms
(all studies)
Movement of hands and arms together
Hands only
(all studies)
Movement of hands without moving arms
Crossing arms
(all studies)
Arms crossed in front of chest
Hand(s) in pocket(s)
(all studies)
Gesture of hand(s) in pocket(s)
Hand holding
(Study 1 and 2)
Two hands hold together in front/behind
trunk
Hand hiding and legs
(Study 2)
Holding hands between knees
Hand and objects
(Study 3)
Movements of hands holding bag or objects
Note. aBody sections/movements in Bold were included in the analysis (according to the
filtering steps stated in section 2).
Table2
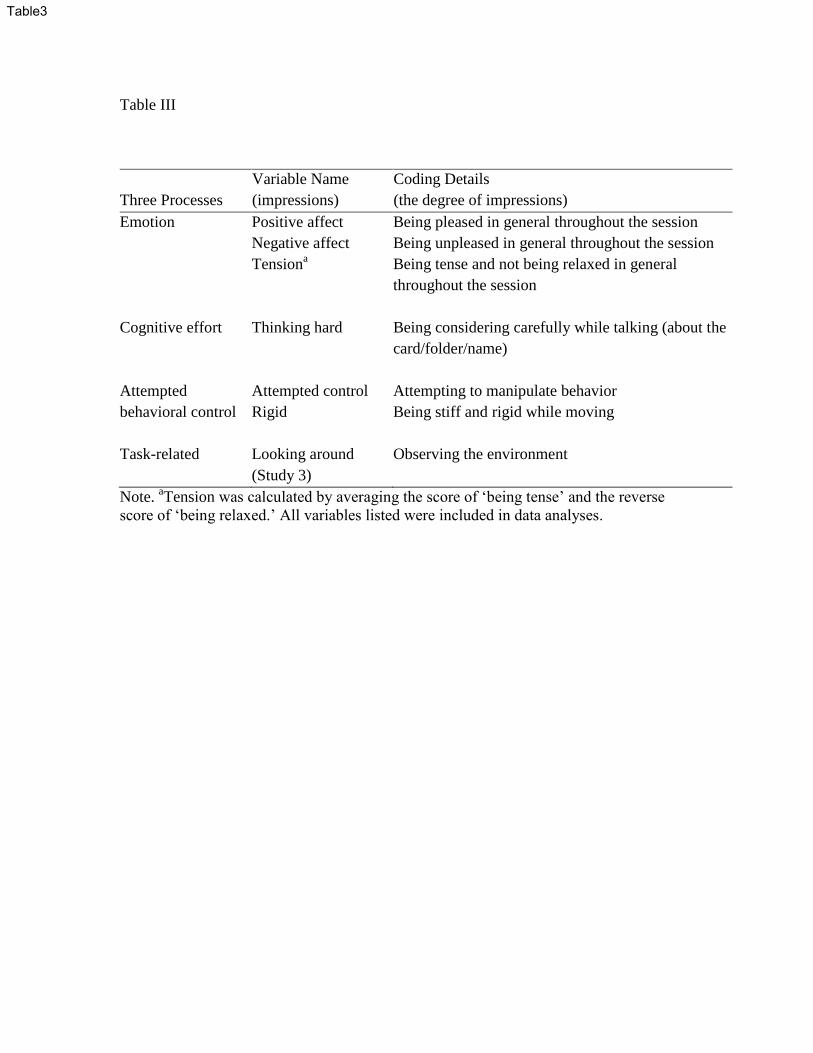
Table III
Three Processes
Variable Name
(impressions)
Coding Details
(the degree of impressions)
Emotion Positive affect
Being pleased in general throughout the session
Negative affect Being unpleased in general throughout the session
Tensiona
Being tense and not being relaxed in general
throughout the session
Cognitive effort Thinking hard
Being considering carefully while talking (about the
card/folder/name)
Attempted
behavioral control
Attempted control Attempting to manipulate behavior
Rigid Being stiff and rigid while moving
Task-related Looking around
(Study 3)
Observing the environment
Note. aTension was calculated by averaging the score of ‘being tense’ and the reverse
score of ‘being relaxed.’ All variables listed were included in data analyses.
Table3

Table IV
Deception
Level of Risks
F df p ηp2
F df p ηp2
Movements and Covariatesa
Hand and arm* 1.14 1, 21 .30 .05 4.29 1, 21 .51 .17
Age 1.58 1, 21 .22 .07 1.58 1, 21 .22 .07
Gender 1.23 1, 21 .28 .06 1.23 1, 21 .28 .06
Western/Non-western 0.63 1, 21 .44 .03 0.63 1, 21 .44 .03
Hand holding** 4.75 1, 21 .04 .18 2.24 1, 21 .15 .10
Age 5.62 1, 21 .03 .21 5.62 1, 21 .03 .21
Gender 6.98 1, 21 .02 .25 6.98 1, 21 .02 .25
Western/Non-western 0.01 1, 21 .94 .00 0.01 1, 21 .94 .00
Note. aInsignificant dependent variables were not listed. ηp
2 = effect size estimate – partial eta
squared. **Significant effect of variables: p < .05 states in Bold; *trend of significant effect
of variables: P < .055 states in Bold.
Table4
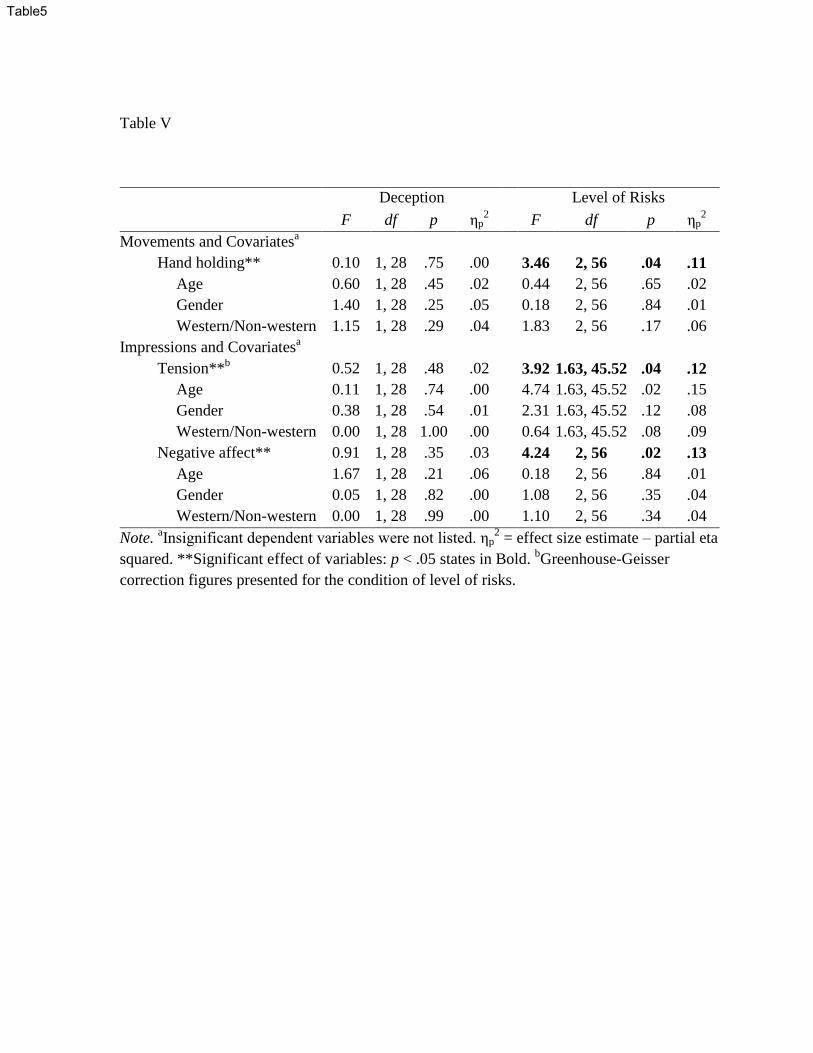
Table V
Deception
Level of Risks
F df p ηp2
F df p ηp2
Movements and Covariatesa
Hand holding** 0.10 1, 28 .75 .00 3.46 2, 56 .04 .11
Age 0.60 1, 28 .45 .02 0.44 2, 56 .65 .02
Gender 1.40 1, 28 .25 .05 0.18 2, 56 .84 .01
Western/Non-western 1.15 1, 28 .29 .04 1.83 2, 56 .17 .06
Impressions and Covariatesa
Tension**b
0.52 1, 28 .48 .02 3.92 1.63, 45.52 .04 .12
Age 0.11 1, 28 .74 .00 4.74 1.63, 45.52 .02 .15
Gender 0.38 1, 28 .54 .01 2.31 1.63, 45.52 .12 .08
Western/Non-western 0.00 1, 28 1.00 .00 0.64 1.63, 45.52 .08 .09
Negative affect** 0.91 1, 28 .35 .03 4.24 2, 56 .02 .13
Age 1.67 1, 28 .21 .06 0.18 2, 56 .84 .01
Gender 0.05 1, 28 .82 .00 1.08 2, 56 .35 .04
Western/Non-western 0.00 1, 28 .99 .00 1.10 2, 56 .34 .04
Note. aInsignificant dependent variables were not listed. ηp
2 = effect size estimate – partial eta
squared. **Significant effect of variables: p < .05 states in Bold. bGreenhouse-Geisser
correction figures presented for the condition of level of risks.
Table5
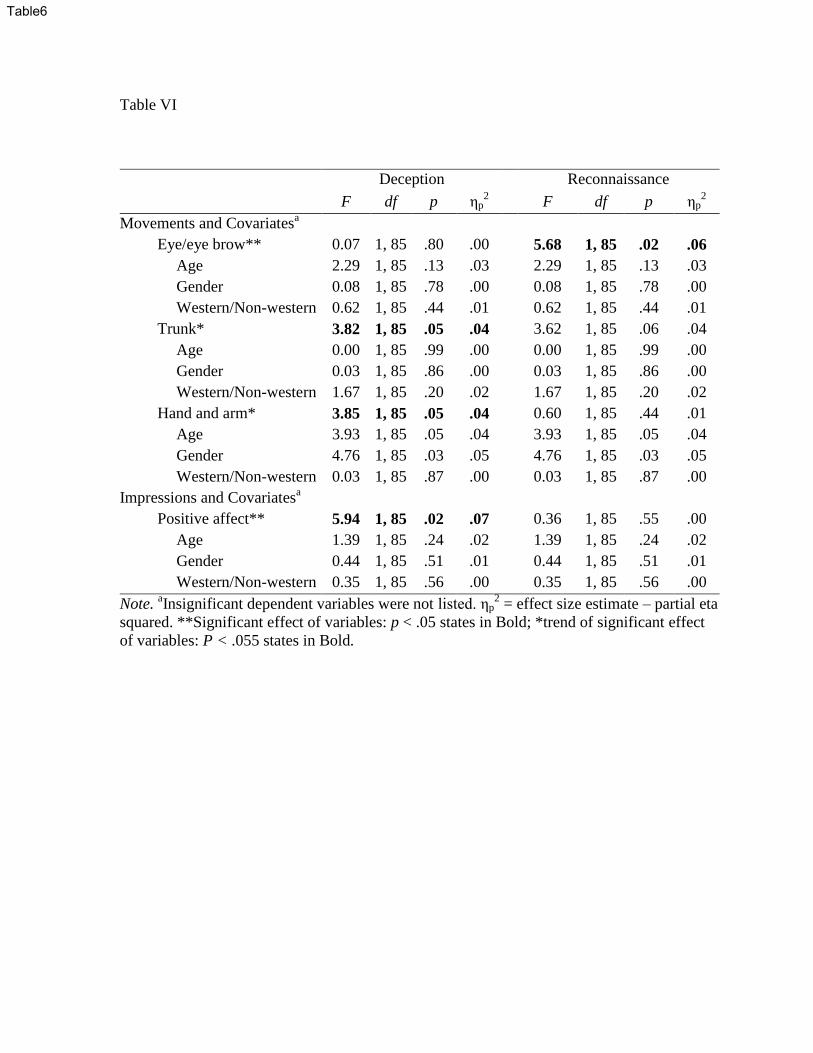
Table VI
Deception
Reconnaissance
F df p ηp2
F df p ηp2
Movements and Covariatesa
Eye/eye brow** 0.07 1, 85 .80 .00 5.68 1, 85 .02 .06
Age 2.29 1, 85 .13 .03 2.29 1, 85 .13 .03
Gender 0.08 1, 85 .78 .00 0.08 1, 85 .78 .00
Western/Non-western 0.62 1, 85 .44 .01 0.62 1, 85 .44 .01
Trunk* 3.82 1, 85 .05 .04 3.62 1, 85 .06 .04
Age 0.00 1, 85 .99 .00 0.00 1, 85 .99 .00
Gender 0.03 1, 85 .86 .00 0.03 1, 85 .86 .00
Western/Non-western 1.67 1, 85 .20 .02 1.67 1, 85 .20 .02
Hand and arm* 3.85 1, 85 .05 .04 0.60 1, 85 .44 .01
Age 3.93 1, 85 .05 .04 3.93 1, 85 .05 .04
Gender 4.76 1, 85 .03 .05 4.76 1, 85 .03 .05
Western/Non-western 0.03 1, 85 .87 .00 0.03 1, 85 .87 .00
Impressions and Covariatesa
Positive affect** 5.94 1, 85 .02 .07 0.36 1, 85 .55 .00
Age 1.39 1, 85 .24 .02 1.39 1, 85 .24 .02
Gender 0.44 1, 85 .51 .01 0.44 1, 85 .51 .01
Western/Non-western 0.35 1, 85 .56 .00 0.35 1, 85 .56 .00
Note. aInsignificant dependent variables were not listed. ηp
2 = effect size estimate – partial eta
squared. **Significant effect of variables: p < .05 states in Bold; *trend of significant effect
of variables: P < .055 states in Bold.
Table6