decentralization as an institutional system, prospects and
TRANSCRIPT

Journal of Public Administration and Governance
ISSN 2161-7104
2018, Vol. 8, No. 2
http://jpag.macrothink.org 256
Decentralization as an Institutional System, Prospects
and Retrospect: Case of Four Weredas of Tigrai
Sintayoh Fissha
College of Business and Economics, MacEwan Univesity, Edmonton (AB), Canada
Meheret Berhanu
College of Business and Economics, Mekelle University, Mekelle, Ethiopia
Received: Feb. 17, 2018 Accepted: Mar. 26, 2018 Online published: Jun. 13, 2018
doi:10.5296/jpag.v8i2.13279 URL: https://doi.org/10.5296/jpag.v8i2.13279
Abstract
Following the demise of the Derg regime in 1991, the most important reform agenda of
Ethiopia was to restructure the country and its civil administration along ethnic lines, and to
establish ethnicity as the defining principle of political, social and economic discourse.
Consequently the country‟s political map was redrawn along ethnic lines, which gave way to
“Regional states”. The regional states secured administrative and legislative power within a
federal framework. . Success stories of decentralization encouraged policy makers to launch
fiscal decentralization which extended the regions‟ planning and resource allocation powers
to each district (wereda)level. This apparently enabled them to improve service expansion
and development.
Despite this general perception this study seeks to critically review the impacts of
decentralization (both fiscal and administrative) on districts considering four weredas of
Tigrai regional state (northern part of Ethiopia). To conduct this study both primary and
secondary data sources was and analyzed using simple descriptive, and statistical method of
analysis. Results obtained based on the three variables (measures effect of decentralization on
community participation good governance, and minimizing revenue expenditure gap) reveals
positive progress. Indeed, there are promising changes related to administrative matters and
of community participation in designing and implementation of development plans. These
changes also are enhanced individuals‟ participation in productivity, which expedited poverty
reduction as well, as indicated by the growing improvements in local livelihoods. However,
the gains of decentralization on governance and minimizing revenue expenditure gap are far
from satisfactory. As long as the real participation of locals and problems of local capacity
remains at stake but is still suffered more from resource limitations. This study recommends
Journal of Public Administration and Governance
ISSN 2161-7104
2018, Vol. 8, No. 2
http://jpag.macrothink.org 257
some adjustments with the decentralization approach, and appropriate implementation
modalities so as to solve the procedural and skill related problems, and to minimize misuse of
resource in a way that assists to be more effectively.1
1. Decentralization as a Context
1.1 Introduction
Since the 1980‟s, centralization system is losing ground while transferring part of the power
of the central government to regional or local authorities become a common political formula
(practice) around the globe. Consequently, several countries established national
commissions to assess the advantages of decentralization while many more others made
decentralization or fiscal federalism as the centerpiece of their political agendas (campaign)
without making detailed investigations on its effects. The meanings of decentralization differ
from scholars to scholars; it embraces varieties of concepts, which must be carefully analyzed
in any particular country before determining that national projects should be geared towards
to the reorganization of financial, administrative, or services delivery system (World Bank,
2003). The more widely accepted definition of „decentralization‟ entails the sharing of central
government powers with other institutions, especially those geographically separated or
responsible for specific functions, or those given jurisdiction over specific physical locations
(Ndegwa, 2002; Turner and Mulme, 1997).
Based on this definition the notion of „decentralization‟ shares two common functions. The
first function is territorial where authority power and responsibility are transferred down to
lower levels in territorial hierarchy while the second function concerns about how authority
and responsibility are transferred to lower agencies that are functionally specialized and are
often imported ideas.
Because in most developing countries decentralization was introduced due to the pressures
posed by international financial institutions on African national governments to reform
centralized political systems and economic planning. Directly or indirectly all these
institutions influenced many of the African economic system, adopt economic measures such
as market liberalization, state decentralization, and move towards political pluralism (Stohr,
2001). If we consider the view of the government officials of Ethiopia the situation sounds
somewhat different even though is subject to different criticisms. According to the head of the
Tigray region institutional policy officer and head of each study woredas decentralization was
introduced not only because of imposition from different international institutions but was
also considering the political and development advantage of the nation and/or the region.
According to them imposition from international organizations was not the sole reason that
forced Ethiopia to go through profound economic and political changes (J. Spielman, J.
Cohen, and Tewodaj, 2006). Some government officials deem that the success stories they
1Acknowledgements: I thank Mekelle University, and the Belgian Government for financing
this study. It was one of the MU-IUC project research topic undertaken in Tigray regional
state (Northern part of Ethiopia).
Journal of Public Administration and Governance
ISSN 2161-7104
2018, Vol. 8, No. 2
http://jpag.macrothink.org 258
had when the current government were guerrilla fighters is the case that pushed them to favor
decentralization policy. In pre 1990s, when TPLF, one of the parties of Ethiopian People
Revolutionary Democratic Front (EPRDF) was administering the rural part of Ethiopia they
have noticed the impact of implementing informal decentralization administration system.
Seems the move towards decentralization in Ethiopia is part of an unfolding process in that
country that goes to the heart of its political economy and sounds as if inborn than imported
type.
1.2 Statement of the Problem
In most developing countries in general and of Ethiopia in particular the issue of institution
building has gained space. It is now generally recognized that „institutions matter‟ and that
the associated incentive structures substantially influence economic performance (Bardhan
and Udry, 1999). Even though which institution affects economic progress and how is too
complex, institutional failure impedes development.
The term „institution‟ is so vague, for the purposes of this paper it simply refers to the change
in structural frameworks and administrative system. Considering several cases of institutional
changes in Ethiopia, decentralization is taken as one among many others. The
decentralization drive in Ethiopia in is due to diverse reason and development in the
European Union was one of these factors (Tanzi, 1995).
Decentralization in Ethiopia went through two phases. The first wave of decentralization
occurred in the period 1991-2000, and the second wave refers to the decade; since 2001 on
ward which is often named as District Level Decentralization Program (DLDP). In adopting
decentralization policy, the government focused on creating and empowering
National/Regional Governments geared towards the reduction of poverty and of inequality.
Building a decentralized structure was expected to bring changes related public service
delivery, foster democratization, and to strengthen national integration (Steinich, 2002).
Many of the recent studies and reports (MOFED, 2010; MOFED 2012), suggests that poverty
has been considerably reduced after implementing decentralization. On the other hand, there
are different criticisms pertinent to the links between poverty and inequality, which shows an
increasing trend (MOFED 2010)2, Related to this the Country Governance Profile assessment
shows about the institutional failure, compliance with formal rules and regulations in the
Ethiopian civil service is high and control system is strong (ADB & ADF, 2009). Even a
previous study conducted by Yigremew, Nega, and Haregewoin (2005) indicates this; poverty
has grown much deeper and wider in Ethiopia over the recent years, which implies failure of
expectations.
The strategic plan of the country over the last decades focuses on improving the country‟s
economic and institutional development; as priority policy issues designed to bring about
meaningful changes in the lives of the poor (marginalized). Nevertheless, failure to
2The inequality as measured by the Gini Coefficient, shows a moderate rise at national level
while sharply rising in urban areas.

Journal of Public Administration and Governance
ISSN 2161-7104
2018, Vol. 8, No. 2
http://jpag.macrothink.org 259
implement these pertinent policies appropriately produced much unexpected results which
made poverty to be still pervasive. Of all, good governance and vibrant civil society are
among the priority issues identified in the framework of its “Right to the Heard Program”
(Ibid).
Since decentralization was intended to create a better system related to administration, and
resource use it was also expected to motivate officials to design programs from a more cross
sectoral perspectives that could led to achievement of economic advantage. However, unlike
these stated goals, there is an extended argument and continuous debate that emerged from
dubious procedures of overall implementation, where the availability of skilled manpower is
very limited and the miss use of resources is high (Tegenge and Kassahun, 2007; and Meheret,
2007).
A study on decentralization and its effect in Ethiopia (based on experience of different
regions) also supports the stated argument. They argued: achievements were far lower than
expectations as the smallest administrative units‟ hardly exercised degree of political power
granted by the EFEDRE Constitution. In relation to this different writers (Tegegne and
Kassahun 2007, and Dom and Mussa, 2006 ) argued stating:
While the first wave of decentralization (administrative decentralization) has registered
significant achievements in local governance and regional self-rule, it was not capable of
bringing genuine self rule particularly at lower level of administration where governance and
decentralization matter most. Thus, our main argument is the above finding needs to be
justified, empirical information on implementation of decentralization policy in Ethiopia and
particularly in the study woredas is so complex, or is largely missing and this study is
expected to fill that gap.
Therefore, this study tried to investigate the effects of decentralization in Tigrai region, and
examined the specific achievements and its challenges.3 The fundamental question was
whether the ongoing decentralization helped to achieve the needed development or not. The
impact of devolution on a gamut of fundamental institutional issues, such as the level of
corruption would be scrutinized.
It seeks to investigate whether findings by previous authors are consistent with the Tegrayan
experiences or not. With this in mind, this study seeks to answer the following questions:
To what extent does decentralization empower small administrative units?
What are the opportunities and challenges of implementing fiscal and administrative
decentralization?
1.3 Objective
The main objective of this study is to investigate the effect of decentralization in improving
3Tigrai is one of the regional state in the northern part of Ethiopia. The researchers were very
much interested on identifying decentralization and its specific relevance to poverty reduction
of the rural areas, which mainly falls within the Giba catchment
Journal of Public Administration and Governance
ISSN 2161-7104
2018, Vol. 8, No. 2
http://jpag.macrothink.org 260
livelihood of the rural communities often attained as a result of having better institutional
performances taking the case of four weredas of Tigrai (Keleteawelaelo, Atsebi,
Tankuabergele, and Hagereselam), northern part of Ethiopia. The specific objectives are:
To examine the progresses attained related to administration implementation system
after the launching of decentralization in Tigrai region.
To compare and contrast the implication of fiscal and administrative decentralization
in Tigrai, investigate the easiness to implement as per expected in enhancing
participation and good governance.
1.4 Hypothesis
By applying the methodology, which is discussed below this study has tried to verify or
nullify the following.
H0: Decentralization led to the improvement of the administrative performance of small
administrative unit.
H1: Decentralization did not have much effect either on the locals‟ participation and good
governance.
1.5 Instruments and Methodology of the Study
1.5.1 Methodologies
To conduct this study both, primary and secondary data sources have been used. Primary data
was collected through both, focus group discussion and distributing questionnaire to a sample
of randomly and purposively selected respondents in two rounds in 2010 and in 2011.
Moreover, the secondary data was obtained from reviewing different related studies (annual
reports of the region and the concerned woredas‟).
1.5.2 The Study Area
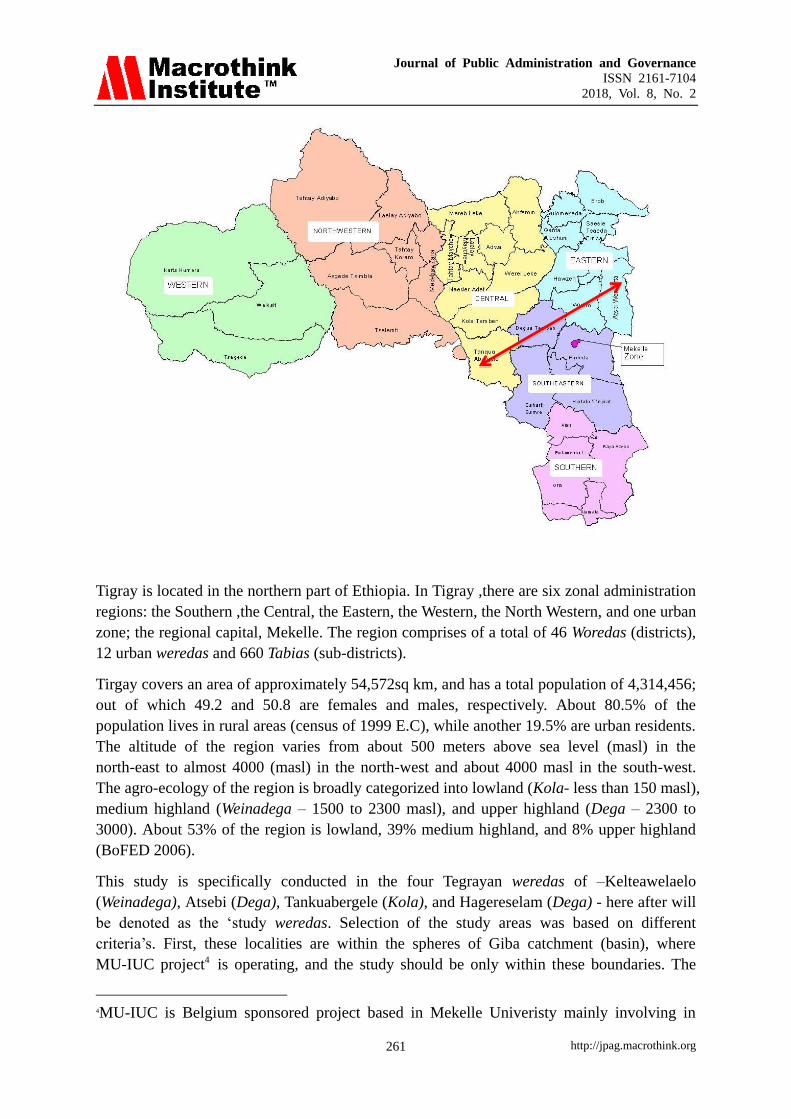
The study was conducted in Tigrai (Northern part of Ethiopia). Specifically in the four
Tegrayan weredas of –Kelteawelaelo (Weinadega) , Atsebi (Dega), Tankuabergele (Kola),
and Hagereselam (Dega), and specific location of the woreds‟ is located in the figure blow
( the line blocked by the arrow).
Journal of Public Administration and Governance
ISSN 2161-7104
2018, Vol. 8, No. 2
http://jpag.macrothink.org 261
Tigray is located in the northern part of Ethiopia. In Tigray ,there are six zonal administration
regions: the Southern ,the Central, the Eastern, the Western, the North Western, and one urban
zone; the regional capital, Mekelle. The region comprises of a total of 46 Woredas (districts),
12 urban weredas and 660 Tabias (sub-districts).
Tirgay covers an area of approximately 54,572sq km, and has a total population of 4,314,456;
out of which 49.2 and 50.8 are females and males, respectively. About 80.5% of the
population lives in rural areas (census of 1999 E.C), while another 19.5% are urban residents.
The altitude of the region varies from about 500 meters above sea level (masl) in the
north-east to almost 4000 (masl) in the north-west and about 4000 masl in the south-west.
The agro-ecology of the region is broadly categorized into lowland (Kola- less than 150 masl),
medium highland (Weinadega – 1500 to 2300 masl), and upper highland (Dega – 2300 to
3000). About 53% of the region is lowland, 39% medium highland, and 8% upper highland
(BoFED 2006).
This study is specifically conducted in the four Tegrayan weredas of –Kelteawelaelo
(Weinadega), Atsebi (Dega), Tankuabergele (Kola), and Hagereselam (Dega) - here after will
be denoted as the „study weredas. Selection of the study areas was based on different
criteria‟s. First, these localities are within the spheres of Giba catchment (basin), where
MU-IUC project4 is operating, and the study should be only within these boundaries. The
4MU-IUC is Belgium sponsored project based in Mekelle Univeristy mainly involving in

Journal of Public Administration and Governance
ISSN 2161-7104
2018, Vol. 8, No. 2
http://jpag.macrothink.org 262
second selection criterion was based on ecological or geographical basis. Accordingly,
Kilteawelaelo, Hagereselam, Atsebi, and Tankuaabergele were chosen.
1.5.3 Data Collection
One rationale of collecting data through survey is to obtain a specific answer to the research
questions. In order to conduct this study initially (in 2010) a total number of 200 samples
were randomly collected from each weredas. However, data collected using questionnaire
distribution has been enriched through FGD, a total of 8 FGD was made with the population
of the weredas (two FGD from each).
The selection of equal sample size from the four-study area was done purposely. In selecting
the desired samples form four of the weredas multistage random sampling technique was
used. Hence, sampling of the subjects started from preparing the list of Tabias5 in each
weredas. At the third stage all the households from the selected wereda were listed and
sample sizes of 50 from each stratum (kushet) were taken using simple random sampling
technique.
In the second round survey (2011) another 200 sample were collected from these four
woredas using simple random and purposive sampling approach. The sample was
proportionally distributed to 100 communities and 100 administrators in four wereda.
1.5.4 Data Analysis
The collected information was analyzed using two methods of analysis, simple descriptive
statistics such as percentage, table, ratio, and statistical method (MANOVA). MANOVA is a
statistical technique designed by (R.A Fisher, 1925).6 For a simple one-way MANOVA, the
data set should have one independent variable (grouping variable) and at least two dependent
variables. If the model is a type in which it is assumed that two factor determines the mean
value of a variable it is called two-factor analysis of variance, two ways MANOVA (Chatfield,
1995). ANOVA tests for differences among group means, and assumes that the mean of a
variable depends on only one factor, namely the sample from which the observation is taken.
But, MANOVA tests for differences among the multivariate effects on the inference based on
the resulting linear model.
In both cases (One way MANOVA and two way MANOVA) it is assumed that the data are
normally distributed with the same variance, 2 . The analysis of variance approach for
testing a null hypothesis (H0) concerning multiple parameters is based on driving two
development and capacity building development programs
5Tabia is smallest administrative unit, which is the same as to sub-district
6ANOVA was developed by R.A. Fisher in the mid of 1920s‟, and become widely known
after being included in Fisher‟s 1925 book Statistical Methods for Research Works, cited in
Efron, B. 1998, Journal of Statistical Science, Vol. 13, No. 2.

Journal of Public Administration and Governance
ISSN 2161-7104
2018, Vol. 8, No. 2
http://jpag.macrothink.org 263
estimator of the common variance, 2 . The first estimator is valid estimator of 2 whether
the null hypothesis is true or not, while the second one is a valid estimator only when H0 is
true.
In addition when H0 is not true, this latter estimator will over estimate H0, in that estimator
will tend to exceed. Since the two estimators should be close to each other when H0 is true,
where as the second estimator should tend to be larger than the first. When H0 is not true, it is
natural to reject H0 when the second estimator is significantly larger than the first. In this
study since the dependent and independent variable are more than two, two-way MANOVA
(the model has more than two dependant and independent variables) was used.
These two independent variable (place and code) are generated as a result of categorizing
respondents based on space and responsibility. Space refers to the area of resident (wereda);
since the targeted wereda are not having the same access and agro ecological zone, the
researchers deem this could have different impact in implementing decentralization. Similarly,
the interviewed individuals have different status (administrative position, which was coded as
1, and representatives of the community coded as zero), and it is believed that these two
categories are supposed to have the same reply about the effect of decentralization if
decentralization outcomes is as expected. If not it is an indication of variance, which could be
effect of differences in level of satisfaction.
Given these categorization in this study MANOVA is preferred to multiple ANOVAs (or
regressions with dummy variables) because:
Multiple ANOVA/OLS depends on chance. For example, if you have 20 dependent
variables, you expect X to have a “significant” effect on one of them if 0 .05.
MANOVA does a global test of whether group means differ for any of the variables.
ANOVA/OLS ignore the inter-correlations between the independent variables (IVs) as
MANOVA takes them into account, it can provide a more powerful statistical test.
MANOVA uses more information about the data than ANOVA does.
Another common use of MANOVA is in a repeated measures design, where the same variable
is measured at different points in time (J. Faraway, 2002). MANOVA used instead of a series
of one-at-a-time ANOVA for two main reasons. First, if you follow up a significant
multivariate test with a bunch of ANOVAs on the individual variables without adjusting the
error rates for the individual tests, there‟s no “protection”. The second reason to do
MANOVA is ANOVAs may produce a significant main effect on the dependent variable (DV),
but in combination they might suggests that the variables are more meaningful taken together
than considered separately.
2. Review of Related Studies
2.1 Related Theoretical and Empirical Reviews
“Decentralization” generally means the devolution of decision-making powers (Martinez-
Vazques, 2011). Countries exercise decentralization processes for different reasons. Some do
Journal of Public Administration and Governance
ISSN 2161-7104
2018, Vol. 8, No. 2
http://jpag.macrothink.org 264
it in the quest for a more efficient and cleaner public sector, while others are disenchanted
with the performance of planning and centralized policies (e.g., socialist economies).
The other reason could be political opportunism (Ibid) like using decentralization for
electoral objectives and/or just a desire to not be left behind in this popular form of
institutional reform. Given these controversies it is widely recognized that over recent years
one can see worldwide interest in decentralization. In most developing countries
decentralization being a recent event and often politically motivated was treated as if it would
result in an efficient allocation of public resources (LDI, 2013). In Ethiopia regionalization
and other strong constitutional guarantees for all of the nations (ethnicities) were enshrined
into Constitution in 1995. The essence was similar to decentralization and was established
after the down fall of the Derg regime. Since then political officials and policy makers argued
stating: decentralization has been explicitly launched to enhance community participation in
local decision-making, community empowerment, and increase local governments‟
responsiveness and accountability. Decentralization stands a much better chance of reaching
the poor (Hertogs, 1999). Consequently efficiency and reducing of economic inequalities
among the states was expected to emerge.7
Although this is the general expectation of this reform (decentralization system), the debate
on the subject still continues to invite controversy. Proponents considered decentralization as
a panacea for adjusting the institutional system, reforming civil service, improving service
and other utility deliveries ((Shah, 2002 and 2006); (Abay et al., 2004); and B. Elhiraika
(2007)),
However, there are studies that show the “winners" of the decentralization process has been
the autonomous communities than the lower corporations (Juan C., 2001). Other research
also indicates how small administrative units are benefiting as a result of implementing
decentralization policy like collection of more revenues. Jimenez and C.Smith (2005)
provided a clue related to the advantages of shifts from a matching grant to a block-funding
grant through the flypaper effect, and its implication on rising revenue and improving of
public service delivery. In this study a 1 per cent increase in decentralization was associated
with approximately 4 per cent reduction in infant mortality.
On the other hand decentralization studies conducted in Ethiopia and else where also shows
the limitations executing decentralization (Meheret, 2007; Tesfay, 2006; LID, 2013). Based
on the study conducted in Ethiopia Meheret specifically argues stating: “over the past couple
of years… the process of pushing down authority, responsibility and resources to wereda has
not been successfully carried out” (Mheret, 2007:96).
Both theoretical and empirical analyses discussed tend to be inconclusive and come up with
ambiguous and differing results. Empirical study related to the country (Ethiopia) or the study
region is not much. Based on what has been discussed above one can conclude that this is the
outcome of the theoretical trade-off, which reflects the various pros and cons of a
decentralized government structure. But we shall also consider that direct empirical

Journal of Public Administration and Governance
ISSN 2161-7104
2018, Vol. 8, No. 2
http://jpag.macrothink.org 265
estimations are still scarce and do not sufficiently involve new results of economic growth
theory and empiricism. In addition, conducting further study on the topic will also help to
give more information about the topic, and can serve policy makers and planners.
3. Data Analysis and Discussions
3.1 Decentralization and Locals Participation
Immediately, after its seizure of government power, the Ethiopian People‟s Revolutionary
Democratic Front (EPRDF) organized a national conference to create the charter that asserted
the right of nationalities to self-determination up to secession. This has opened the door for
the creation of local and regional councils along ethnic lines. The next paragraph presents
how this regionalization or formally known as decentralization has contributed to the
improvement of public administration, governance, and rising revenue of the state in the way
that enhances economic development.
The form of the federal government is defined based on Articles 45 - 49 of the Ethiopian
constitution, the government is made up of ethnically based regional state; administration
structure of the country was revamped into (9) regional states and two special administration
cities (Addis Ababa and Dire Dawa). The regional states were also further divided into 66
zones comprising 556 weredas. The regional states are: Tigray; Afar; Amhara; Oromo;
Benshanguel-Gumuz; Somali; Southern Nations Nationalities and peoples (SNNP); Gambella
Peoples; Harari Peoples; and Welayeta People. Moreover, within the state, people have the
right to create their own decision provided that it is within the will and approval of the
regional state (Getachew and Fraser, 2001).
Decentralization at regional and woreda level is firmly established through foundational
provisions in the Federal Constitution, giving Regional States the power to establish “other
administrative levels that they find necessary.” (Art 50(4)). It is on the basis of this article all
regions, and specifically the study region (Tigrai) implemented decentralization
(administrative decentralization, which was introduced from 1991, and t fiscal
decentralization launched in 2001).
The second decentralization introduced to empower small administrative regions about their
development needs and resource allocations. Though these are the general principles of both
decentralization there are arguments on its actual effect, while some acknowledged about its
consequence that its up to the expected, the other groups are with criticism of decentralization
and they argued that its just mere of ideology stated on paper with nothing impact on
development. Woredas don‟t have full mandate and power either about their administrative
decision and/or resource allocation. Therefore, this study has tried to examine its impact
posing some important questions and is discussed below.
Demographic character of the respondents shows that of the total number of respondents 50%
were administrators and 50% were from the community. Of these proportional sampled
groups 31.5% were female and 68.5 were male. All these were with the age range 70.8%
productive, and the rest were dependent population (higher than age 65 years).
Journal of Public Administration and Governance
ISSN 2161-7104
2018, Vol. 8, No. 2
http://jpag.macrothink.org 266
While the data collected individuals were asked about the administrative system practiced
since decentralization launched. Most of them replied that they are familiar about both,
centralized (they referred Derg system) and decentralized system. They appreciated the
second stating: it encouraged individuals to reflect their view, motivate them to participate in
different development activities, and granted alternatives. Both, communities and
administrators (99%) had positive perception about the system. They said introduction of
decentralization in general and fiscal decentralization in particular enhanced service delivery,
which led to a slight change in economic status, increasing of income. In all the study
woredas informants confirmed about their mandate, acknowledged the changes, and
appreciated the over all progresses obtained. But, they also did not hide their reservation on
its implementation procedure that it is still locally top-down. Locals participation in
implementation of development plans has progressively increased especially after the
introduction of Integrated Community Based Participatory Development Planning (ICBPDP,
introduced in 2009), but still ideas and orders come from the top, not from the bottom.
Informants said: sometimes there are also development plans we demanded but never
accepted.”
Likewise administrative were asked to express what they feel regarding the effect
decentralization. They appreciate the institutional change made in woreda administration;
(94.5%) said regional government is making strenuous efforts to strengthen wereda and tabia
generic (i.e. non sector specific) planning capacities. They said since the inception of this
system training on strategic planning has been provided, and the strategic framework of
designing plan and implementing procedure is also drafted. They strongly believed that this
had s assisted to get an insight regarding the process of developing wereda strategic plans,
and implementations. However, unlike what is stated from the discussion conducted, and
document analysis made researchers learned that little consideration was given to the
problems in weredas that needs serious attention but not within the ambit of the regional
strategic framework. This confirms most of the development plans are coming from the
region than born in local. The mandate of the locals is a matter of identifying the priori need
given the core plan which often comes from the nation (region), and the allocation process
refers to efficient allocation of resource given the budget from the region.
Respondents were also asked about the differences between fiscal and administrative
decentralization system. Almost all said while administrative decentralization is mere of
political fiscal decentralization has encouraged grass roots participation in implementing
local development plans and allocation of its budget thereby checking the potential strengths
and constraints, a progress observed after DLDP launched.
In fact, DLDP was expected to bring all sectors and other bureaus of the wereda in one
domain, facilitating closer integration of community, all sectors, and bureaus of the wereda.
Nevertheless, unlike what is prescribed in the document sectors are not integrated well. In
most documents it was noticed that development programs are often overlapped and sectors
seem to compute more on the ownership than contributing to the development needs of the
locals. This effect to less integration of development plans, opened rooms for resource
miss-utilization and increasing of wastage. But, from the interviews and FGD conducted with

Journal of Public Administration and Governance
ISSN 2161-7104
2018, Vol. 8, No. 2
http://jpag.macrothink.org 267
the communities and head of the administrators of the woredas researchers noticed that
despite these limitations this system has relatively enhanced administrative efficiency,
improved community participation in planning and development, and enabled communities to
owe their development program and share its cost8. This implies that unlike administrative
decentralization fiscal decentralization had created an incentive for people to discuss on
economic affairs and about the local governments performance, which is more relevant to
them.
Regarding implementation process when these two (fiscal and administrative) are compared
the satisfaction of most (70%) informants on the procedure of implementing administrative
decentralization was higher. Related to fiscal decentralization respondents appreciate the
initiative but they also raised some problems. Some (43.5%) if not most resented the burdens
of continuous meeting and free labor services that they often rendered whenever schools or
health centers are constructed through the orders of executives (administrators). This
discloses how grass root communities and their associations lack sufficient awareness with
regard to the on-going decentralization drives while prospects for entrenching accountability
of service providers remains low, which is similar to the study made by (Tegegne and
Kassahun, 2007).
In addition to the above, to examine the specific impacts of decentralization on institutional
progress of rural, several but specific questions that believed can capture the relationship
between dependent and independent variables have been forwarded. Respondents answer was
analyzed using a simple statistical technique called MANOVA as illuminated in the
quantitative analysis presented below (Table 1).
Table 1. Summary result of the questions related to the effects of decentralization on local
community participations (The number in the table refers to percentage).
No Indicator of Participation
Measurements
period Very
good Good average Poor
1 Peoples participation in planning, decision making,
and evaluation
before 1.05 13.09 34.03 51.83
After 11.52 48.69 30.37 9.42
2 Enhancing inter-sectoral (inter-office) relationship,
and facilitating discussions related to development
Before 0.52 15.71 42.93 40.84
after 13.61 51.31 26.70 8.38
3 Strengthening wereda- region coordination and
networking
before 2.62 13.09 27.23 56.54
after 8.36 53.40 27.75 10.47
4 Enhancing top-bottom versus bottom-top
relationships
Before 2,62 20.94 30.37 46.0
After 11,52 37.70 35.60 15.18
Sources: own computed from collected data
Analysis result of Table1 indicates the effects of decentralization on locals participation,
8Almost all discussants stated: “decentralization helped to avoid delays and dependency,
grants power to administer and to owe the development activities” (June-august 2010).
Unlike the past, local administrative units are becoming the decision maker of their own
development progress is their main justification for the above answer.
Journal of Public Administration and Governance
ISSN 2161-7104
2018, Vol. 8, No. 2
http://jpag.macrothink.org 268
which was made by comparing the respondents reply after decentralization with that of
before. Comparison of respondents reply was made using the level of their satisfaction
(measured by the scale), which was measured using Likert Scale.
Likert Scale. is often used to get an overall measurement of a particular topic (opinion or
experience) and it also helps to collect specific data on contributing factors. This method was
used to identify the level of dis/satisfaction of the respondents about the institutional changes
(decentralization). The term good, very good, average and poor are valued as 4, 3, 2, and 1
which is similar to the words of strongly agree, agree, moderately agree and disagree.
Considering all questions given in the table above, and comparison of respondents
satisfaction in after with that of before clearly shows the positive impacts of the measures
undertaken related to decentralization. From their response this is confirmed by the gaining of
more percentage of votes of good (agree) and reduction of percentage of votes of poor
(disagree).9
Therefore, based on both, qualitative and quantitative analysis made it can be said that
decentralization, created an incentive for people and civic society organizations to discuss
about the local governments that are relevant to them. This implies that localities are
increasingly thrown onto themselves to create place for prosperity (UNCDF, 2003).
Localization in this regard implies home or domestic (state) rule, which in this case is one
way. In the study woredas we have learned that after decentralization administration
procedures are becoming more of locally driven and owned, but not decision-making is not.
This is justified by the statistical analysis presented above, decentralization effect to
strengthening wereda- region coordination and networking is highest but decentralization
impact in enhancing top-bottom versus bottom-top relationship still requires much effort.
Moreover, responses to each question disaggregating respondents reply into community and
administrator was examined. This was made to assess whether there is a difference in
perception about decentralization and its effects, which was mainly made by summing the
respondents level of satisfaction. To avoid double counting researchers were careful enough
and the cumulative answer was derived. This has helped to capture the effect and compare the
differences of the counts obtained by each these two categories.
Table below summarizes results of the respondents (number) related to effects of
decentralization on locals participation, disaggregating respondents on the basis of their
position (administrator and community). The number refers to counts and captures the change
in level of satisfaction within the periods (before and after decentralization) given.
9The respondents perception reveals while the percentage of good for indicators of number
1 to 4 in after have increased from 13.09 to 48.69, 15.71 to 51.3, 13.09 to 53.04 and 20.94
to 37.7 the percentage of votes for poor in after has reduced from 51.83 to 9.42, 40.84 to
8.3, 56.54 to 10.47 and 46.0 to 15.18 (for more details see Table 1).
Journal of Public Administration and Governance
ISSN 2161-7104
2018, Vol. 8, No. 2
http://jpag.macrothink.org 269
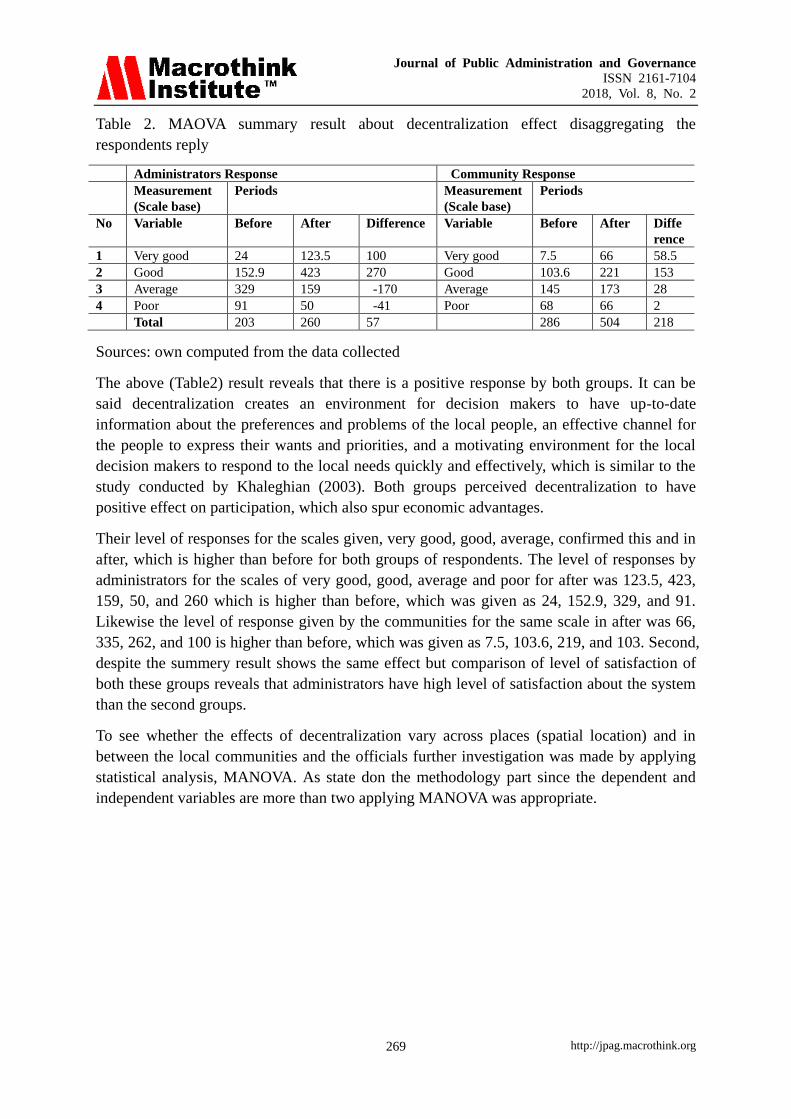
Table 2. MAOVA summary result about decentralization effect disaggregating the
respondents reply
Administrators Response Community Response
Measurement
(Scale base)
Periods Measurement
(Scale base)
Periods
No Variable Before After Difference Variable Before After Diffe
rence
1 Very good 24 123.5 100 Very good 7.5 66 58.5
2 Good 152.9 423 270 Good 103.6 221 153
3 Average 329 159 -170 Average 145 173 28
4 Poor 91 50 -41 Poor 68 66 2
Total 203 260 57 286 504 218
Sources: own computed from the data collected
The above (Table2) result reveals that there is a positive response by both groups. It can be
said decentralization creates an environment for decision makers to have up-to-date
information about the preferences and problems of the local people, an effective channel for
the people to express their wants and priorities, and a motivating environment for the local
decision makers to respond to the local needs quickly and effectively, which is similar to the
study conducted by Khaleghian (2003). Both groups perceived decentralization to have
positive effect on participation, which also spur economic advantages.
Their level of responses for the scales given, very good, good, average, confirmed this and in
after, which is higher than before for both groups of respondents. The level of responses by
administrators for the scales of very good, good, average and poor for after was 123.5, 423,
159, 50, and 260 which is higher than before, which was given as 24, 152.9, 329, and 91.
Likewise the level of response given by the communities for the same scale in after was 66,
335, 262, and 100 is higher than before, which was given as 7.5, 103.6, 219, and 103. Second,
despite the summery result shows the same effect but comparison of level of satisfaction of
both these groups reveals that administrators have high level of satisfaction about the system
than the second groups.
To see whether the effects of decentralization vary across places (spatial location) and in
between the local communities and the officials further investigation was made by applying
statistical analysis, MANOVA. As state don the methodology part since the dependent and
independent variables are more than two applying MANOVA was appropriate.

Journal of Public Administration and Governance
ISSN 2161-7104
2018, Vol. 8, No. 2
http://jpag.macrothink.org 270
Table 3. Decentralization Effect on Locals participation computed MANOVA
Manova y1 y2 y3 y4 y5 y6 l = code place code#place
Number of observations:191
W = Wilks' lambda L = Lawley-Hotelling trace
P = Pillai's trace R = Roy's largest root
Source/ Statistic df df F(df1, df2) = F
Source Statistic df F(df1) df2 F Prob>F
model W 0.5890 4 24.0 632.6 4.32 0.0000 a
P 0.4713 24.0 736.0 4.10 0.0000 a
L 0.5997 24.0 718.0 4.48 0.0000 a
R 0.3842 6.0 184.0 11.78 0.0000 u
Residuals 186
Code W 0.8428 1 6.0 181.0 5.62 0.0000 e
P 0.1572 6.0 181.0 5.62 0.0000 e
L 0.1865 6.0 181.0 5.62 0.0000 e
R 0.1865 6.0 181.0 5.62 0.0000a
Place W 0.6879 3 18.0 512.4 4.03 0.0000 a
P 0.3373 18.0 549.0 3.86 0.0000 a
L 0.4179 18.0 539.0 4.17 0.0000 a
R 0.3139 6.0 183.0 9.58 0.0000 u
Code#Place W 0.6890 1 18.0 512.4 5.62 0.0034 a
P 0.3713 18.0 549.0 5.62 0.0019 a
L 0.5997 18.0 539.0 5.62 0.0420 a
R 0.2842 6.0 183.0 5.62 0.0081u
Residual 185
Total 190
Sources: own computed from the data
The (Table3) above lists the number of observations used in the estimation. It also provides a
key indicating that W stands for Wilks‟ lambda, P stands for Pillai‟s trace, L stands for
Lawley–Hotelling trace, and R indicates Roy‟s largest root.
The first column of the table gives the source. Here we are testing decentralization effect (the
only term in the model), and we are using residual error for the denominator of the test. Four
lines of output are presented for decentralization, one line for each of the four multivariate
tests, as indicated by the W, P, L, and R in the second column of the table.
The next column gives the multivariate statistics, which is indicated by the corresponding
result of the letter W, P, L, and R. Some authors report and other use , given by
, for Roy‟s largest root but Stata uses .
The column labeled “df” gives the hypothesis degrees of freedom, the residual degrees of
freedom, and the total degrees of freedom. Within the given model, there are 5 degrees of
freedom, and 185 residual degrees of freedom, and 190 total degrees of freedom.
The next three columns are labeled “F(df1, df2) = F ”, and for each of the four multivariate
tests.

Journal of Public Administration and Governance
ISSN 2161-7104
2018, Vol. 8, No. 2
http://jpag.macrothink.org 271
The degrees of freedom and F statistic are listed. The following column gives the associated
p-values for the F-statistics. Since this is MANOVA two way, we consider the result of the
interaction of the terms. Result for the interaction of the variables indicates that Wilks‟
lambda has an F statistic of 5.62 with 18 and 512.4 degrees of freedom, which produces a
p-value small enough that 0.0034 is reported. The F-statistics and p-values for the other three
multivariate tests follow on the three lines after Wilks‟ lambda.
The final column indicates whether the F statistic is exactly F distributed, is approximately F
distributed, or is an upper bound. The letters e, a, and u indicate these three possibilities.
For this example, the F statistics for all the variables are approximate except the F statistic for
Roy‟s largest root, which is an upper bound, means that the p-value is a lower bound.
The variation in perception of repsondents about the questions used to assess impact of
decentralization was captured by the overall F test (over all three dependent variables). But in
these cases the researcher most interested in is a statistic called Wilks‟ lambda (λ), and the F
value associated with that. Lambda is a measure of the percent of variance in the DVs that is
„not explained‟ by differences in the level of the independent variable. Lambda varies
between 1 and zero, and it is expected to be near zero (e.g, no variance that is not explained
by the IV), but Lambda value indicates there is a variance.
From the result depicted in table3 MANOVA models with more than one term, shows test
results for the overall model is given by the interaction of the term code and place, followed
by results for each term in W, P, L &R. The interaction term, code#place is significant at the
0.001 level. Wilks‟ lambda for the interaction has an exact F that produces a p-value of
0.0034, confirms again the existence of variance about the impacts of decentralization. Even
though the satisfaction obtained by both respondents in all the study woredas seems positive
there is difference (variation) in their level of satisfaction, it varies from one wereda to the
other werda, from people to people.
This could be due to two important reasons. First, because of their position the administrators
might answer as if their highly satisfied. This seems rather speculative that the answer they
respond is biased considering the implication of this investigation. Second, the variation
observed in woredas (place) could be due to the economic performance (effect of ecology)
and access to infrastructural facilities like road and other networking. For decentralization
impact to be better or not it is mattered by skill of the implementers, the institutional system,
and the location. This was noticed by the weredas considered in this study were Wekero,
which is closer to Mekelle city and has access to different infrastructural facility has better
performed than Tanku-abergle.
3.2 Decentralization and Good Governance
The next part of the analysis focuses on effects of decentralization and good governance in
Tigray regional state.
Decentralization and governance are two of the political economy principles devised to
improve institutional administration and if it goes as designed it can improve livelihood of the
Journal of Public Administration and Governance
ISSN 2161-7104
2018, Vol. 8, No. 2
http://jpag.macrothink.org 272
locals. Decentralized system is enabling to the emergence of new form of local economy if
locals are main decision makers of the state economic, political, and social affairs. However,
in the region where this study is conducted it is questionable whether decentralization
enhanced full participation of locals in the economic, political, and social affairs, and helped
to the creation of accountable and responsible leaders that minimize corruption and nepotism.
The subsequent section of the paper tries to answer the question of: does decentralization
enhanced proper utilization of resources to the extent that the region (Tigrai) freed out of the
problems of centralized political and administrative strangle holds that perpetuated miss
utilization of public resources? Although statistics on corruption are questionable, and can not
be easily obtained, in the study woredas most informants blame the system saying after
decentralization administrators are becoming highly corrupted not only misusing of public
resource but becoming more accountable to some elites who are having money, or affiliation
to them. Some study sows how corruption accounts for a significant proportion of economic
activity.10 Almost in all the study wereda people complained about the dynamic shifts in
their ideologyof TPLF (Tigray People Libration Front), one of the party of EPRDF that
operates in the Nrothern part of Ethiopia called Tigray. They said TPLF before Derge was
people centered, and any thing that comes at the expense of the society was a taboo. However,
after they become government their ideology and believe is completely shifted, its more of
individualism now and people don‟t have any space any more as its used to be.
Corruption refers to exercise of official powers against public interest or the abuse of public
office for private gains. Governance is defined as the norms, traditions, and institutions by
which power and authority in a country are exercised (Shah, 2004). These norms, traditions,
and institutions include the institutions of participation and accountability in governance,
mechanisms of citizen voice and exit, and norms and networks of civic engagement.
To see effect of decentralization on good governance in Tigray this paper adopted some of the
institutional principles used in Shah. These concepts used to examine the link between
decentralization (mainly judged by the indicators) and governance, which is presented in
(Table4). Over all perception of the respondents related to governance was debatable, the
communities expressed their (qualitative analysis) dissatisfaction, some were still
appreciating it because their beneficiaries of the system. The difference in view has shown by
the results of the descriptive and statistical analysis (expressed in percentage change).
102004 World Bank study of the ramifications of corruption for service delivery concludes that
an improvement of one standard deviation in the International Country Risk Guide corruption
index leads to a 29 percent decrease in infant mortality rates, a 52 percent increase in
satisfaction among recipients of public health care, and a 30–60 percent increase in public
satisfaction.
Journal of Public Administration and Governance
ISSN 2161-7104
2018, Vol. 8, No. 2
http://jpag.macrothink.org 273
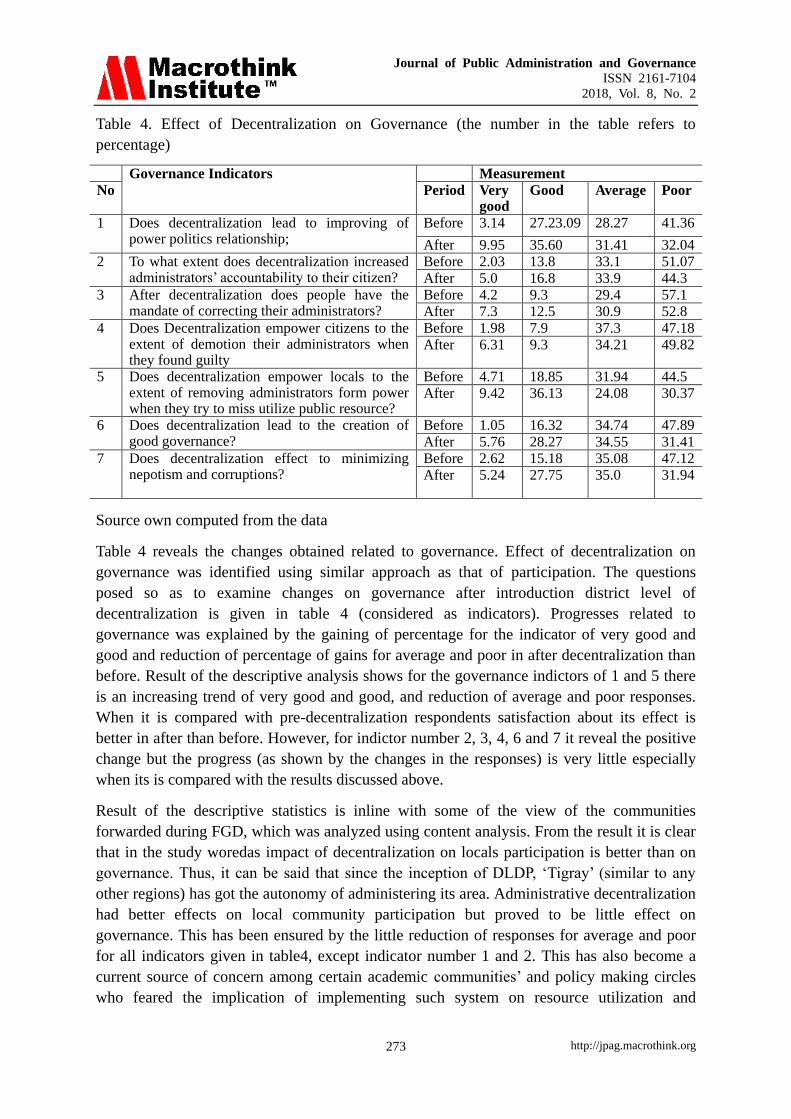
Table 4. Effect of Decentralization on Governance (the number in the table refers to
percentage)
Governance Indicators Measurement
No Period Very good
Good Average Poor
1 Does decentralization lead to improving of power politics relationship;
Before 3.14 27.23.09 28.27 41.36
After 9.95 35.60 31.41 32.04
2 To what extent does decentralization increased administrators‟ accountability to their citizen?
Before 2.03 13.8 33.1 51.07
After 5.0 16.8 33.9 44.3
3 After decentralization does people have the mandate of correcting their administrators?
Before 4.2 9.3 29.4 57.1
After 7.3 12.5 30.9 52.8
4 Does Decentralization empower citizens to the extent of demotion their administrators when they found guilty
Before 1.98 7.9 37.3 47.18
After 6.31 9.3 34.21 49.82
5 Does decentralization empower locals to the extent of removing administrators form power when they try to miss utilize public resource?
Before 4.71 18.85 31.94 44.5
After 9.42 36.13 24.08 30.37
6 Does decentralization lead to the creation of good governance?
Before 1.05 16.32 34.74 47.89
After 5.76 28.27 34.55 31.41
7 Does decentralization effect to minimizing nepotism and corruptions?
Before 2.62 15.18 35.08 47.12
After 5.24 27.75 35.0 31.94
Source own computed from the data
Table 4 reveals the changes obtained related to governance. Effect of decentralization on
governance was identified using similar approach as that of participation. The questions
posed so as to examine changes on governance after introduction district level of
decentralization is given in table 4 (considered as indicators). Progresses related to
governance was explained by the gaining of percentage for the indicator of very good and
good and reduction of percentage of gains for average and poor in after decentralization than
before. Result of the descriptive analysis shows for the governance indictors of 1 and 5 there
is an increasing trend of very good and good, and reduction of average and poor responses.
When it is compared with pre-decentralization respondents satisfaction about its effect is
better in after than before. However, for indictor number 2, 3, 4, 6 and 7 it reveal the positive
change but the progress (as shown by the changes in the responses) is very little especially
when its is compared with the results discussed above.
Result of the descriptive statistics is inline with some of the view of the communities
forwarded during FGD, which was analyzed using content analysis. From the result it is clear
that in the study woredas impact of decentralization on locals participation is better than on
governance. Thus, it can be said that since the inception of DLDP, „Tigray‟ (similar to any
other regions) has got the autonomy of administering its area. Administrative decentralization
had better effects on local community participation but proved to be little effect on
governance. This has been ensured by the little reduction of responses for average and poor
for all indicators given in table4, except indicator number 1 and 2. This has also become a
current source of concern among certain academic communities‟ and policy making circles
who feared the implication of implementing such system on resource utilization and

Journal of Public Administration and Governance
ISSN 2161-7104
2018, Vol. 8, No. 2
http://jpag.macrothink.org 274
improving accountability is not been as it is prescribed in the manuals prepared. Instead
localization has adversely affected the quality of public governance through an increase in the
incidence of miss utilization of resources which is effect of lack of accountability, poor
capacity and lack of technical skill, and absence of concerned citizen. In all the study
woredas administrators realize the limit in their capacity, and locals also acknowledge this
problem. There are individuals who claim its effect is less, this finding reflected during the
discussion made with the communities, which are sometimes named as the first group. But
there are also some from the interviewed (second group), praise decentralization program
stating: “it helped to avoid corruption, dependency, and grants power to communities to elect
and appoint their administrators.” To these who praised the system it seems that unlike the
past, local administrative units are becoming accountable, responsible, and committed after
decentralization. Their main justification was the incidence of community participation in
election, appointing of their leaders, the increasing number of women representatives in the
woreda council, and the expansion of service, which can help in one way or the other.
Contextually this expression is true because the political dynamism in the region shows the
appointing of leaders elected by people and the increasing of women‟s participation in the
woreda council but has several pitfalls on its procedure and at the same time it is less
effective in addressing the question of the community as the first group informants stated
repeatedly. Therefore, in this study the expression and perception of the first groups was
sounds more as there is a wider miss utilization and allocation of resource, which is believed
to be effect of increasing corruption.
Our critical argument supports the first groups who acknowledge the undergoing changes but
have wider reservations on the overall framework, system design and process, and manners
of implementation. They questioned the views forwarded by the second groups. These groups
critically commented the entire process of decentralization in tackling corruption. Further, by
drawing comparisons of governance before and after 2001, unlike the second group the first
group still argue far from enhancing service expansion, decentralization is actually curtailing
sustainable development because issues of corruption is becoming so complex. Based on the
content analysis made their criticism (first groups) was not on the rules (system) rather it is
on the technicalities of the implementation procedures as laws are miss interpreted, power
politics is miss utilized, no fair justice system, and courts and judges are biased.
Like wise he process of appointing (recruiting) civil servants as a staff in different bureaus
was critically criticized: Almost in all the study woredas citizens complained about the
process and said “ we have no clue on how one is appointed and other is fired. In most case
we often see people evaluated bad are empowered to higher offices, and others who are
accountable to the local needs are fired”. Similarly Access to information; they said important
information is accessible only to those who are very close to the decision makers”. To cite a
case, when there is job opportunity (vacancy), the job advertisement tends is open for a single
day or two when it is supposed to be open for a week or more working days. This is
intentionally made with the aim of offering the job to these who are very close or having
some relationship with the employers. Its intentionally made to cheat others, because when
they see that only one day is remain they may not be applied for a job believing that they

Journal of Public Administration and Governance
ISSN 2161-7104
2018, Vol. 8, No. 2
http://jpag.macrothink.org 275
already missed the requirements. However, the actual fact is not only because they don‟t
fulfill the requirement but unable to meet deadline. This and other issues were areas of
complied by the local people and they sound as if they have no hope about the system
(informants view obtained during FGD in Tankaabergele, Atsebi, and Keleteqwelaelo; August,
2011).
Moreover, there are complaints on the delivery or disbursement of safety net program, as
observed in two study woreda (Atsebi and Tanka‟abergele); communities indicated how
benefits provided by the public as a means of social insurance are hijacked or
misappropriated. Issues related to purchase of materials through bidding was also another
point highly criticized by both, communities and administrators. Related to this, the wereda
administrator(s) stated11 that purchasing of office equipments and other office materials has
become more complex and centralized. Due to such hectic procedures, often dominated by
the regional executives the weredas could not utilize their annual budgets fully. Due to this
returning unused wereda budgets or rushing to purchase goods at the end of the budget year
is a common practice, leading to an increasing of wastage of public resources. In this regard,
decentralization seems reversing the progresses, unless solved may increased fragmentation
of political arenas. The increasing complexity of decentralized programs may raise the
potential of improved delivery but it also increases the chances for misallocation of funds at
different nodes of the system (Dethier, 2000).
Likewise, communities perception on evaluation (locally called gemgam) is controversial. It
was surprising; almost all communities in all wereda’s appreciated the pre 2001 evaluation
system when TPLF was guerilla fighters. They said that in pre 2001 evaluation tradition was
very critical and extremely effective to address the prevalent limitations related to resource
miss utilization and misallocation, bad performance, and other corrections related to
administration and miss-implementations. But now a day‟s this traditional evaluation
(gimgema) is there only to pretend as if there is evaluation but is extremely lose and is for the
sake of formalities followed by unexpected repercussions, their (informant) expression goes
as follows:
“based on the experiences we have from the weyane system12 and believing that evaluation
will bring change we often evaluate and discuss any problems, evaluating the concerned
officials but it had hardly any effect on correcting previous pit falls; it remains heard but not
implemented. In return, either the person who evaluated or the relatives might face the cost
(harassed, marginalized from all necessary benefits and tortured). All such acts made us to
not evaluate the incumbents(Informants view; 2009, and August, 2011).
Following the above analysis further check were made disaggregating respondents based on
their responsibilities (administrators and normal citizens), their dis/satisfaction was evaluated
11View of woreda administrators (2009)
12A system of the Tigrian People Libration Front, one of the current political parties
(EPRDF government) who informally administered the rural Tigray from1974 to 1991. The
late administration was highly appreciated by the local people in all the woredas.

Journal of Public Administration and Governance
ISSN 2161-7104
2018, Vol. 8, No. 2
http://jpag.macrothink.org 276
based on the answers given to the stated indicators and are given in table5. The number are
the total counts used to identify the variations in between these two groups (first and second
group).
Table 5. Summery result of the descriptive statistics related to governance disaggregating
respondents.
Response from Administrators Response from Community
No Variable Before After Difference Variable Before After Difference
1 Very good 26 120 94 Very good 19.6 25 181.9
2 Good 138 364 226 Good 153.1 181.9 318
3 Average 470.5 258 -211 Average 145.5 413.8 115.2
4 Poor before 476 141 335 Poor 636 465.4 -171
Sources: own computed
The change was observed based on the level of satisfaction of the respondents in after than
before ; computed by the number of votes for all the question of indicators (question 1 up to 7
stated above) of governance. The procedure used was estimating the number of counts or
scores for all responses (v good, good, average and poor) by each category (community and
administrator). After the counts a comparison was made, estimating the rate of changes
(percentage of gains after) which also shows the level of satisfaction by these two categories.
This enabled us to see the effect of decentralization on governance using similar approach as
applied above. Based on the result given (Table5) we observed change but considering the
responses of the communities we have noticed that their dissatisfaction outweighs.
Administrators‟ response of having highest score differences of very good and good and
lowest score differences of average and poor in after. But statistical results of communities‟
responses show highest score of average followed by poor. This indicates that the governance
reform agenda could be strong, but its success will largely depend on the adequacy of
implementation capacity, political commitment, and incentives of the different actors. Despite
the general logic that both categories acknowledge the challenges of DLDP their perception
related to its intensity is not the same. Administrators‟ response seems their satisfied about
decentralization effect on governance outcome is obvious, which could be effect of different
reason. First, the act of miss use or miss allocation of resource tends to be either by all or part,
which make them gainers of the process, or not able to recognize its actual effect as they are
the owners of the process implementation, and/or pretending about its effect feeling the
consequences.
Findings presented in Table5 confirmes the achievements of decentralization on governance;
but perceptions from interviewed individual‟s still differ considerably. To examine the
variations among respondents and in between the study woredas, we applied multivariate
analysis of variance (MANOVA) and results have been discussed below (table6).

Journal of Public Administration and Governance
ISSN 2161-7104
2018, Vol. 8, No. 2
http://jpag.macrothink.org 277
Table 6. MANOVA Statistical Result of Good Governance
manova y1 y2 = place
code
Number of observations:191
W = Wilks' lambda L = Lawley-Hotelling trace
P = Pillai's trace R = Roy's largest root
Source/ Statistic df df F(df1, df2) = F
Source Statistic df F(df1 df2 F Prob>F
model W 0.8097 4 8.0 370.6 5.15 0.0000 e
P 0.1944 8 372.0 5.01 0.0000 a
L 0.2300 8 368.0 5.29 0.0000 a
R 0.2054 4 186.0 9.55 0.0000 u
Residuals 186
Code W 0.9197 1 2.0 185.0 13.59 0.0000 e
P 0.0807 2.0 185.0 13.59 0.0000 e
L 0.1469 2.0 185.0 13.59 0.0000 e
R 0.1469 2.0 185.0 13.59 0.0000e
Place W 0.9197 3 6.0 370.04 2.63 0.0163 e
P 0.0807 6.0 372.0 2.61 0.0173 a
L 0.0868 6.0 368.0 2.66 0.0154 a
R 0.0807 3.0 186.0 5.01 0.0023 u
Residual 186
Total 190
Source own computed using Stata
The letter given refers to, e = exact, a = approximate, u = upper bound on F
Unfortunately, the MANOVA used to examine decentralization effect on governance could
not generate answer for the interaction variable, code#place . Result reveals all four
multivariate tests reject the null hypothesis, indicating some kind of difference between the
four-dimensional mean vectors of the model given by the level of „Landa ‟ value, Wilks‟
lambda, which is exactly significant for both independent variables.
This explains how the communities‟ perception is different from these of administrators and
at the same time views obtained from each wereda respondents regarding governance is not
identical. Related to code, Landa variance might have been caused because of the differences
in perception, which was noticed by the views forwarded by communities and administrators
that are completely different and are having different level of satisfaction.
In our study issues pertained to governance tends to be better in the woredas that are with less
resource than in the other, no resource followed by no miss-use or miss-allocate. This finding
is the same as Nupia (2006) and Juan C. (2001). Both, these studies showed how the
existence of relative poor and rich with a weak accountability sector in developing countries
is a factor that affected decentralization to don‟t work appropriately. Even in the four study
woredas13 there is progresses but advancement is said to be mixed with regard to citizens‟
empowerment and the strengthening of local governance as indicated by the MANOVA result
above table.
13Atsebi, Wekero, Hagereselam, and Tankaabergele

Journal of Public Administration and Governance
ISSN 2161-7104
2018, Vol. 8, No. 2
http://jpag.macrothink.org 278
3.3 Region to Woreda Resource Transfer: Local Revenue and Expenditure Mixes July 14
District Level of Decentralization Program was expected to improve the resource allocation
practices in the small administrative region (woreda), and improving of locals‟ participation
in development. It was an institutional system introduced to narrow the vertical and
horizontal imbalances. This is supposed to be reflected by the increasing of revenue of each
woreda, (collected in the form of tax). Consequently, peripheries (small administrative units)
were expected to increase their efficiency, productivity, and wellbeing as a result of
increasing resources. This study tired to look at the revenue and expenditure mixes of the
study woredas, sort of assessing how decentralization helped to rise revenue after fiscal
decentralization (DLDP) launched presuming the above analogy would practically occurred
The concept of „periphery‟ in this paper denotes „space‟, used to discuss about woreda
development budget, which represents the core element of local government financial
management system. Because there is a direct relationship between revenue and development,
woredas can implement more development programs provided if they have resources
(revenue). Local government plan, implement, and evaluate local development policies
through the budget (Gianakis and McCue, 1999). It is the principal instrument by which
government translates into action the policies and programs set out in its development plans,
and it plays a pivotal role in the financial management of the economy (Melesse, 2003). This
underlines the necessity of public sector intervention to attain fair distribution of resources
(distribution function), and maintaining stable prices (stabilization). This is an ideology in
line with the conventional literature of fiscal federalism conceded by Richard Musgrave
(1959).
If a nation is following decentralization system in the process of achieving development, sub
national governments are expected to play a dominant role as they are expected to have
access to better information about the local circumstances. In Ethiopia, regions transfer
subsidies to peripheries to enable the latter to effectively undertake their development
activities properly, which are mainly done on the basis of formula (which is already revised
now) similar to the core principle of the federal government. This formula constitutes
population (55%), development level (30%), and own revenue (15%). The budget allocations
follow both budget formula and expenditure and are used to implement the instrument of
block grant. Nevertheless there are also other transfers from region to woredas which are not
part of the grant transfer system. These includes consolidate budget adjustment, contingency
assistance, training support, selected cash transfer for capital and operating purposes, food
security and food aid, asset transfer, etc. This describes how the budget formula is too
fragmented and less responsive to reduction of inequality. The access and opportunities
existed in that area could also be a fact for economic gaps to prevail, some woredas might
have the opportunity of having high budget than the other, which comes straight as budget
support made by NGOs.
Revenue source of small administrative is from both, external (obtained from the federal, or
donors), and internal (income collected in the form of tax). Resources obtained in both forms
varies from place to place and is related to the links with donors and each woreda’s

Journal of Public Administration and Governance
ISSN 2161-7104
2018, Vol. 8, No. 2
http://jpag.macrothink.org 279
agriculture or other economic activities, which includes income tax, business tax, rental tax,
sales tax, agricultural land use charges, and rural land utilization charges. However,
considering the internal resource in the study woredas agricultural tax is the main source of
internal revenue, which contributes close to 80% of the rural woreda revenue. From what is
discussed the researchers noticed that in either of the cases (using internal, or external)
decentralization is not offsetting inequalities between rich and poor areas. The only difference
noticed was local authorities in rich weredas and with better facilities (like
wekero/Keleteawelelo) has the competitive advantage, and can mobilize substantial resources
to attract relatively qualified labor and to deliver high quality and efficient services compared
to poor weredas (like Tankuabergele). The other factors which disallowed decentralization to
work appropriately in developing countries in general and in the study woredas in particular
is the existence of relative poor and rich regions with a weak accountability sector, and the
high between jurisdiction income inequality, which intensify the use of transfers in order to
finance the poorest regions (Oskar, 2006). Moreover, the existed opportunities; access to
services, and skilled manpower also contributes to the increasing of development variations
among these woredas.
Because of all these there are horizontal imbalances; all the study woredas are neither in the
state of rising high revenue nor the prevalent condition to let them to do so, which led to the
huge gap between revenue and spending. Moreover, the existed opportunities; access to
services and skilled manpower also contributes to the increasing of development variations
among these woredas. Similar to other countries experiences, small administrative units have
very little room to maneuver in terms of the link between sources of revenue and expenditure
allocations B. Elhiraika (2007). This is one of the reasons for the poor woredas to be less
responsive and less accountable to the preferences of the local people. For instance of the
study woredas compared to kileteawelaelo in Tankuabergele, administrators were
complaining about resource shortage (both, revenue collected and budget received from
region ) and communities were also less satisfied.
This implies all the study woredas don‟t have equal access and potential, which accounts for
the relative differences in resource availability and implementation capacity. Even though all
the four study woredas were complaining about budget these who are far from the main road,
like Tankaabergle felt worse. This Peri-urban woreda (like Kilteawelaelo) is better off in
rising revenue, and at the same time their reliance on regional subsidy is lesser than the
remote woredas (Tankuaabergele). In line with this, the woreda officials (key informants) of
Tankuaabergele showed reservations about their woreda’s performance and their reason for
lower revenue, their main justification hinges on the potential of the woreda to attract
donors/investors and budget formula.
One of the main concern the researchers noticed was the budget formula which are used as a
means of equalization program and its allocation are no longer tied to fiscal disparities among
provinces. Even the woredas are not contented with the current resource allocation system
because the resource transfer system is extremely fragmented and might affect the
performance of woredas. This pinpoints on the limitation of having a system that combines
the non-block grants to the block grant so as to increase accountability, efficient utilization of

Journal of Public Administration and Governance
ISSN 2161-7104
2018, Vol. 8, No. 2
http://jpag.macrothink.org 280
public resources and reducing of horizontal imbalances. In addition, the financial capacity of
the woredas is too weak and local administrators were given many responsibilities that
overlap each other and are with out sufficient amount of budget. This has led to a huge gap
and for better understanding see the diagram below and indicates instances of the imbalances,
considering two of the study woredas (Kilteawelelo and Atsebi).
Figure 1. TRK & TEK refers to total revenue and total expenditure of Kelteawelaelo, TRA &
TEA refers to total revenue and total expenditure of Atsebi.
The above figure (Fig1) used to explain the instance of revenue expenditure gap of some of
the study woredas. It was limited only to these two because in other of the study woredas
there is no enough data. The gap in between these two woredas still indicates the horizontal
imbalances, which could also be used as an example why woreda inequality to remain
visible.
This is similar to the views given by the woreda official about the resource availability, and
resource gap, and verifies how horizontal imbalance is affecting woredas performances. In
both woredas the total expenditure is higher than the total amount of revenue collected, and
the gap is very large. Apparently, decentralization managed to increase community
participation in development, and community communication for development. However, its
effects on maintaining of equality (reducing difference in between the woredas), its response
in narrowing horizontal imbalances is still far behind. As a result, it is not surprising that
DLDP, the equalization program (budget formula) has been subject to constant criticism and
demands for change over the years. Fiscal disparities between the provinces will widen,
placing even greater pressures on their ability to deliver adequate public services. This effect
of poor technical capacity, led to the increasing of dependantistas , which hindered woredas
to don‟t be independent decision makers, woreda pushes sub-national governments to seek
more subsidy and grants from the central government (Meheret, 2007). These institutional
shortcomings, in turn, hindered the effectiveness and responsiveness of the state in public
service delivery. In spite of the appreciation of their newly gained autonomy, there is a
Journal of Public Administration and Governance
ISSN 2161-7104
2018, Vol. 8, No. 2
http://jpag.macrothink.org 281
general recognition that woredas still depend (e.g. personnel deployment, guidelines, training,
etc) much on the region. In addition we have noticed the lose cooperation between region and
woredas. Neither Woredas have the required skill to design, plan, and implementation and nor
region did have strong supervision that can help to solve the technical (skill) related problem
of these woredas. Issues pertinent to region supervision to the small woredas are becoming
worse after introduction of fiscal decentralization than before. All study woredas appreciated
the technical support they had from the region in pre-fiscal decentralization period and are
still demanding to resume these supports even now. Otherwise these paucities are hindering
woredas not to realize their development objectives, which in turn may still affect their
socio-economic performances.
4. Conclusion and Recommendation
This study focused on examine the impacts of decentralization on rural development
considering some of the rural woredas of Tigrai; Kaelteawelaelo, Atsebi, Hageresealm, and
Tankuabergele.
In the rural part of Tigrai decentralization was launched in the 1980s, during the Derg era. By
then, the rural areas were not fully governed by the Derg system. The EPRDF, then called
guerrilla fighters, who had asserted full power on the people on matters of political and
administrative decisions albeit their system was not institutionalized (informal) but had
governed all rural areas and some small towns. This helped when the current government
(EPRDF) became a ruling party of the Ethiopian state to echo on decentralization and
advantage of introducing a system gives power to the people and encourages people
participation in development. Due to this the Ethiopian government launched various
economic reform programs since 1992/93 and decentralization is one of them.
Decentralization was expected to bring about tremendous changes that contribute to the
growth of the economy by transforming the institutional system, and was expected to enhance
individuals‟ participation in economic, political and social affairs, and improving of the
governance system.
This study was conducted to see the effect of this system. Findings shows decentralization led
to improvements in participation, and governance, which in turn led to increasing of
economic efficiency. However, its relative effects are higher in terms of enhancing public
participation than improving governance, narrowing revenue expenditure gaps, and
horizontal imbalances. In addition this study found that effect of fiscal decentralization to be
higher in improving locals participation on political and development matters than on
governance.
When decentralization is evaluated on the basis of resource (budget) obtained, it is possible to
say that the essence of centralization still exists. Because Tegray region gets its main resource
(revenue) block grant and subsidy form the federal state and in turn the region also extends
the same resources to the weredas in the real spirit of decentralization. This indicates that
since all development activities of small administrative units is depending on the resource
they obtain then their full independent remains questionable. Of all the remarkable changes
researchers observed how woreda participation in implementing of regional planning and

Journal of Public Administration and Governance
ISSN 2161-7104
2018, Vol. 8, No. 2
http://jpag.macrothink.org 282
community based development activities, their mandate of coordinating community based
development activities (CBO)) and in deciding community contributions to development
became better after decentralization.
However, many stakeholders, especially woreda officials and elected representatives feel that
more support is needed (including repeated short and long term training). They deem that
lack of skill and technical application is making them to be less responsive to the calls
(development related) made by the region. This view is similar to Poverty Participatory
Assessment 2005 (MOFED 2005 (a)).
Another important issue noticed was the trade off in the implementation of institutional
system, differences between decentralization and Business Process Reengineering (BPR).
BPR is a system that involves the head (leader) works in a team and has to pull his type
(teaming) but the community might not be in favor of that person. This contradicts with the
principle of decentralization, it is always difficult to coordinate team making, and respecting
individuals‟ choices. When the community have different choice than that person it may led
to unexpected results that affect the institutional stability and other developments. Related to
this most informants said when BPR came as a tool to some extent the political
decentralization is violated because BPR is team making that implies we are not administered
by the person whom we chosen.
Decentralization never offset the problem of unfair Resource (budget) transfer and allocation,
and is one of the core emphasis in all woredas studied. This reveals decentralization never
offset the problem of resource allocation and inequality in between the small administrative
regions. For instance, the better woredas like the better Regions (Eg: Southern Region),
which has locational advantage have an opportunity in attracting more donors which led to
better budget endowments than the others. Therefore, the structural imbalances in geographic,
material, socio-economic and natural situation of the woredas has to be balanced by making
certain adjustments in such a way that solves inequalities.
Finally, the issue of governance requires major change and wider attention. This can come up
as a result of appointing accountable individuals and creating concerned citizens thorough
time. But strong supervision by the regions, and conducting of quarterly, or semiannual
monitoring and evaluation would also help to understand and know the nature and character
of the administrators in the small administrative unit that make easier to take corrections.
Over all, even though the achievements made so far are quite encouraging, the fruits of
decentralization are yet to be reaped overcoming some of the current limitations singled out
in each study woreda, which included miss implementation of institutional laws, shortage of
resource (budget), poor technical capacity and information asymmetry, and clarity about the
decentralization. From the discussion and reviews we have noticed that this institutional
system and its essence is sometimes miss interpreted and miss understood, practically its
effect on the administration is more of centralization despite the name decentralization exists.

Journal of Public Administration and Governance
ISSN 2161-7104
2018, Vol. 8, No. 2
http://jpag.macrothink.org 283
References
Abay, A., Frohberg, K., James, K. S., & Jütting, J. (2004). Modeling the Impact of Fiscal
Decentralization on Health Outcomes: Empirical Evidence from India. ZEF Discussion
Papers on Development Policy, Bonn.
African Development Bank, and African Development Fund. (2009). Federal Democratic
Republic of Ethiopia Country Governance Profile, Report.
Bardhan, P., & Udry, C. (1999). Development Microeconomics, Oxford University Press.
ISBN 0-19-877370-6. https://doi.org/10.1093/0198773714.001.0001
BoFED. (2006). Bureau of finance and economic development. GIS department. Mekelle
(unpublished).
Bureau of Planning and Economic development. (1995). Five Year Development Plan of the
Tigray Region. Mekelle, Ethiopia (Draft compiled by the Region).
Chatfield, C. (1995). Model Uncertainty, Data Mining and Statistical Inference. JRSS-A 158,
419–466. https://doi.org/10.2307/2983440
Dethier, J. (ed.) (2000). Governance, Decentralization and Reform in China, India and
Russia. Kluwer Academic Publishers and ZEF.
DLDP Review, PPA, CIDA cited in Dom and Mussa. (2006). Review of Implementation of the
Decentralization Policy: A Sample Survey in Four Sentinel Woredas of Tigray Region.
Dom, C., & Mussa, M. (2006a). Review of Implementation of the Decentralization Policy: A
Sample Survey in Four Sentinel Weredas of Tigray Region. Report for the Embassy of Ireland
and Regional Government of Tigray. Oxford, UK.
Elhiraika, A. B. (2007). Fiscal Decentralization and Public Service Delivery in South Africa.
Canada Fund for Africa.
Faraway, J. J. (2002). Practical Regression and Anova using R. Manuscript.
Getachew, M., & Fraser, T. (2001). Decentralization and Local Autonomy: Regional planning
in Ethiopia cited in a Book New Regional Development Paradigms-Volume 3, by B. Stohr, W.
et al. (Ed.), Greenwood Press, London.
Hertogs, E. J. (1999). What Role for Local Authority in Decentralized Cooperation Under
Convention of Lome. ECDPM Discussion Paper No. 8 cited in Tewodros, B.2005.
Juan, C. M. (2001). Analysis of Public Decentralization in Spain. Journal of Public Finance
and Management, 1(4), 500-556.
Khaleghian, P. (2003). Decentralization and Public Services: The Case of Immunization.
World Bank Policy Research Working Paper, No. 2989, World Bank, Washington, D.C.
https://doi.org/10.1596/1813-9450-2989

Journal of Public Administration and Governance
ISSN 2161-7104
2018, Vol. 8, No. 2
http://jpag.macrothink.org 284
Local Development International. (2013). The Role of Decentralization/Devolutionin
Improving Development Outcomes at the Local Level: Review of the Literature and Selected
Cases, UK Department for International Development South Asia Research Hub, Brooklyn,
New York. USA.
Martinez, V. J. (2011). Impact of Fiscal Decentralization, Issues in Theory and Challenges in
Practices. ADB Publication.
Meheret, A. (2007). A Rapid Assessment of Woreda Decentralization in Ethiopia„. Forum for
Social Studies, Addis Ababa.
Melese, D. (2003). Urban Financial Management, Module 3 for MDP Training Program, 5th
Urban and City Management Course for Africa,
http;//info.worldbank.org/etools/docs/Liberary/114925/eum/docs/eum/ehiopiaeum/Module3
Urban Financial Management.
MOFED. (2005). Ethiopia Participatory Poverty Assessment 2004-05, Addis Ababa, Ethiopia.
MOFED. (2010). Trends and Prospects for Meeting MDG by 2015. 2010 MDG Report,
Addis Ababa, Ethiopia.
MOFED. (2012). Ethiopia’s Progress Towards Eradicating Poverty: an Interim Report on
Poverty Analysis Study (2010/11). Addis Ababa, Ethiopia.
Nadeem, S. B., N., Qaiser, M., & Kamal, S. (2008). MANOVA with Summary Statistics: A
STATA Program. College of Statistical and Actuarial Sciences, University of the Punjab,
Lahore.
Ndegwa, S. (2002). Decentralization in Africa; A Stocktaking Survey Africa Region. Working
Paper Series No.40, World Bank Washington.
Nupia, O. (2007). Decentralization, Corruption, and Political Accountability in Developing
Countries, Universitat Pompeu Fabra.
Oskar, N. (2006). Decentralization, Corruption and Political Accountability in Developing
Countries, Working paper.
Shah, A. (2006). Corruption and Decentralized Public Governance, World Bank Publication.
https://doi.org/10.1596/1813-9450-3824
Shah, A., Thompsont., & Zou, H. (2002). The Impact of Decentralization on Service Delivery,
Corruption, Fiscal Management and Growth in Developing and Emerging Market Economies:
A Synthesis of Imperial Evidence. CES ifo DICE Report.
Smith, S. C. (2005). Ending Global Poverty. Palgrave Macmillan, New York.
Spielman, D. J., Cohen, M. J., & Tewodaj, M. (2006). Mobilizing Rural Institutions for
Sustainable Livelihoods and Equitable Development: A Case Study of Local Governance And
Smallholder Cooperatives in Ethiopia, IFPRI, Addis Ababa, Ethiopia, working paper.
Journal of Public Administration and Governance
ISSN 2161-7104
2018, Vol. 8, No. 2
http://jpag.macrothink.org 285
Steinich, M. (2002). Monitoring and Evaluating Support to Decentralization, Challenges and
Dilemmas. A Seminar Paper on ― European Support for Democratic Decentralization and
Municipal Development- A Contribution to Local Development and Poverty
Reeducation, ―held in Maastricht, 14-15 organized by ECDPM and Swedish Ministry of
Foreign Affairs.
Stöhr, W. B., Edralin, J. S., & Mani, D. (eds.) (2001). New Regional Development Paradigms.
Vol. 3, Greenwood Press, London, pp. 21-35.
Tanzi, V. (1995). Fiscal Federalism and Decentralization: A Review of Some Efficiency and
Macro Economic Aspects’, in Bruno, M. and Pleskovic, B. (eds.): Annual World Bank
Conference on Development Economics, Washington D.C, World Bank.
Tegenge, G., & Kassahun, B. (2007). The Role of Decentralization Governance in Building
Local Institutions, Diffusing Ethnic Conflicts, and Alleviating Poverty in Ethiopia. Regional
Development Dialogue, 25(1).
Tesfay, T. (2006). Decentralization and Service Delivery in Ethiopia; (A Case of
Moretenna-Girr and Bereh Aletu Woredas in Amhara and Oromia Regions Respectively). MA
Thesis , RLDs/AAU, Addis Ababa.
Tewdros, B. (2005). Decentralization Development Cooperation, Governance and Rural
Livelihood: The case of Amhara region. Ethiopia in Issues and Challenges in Local and
Regional Development, Tegegne g., and Pitter Van Dijk, P. 2005 (Edi.).
Turner, M., & David, H. (1997). Governance, Administration and Development; Making the
State Work, New York, Palgrave. https://doi.org/10.1007/978-1-349-25675-4
UNCDF. (2003). Decentralization and Local Governance From the Perspective of Poverty
Reduction. Human Rights, Humanitarian Aid and Peace Building Department, Good
Governance and Peace Building Division (DMV/VG).
World Bank. (2003). Making Services Work for Poor People. World Bank and Oxford
University Press, Washington, D.C.
Yigremew, A., Nega, W., & Haregewoin, C. (2005), study on implementation of
Decentralization Policy in Ethiopia Oxfam GB Ethiopia Publications.
Yon, B. J., & Grote, U. (2001). Does Decentralization Serve the Poor? In: IMF, Fiscal.
Chatfield, C. (1995). Model Uncertainty, Data Mining and Statistical Inference. JRSS-A 158,
419–466.
Copyright Disclaimer
Copyright for this article is retained by the author(s), with first publication rights granted to
the journal.
This is an open-access article distributed under the terms and conditions of the Creative
Commons Attribution license (http://creativecommons.org/licenses/by/4.0/).